
Impact of Rye Malt with Various Diastatic Activity on Wholegrain Rye Flour Rheology and Sugar Formation in Scalding and Fermentation Processes


 , ,
, , 
Abstract
1. Introduction
2. Materials and Methods
2.1. Materials
2.2. Determination of α-Amylase and β-Amylase Activity of Rye Flour, Malt and Flour–Malt Samples
2.3. Falling Number Determination of Rye Flour and Flour–Malt Samples
2.4. Analysis of Rye Flour, Malt and Flour–Malt Rheological Properties Using an Amylograph
2.5. Analysis of Rye Flour, Malt and Flour–Malt Rheological Properties Using Mixolab
2.6. Scald Preparation and Fermentation
- 1.
- Scalding and Saccharification: RF2 flour and malt with various DP (DP—170, 261, 408 °WK) at concentrations of 0.5%, 1.0%, 1.5% were used (Table 3). A mixture of rye flour and malt was scalded with water at 96 °C and mixed for 15 min at 300 rpm (speed 2) using a Teddy mixer (A/S Varimixer, Brøndby, Denmark). Post-mixing, the dough equilibrates to a temperature of 75 °C. Controlled cooling follows, with a gradual decrease in the temperature from 75 °C to 55 °C in the climate chamber Memmert ICH 110 (Memmert GmbH, Schwabach, Germany). This thermal regimen was optimized for the activity of α-amylase and β-amylase, ensuring the development of a fermentable substrate for the fermentation stage. The scald sample was taken for lyophilization.
- 2.
- Fermentation: At a maintained temperature of 55 °C, 22 g of fermented scald (obtained from bakery “Kelmeni”), containing Lactobacillus delbrueckii as indicated by the manufacturer, was introduced to the scald after saccharification. The temperature was progressively reduced to 28 °C, over 20 h. This step is crucial for the metabolic activities associated with the fermentation process. Upon completion of fermentation, a sample of the fermented scald was lyophilized for further analysis.
2.7. Determination of pH and TTA in Fermented Scald
2.8. Sample Preparation for Sugar Profile Analysis
2.9. Sugar Profile Evaluation in Scald after Saccharification and Fermentation
2.9.1. Sample Preparation for Carbohydrate Analysis
2.9.2. Analytical Conditions of HPLC-RID for Quantitative Analysis of Carbohydrates
2.10. Statistical Analysis
3. Results and Discussion
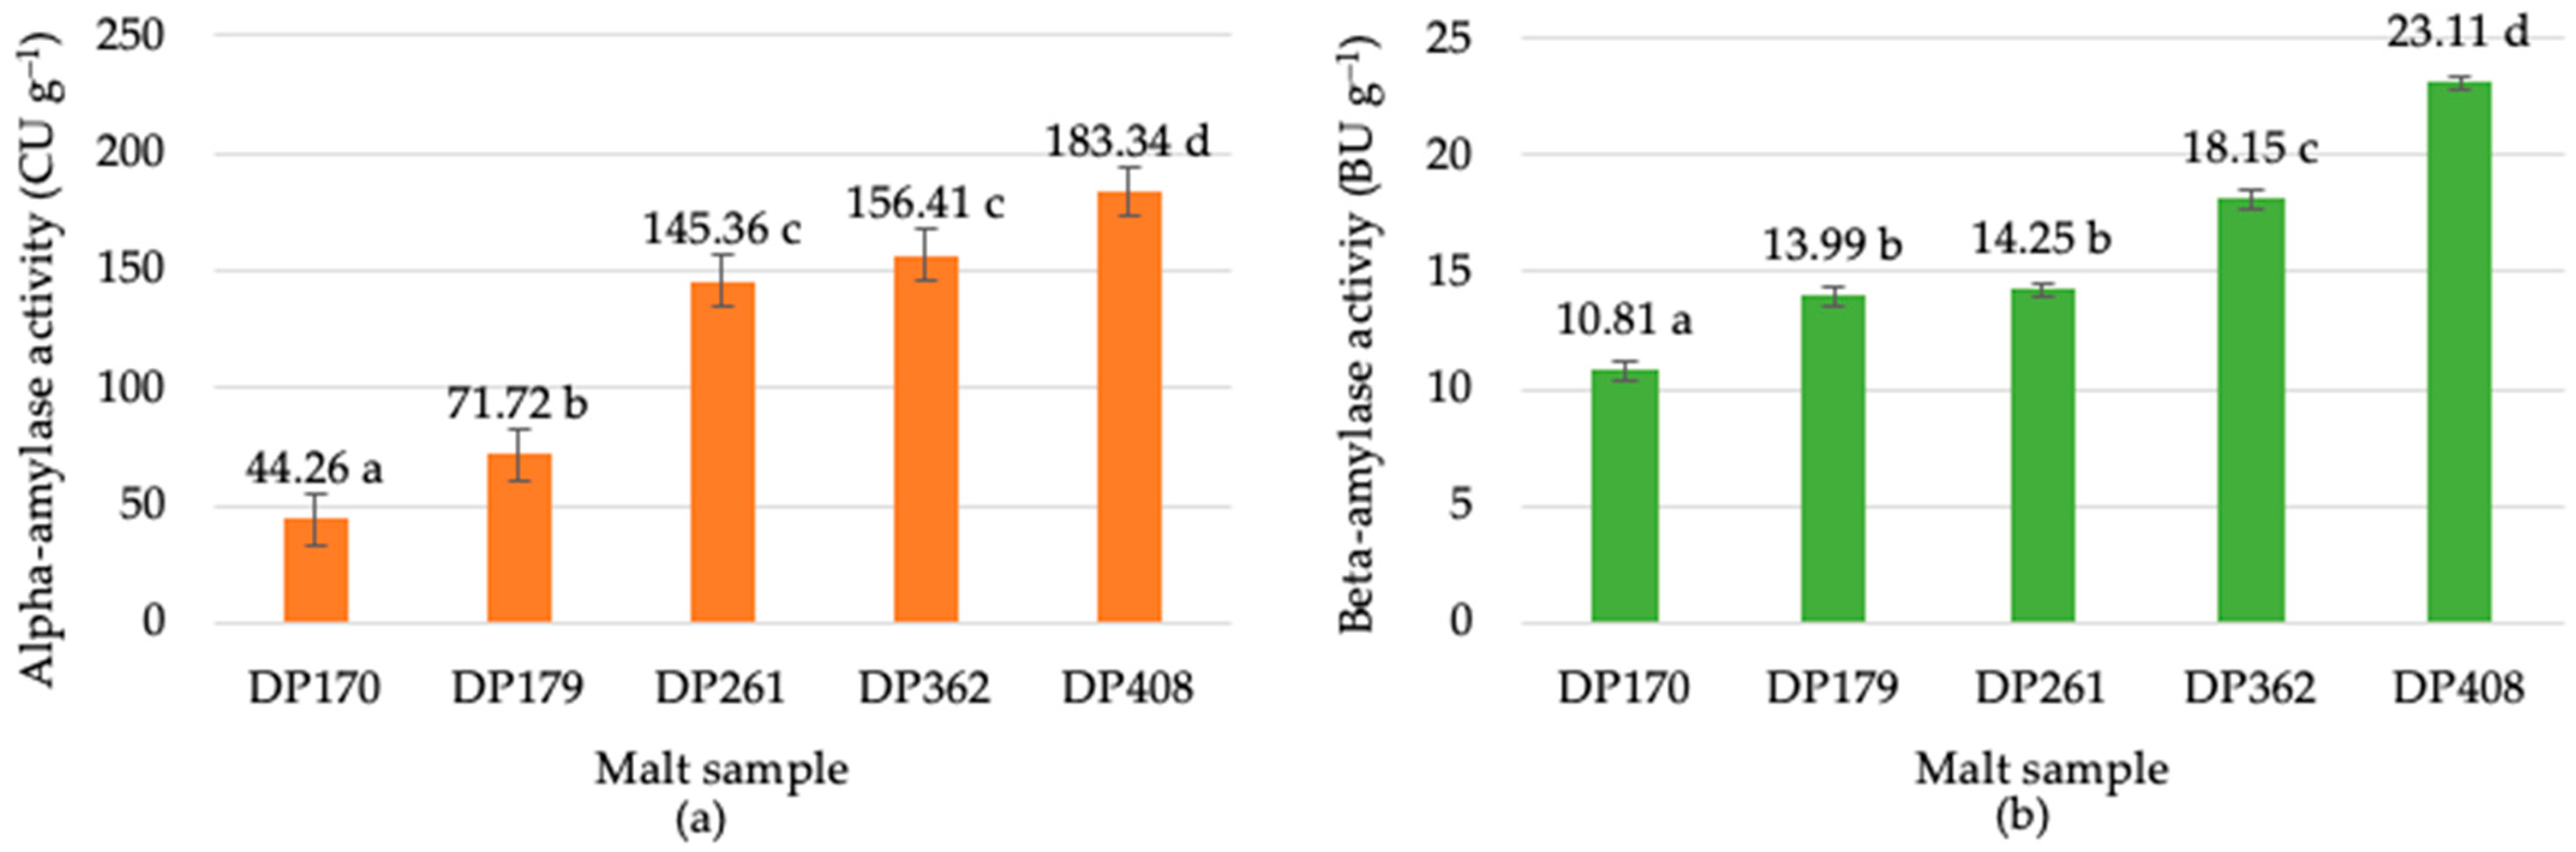
3.1. Evaluation of Malt Diastatic Activity
3.2. Effect of Malt Diastatic Power on the Rheological Properties of Rye Flour
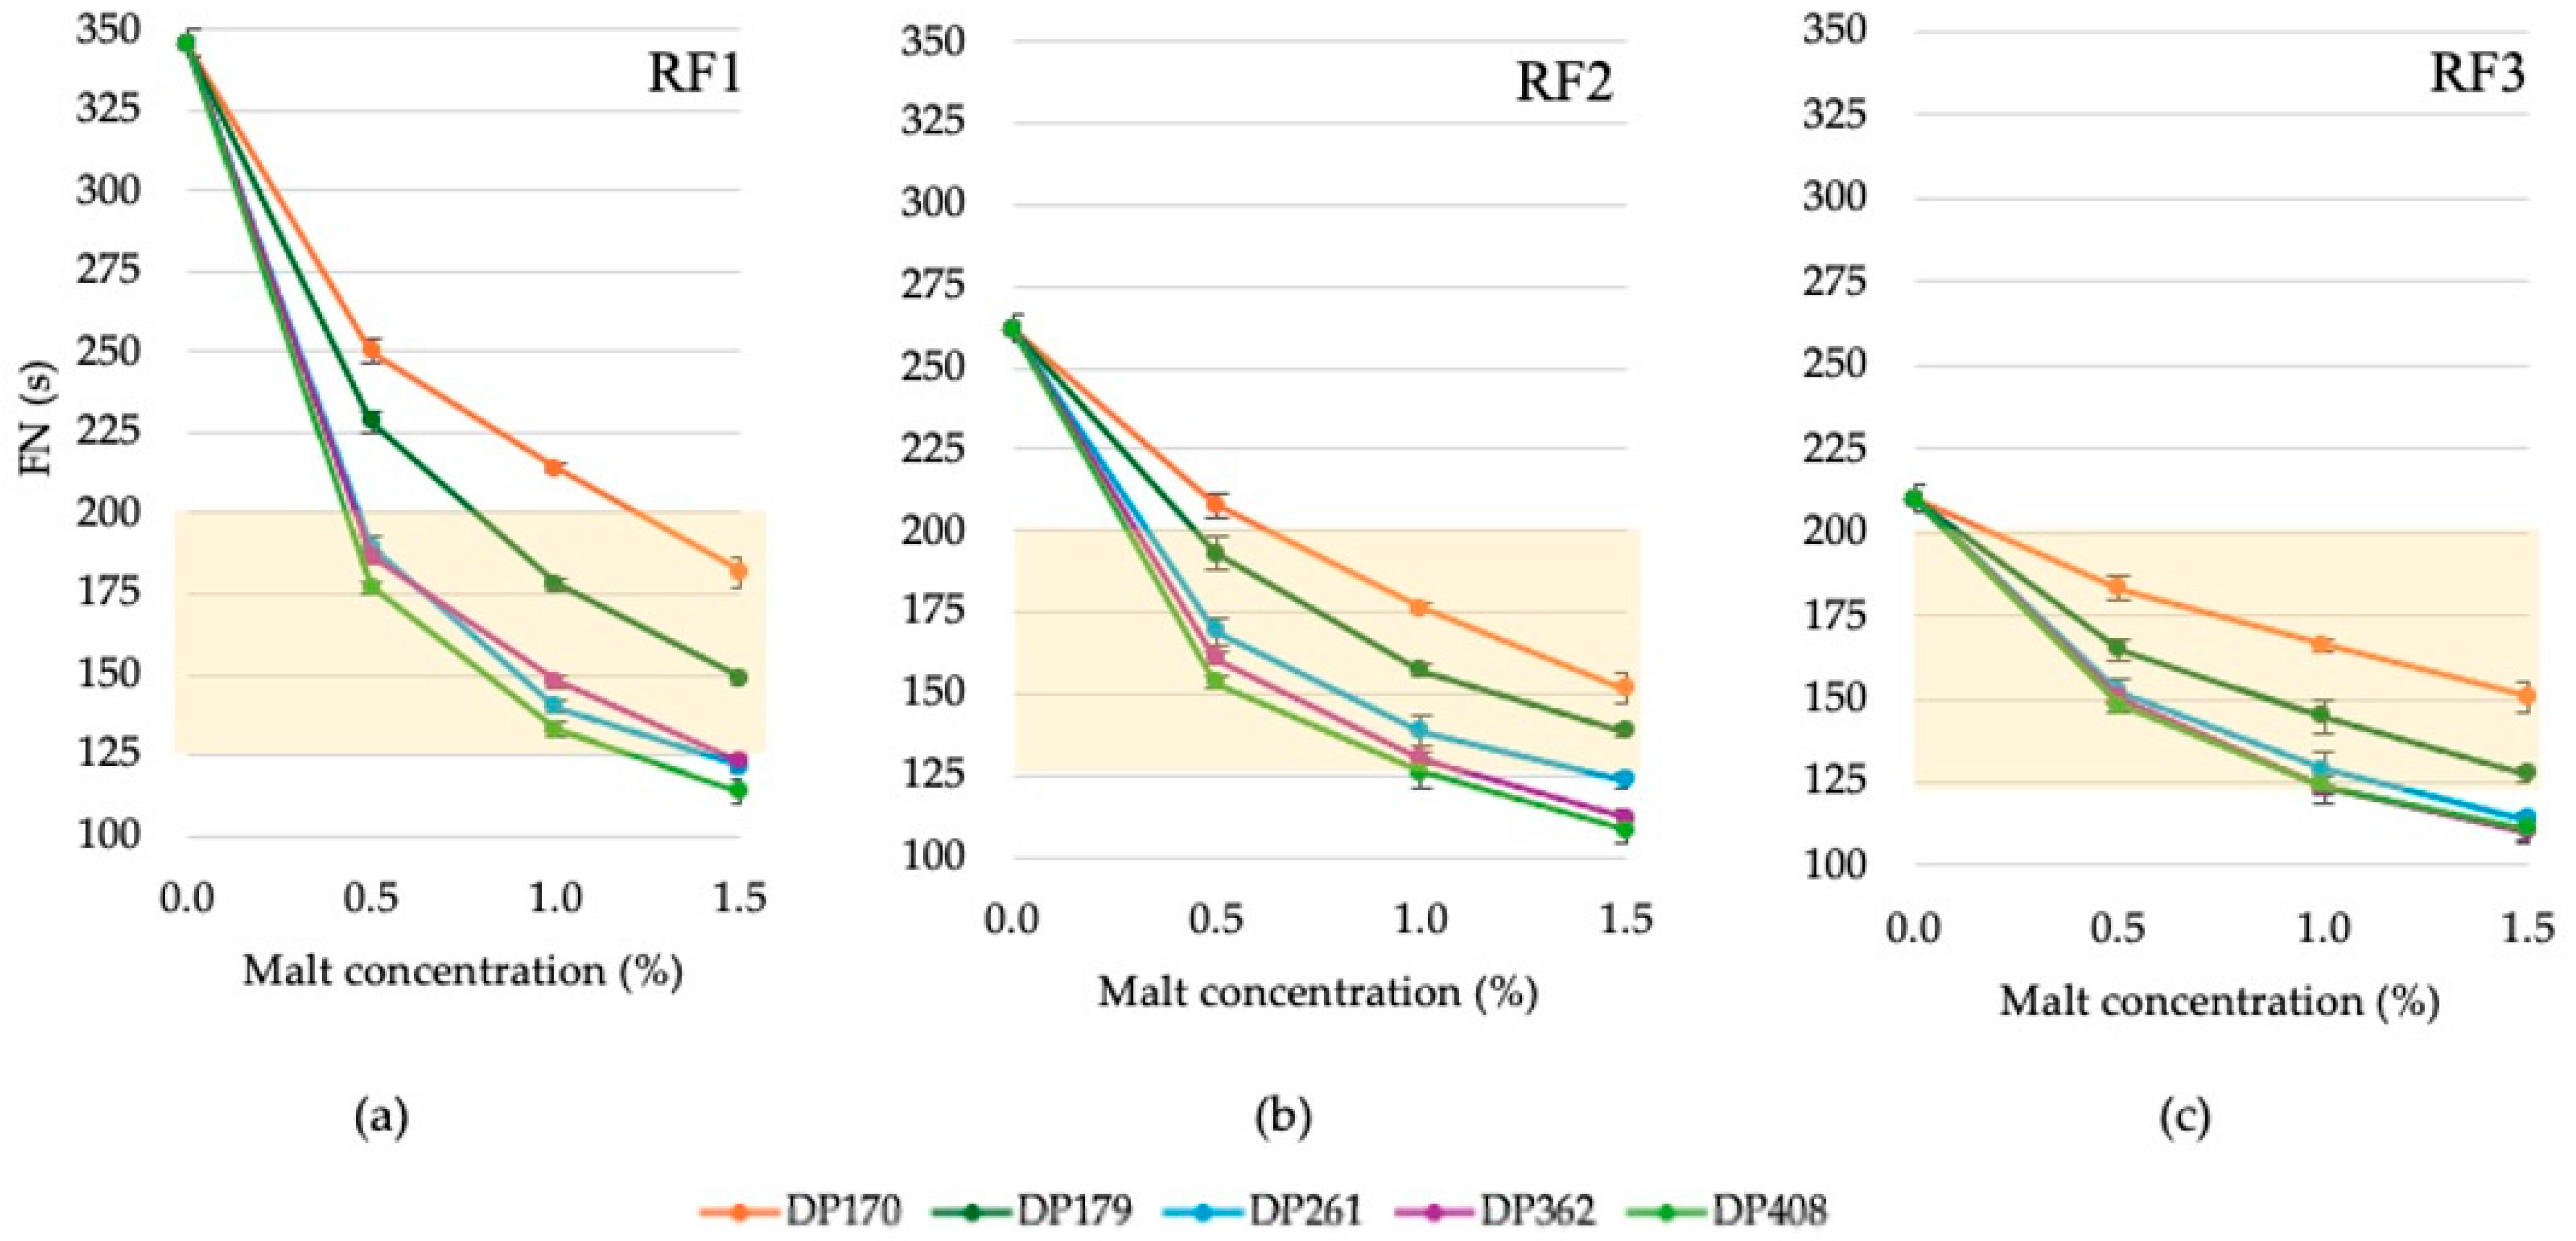
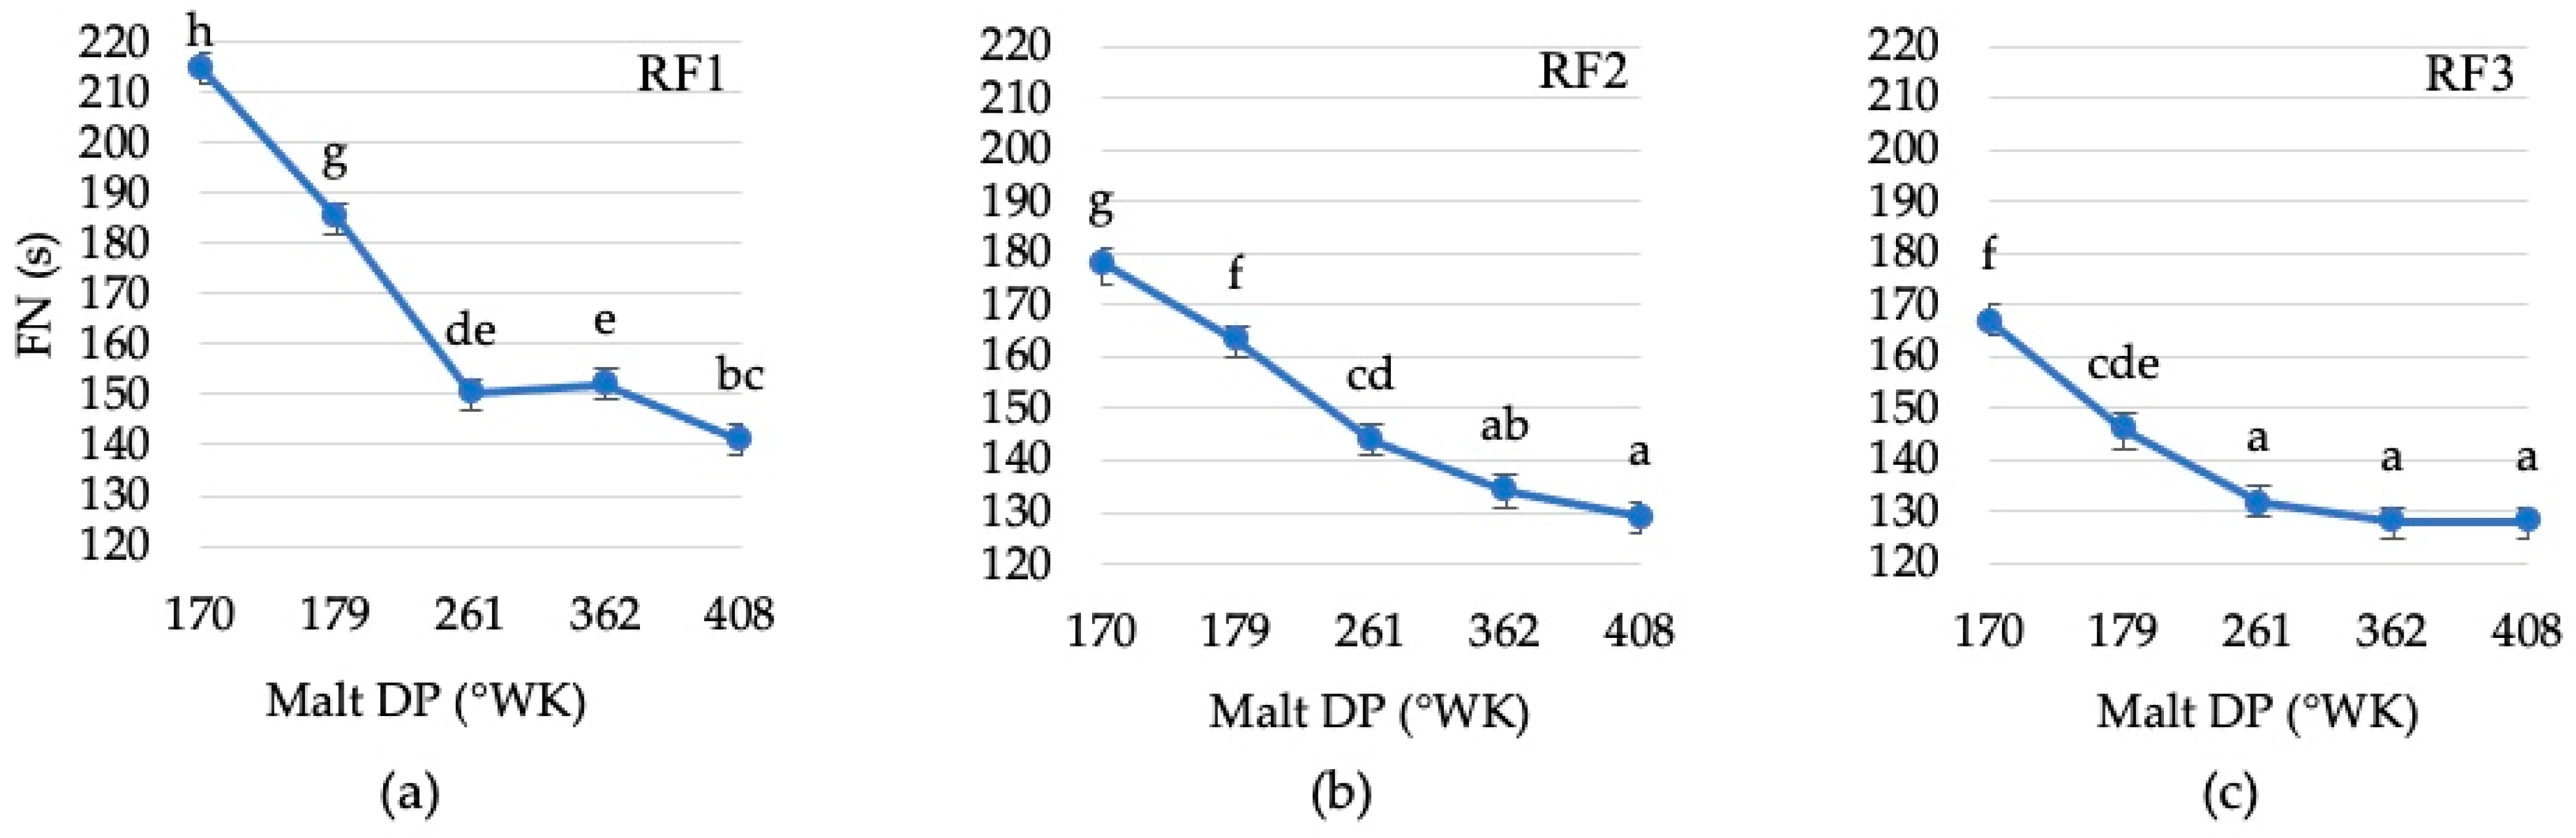
3.2.1. Changes in the Falling Number of Rye Flour Depending on the Diastatic Activity and Concentration of Malt
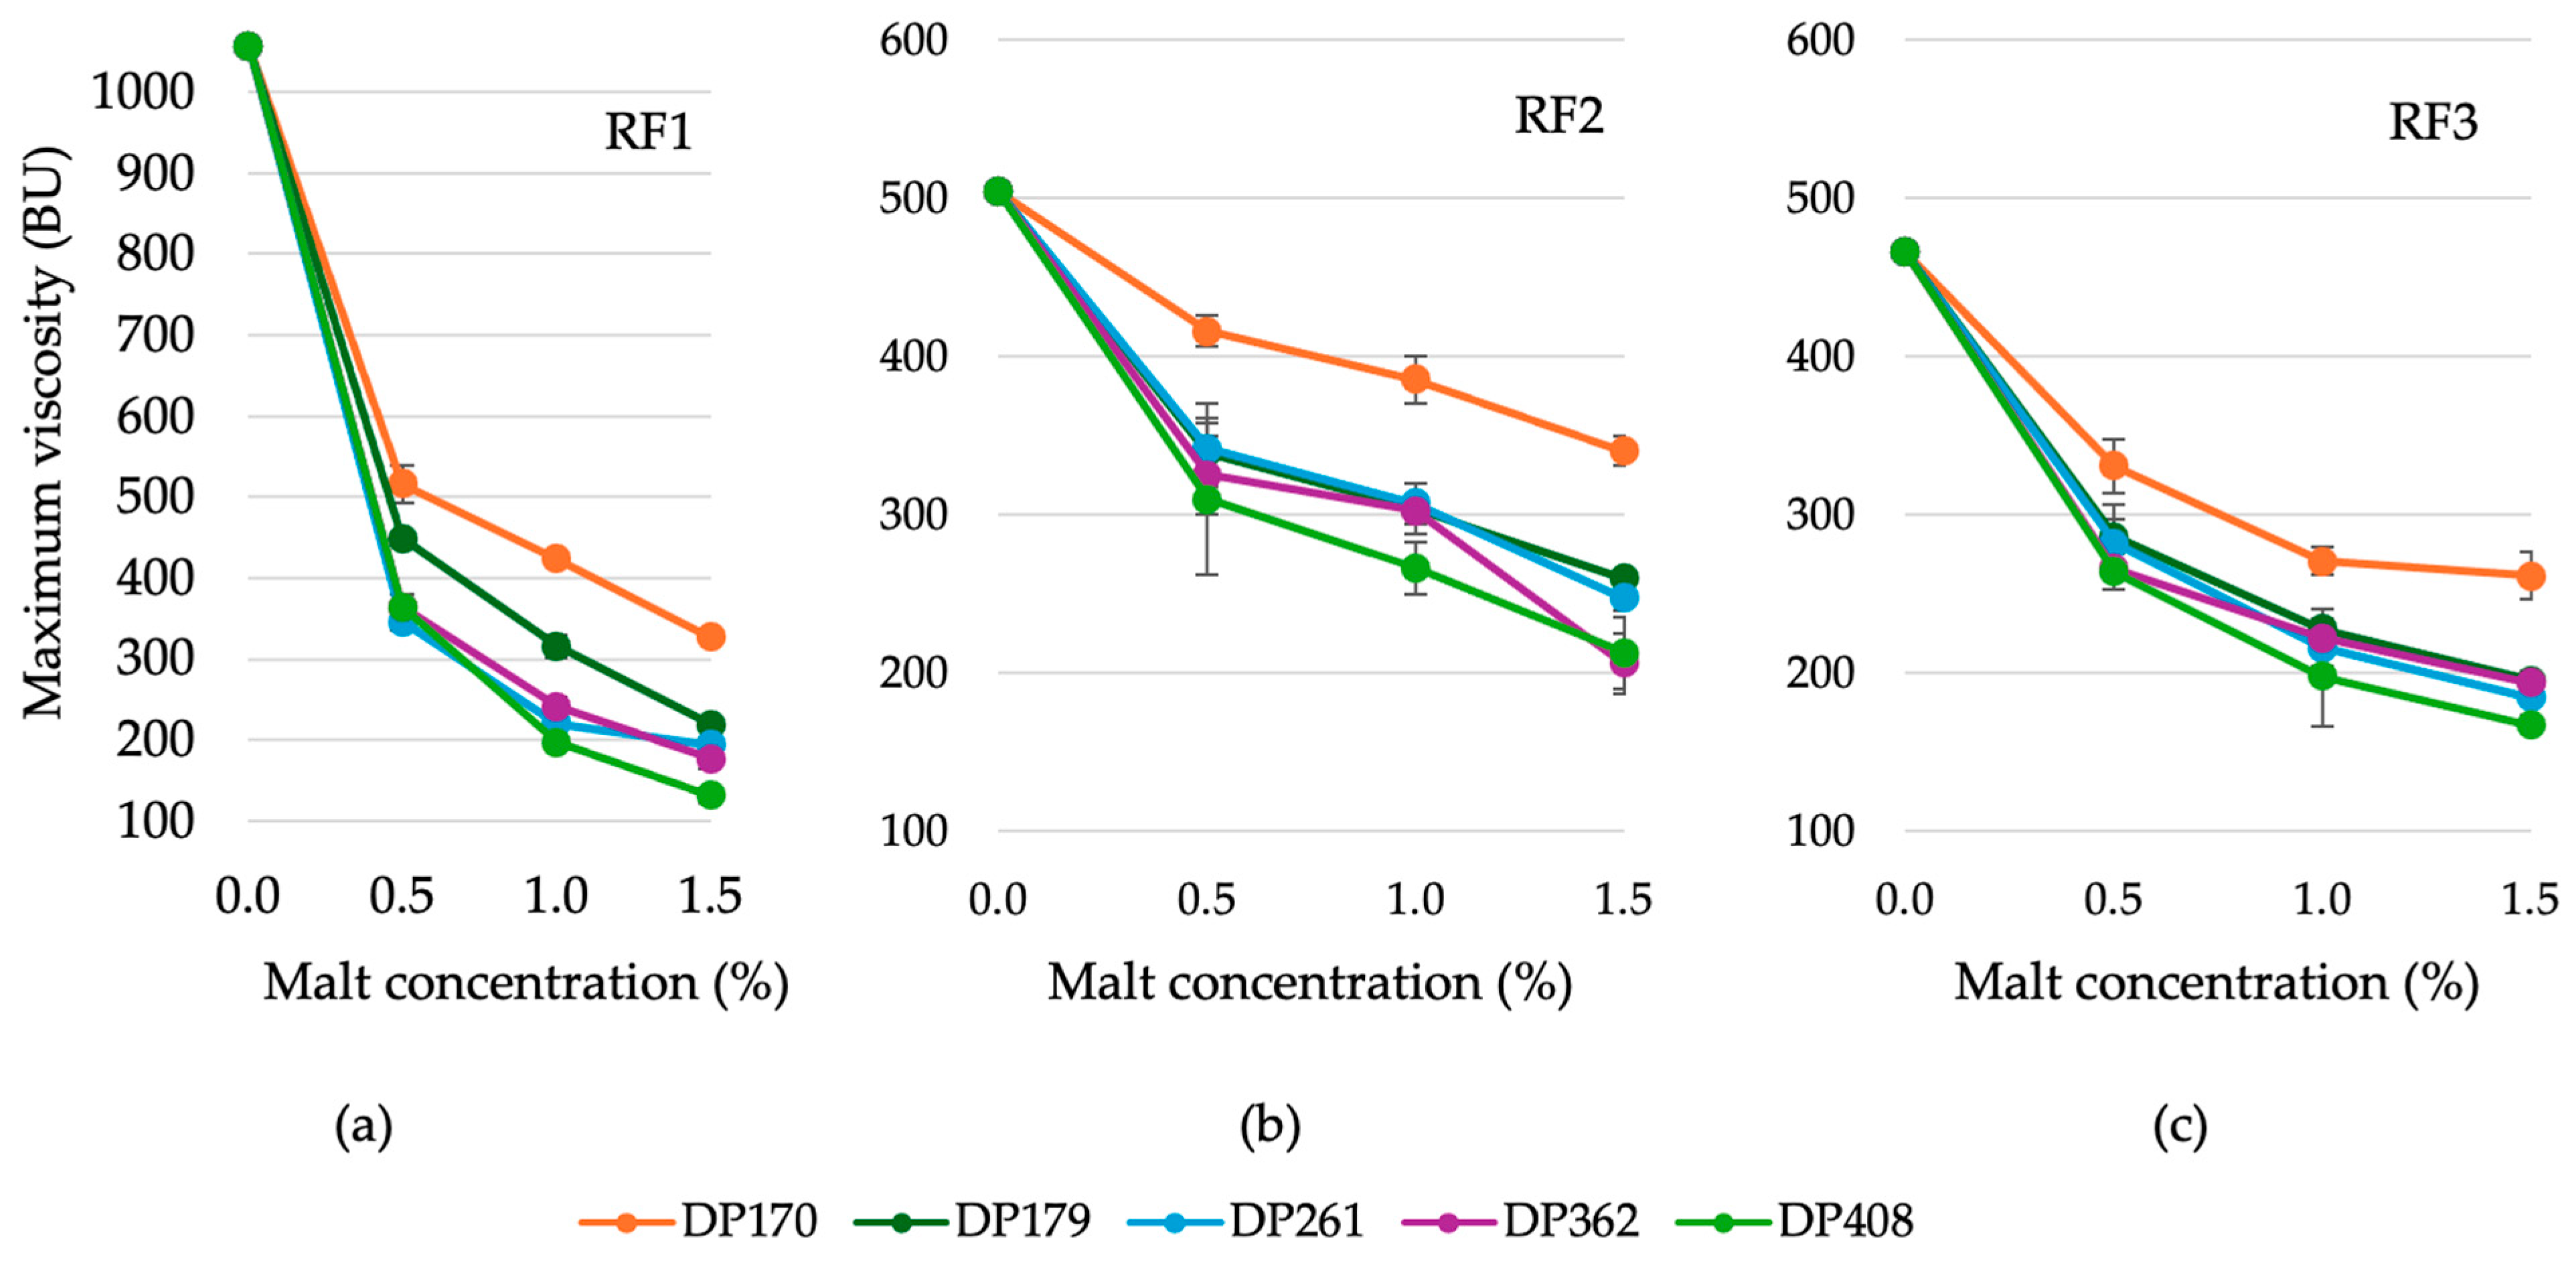
3.2.2. Variation in the Maximum Viscosity of Rye Flour Depending on the Diastatic Activity and Concentration of Malt
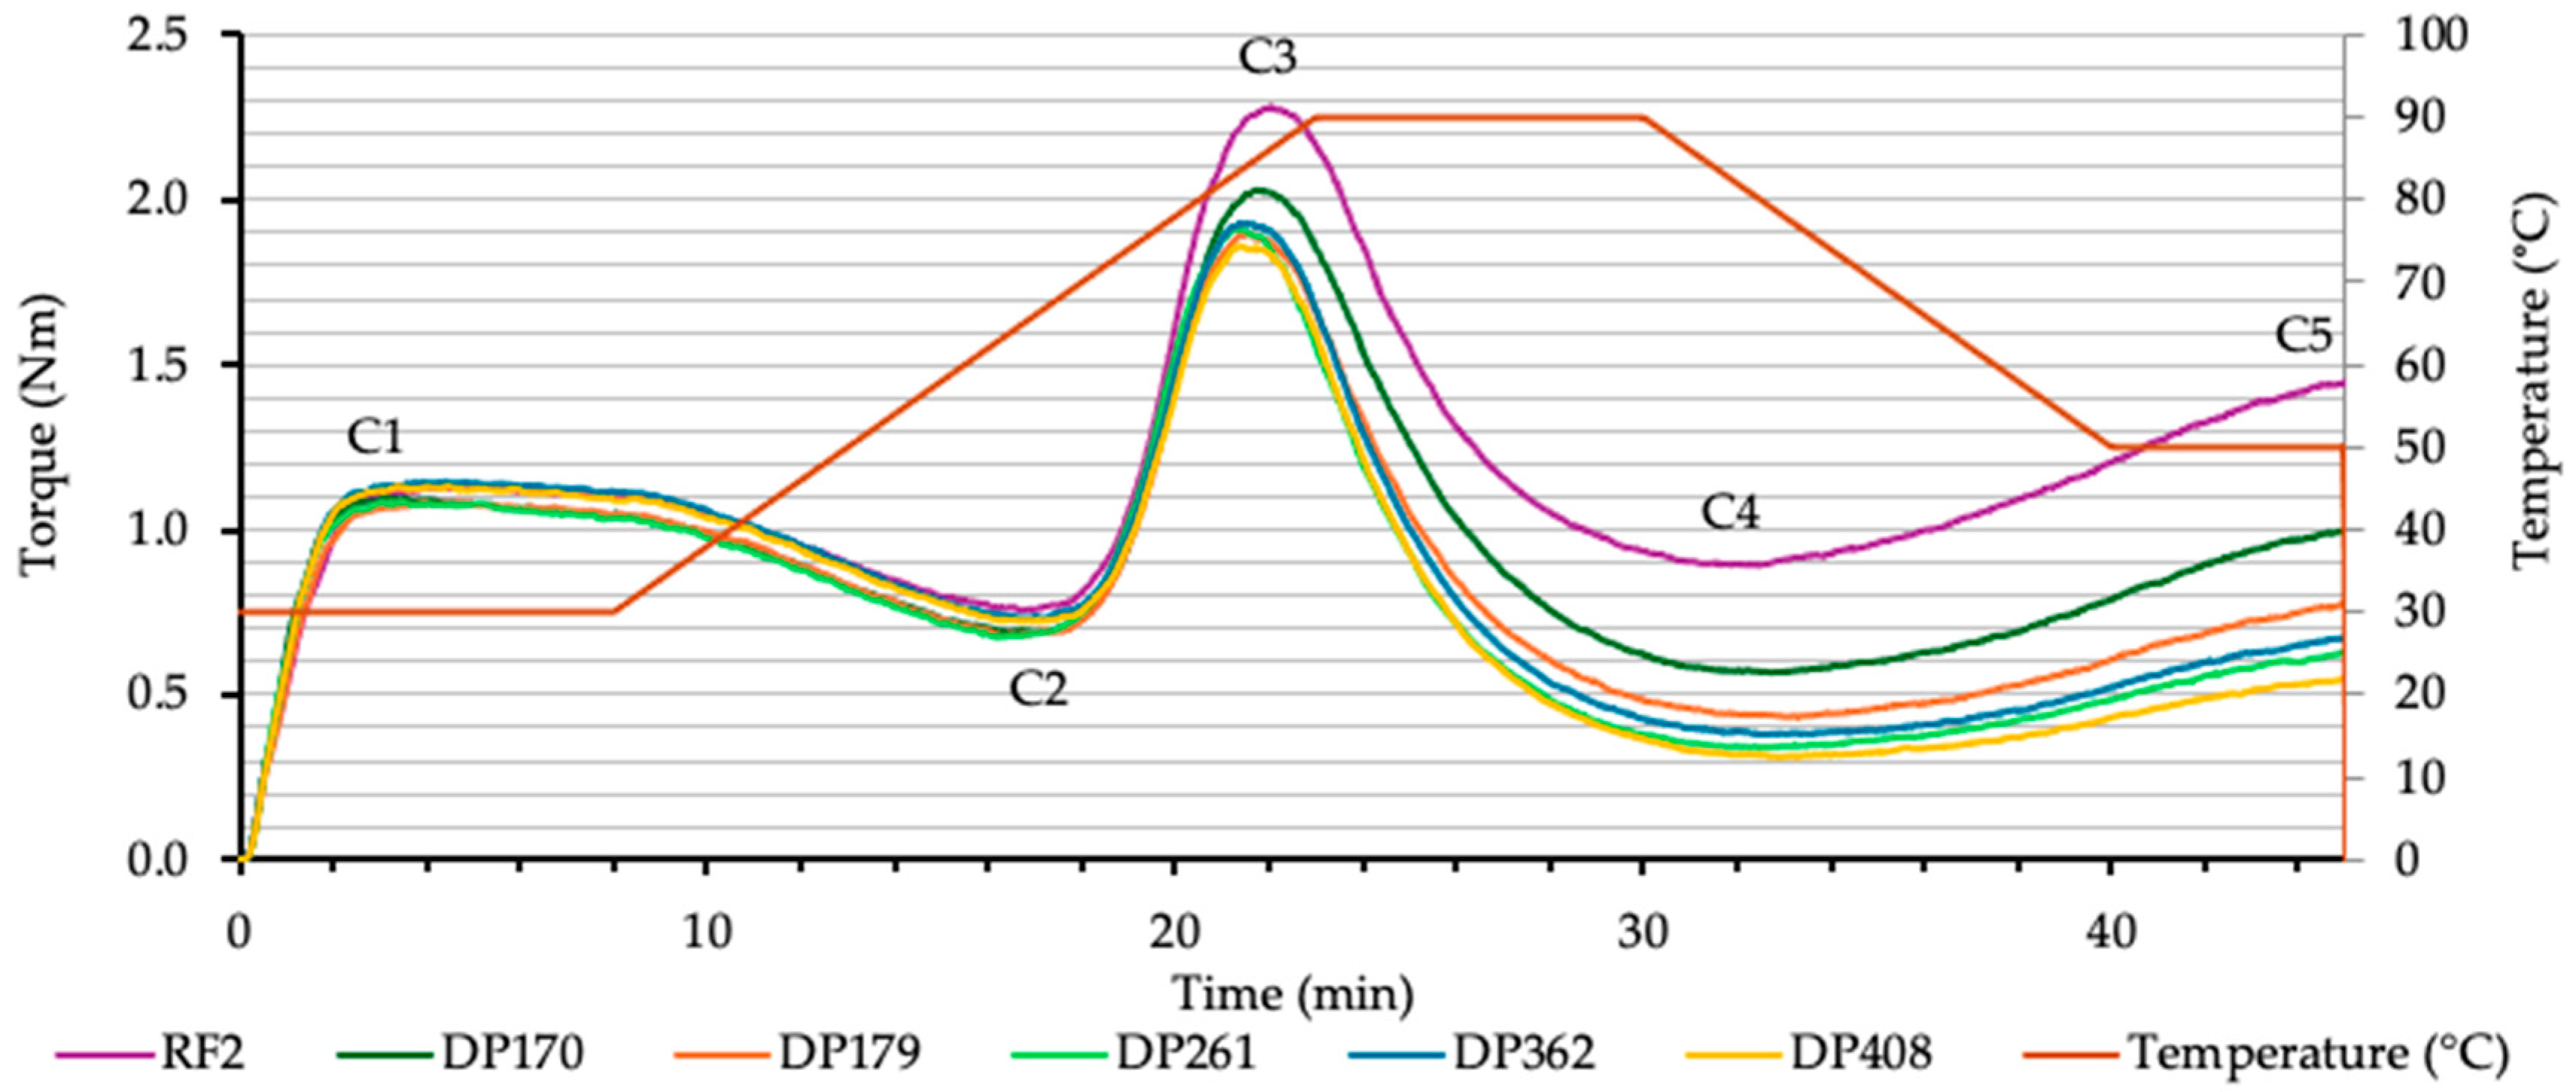
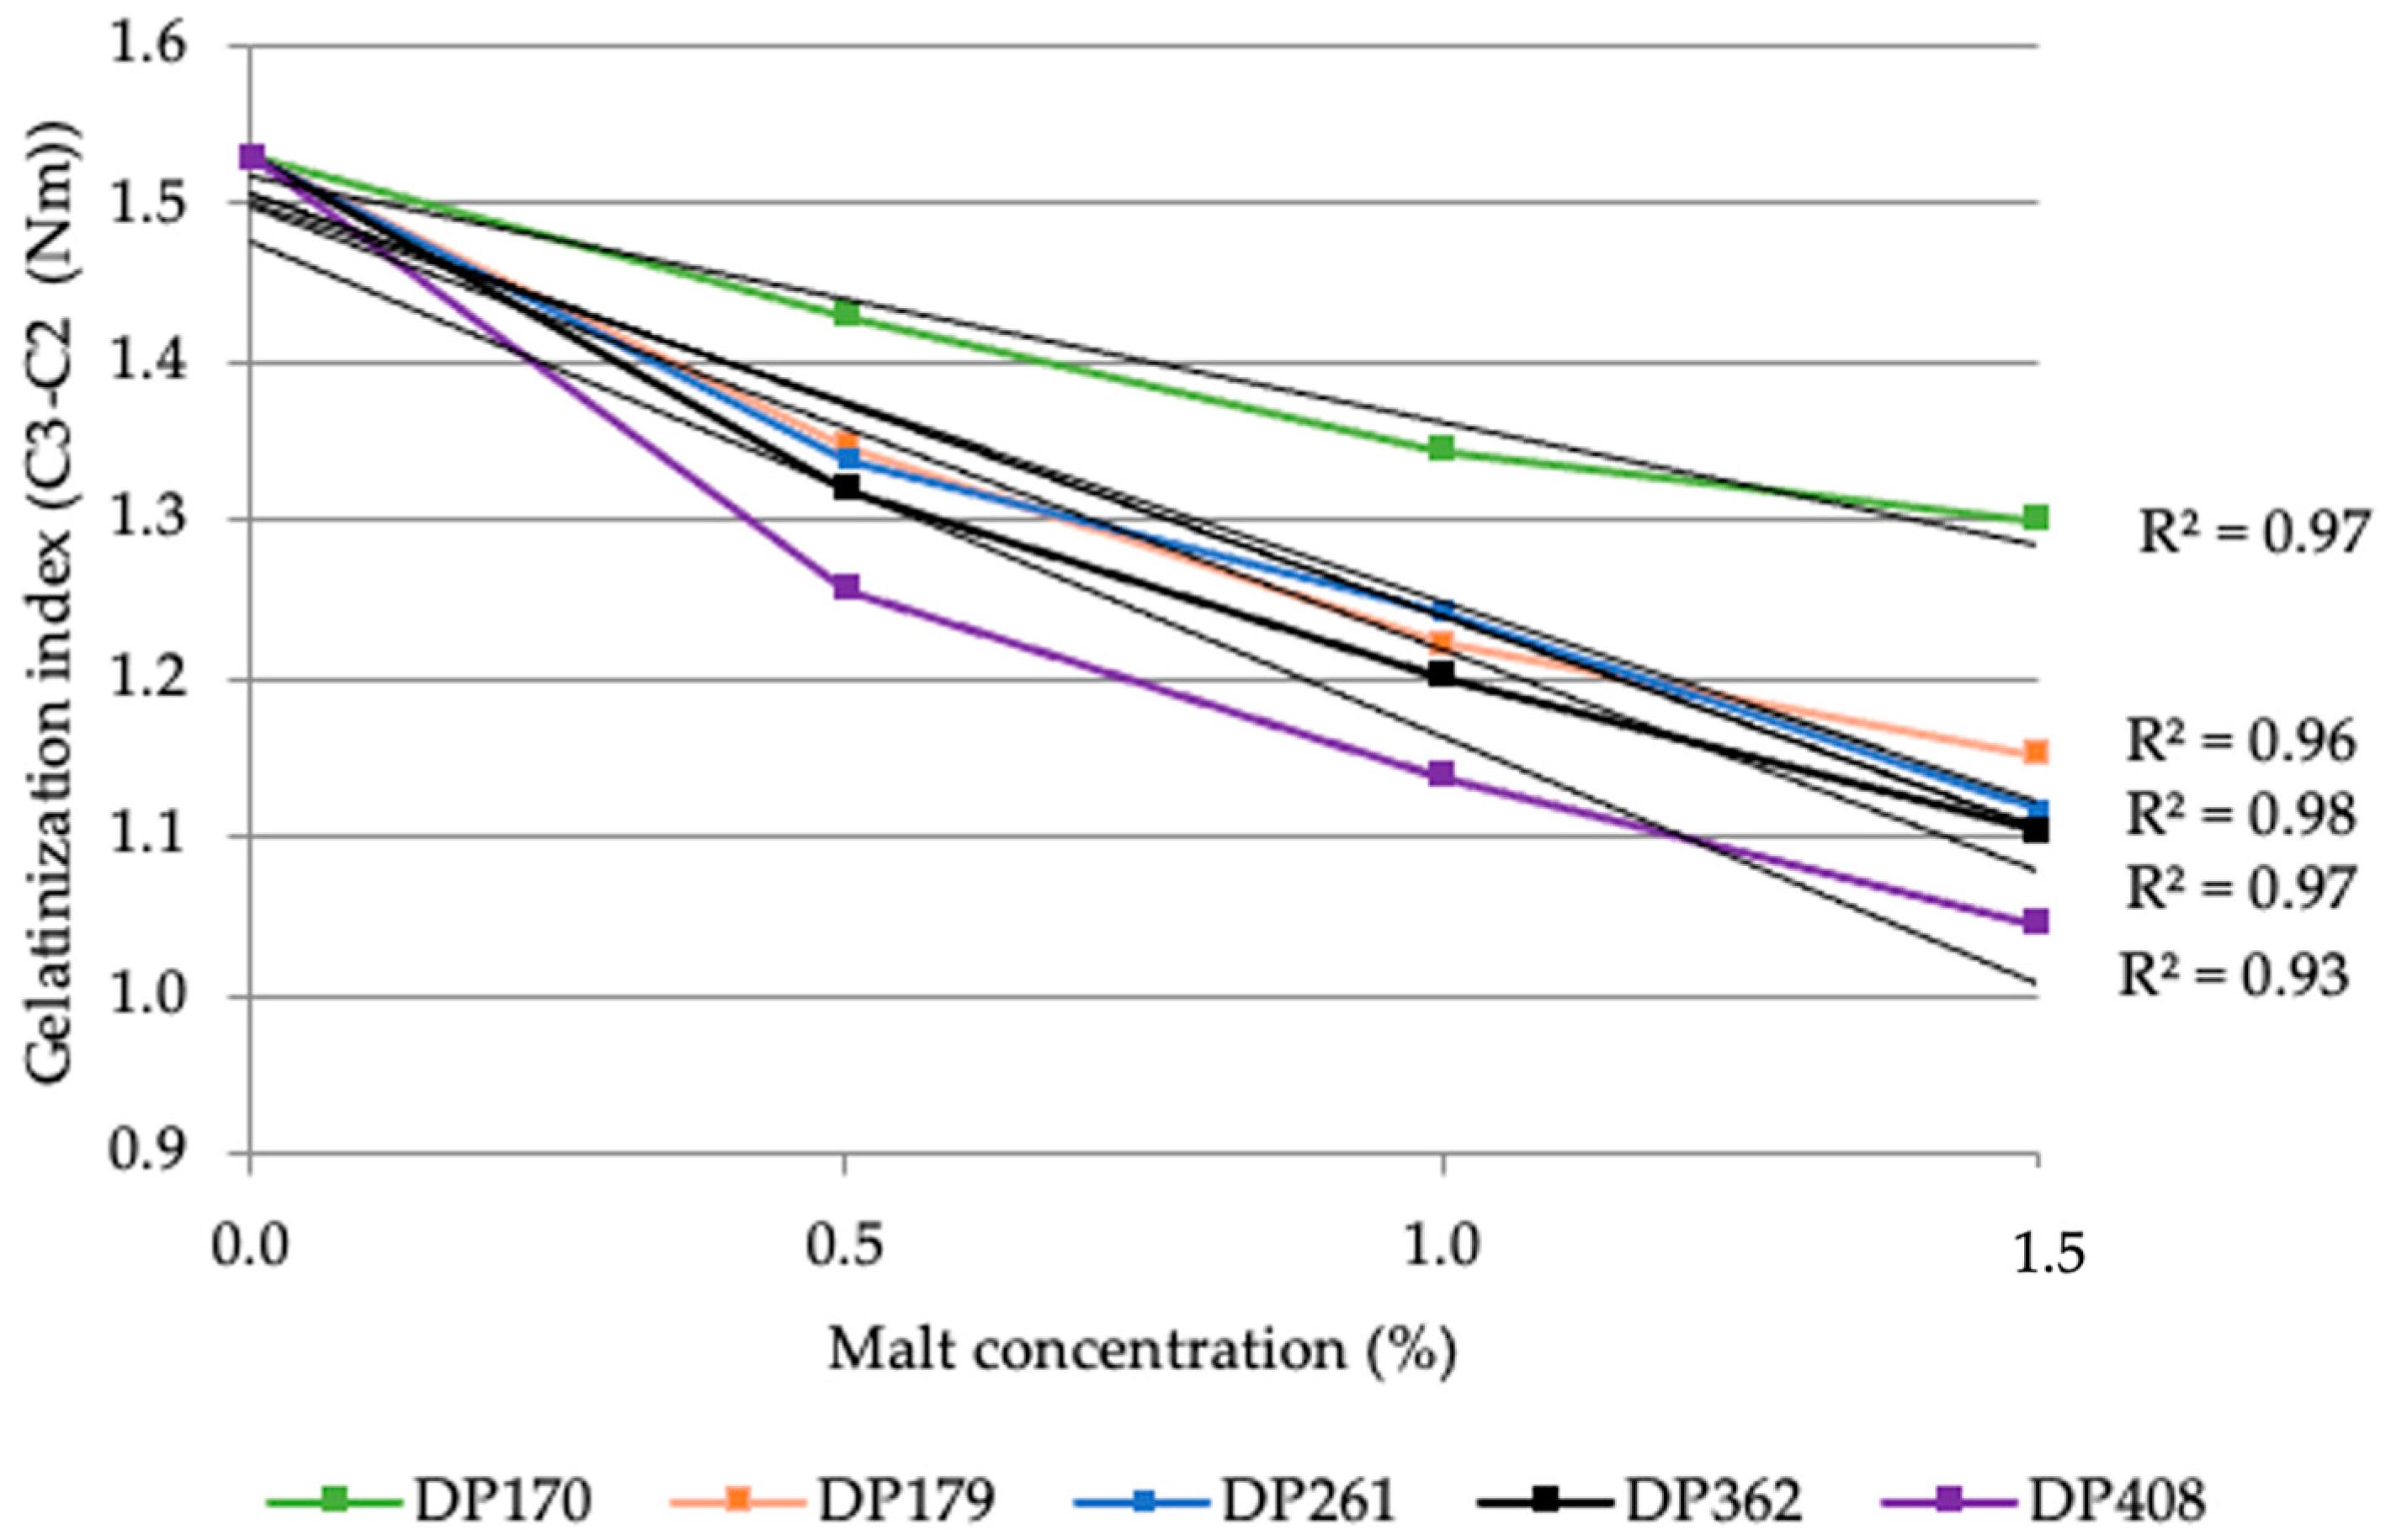
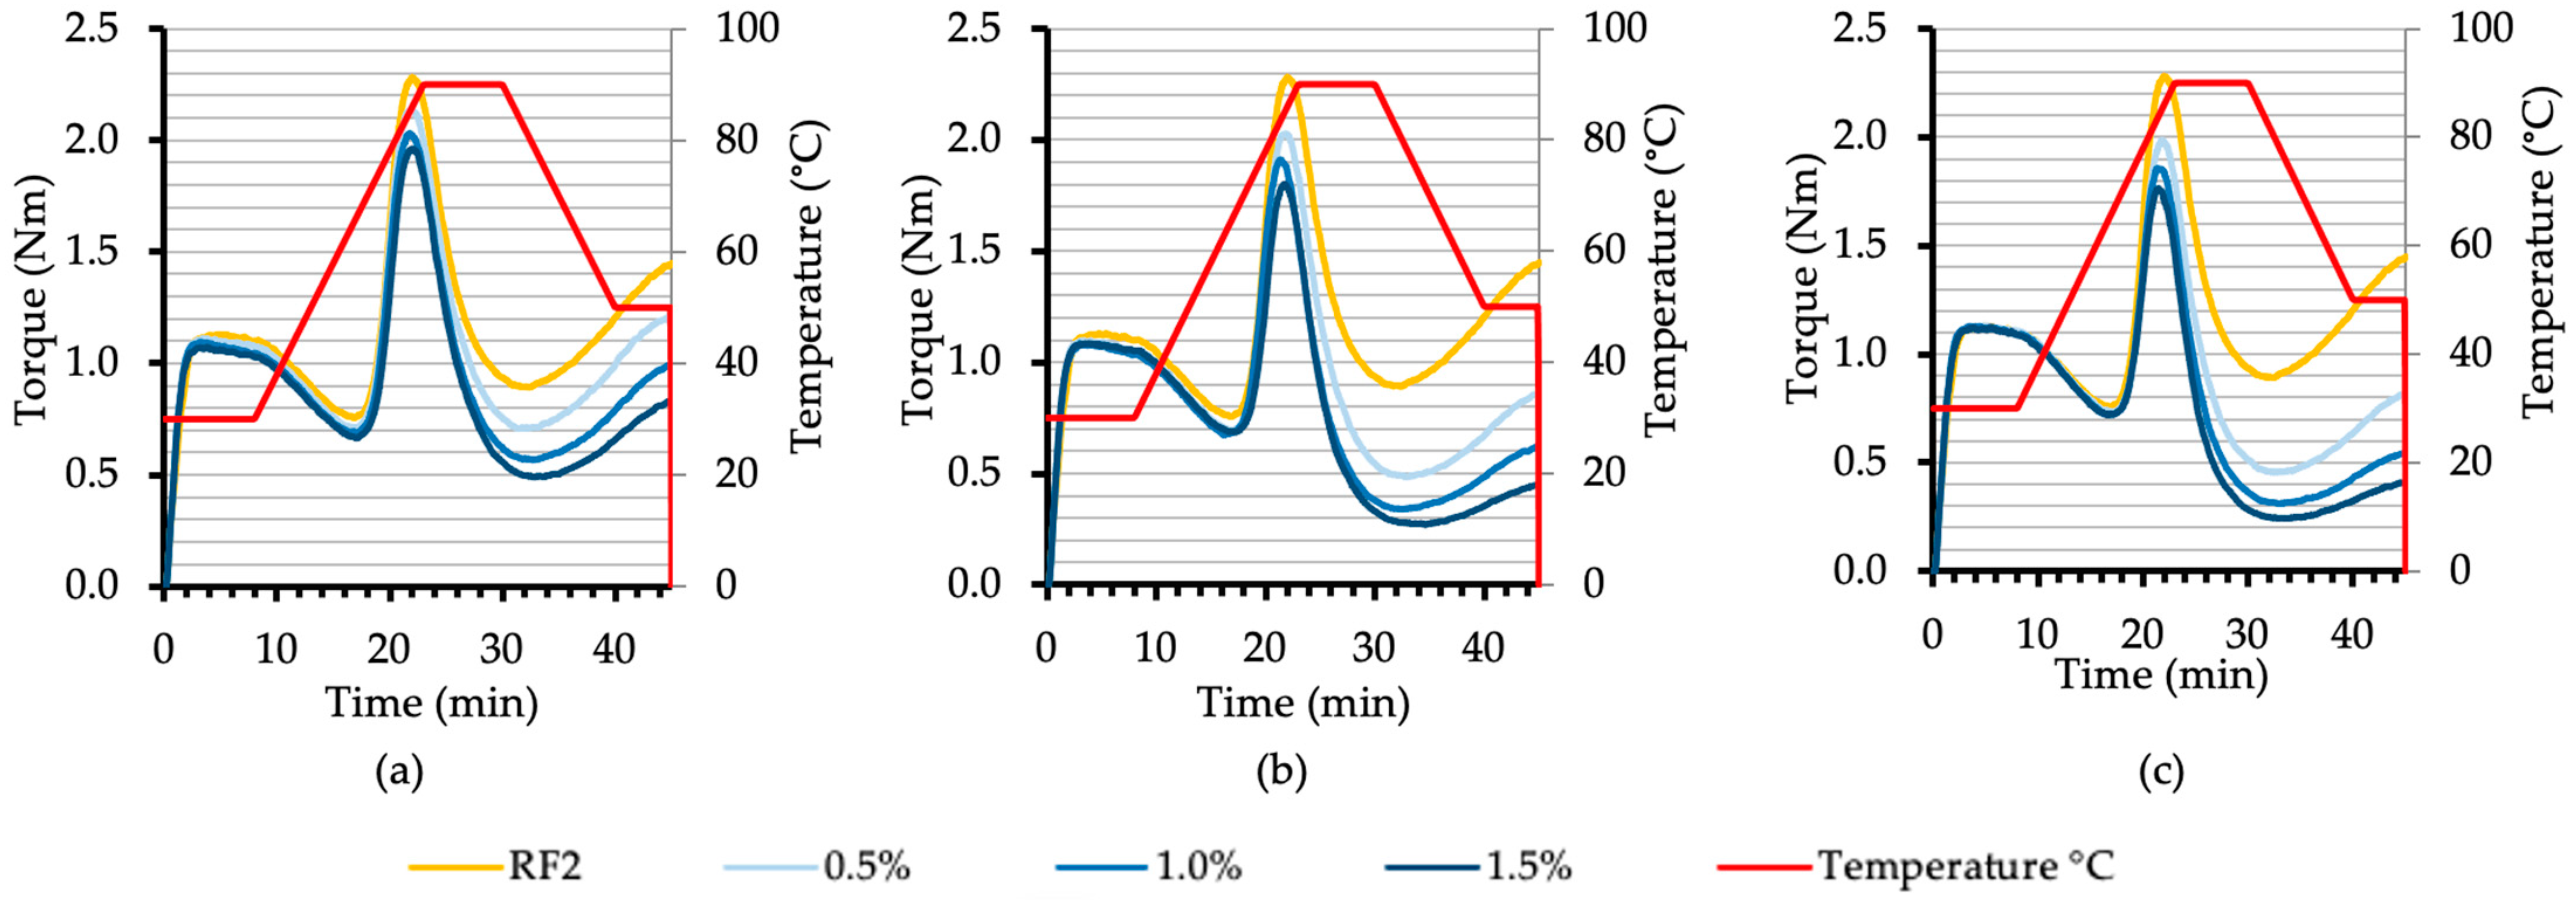
3.2.3. Characteristics of Flour and Flour–Malt Blend Rheological Properties Using Mixolab
3.3. The Effect of Malt on Sugar Profile Formation during Saccharification and Fermentation of Scald
3.3.1. Sugar Profile of Malt and Flour
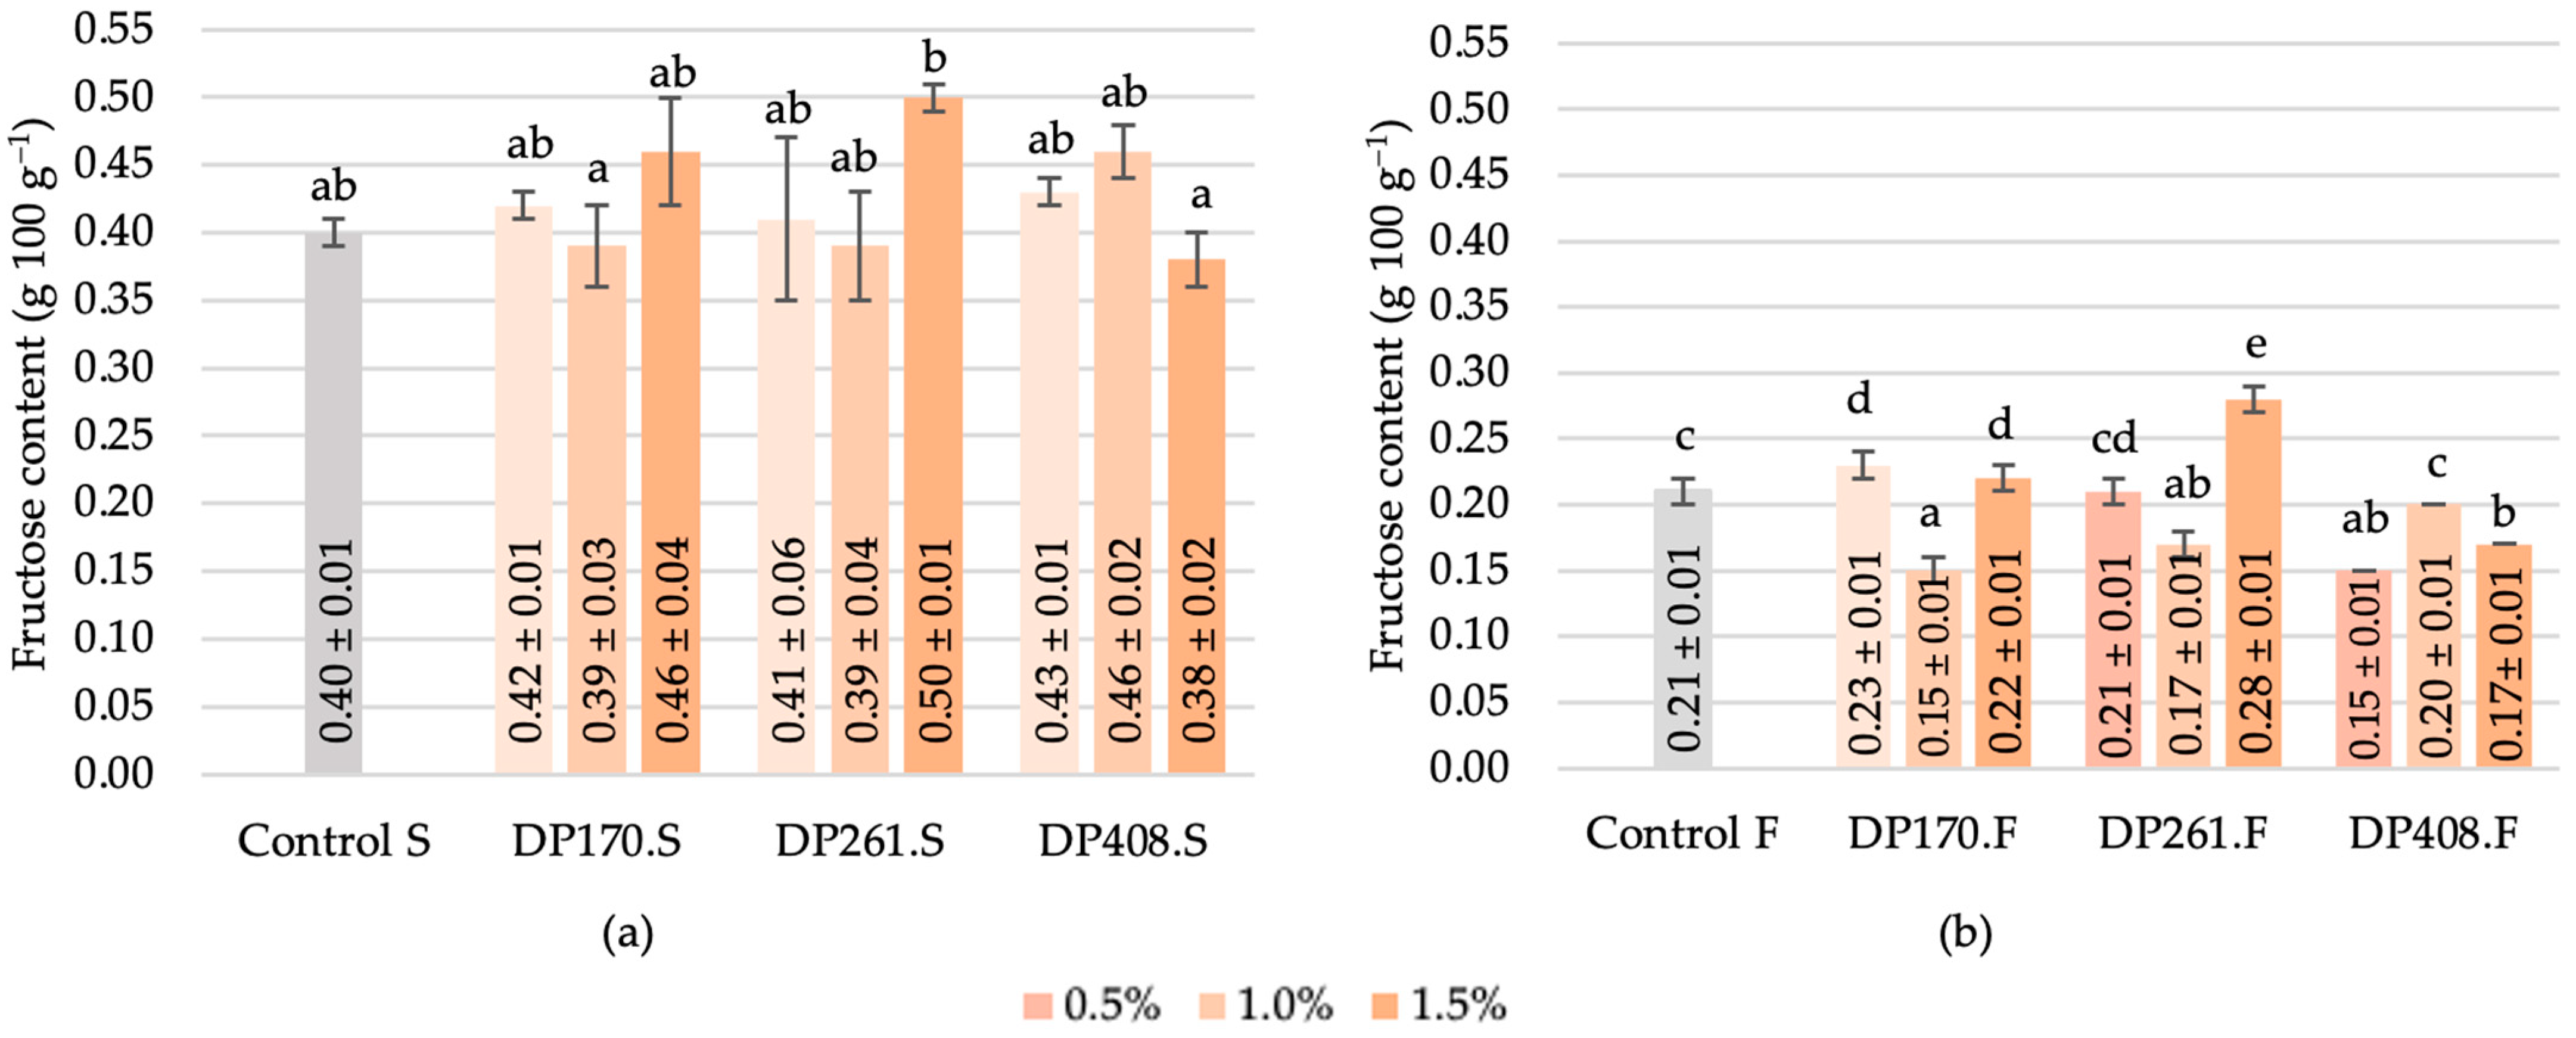
3.3.2. Fructose
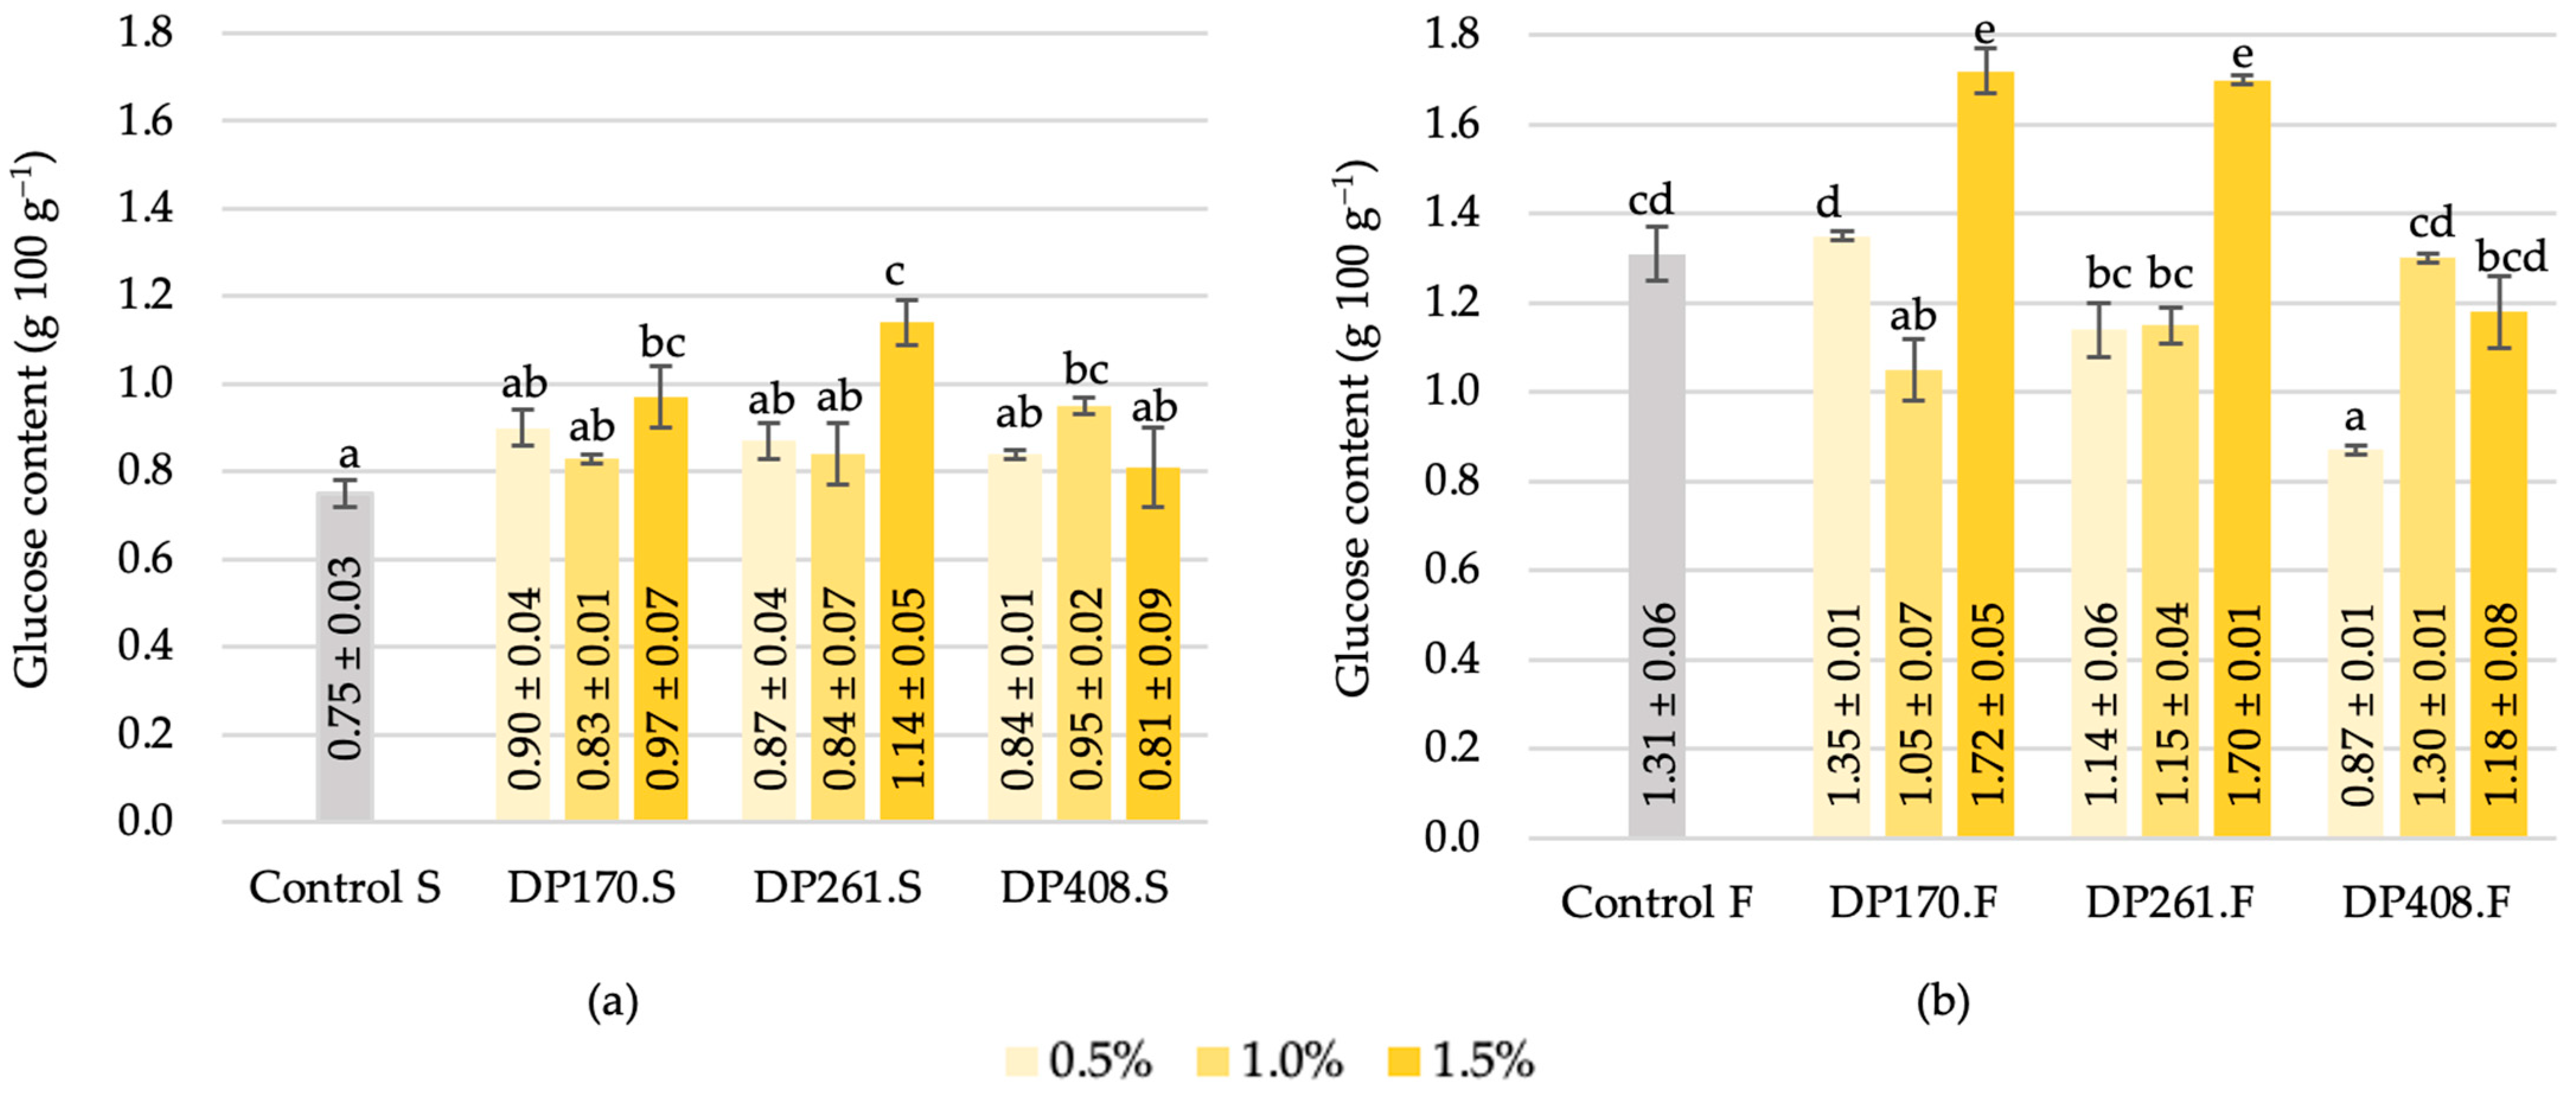
3.3.3. Glucose
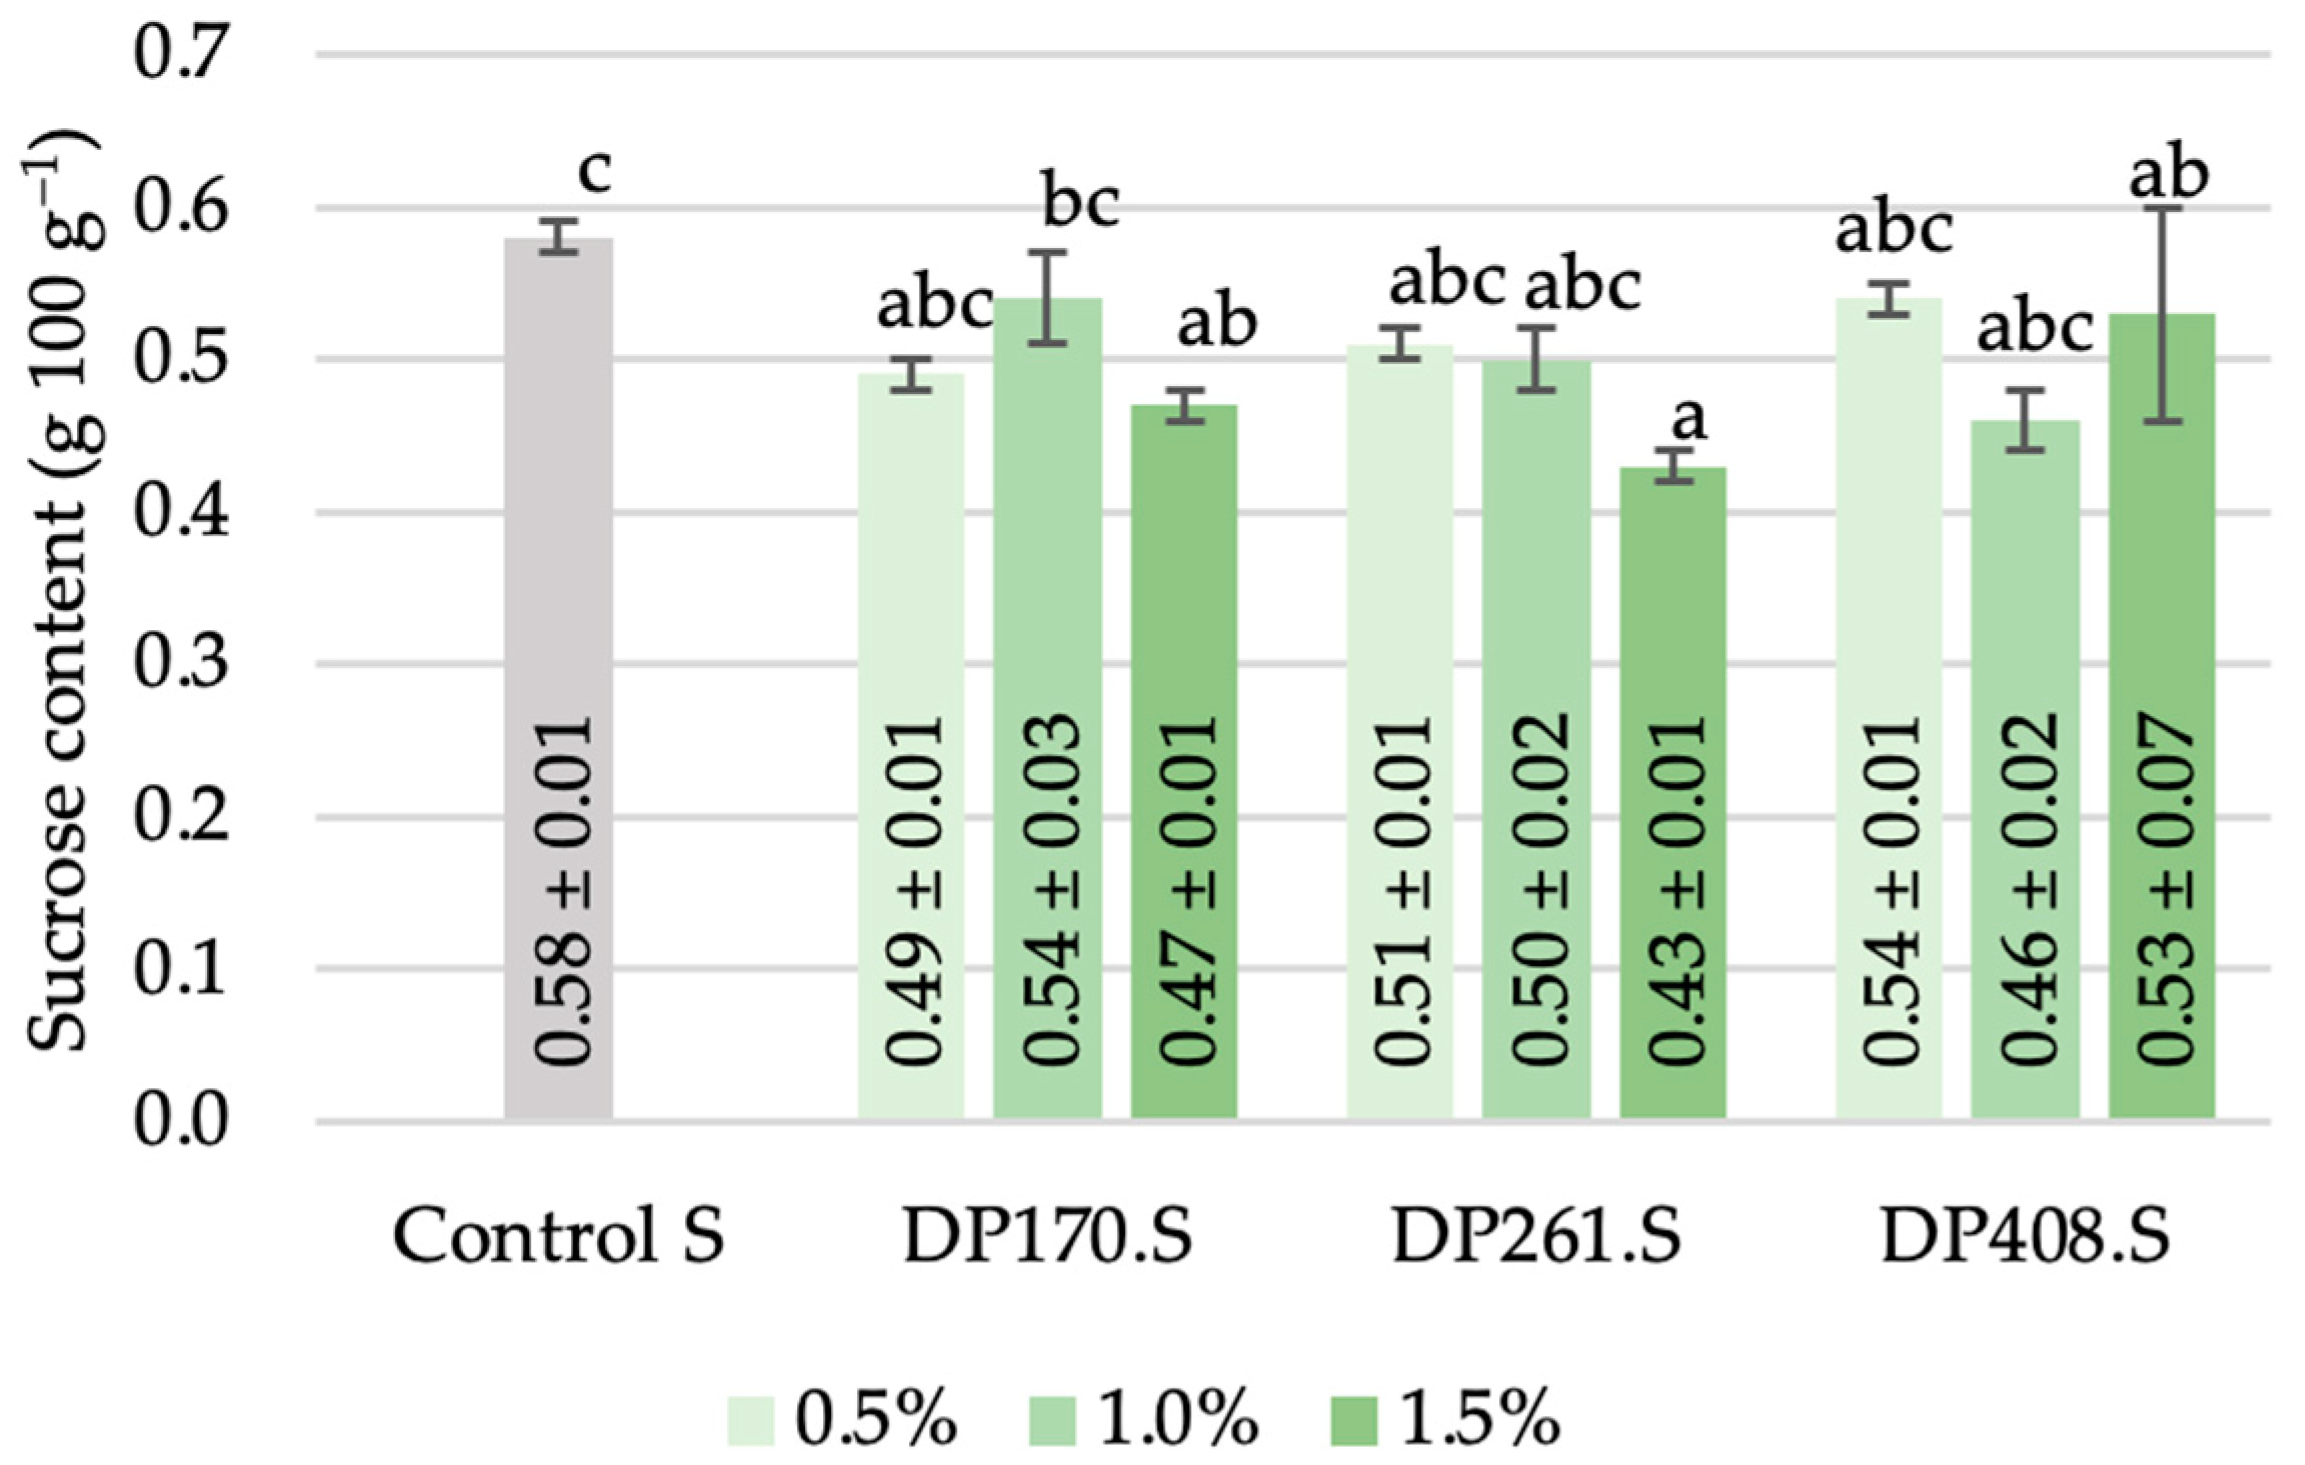
3.3.4. Sucrose
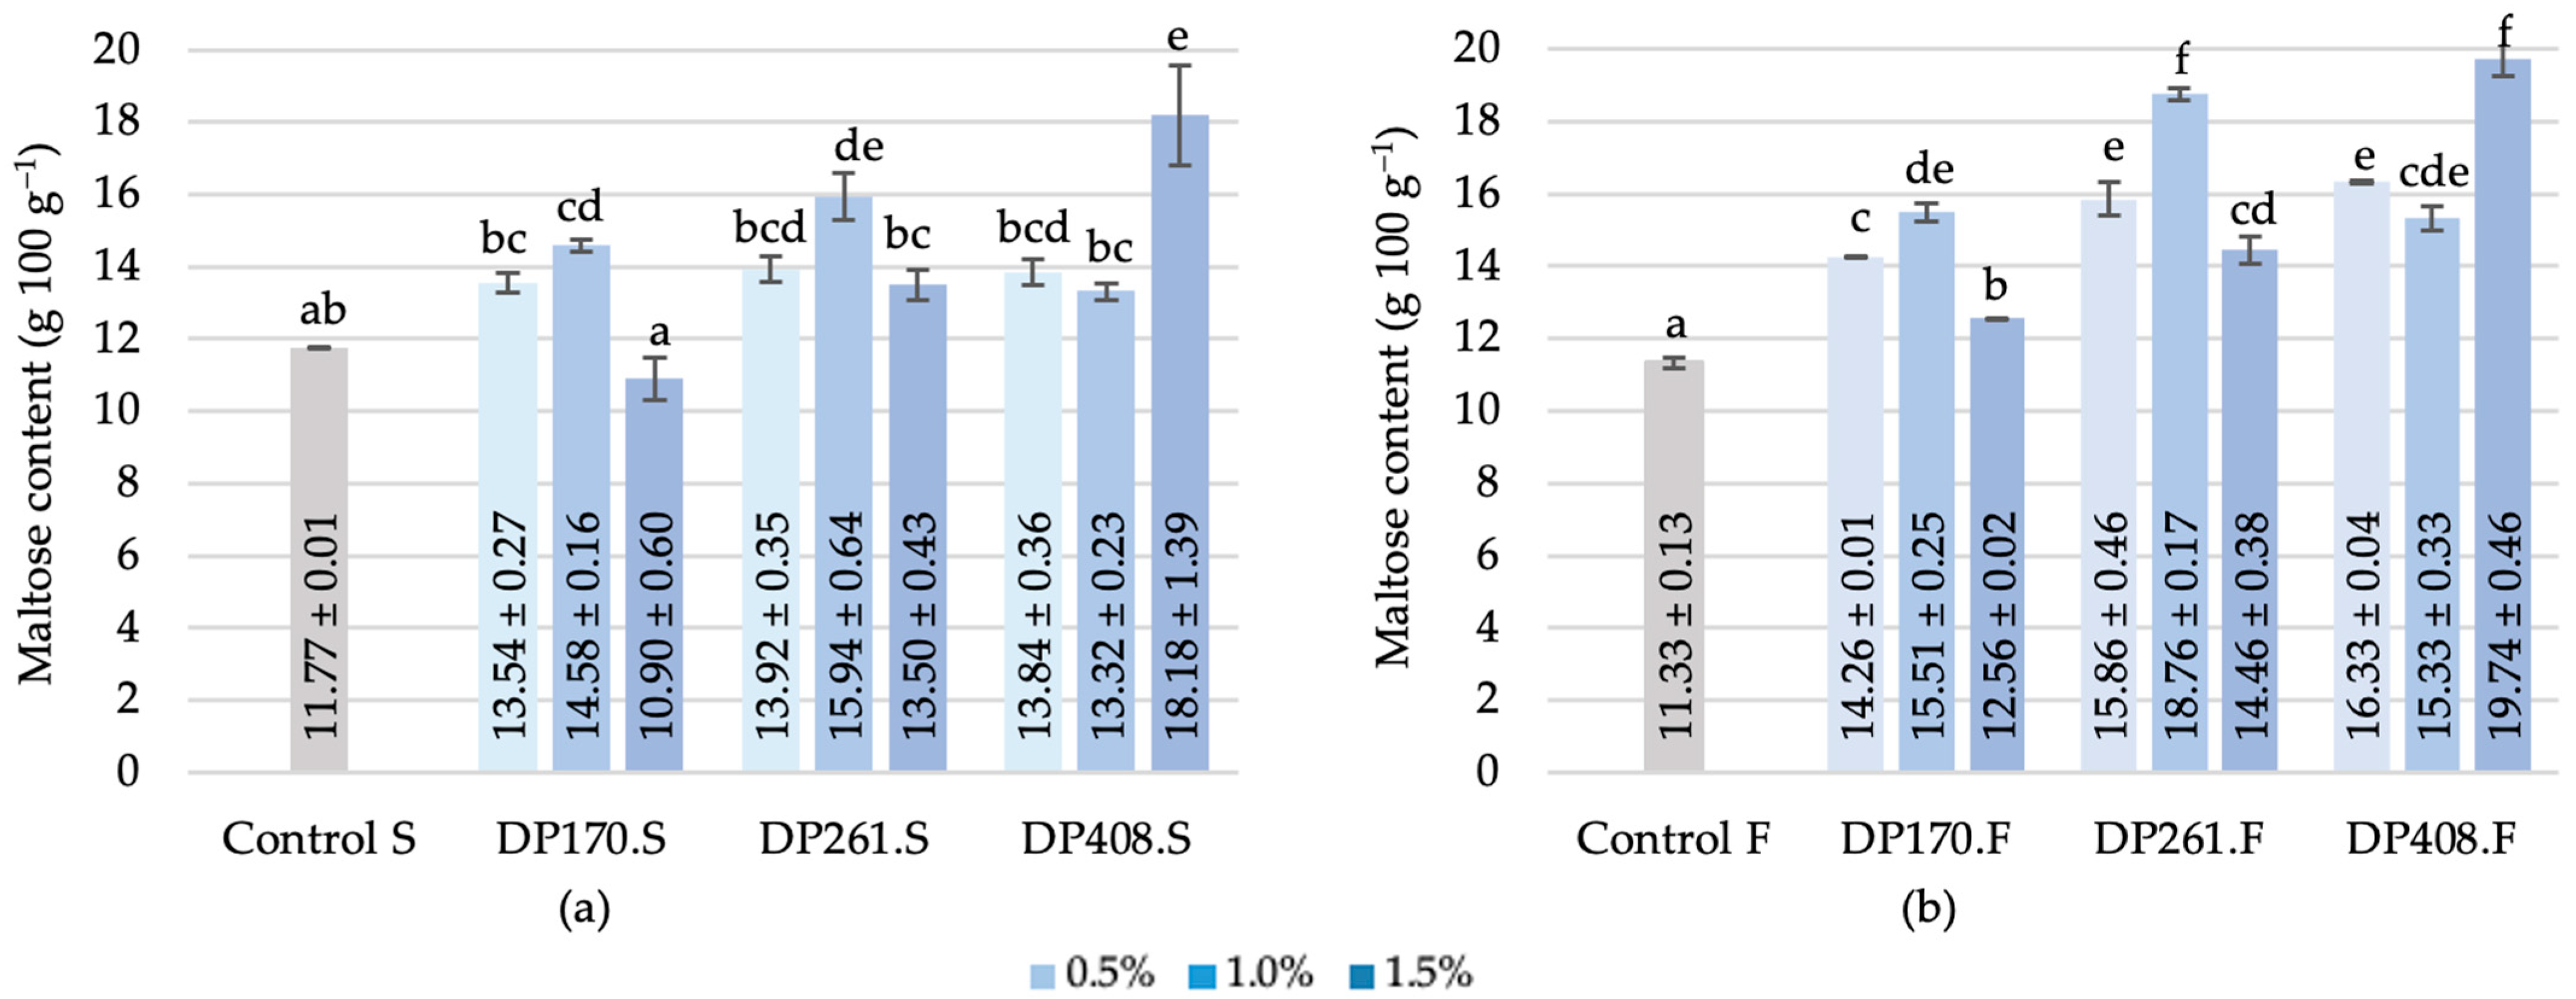
3.3.5. Maltose
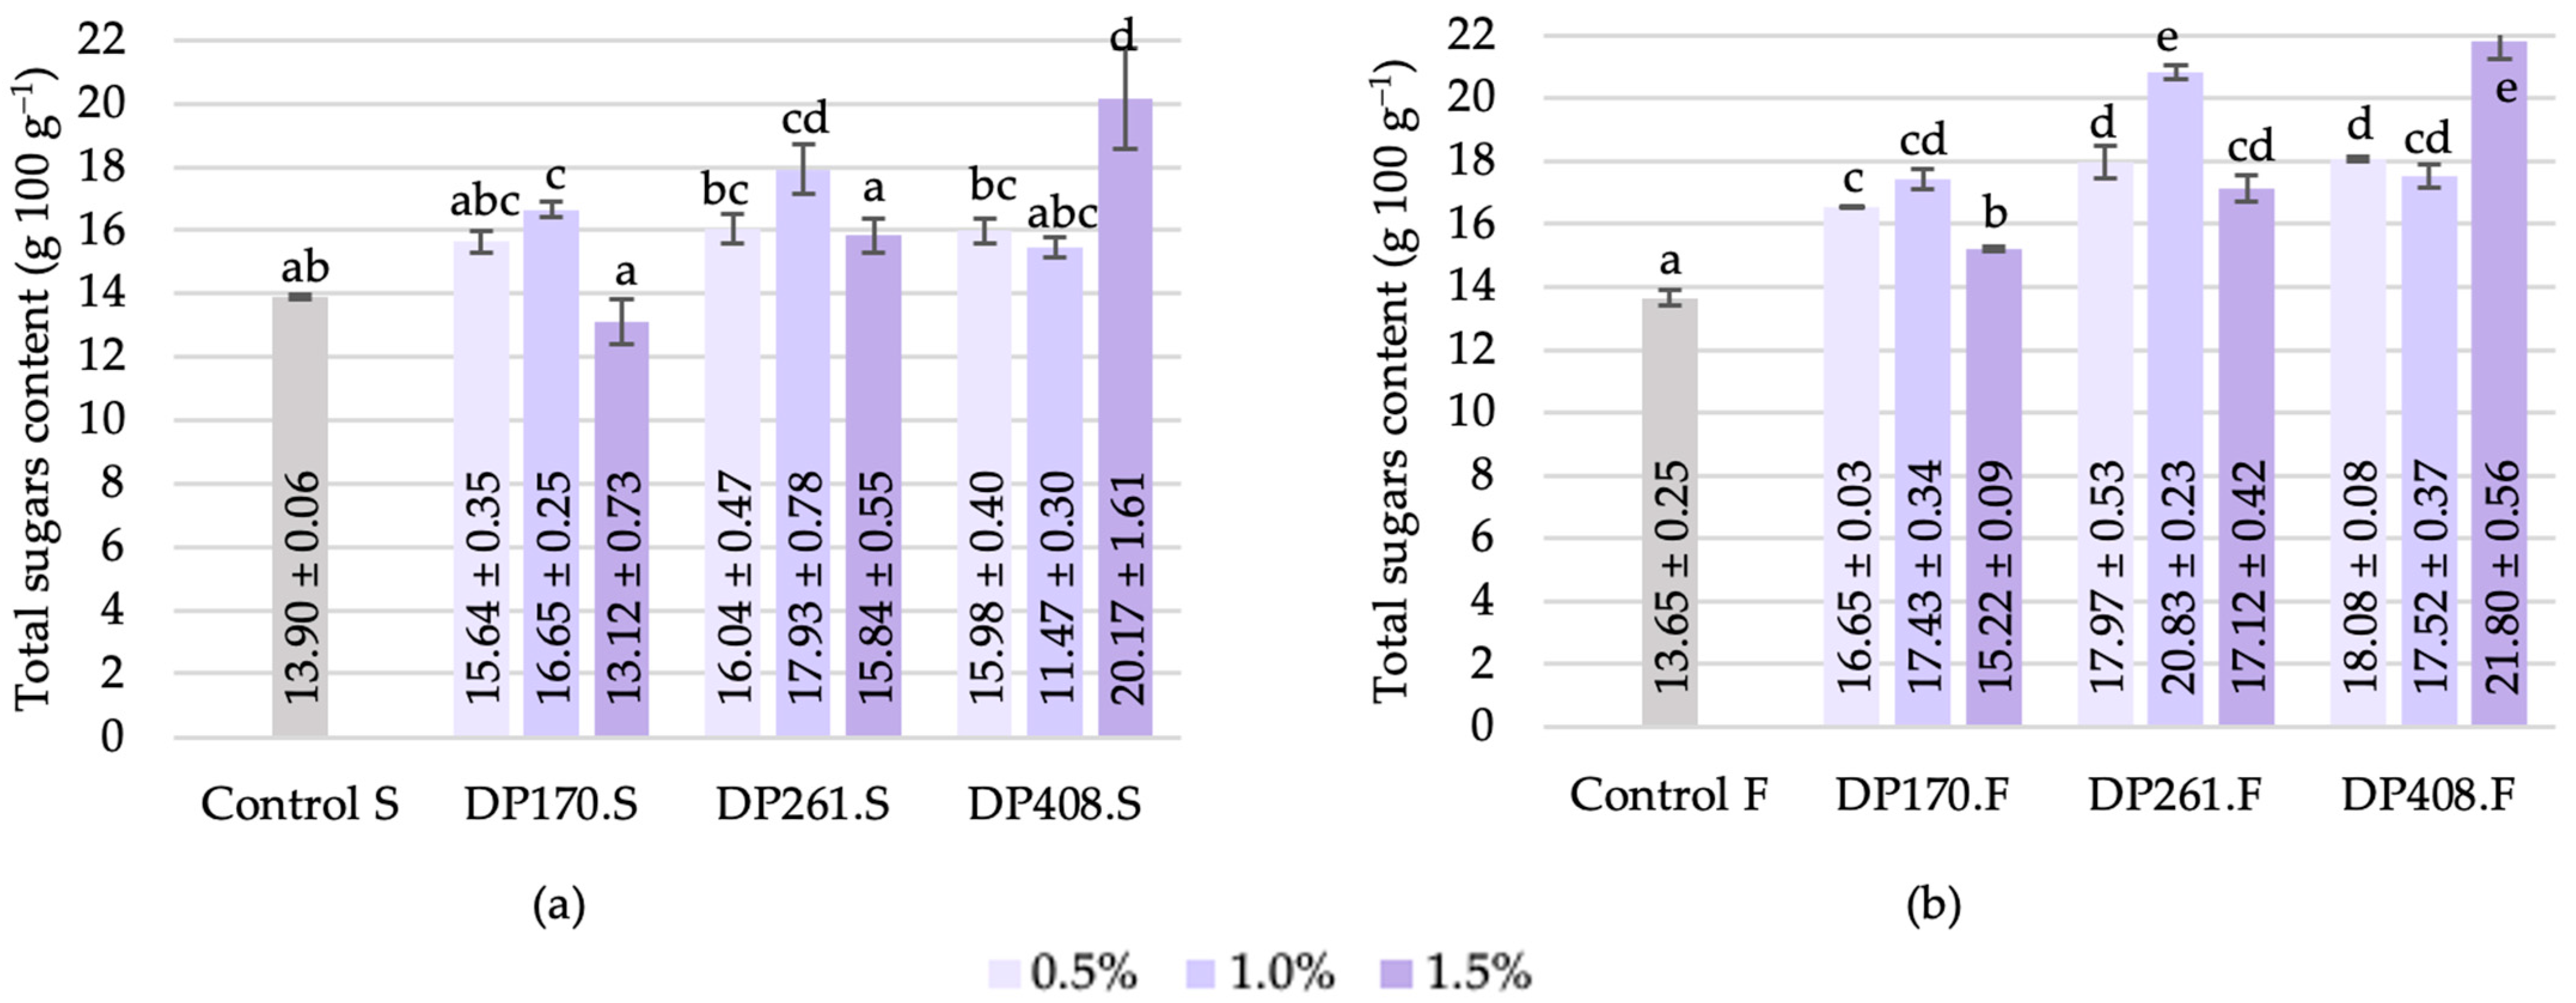
3.3.6. Total Sugars
4. Conclusions
Supplementary Materials
Author Contributions
Funding
Institutional Review Board Statement
Informed Consent Statement
Data Availability Statement
Acknowledgments
Conflicts of Interest
References
- Sarand, I.; Traksmaa, A.; Klava, D.; Kunkulberga, D.; Straumite, E.; Galoburda, R.; Murniece, R.; Juodeikiene, G.; Bartkevics, V.; Bartkiene, E. Traditional Breads from the Baltic Countries (Estonia, Latvia, Lithuania). In Traditional European Breads: An Illustrative Compendium of Ancestral Knowledge and Cultural Heritage; Garcia-Vaquero, M., Pastor, K., Orhun, G.E., McElhatton, A., Rocha, J.M.F., Eds.; Springer Nature AG: Cham, Switzerland, 2023; pp. 41–59. ISBN 9783031233517. [Google Scholar]
- Salmenkallio-Marttila, M.; Hovinen, S. Enzyme Activities, Dietary Fibre Components and Rheological Properties of Wholemeal Flours from Rye Cultivars Grown in Finland. J. Sci. Food Agric. 2005, 85, 1350–1356. [Google Scholar] [CrossRef]
- Klava, D.; Kunkulberga, D.; Duka, G.; Murniece, R. Traditional Latvian Sourdough Rye Bread; Garcia-Vaguero, M., Pastor, K., Orhun, G.E., McElhatton, A., Rocha, J.M.F., Eds.; Springer Nature AG: Cham, Switzerland, 2023; ISBN 9783031233517. [Google Scholar]
- Li, H.F.; Dai, F.J.; Zhang, L.L.; Li, Z.J. Characterization of Scalded Dough and Its Impact on the Growth of Mixed Yeasts Originating from Jiaozi. Food Biosci. 2022, 49, 101920. [Google Scholar] [CrossRef]
- Klupsaite, D.; Starkute, V.; Zokaityte, E.; Cernauskas, D.; Mockus, E.; Kentra, E.; Sliazaite, R.; Abramaviciute, G.; Sakaite, P.; Komarova, V.; et al. The Contribution of Scalded and Scalded-Fermented Rye Wholemeal Flour to Quality Parameters and Acrylamide Formation in Semi-Wheat-Rye Bread. Foods 2023, 12, 937. [Google Scholar] [CrossRef] [PubMed]
- Khalil, A.H.; Mansour, E.H.; Dawoud, F.M. Influence of Malt on Rheological and Baking Properties of Wheat–Cassava Composite Flours. LWT Food Sci. Technol. 2000, 33, 159–164. [Google Scholar] [CrossRef]
- Lukinac, J.; Jukić, M. Barley in the Production of Cereal-Based Products. Plants 2022, 11, 3519. [Google Scholar] [CrossRef] [PubMed]
- Charmier, L.M.J.; McLoughlin, C.; McCleary, B.V. Diastatic Power and Maltose Value: A Method for the Measurement of Amylolytic Enzymes in Malt. J. Inst. Brew. 2021, 127, 327–344. [Google Scholar] [CrossRef]
- Arends, A.M.; Fox, G.P.; Henry, R.J.; Marschke, R.J.; Symons, M.H. Genetic and Environmental Variation in the Diastatic Power of Australian Barley. J. Cereal Sci. 1995, 21, 63–70. [Google Scholar] [CrossRef]
- Hübner, F.; Schehl, B.D.; Gebruers, K.; Courtin, C.M.; Delcour, J.A.; Arendt, E.K. Influence of Germination Time and Temperature on the Properties of Rye Malt and Rye Malt Based Worts. J. Cereal Sci. 2010, 52, 72–79. [Google Scholar] [CrossRef]
- Hrušková, M.; Švec, I.; Kučerová, I. Effect of Malt Flour Addition on the Rheological Properties of Wheat Fermented Dough. Czech J. Food Sci. 2018, 21, 210–218. [Google Scholar] [CrossRef]
- Vasyukova, A.T.; Kononenko, M.M.; Alekseev, A.E.; Moshkin, A.V.; Tikhonov, D.A. Influence of Malt on the Intensity of the Enzymatic Processes. J. Crit. Rev. 2020, 7, 479–482. [Google Scholar] [CrossRef]
- Muralikrishna, G.; Nirmala, M. Cereal α-Amylases-An Overview. Carbohydr. Polym. 2005, 60, 163–173. [Google Scholar] [CrossRef]
- Georg-Kraemer, J.E.; Mundstock, E.C.; Cavalli-Molina, S. Developmental Expression of Amylases during Barley Malting. J. Cereal Sci. 2001, 33, 279–288. [Google Scholar] [CrossRef]
- Struyf, N.; Verspreet, J.; Courtin, C.M. The Effect of Amylolytic Activity and Substrate Availability on Sugar Release in Non-Yeasted Dough. J. Cereal Sci. 2016, 69, 111–118. [Google Scholar] [CrossRef]
- Kaur, P.; Singh Sandhu, K.; Singh Purewal, S.; Kaur, M.; Kumar Singh, S. Rye: A Wonder Crop with Industrially Important Macromolecules and Health Benefits. Food Res. Int. 2021, 150, 110769. [Google Scholar] [CrossRef] [PubMed]
- Wang, Q.; Li, L.; Zheng, X. A Review of Milling Damaged Starch: Generation, Measurement, Functionality and Its Effect on Starch-Based Food Systems. Food Chem. 2020, 315, 126267. [Google Scholar] [CrossRef]
- Balcerek, M.; Pielech-Przybylska, K.; Dziekońska-Kubczak, U.; Patelski, P.; Strak, E. Fermentation Results and Chemical Composition of Agricultural Distillates Obtained from Rye and Barley Grains and the Corresponding Malts as a Source of Amylolytic Enzymes and Starch. Molecules 2016, 21, 1320. [Google Scholar] [CrossRef]
- Perten, H. Application of the Falling Number Method for Evaluating Alpha-Amylase Activity1. Cereal Chem. 1964, 41, 127–140. [Google Scholar]
- Shao, Y.; Tsai, M.H.; He, Y.; Chen, J.; Wilson, C.; Lin, A.H.M. Reduction of Falling Number in Soft White Spring Wheat Caused by an Increased Proportion of Spherical B-Type Starch Granules. Food Chem. 2019, 284, 140–148. [Google Scholar] [CrossRef]
- Stępniewska, S.; Cacak-Pietrzak, G.; Szafrańska, A.; Ostrowska-Ligęza, E.; Dziki, D. Assessment of the Starch-Amylolytic Complex of Rye Flours by Traditional Methods and Modern One. Materials 2021, 14, 7603. [Google Scholar] [CrossRef]
- Stępniewska, S.; Cacak-Pietrzak, G.; Szafrańska, A.; Ostrowska-Ligęza, E.; Salamon, A.; Kowalska, H. Assessment of the Baking Properties of Rye Flour Based on the Polysaccharide Content and Properties. Appl. Sci. 2024, 14, 2772. [Google Scholar] [CrossRef]
- Buksa, K.; Nowotna, A.; Praznik, W.; Gambuś, H.; Ziobro, R.; Krawontka, J. The Role of Pentosans and Starch in Baking of Wholemeal Rye Bread. Food Res. Int. 2010, 43, 2045–2051. [Google Scholar] [CrossRef]
- Mangan, D.; Szafranska, A.; McKie, V.; McCleary, B.V. Investigation into the Use of the Amylase SD Assay of Milled Wheat Extracts as a Predictor of Baked Bread Quality. J. Cereal Sci. 2016, 70, 240–246. [Google Scholar] [CrossRef]
- Linina, A.; Kunkulberga, D.; Kronberga, A.; Locmele, I. Winter Rye Grain Quality of Hybrid and Population Cultivars. Agron. Res. 2019, 17, 1380–1389. [Google Scholar] [CrossRef]
- Bushuk, W. (Ed.) RYE: Production, Chemistry, and Technology, 2nd ed.; AACC, Inc.: St. Paul, MN, USA, 2001. [Google Scholar]
- Dapcevic, T.; Pojic, M.; Hadnaev, M.; Torbic, A. The Role of Empirical Rheology in Flour Quality Control. Wide Spectra Qual. Control 2011, 01, 335–360. [Google Scholar] [CrossRef]
- AACC 56-81.03; Determination of Falling Number. Approved Methods of the American Association of Cereal Chemists. AACC: St. Paul, MN, USA, 2000.
- ICC 126/1; Method for Using the Brabender Amylograph. ICC: Vienna, Austria, 1992.
- ICC 173-1; Whole Meal and Flour from T. aestivum–Determination of Rheological Behavior as a Function of Mixing and Temperature Increase. ICC: Vienna, Austria, 2011.
- Murniece, R.; Reidzane, S.; Galoburda, R.; Radenkovs, V.; Klava, D. The Impact of Fermented Scald on Rye and Hull-Less Barley Dough and Bread Structure Formation. Foods 2023, 12, 4475. [Google Scholar] [CrossRef]
- AACC 02-52:1999; Hydrogen-Ion Activity (PH)-Electrometric Method. Approved Methods of the American Association of Cereal Chemists. AACC: St. Paul, MN, USA, 2000.
- AACC 02-31.01; Titratable Acidity. AACC: St. Paul, MN, USA, 2000.
- Radenkovs, V.; Juhnevica-Radenkova, K.; Kviesis, J.; Lazdina, D.; Valdovska, A.; Vallejo, F.; Lacis, G. Lignocellulose-Degrading Enzymes: A Biotechnology Platform for Ferulic Acid Production from Agro-Industrial Side Streams. Foods 2021, 10, 3056. [Google Scholar] [CrossRef] [PubMed]
- R Core Team. A Language and Environment for Statistical Computing. R Foundation for Statistical Computing. 2023. Available online: https://www.R-project.org/ (accessed on 19 June 2024).
- Peng, Z.; Jin, Y. Purification, Identification, and Characterization of an Endo-1,4-β-Xylanase from Wheat Malt. Molecules 2020, 25, 1572. [Google Scholar] [CrossRef]
- Autio, K.; Härkönen, H.; Parkkonen, T.; Frigård, T.; Poutanen, K.; Siika-aho, M.; Åman, P. Effects of Purified Endo-β-Xylanase and Endo-β-Glucanase on the Structural and Baking Characteristics of Rye Doughs. LWT Food Sci. Technol. 1996, 29, 18–27. [Google Scholar] [CrossRef]
- Stępniewska, S.; Słowik, E.; Cacak-Pietrzak, G.; Romankiewicz, D.; Szafrańska, A.; Dziki, D. Prediction of Rye Flour Baking Quality Based on Parameters of Swelling Curve. Eur. Food Res. Technol. 2018, 244, 989–997. [Google Scholar] [CrossRef]
- Courtin, C.M.; Delcour, J.A. Arabinoxylans and Endoxylanases in Wheat Flour Bread-Making. J. Cereal Sci. 2002, 35, 225–243. [Google Scholar] [CrossRef]
- Tse, T.; Schendel, R.R. Cereal Grain Arabinoxylans: Processing Effects and Structural Changes during Food and Beverage Fermentations. Fermentation 2023, 9, 914. [Google Scholar] [CrossRef]
- Jaksics, E.; Németh, R.; Farkas, A.; Horváth, R.; Dúzs, D.; Drozdik, Á.A.; Csányi, B.; Bidló, G.; Simon, K.; Tömösközi, S. Comparative Compositional and Functional Characterisation of Rye Varieties and Novel Industrial Milling Fractions. Int. J. Food Sci. Technol. 2022, 57, 4463–4472. [Google Scholar] [CrossRef]
- Sabovics, M.; Straumite, E.; Galoburda, R. Assessment of the Rheological Properties of Flour Using the Mixolab. In Proceedings of the 6th Baltic Conference on Food Science and Technology: Innovations for Food Science and Production, FOODBALT-2011-Conference Proceedings, Jelgava, Latvia, 5–6 May 2011; pp. 33–38. [Google Scholar]
- Aprodu, I.; Banu, I. Milling, Functional and Thermo-Mechanical Properties of Wheat, Rye, Triticale, Barley and Oat. J. Cereal Sci. 2017, 77, 42–48. [Google Scholar] [CrossRef]
- Ask, L.; Nair, B.; Asp, N.G. Effect of Scalding Procedures on the Degradation of Starch in Rye Products. J. Cereal Sci. 1991, 13, 15–26. [Google Scholar] [CrossRef]
- Pejcz, E.; Lachowicz-Wiśniewska, S.; Nowicka, P.; Wojciechowicz-Budzisz, A.; Harasym, J. Enhancing Antioxidant Activity and Modulating FODMAPs Levels in Inoculated Sourdough Rye Bread. LWT 2024, 197, 115905. [Google Scholar] [CrossRef]
- Akamine, I.T.; Mansoldo, F.R.P.; Vermelho, A.B. Probiotics in the Sourdough Bread Fermentation: Current Status. Fermentation 2023, 9, 90. [Google Scholar] [CrossRef]
- Wang, Z.; Wang, L. Impact of Sourdough Fermentation on Nutrient Transformations in Cereal-Based Foods: Mechanisms, Practical Applications, and Health Implications. Grain Oil Sci. Technol. 2024, 7, 124–132. [Google Scholar] [CrossRef]

| Rye Flour Code | Falling Number (s) | Moisture (%) |
|---|---|---|
| RF1 | 346 | 13.79 |
| RF2 | 262 | 14.65 |
| RF3 | 210 | 14.25 |
| Malt Code | Diastatic Power (°WK) | Moisture (%) |
|---|---|---|
| DP170 | 170 | 5.59 |
| DP179 | 179 | 4.60 |
| DP261 | 261 | 4.49 |
| DP362 | 362 | 5.39 |
| DP408 | 408 | 6.23 |
| Ingredients | S-M0.5 (g) | S-M1.0 (g) | S-M1.5 (g) | Control (g) |
|---|---|---|---|---|
| Rye flour (RF2) | 542 | 540 | 537 | 545 |
| Water | 800 | 800 | 800 | 800 |
| Malt | 3 | 5 | 8 | – |
| Reducing Sugar | RF2 | DP170 | DP261 | DP408 |
|---|---|---|---|---|
| g 100 g−1 | g 100 g−1 | g 100 g−1 | g 100 g−1 | |
| Fructose | 0.08 ± 0.00 | 0.08 ± 0.00 | 0.07 ± 0.00 | 0.09 ± 0.00 |
| Glucose | 0.06 ± 0.02 | 0.75 ± 0.01 | 0.50 ± 0.00 | 0.67 ± 0.01 |
| Sucrose | 0.93 ± 0.03 | 2.31 ± 0.00 | 2.39 ± 0.08 | 3.18 ± 0.08 |
| Maltose | 0.05 ± 0.00 | 1.16 ± 0.03 | 0.82 ± 0.01 | 1.29 ± 0.05 |
Disclaimer/Publisher’s Note: The statements, opinions and data contained in all publications are solely those of the individual author(s) and contributor(s) and not of MDPI and/or the editor(s). MDPI and/or the editor(s) disclaim responsibility for any injury to people or property resulting from any ideas, methods, instructions or products referred to in the content. |
© 2024 by the authors. Licensee MDPI, Basel, Switzerland. This article is an open access article distributed under the terms and conditions of the Creative Commons Attribution (CC BY) license (https://creativecommons.org/licenses/by/4.0/).
Share and Cite
Murniece, R.; Reidzane, S.; Radenkovs, V.; Matisons, R.; Dabina-Bicka, I.; Klava, D.; Galoburda, R. Impact of Rye Malt with Various Diastatic Activity on Wholegrain Rye Flour Rheology and Sugar Formation in Scalding and Fermentation Processes. Foods 2024, 13, 2077. https://doi.org/10.3390/foods13132077
Murniece R, Reidzane S, Radenkovs V, Matisons R, Dabina-Bicka I, Klava D, Galoburda R. Impact of Rye Malt with Various Diastatic Activity on Wholegrain Rye Flour Rheology and Sugar Formation in Scalding and Fermentation Processes. Foods. 2024; 13(13):2077. https://doi.org/10.3390/foods13132077
Chicago/Turabian StyleMurniece, Ruta, Sanita Reidzane, Vitalijs Radenkovs, Roberts Matisons, Ilona Dabina-Bicka, Dace Klava, and Ruta Galoburda. 2024. "Impact of Rye Malt with Various Diastatic Activity on Wholegrain Rye Flour Rheology and Sugar Formation in Scalding and Fermentation Processes" Foods 13, no. 13: 2077. https://doi.org/10.3390/foods13132077
APA StyleMurniece, R., Reidzane, S., Radenkovs, V., Matisons, R., Dabina-Bicka, I., Klava, D., & Galoburda, R. (2024). Impact of Rye Malt with Various Diastatic Activity on Wholegrain Rye Flour Rheology and Sugar Formation in Scalding and Fermentation Processes. Foods, 13(13), 2077. https://doi.org/10.3390/foods13132077