Article

A Novel Mutation of the NARROW LEAF 1 Gene Adversely Affects Plant Architecture in Rice (Oryza sativa L.)

by
Prasanta K. Subudhi
1,*,
Richard S. Garcia
1,
Sapphire Coronejo
1 and
Teresa B. De Leon
2
1
School of Plant, Environmental, and Soil Sciences, Louisiana State University Agricultural Center, Baton Rouge, LA 70803, USA
2
California Cooperative Rice Research Foundation, Inc., Biggs, CA 95917, USA
*
Author to whom correspondence should be addressed.
Int. J. Mol. Sci. 2020, 21(21), 8106; https://doi.org/10.3390/ijms21218106
Submission received: 7 August 2020 / Revised: 25 September 2020 / Accepted: 26 October 2020 / Published: 30 October 2020
(This article belongs to the Section Molecular Plant Sciences)

Abstract

:
Plant architecture is critical for enhancing the adaptability and productivity of crop plants. Mutants with an altered plant architecture allow researchers to elucidate the genetic network and the underlying mechanisms. In this study, we characterized a novel nal1 rice mutant with short height, small panicle, and narrow and thick deep green leaves that was identified from a cross between a rice cultivar and a weedy rice accession. Bulked segregant analysis coupled with genome re-sequencing and cosegregation analysis revealed that the overall mutant phenotype was caused by a 1395-bp deletion spanning over the last two exons including the transcriptional end site of the nal1 gene. This deletion resulted in chimeric transcripts involving nal1 and the adjacent gene, which were validated by a reference-guided assembly of transcripts followed by PCR amplification. A comparative transcriptome analysis of the mutant and the wild-type rice revealed 263 differentially expressed genes involved in cell division, cell expansion, photosynthesis, reproduction, and gibberellin (GA) and brassinosteroids (BR) signaling pathways, suggesting the important regulatory role of nal1. Our study indicated that nal1 controls plant architecture through the regulation of genes involved in the photosynthetic apparatus, cell cycle, and GA and BR signaling pathways.

1. Introduction

Plant architecture is a three-dimensional arrangement of plant organs [1]. It plays an important role in enhancing agronomically important traits and the adaptability of plants. Although plant architecture to some extent is influenced by environmental factors such as light, temperature, plant density, and humidity, it is inherently complex due to the involvement of multiple molecular regulatory mechanisms and hormone signaling pathways influencing several component traits. Elucidation of the molecular mechanisms underlying rice plant architecture provides a foundation for designing crop plants that can efficiently harvest light energy, absorb nutrients, resist diseases and pests, and accommodate high-density planting for improved crop yield and quality.
Phenotypic mutants (both spontaneous and induced) are important resources for the functional characterization of relevant genes using both forward and reverse genetics approaches [2]. A large number of mutants have been generated using physical mutagens, chemical mutagens, and transposable elements for systematic functional genomics studies [3]. The availability of genome sequences, and genetic and physical maps of crop plants is accelerating the cloning and molecular genetic characterization of traits relevant for agronomic and evolutionary studies. Mutants that are defective in plant architecture allow researchers to elucidate the genetic network and the underlying mechanisms that can aid in manipulating plant ideotype for crop improvement [1,4].
Rice is an ideal model for basic and applied research and is as attractive as Arabidopsis due to its small genome size, well-developed transformation system, availability of abundant germplasm, and genomic resources. The rice plant displays a variety of architectures that are determined by a constellation of traits such as plant height, tiller number, tiller angle, leaf length, leaf width, leaf angle, and panicle and grain characteristics, which are crucial for improved productivity. Genes responsible for many of these component traits have been cloned: plant height [5], internode length [6], leaf morphology [7], leaf length [8,9], and panicle characteristics [10,11].
Optimal leaf characteristics are crucial for improving rice yield. Natural variations in leaf size have been reported among rice accessions [12]. A dwarf narrow leaf mutant (nal1) had a defective vascular system with decreased number of longitudinal veins due to defective polar auxin transport [13]. Nal1 (LOC_Os04g52479) encodes a putative trypsin-like serine and cysteine protease. It was the focus of several subsequent investigations, which demonstrated its potential in enhancing rice productivity [14,15,16]. These studies have shown that some major quantitative trait loci (QTL) allelic to Nal1 pleiotropically affect yield-enhancing traits. The GREEN FOR PHOTOSYNTHESIS (GPS) QTL in rice was identical to Nal1, in which increased photosynthesis was conferred by a partial loss-of-function allele [15]. The superior Nal1 allele increased mesophyll cell number, leaf thickness, and photosynthesis rate with no undesirable phenotype such as dwarf stature, as seen in nal1 mutants. A major QTL (qLSCHL4) for flag leaf shape and chlorophyll content was allelic to the Nal1 locus [16]. Their overexpression and near-isogenic lines analyses demonstrated the utility of Nal1 in enhancing chlorophyll content, flag leaf size, and plant type. The gene, SPIKELET NUMBER (SPIKE), identified in a tropical japonica landrace, was allelic to Nal1 that enhanced yield in indica cultivars by increasing spikelet number, leaf size, root system, and number of vascular bundles [14]. A major QTL for flag leaf width (qFLW) colocalized with this locus and alternate splicing was cited as the cause for the functional difference between both alleles [17]. Regulation of the source–sink relationship by the Nal1 locus has been reported [18].
Analysis of Nal1 mutants revealed that they control leaf width and plant height by regulating cell division at the beginning of leaf development [19]. They regulate both leaf and adventitious root development at the transcriptional level [20]. Taguchi-Shiobara et al. [21] identified a significant QTL for flag leaf width corresponding to Nal1. Based on the examination of the role of nal1, nal2, nal3, and nal7 mutants in the regulation of leaf width and vein number, it was concluded that these genes play different roles in controlling narrow leaf phenotypes [22]. In a study involving nonallelic narrow leaf mutants, Nal2 and Nal3 [9], the expression levels of auxin-transport and leaf development-related genes were altered. An RNA-Seq experiment conducted using leaves of a 40 day-old nal1 mutant and wild-type revealed that a large number of genes involved in cell wall formation were downregulated [23]. Another study showed that Nal1 interacts with the FRIZZY PANICLE (FZP) gene and promotes its degradation. The downregulation of the FZP gene or upregulation of Nal1 was suggested to increase the grain yield by increasing the number of secondary branches and grain number [24].
Despite the role of Nal1 in a wide array of plant development processes, as described in the above studies, further investigation is needed to understand the molecular basis of pleiotropic effects of this important gene on agronomically important traits. The discovery of a deletion in the nal1 locus and its deleterious impact on plant architecture led us to hypothesize that the mutation in this locus alters the regulation of genes involved in several developmental and hormonal signaling pathways, leading to undesirable morphological changes. In this study, we characterized a spontaneous mutant with altered plant architectural attributes such as short height, small panicles, increased chlorophyll content (SPAD values), and narrow and thick deep green leaves identified from an advanced backcross population from the cross between a cultivated rice and a weedy rice accession. Bulked segregant analysis coupled with whole-genome re-sequencing and cosegregation analysis in two mapping populations revealed that the overall phenotype was controlled by the mutant nal1 gene with recessive inheritance. The drastic changes in plant architecture was caused by a deletion spanning over the last two exons, 3′ untranslated region (UTR), and a part of the intergenic region between Nal1 and the adjacent gene resulting in formation of chimeric transcripts. Although Nal1 natural variants were reported to impart beneficial effects leading to increased productivity and enhanced photosynthetic activity, detrimental effects of a nal1 mutant were demonstrated in this study.

2. Results

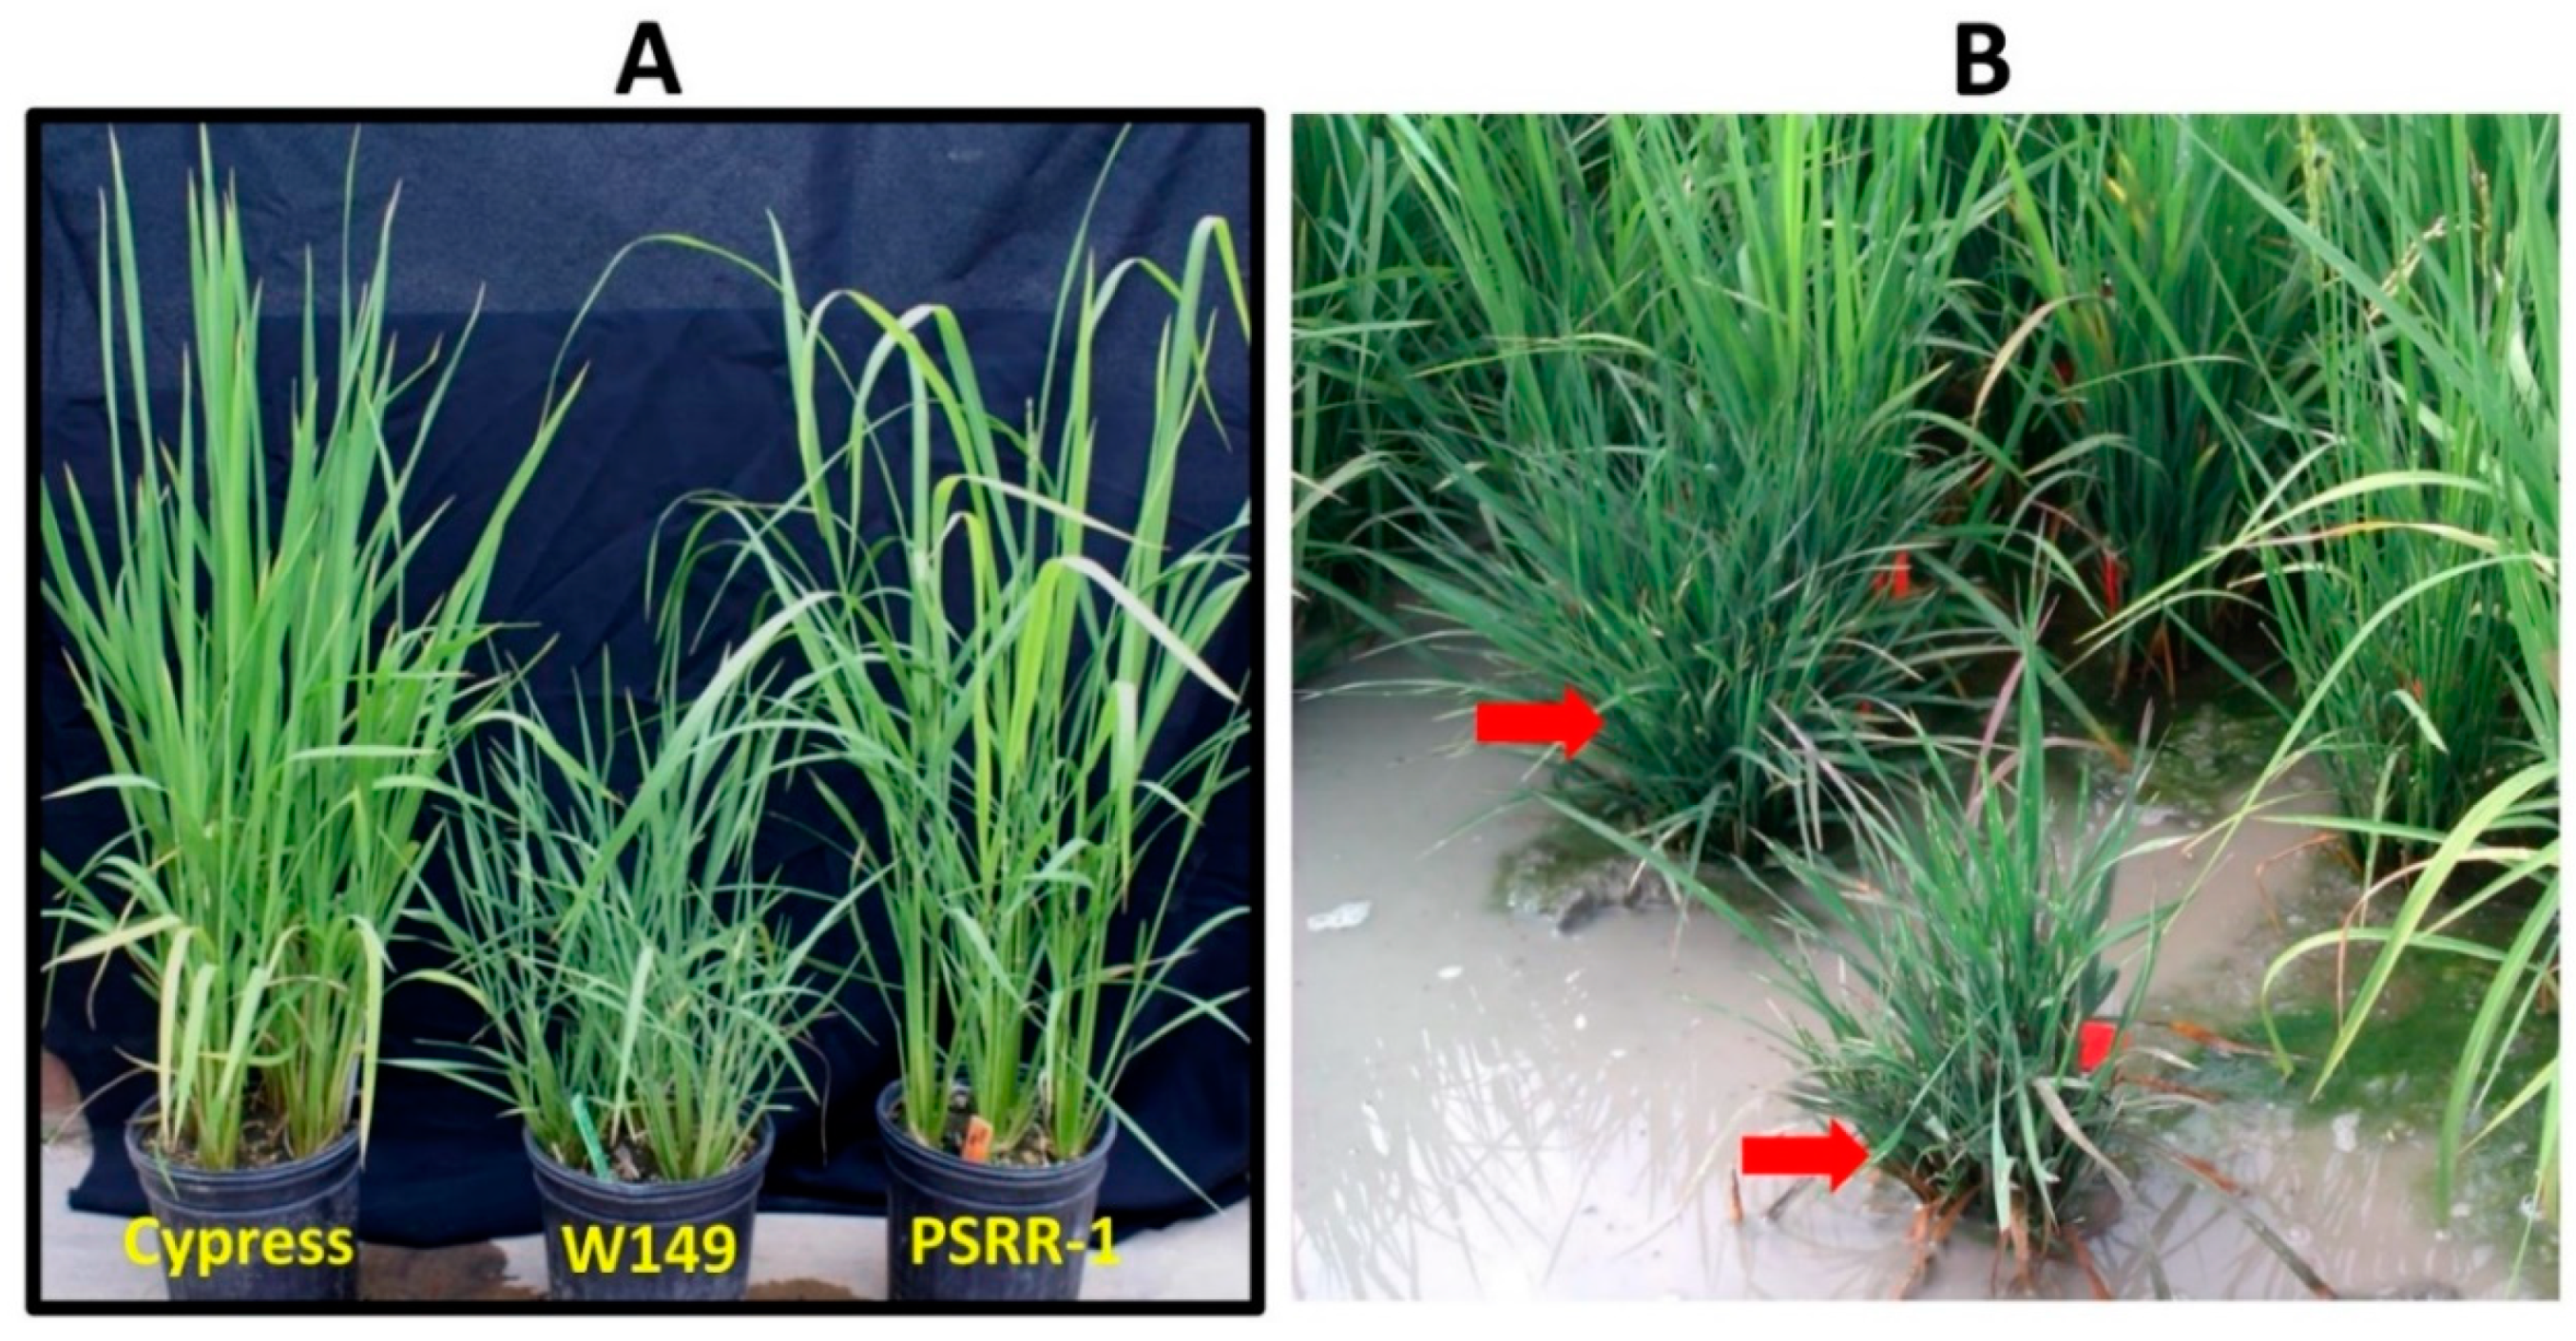
2.1. Phenotypic Characterization of the W149 Mutant

W149 had a shorter plant height with more tillers, shorter and narrower leaves, and higher chlorophyll content than Cypress (recurrent parent) (Table 1; Figure 1). W149 plants were 40% shorter than Cypress. The panicle length and all internodes of W149 were significantly shorter than Cypress, except for internode II. The panicle length had the most contribution to the total culm length of both Cypress and W149. In Cypress, the contribution of internodes toward the total culm length was I > III > V > IV > II, whereas the internode order was I > II > III > V > IV in W149 (Figure S1). There was a significant reduction in the culm area in W149 compared with Cypress. However, the stem vascular system did not show noticeable abnormality (Figure S2). The leaf vascular systems of Cypress and W149 showed no significant differences in the number of major/large veins (LV), but the reduction in minor/small veins (SV) between LV was apparent in W149. There were five to seven SV between LV in Cypress leaves compared to two to five in W149. In addition, the midribs of Cypress leaves were more prominent than W149. The interveinal distance (IVD) was shorter in W149 compared to Cypress. The shortening of IVD in W149, along with a reduced number of SV, contributed to the narrowing of the leaves. Another distinguishing feature of the W149 mutant was its leaf thickness (Table 1). Compared to Cypress, W149 leaves were 55% thicker due to more bundle sheath extensions and larger bundle sheath cells (BSC). The vascular bundle (VB) area was larger in W149 leaves than in Cypress leaves. However, no difference was found in the mesophyll cell (MC) area between Cypress and W149. In addition, W149 leaves were deep green with a higher SPAD reading than Cypress leaves.

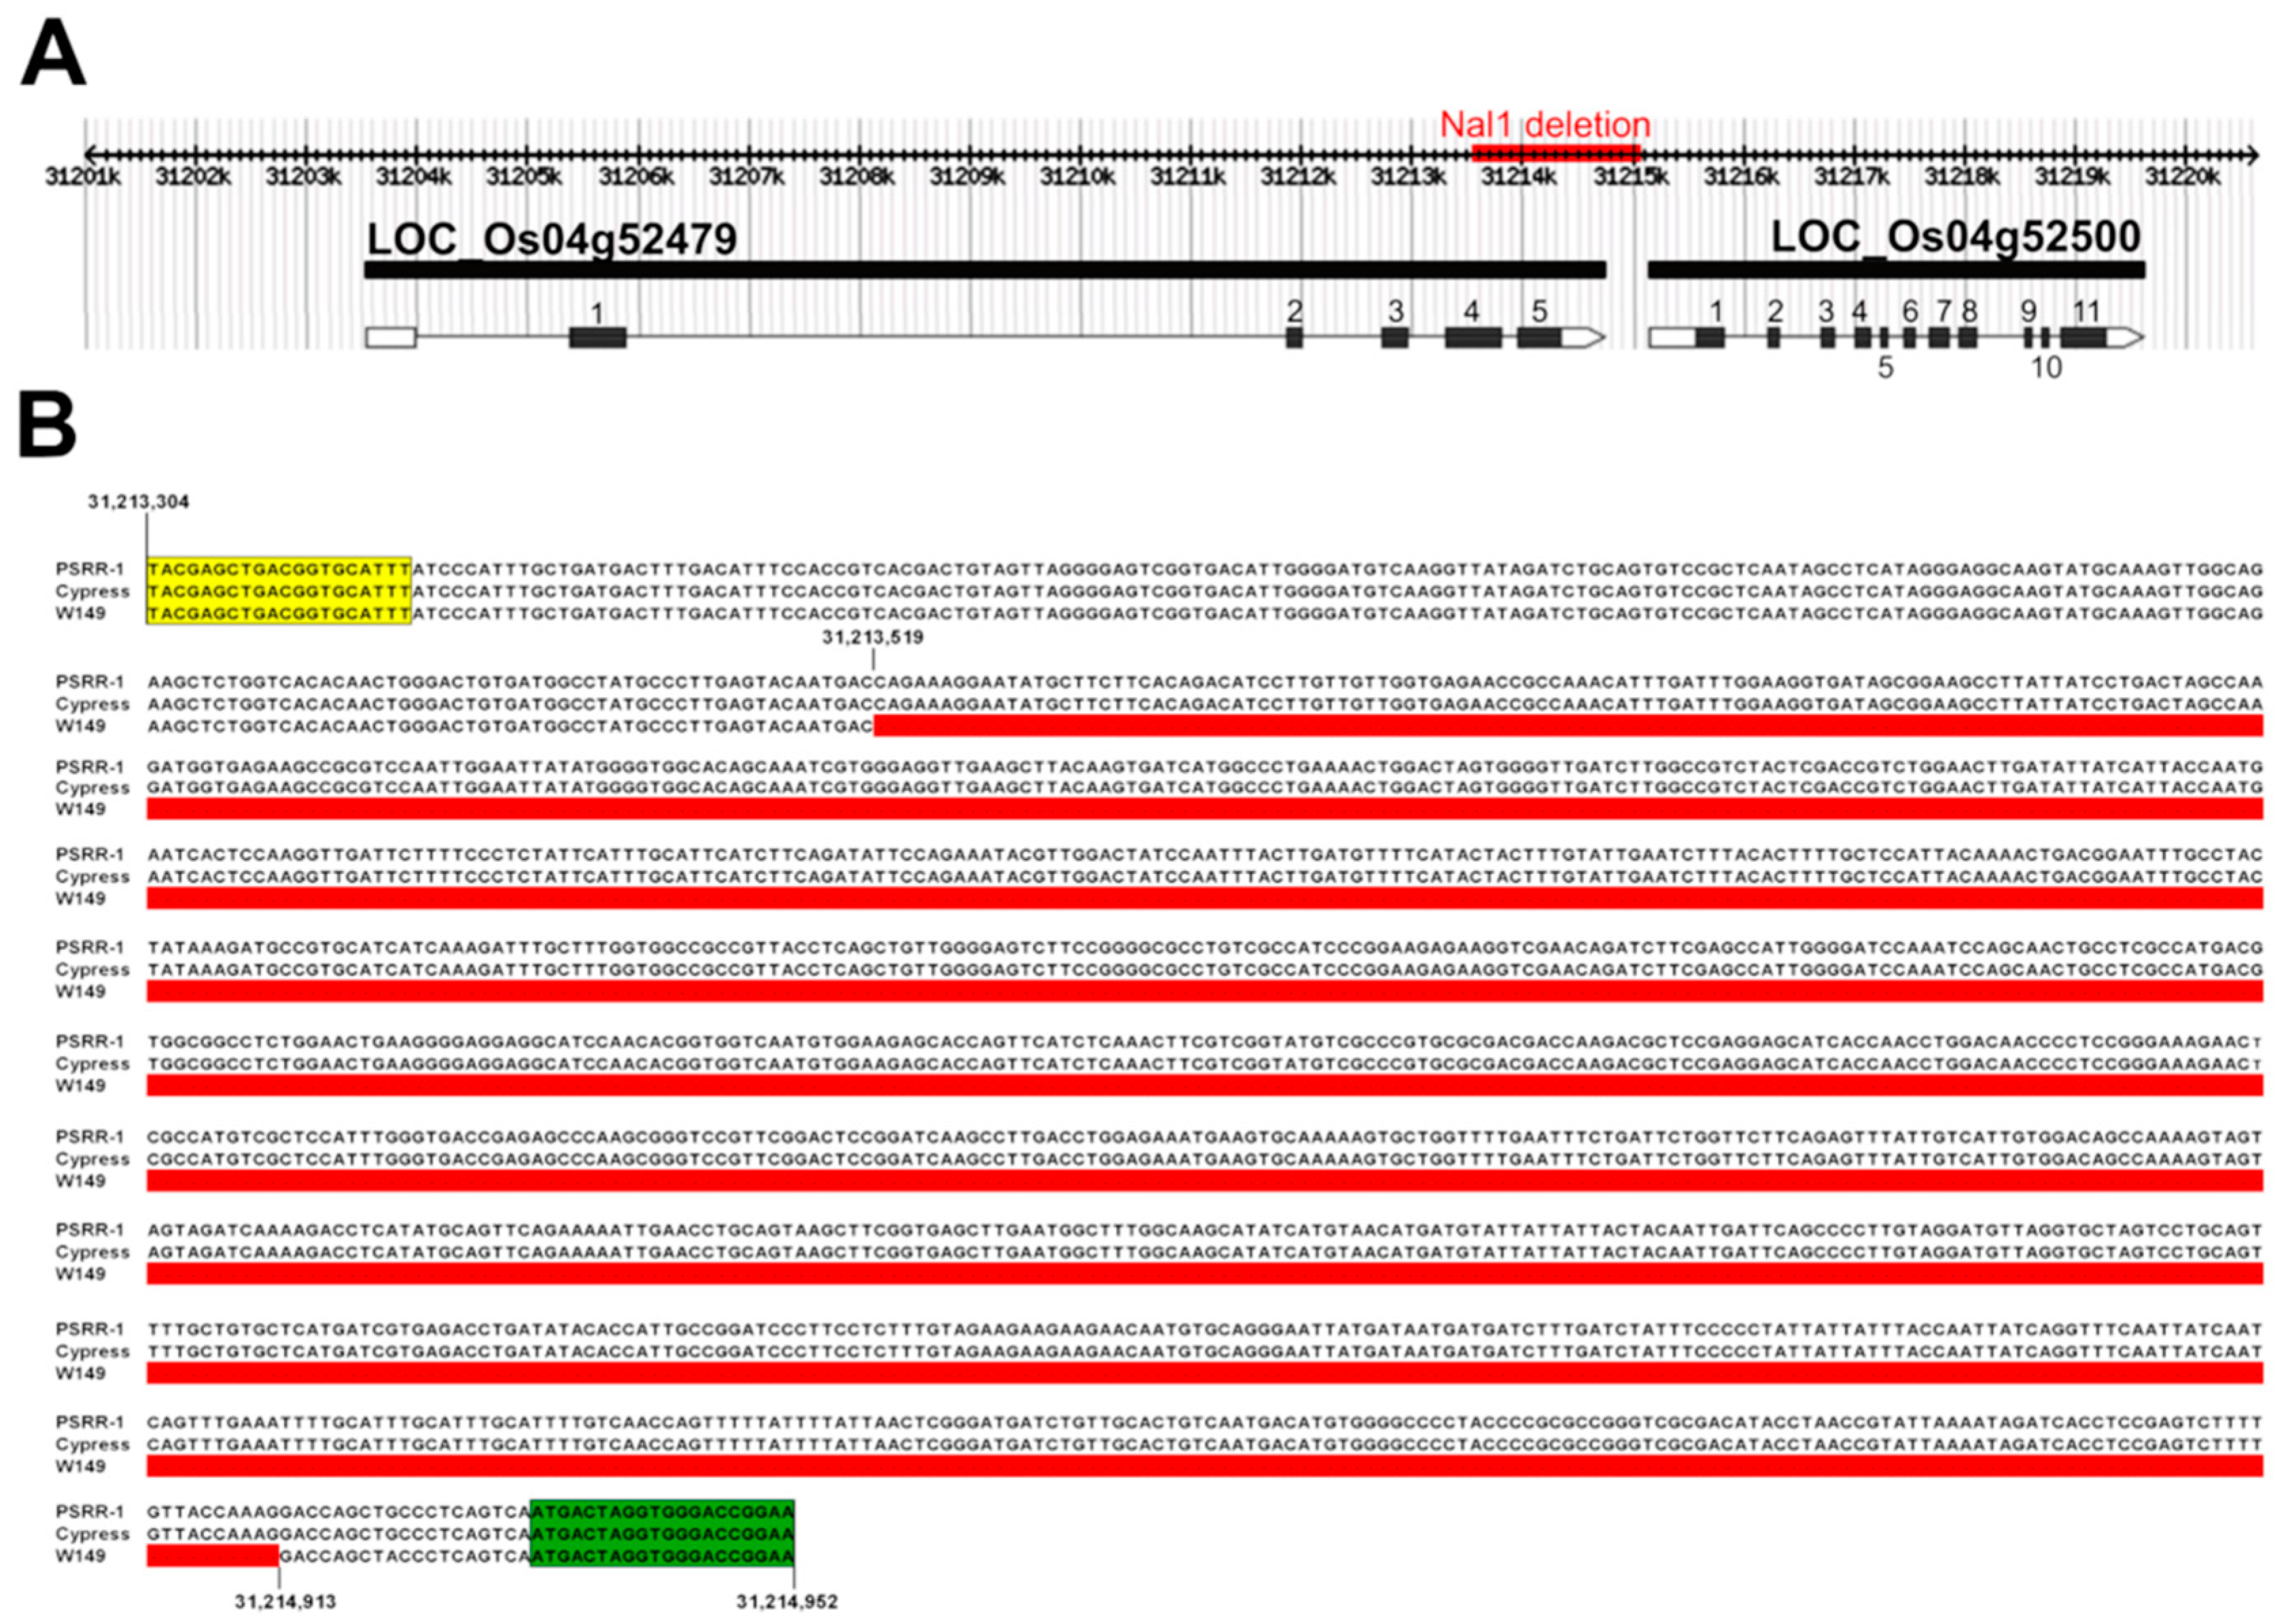
2.2. Bulked Segregant Analysis and Whole-Genome Sequencing Reveals Involvement of Nal1 Locus

Morphological evaluation of 1200 F2 plants from the W149 × Cypress cross showed 279 plants with mutant phenotype, which fit into the 3 normal:1 mutant ratio. To confirm that the W149 with altered plant architecture is a mutant rather than an introgression line, a W149 × PSRR-1 F2 population was generated. Morphological evaluation of 191 F2 plants showed 51 mutant phenotypes with monogenic segregation, an observation consistent with the earlier result. Both hybrids from W149 × Cypress and W149 × PSRR-1 cross-combinations also showed normal morphology, suggesting involvement of a recessive gene controlling the overall mutant phenotype. Bulked segregant analysis (BSA) using the normal and mutant plants from the W149 × PSRR-1 F2 population showed several markers with clear linkage on chromosome 4. A partial linkage map generated using polymorphic markers indicated that the putative mutant locus was located between RM255 and RM3836 (Figure S3).
Whole-genome sequences of W149, Cypress, and PSRR-1 were assembled, and coverages were 12×, 21×, and 35×, respectively. The counts of the identified variants such as single nucleotide polymorphism (SNPs) and insertions-deletions (InDels) revealed 97.1% Cypress-specific variants and only 2.9% PSRR-specific variants, indicating W149 to be nearly isogenic to Cypress (Table S1). As BSA analysis earlier revealed the presence of the mutant locus between RM255 and RM3836 on chromosome 4, genomic sequences of W149 and Cypress for this region were compared. Although there were no nonsynonymous SNPs or InDels, a large deletion (1395-bp) in the Nal1 locus (LOC_Os04g52479) was detected in W149. The deletion spanned a part of the exon 4, exon 5, 3‘untranslated region (UTR), and several base pairs of the Nal1 downstream region (Figure 2). The deletion was absent in both PSRR-1 and Cypress and was confirmed by sequencing of the PCR fragments flanking the deletion. The deleted region was present between the genomic coordinates 31,213,519 and 31,214,913 on chromosome 4.

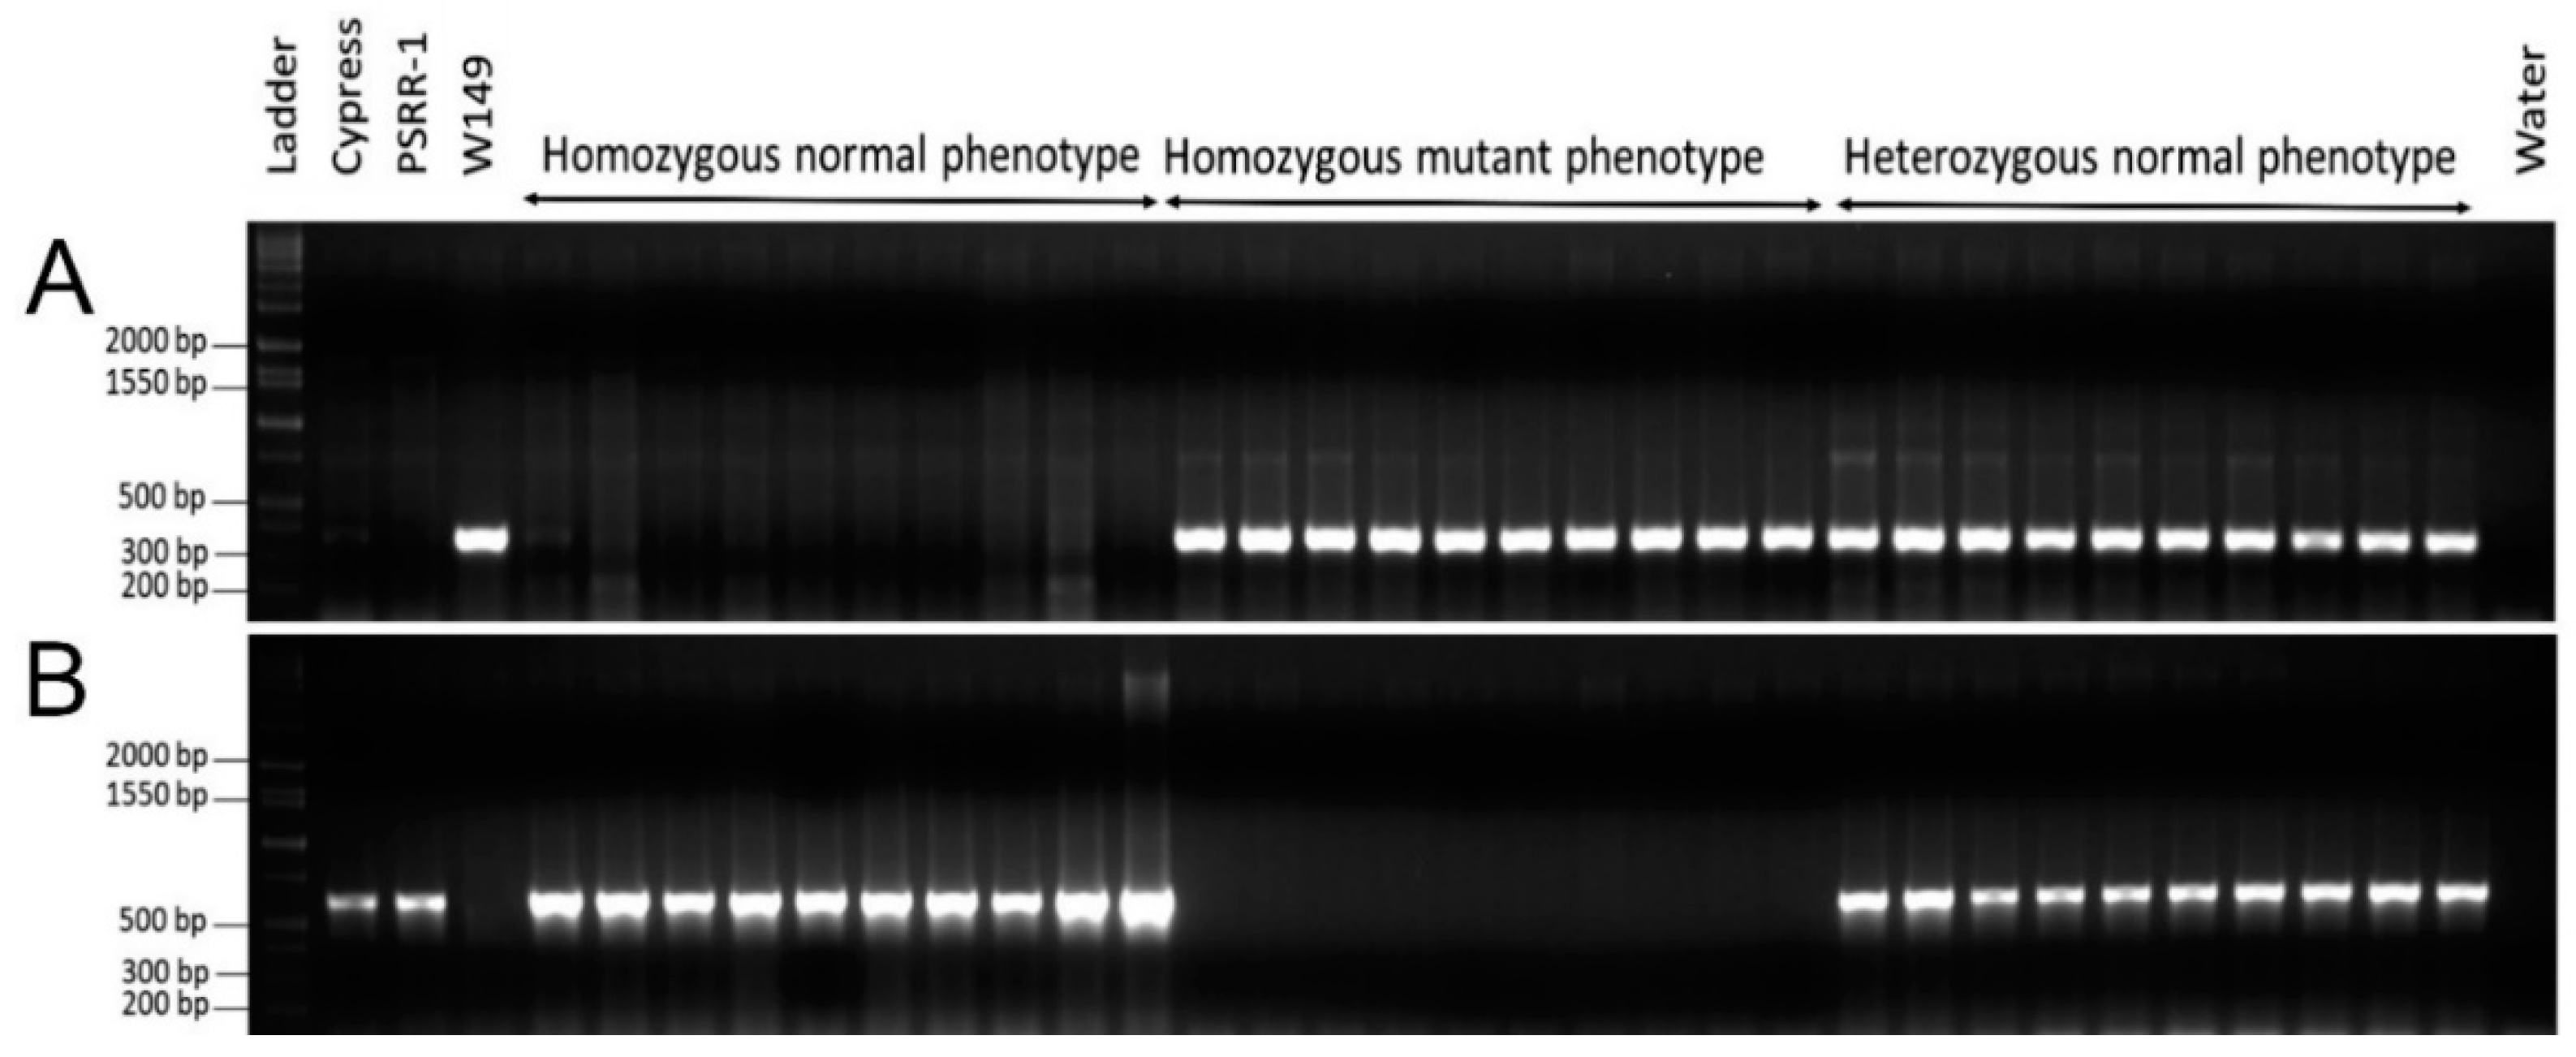
2.3. Genotyping and Phenotyping in Crosses Involving W149

The populations from W149 × Cypress and W149 × Bengal crosses consisted of 340 and 319 F2 plants, respectively. Gross morphological assessment of the F2 populations from W149 × Cypress and W149 × Bengal crosses showed 83 and 72 plants with mutant phenotypes, respectively, which fit into a segregation ratio of 3 normal:1 mutant. The genotyping result using the nal1 gene primer pairs matched with the phenotyping results in both populations, W149 × Cypress (Figure 3) and W149 × Bengal (Figure S4), confirming the nal1 gene as responsible for the mutant phenotype in W149 and the mutant phenotype as a recessive trait. Few heterozygous F2 plants from both crosses, which were confirmed by nal1 genotyping, were selected and advanced to F3 generation. Both phenotyping and genotyping in F3 generation further confirmed the cosegregation of the nal1 deletion mutation with overall mutant phenotype (Tables S2 and S3).

2.4. Hormonal Response

Despite the role of auxins in shoot elongation, there was reduction in plant height and root length in Indole-3-butyric acid (IBA), 1-Naphthaleneacetic acid (NAA), and 2,4-dichlorophenoxyacetic acid (2,4-D) treatments (Figure 4). The reduction in plant height was greater for IBA and NAA treatments in W149 compared with Cypress, and the root length showed the same trend for only 2,4-D treatment. On the contrary, GA3 increased both traits in Cypress and W149. Although there was a positive response to GA application on the plant height and root length of W149, the response to GA3 was significantly greater for plant height in W149 compared with Cypress. The application of GA was able to rescue the W149 by increasing plant height and root length like Cypress.

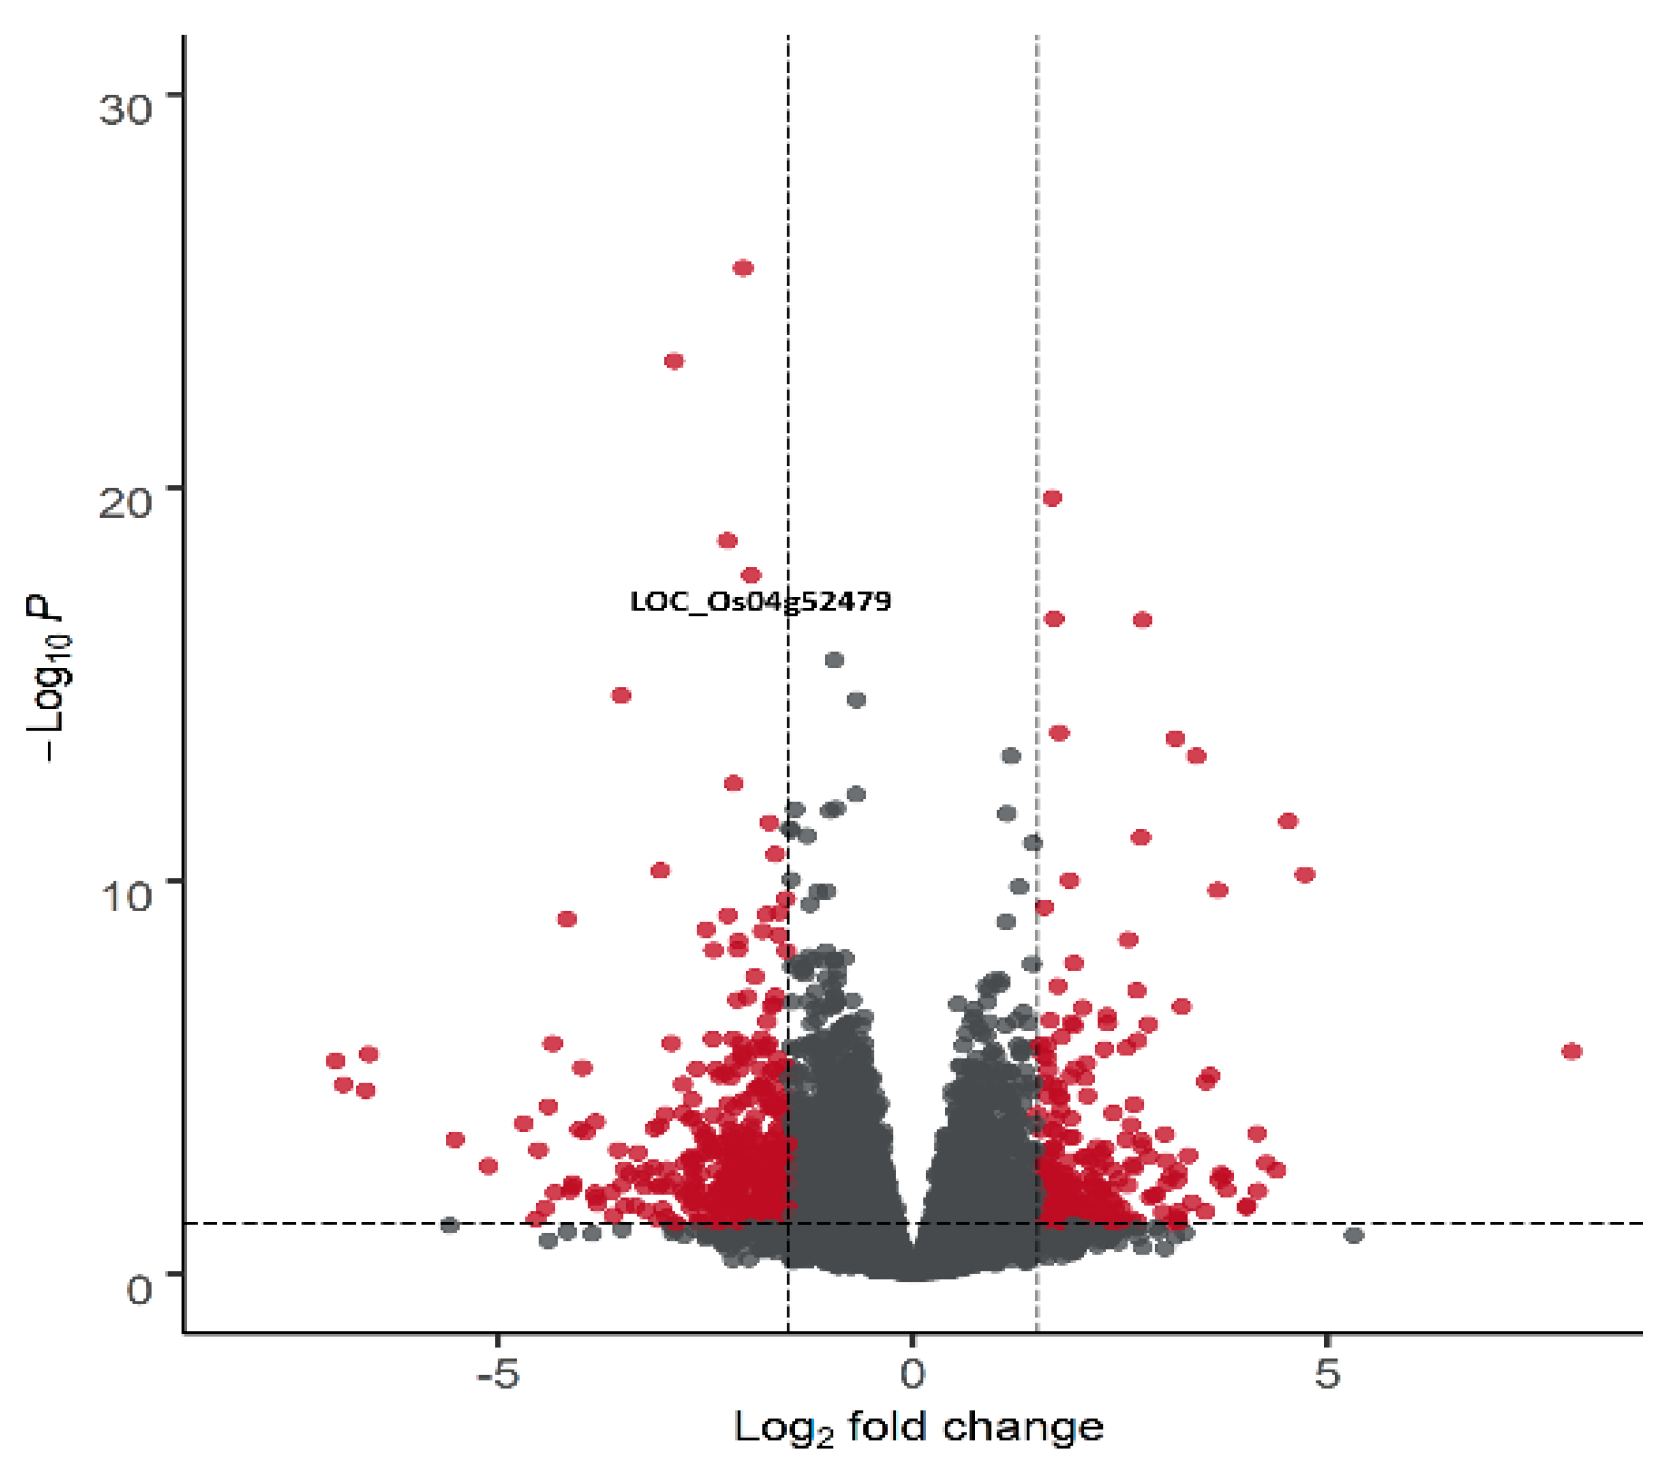
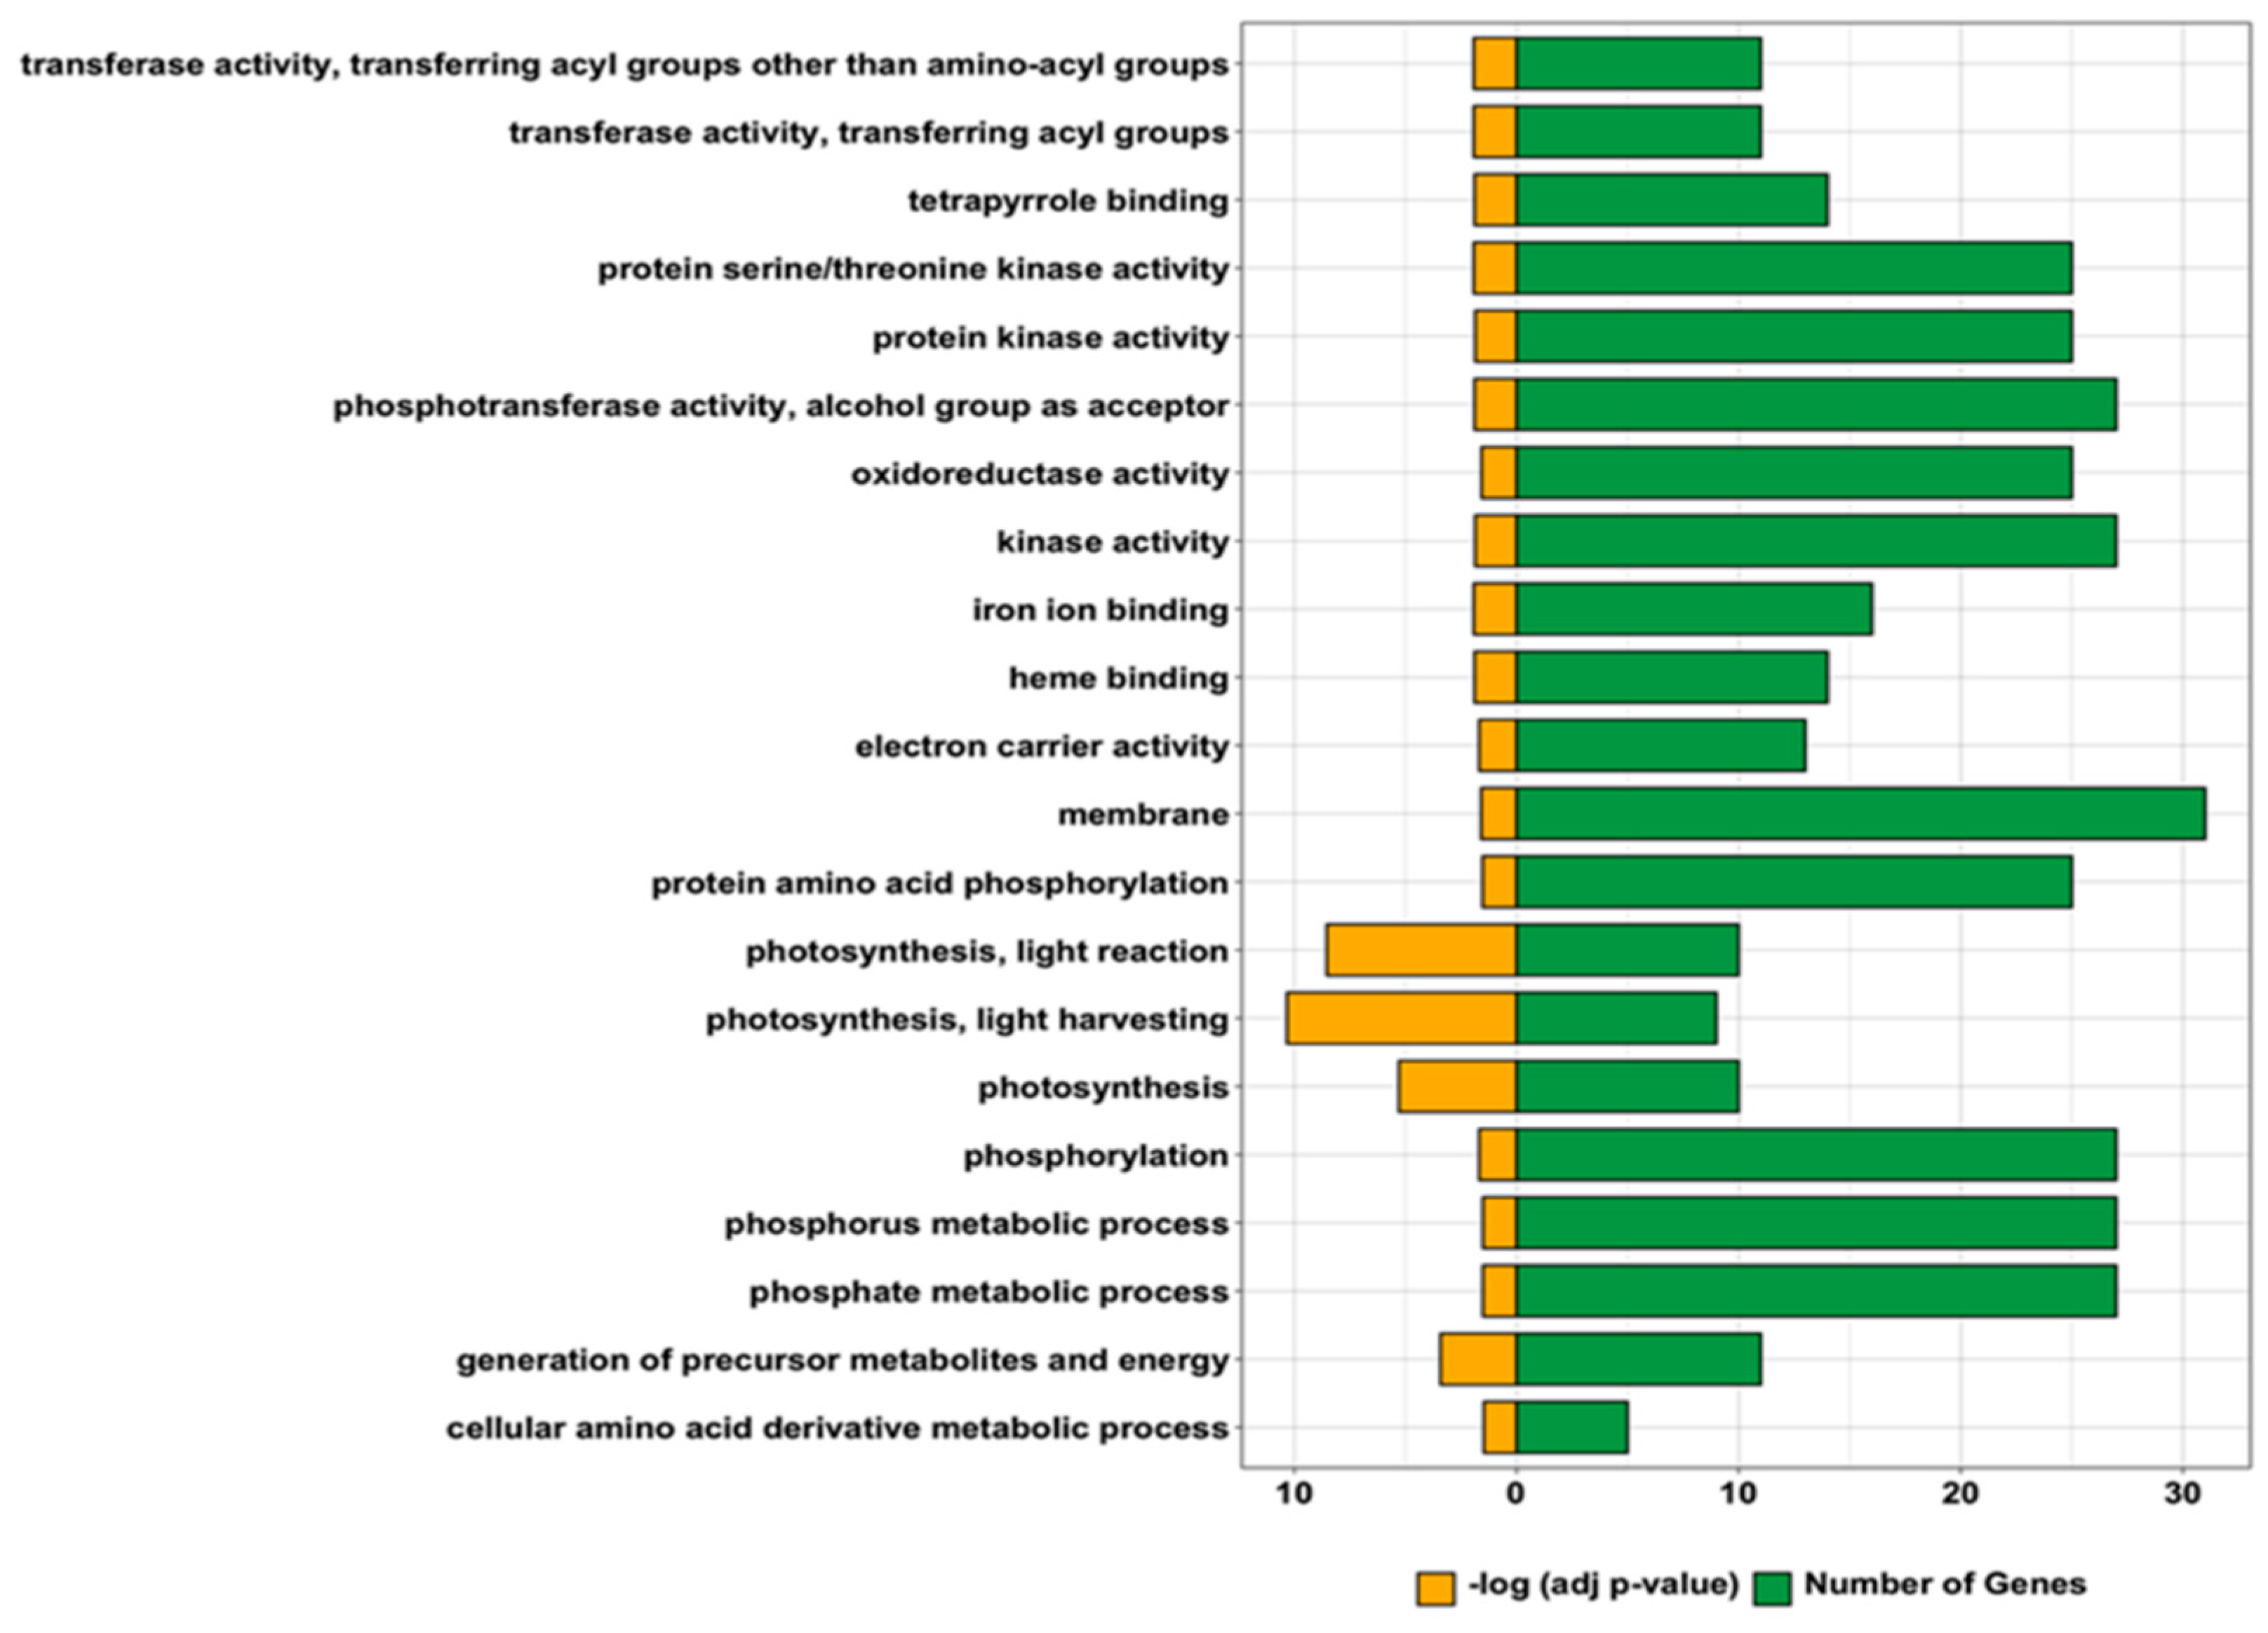
2.5. Comparative Transcriptomics

We compared the expression profiles of W149 and Cypress to identify the differentially expressed genes (DEGs). An average of 48 and 51 million reads was obtained from Cypress and W149, respectively, with a mapping rate of 95% to the reference genome in both (Table S4). Three hundred and thirty DEGs were identified in W149 compared with Cypress (Figure 5; Table S5). Among these, 122 genes were upregulated and 208 genes were downregulated. From the 330 DEGs, 186 are annotated in the agriGOv2.0 database and 99 DEGs were classified with significant gene ontology (GO) terms. Twenty-one GO terms were significantly enriched in W149. These included 9 GO terms in biological processes (e.g., photosynthesis, phosphorylation, cellular amino acid derivative metabolic process), 11 in molecular function (e.g., protein serine/threonine kinase activity, oxidoreductase activity, transferase activity), and 1 in cellular component (membrane) (Figure 6).
We further filtered the 330 DEGs to identify genes that are putatively involved in the mutant phenotype regulated by the nal1 locus. As SNPs, InDels, and structural variations (SVs) may alter the gene expression, we examined the sequences of DEGs from the whole-genome sequence data and identified 58 genes including nal1 under this category (Table S5). The remaining DEGs were checked using the KEGG (Kyoto Encyclopedia of Genes and Genomes) database (www.genome.jp/kegg/kegg1.html) for possible involvement within common network pathways. To illustrate, LOC_Os06g40970 and LOC_Os12g09770 were differentially expressed due to the SNPs and fall in the same KEGG pathway (phenylpropanoid biosynthesis). However, there were DEGs such as LOC_Os03g13210, LOC_Os03g55420, LOC_Os04g59200, and LOC_Os08g02110, which have no genetic mutation but were present in the phenylpropanoid biosynthesis pathway. LOC_Os06g40970 (DEG with genetic mutation) and LOC_Os03g13210, LOC_Os03g55420, LOC_Os04g59200, and LOC_Os08g02110 (DEGs without genetic mutation) were in the same enzyme class (peroxidases) and phenylpropanoid biosynthesis pathway, which converts p-coumaryl alcohol to p-hydroxy-phenyl lignin. Hence, the differential expression may be due to such interactions. After eliminating such genes, 263 DEGs most likely regulated by nal1 were finally selected (Table S6). These genes were initially GO-enriched and were manually curated for their biological functions using Phytozome, RAP-DB databases, and available literatures. Grouping of these genes was done according to their biological functions: metabolism (2%), transport (3%), photosynthesis and/or chloroplast-related processes (6%), flowering and seed-related processes (6%), plant growth and development (6%), stress response (18%), and unknown functions (59%) (Figure S5). For quantitative real-time polymerase chain reaction (qRT-PCR) validation, DEGs with biological functions such as photosynthesis and/or chloroplast-related processes, flowering and seed-related processes, and plant growth and development were focused because they reflected the pleiotropy actions of the nal1 mutation.
The differentially expressed genes (DEGs) involved in plant growth and development were mostly downregulated (Table S6). These genes comprised plant signaling elements, cell growth and expansion, transcription factors, and enzyme proteins. The photosynthesis-related genes were chloroplastic translation proteins, chlorophyll a/b-binding proteins, and chloroplastic enzyme proteins. Most of the flowering and seed-related genes were downregulated, and these were signaling elements, transcription factors, and enzyme proteins. There were no PIN or ARF genes involved in auxin transport and distribution among the DEGs except an auxin efflux carrier gene (LOC_Os08g41720), which had two SNPs located in the intronic region. On the other hand, we found two DEGs each associated with GA and BR signaling pathways such as LOC_Os01g06210 (gibberellin receptor GID1L2), LOC_Os03g41060 (GASR2-Gibberellin-regulated GASA/GAST/Snakin family protein precursor), LOC_Os11g31540 (Brassinosteroid Insensitive 1-associated receptor kinase 1), and LOC_Os02g13900 (brassinazole-resistant 1 [BZR4] protein homolog). The downregulation of GID1L2 may be due to loss of the stop codon and two nonsynonymous SNPs.

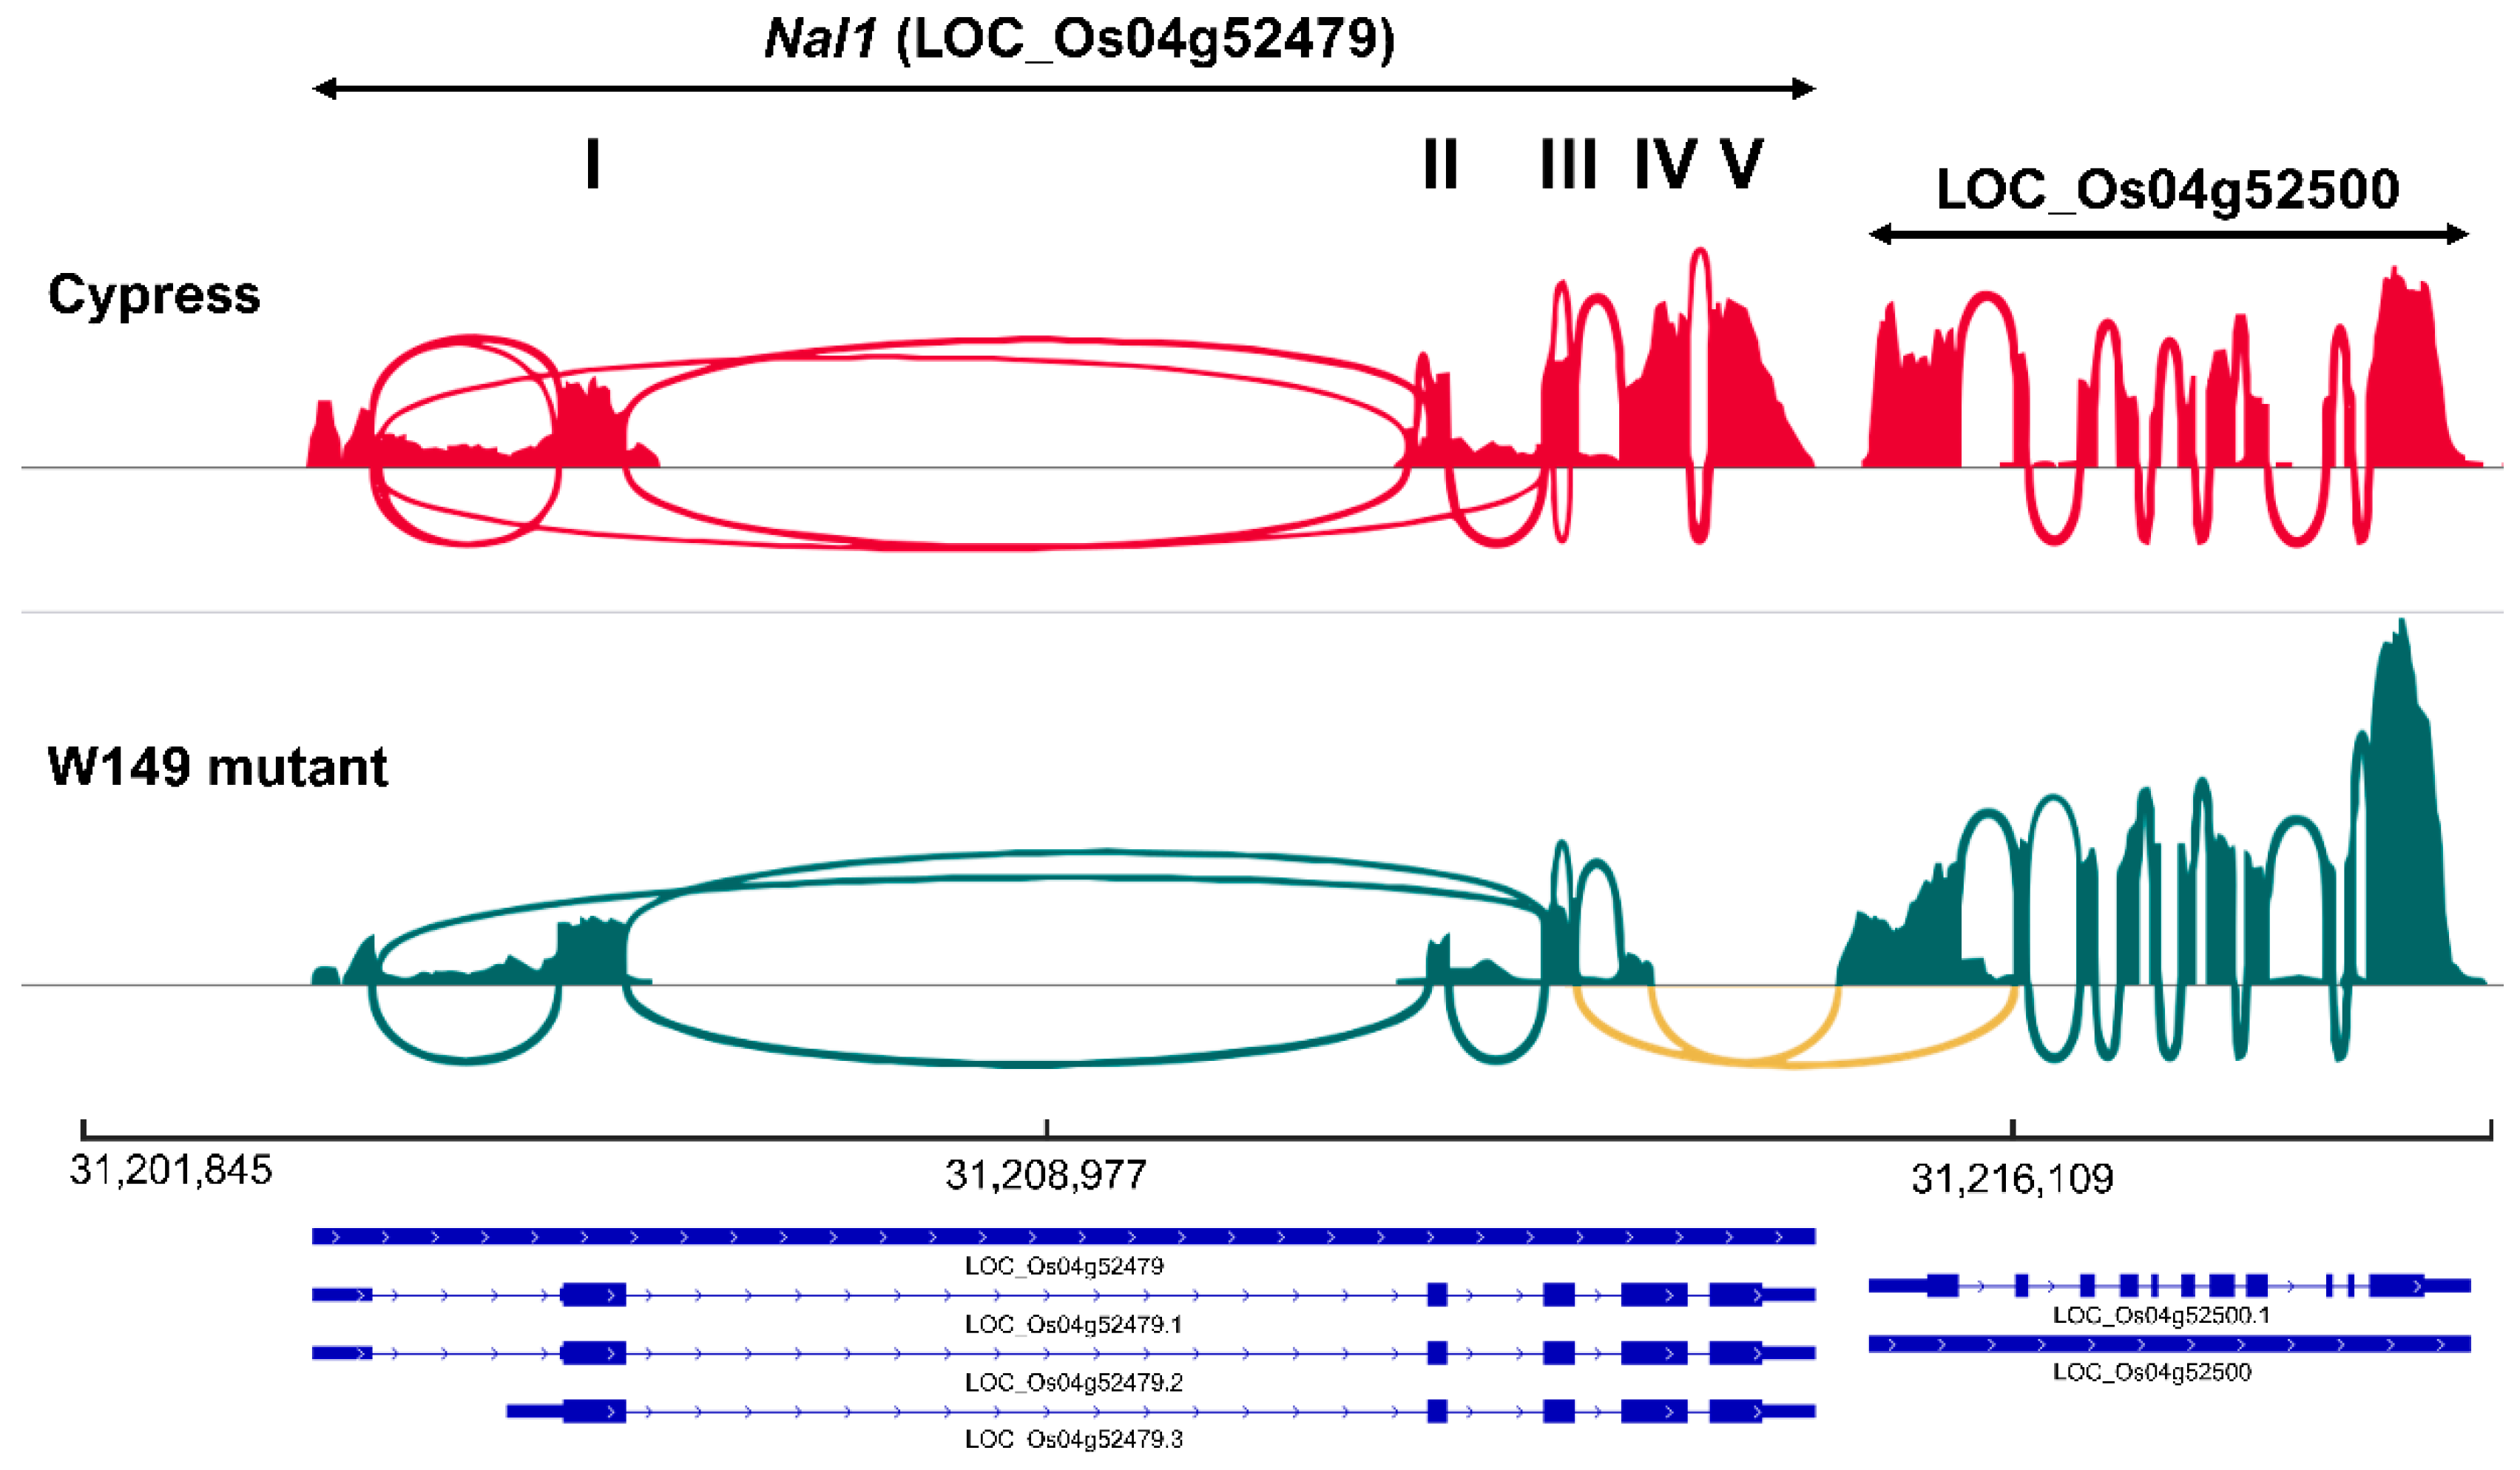
2.6. Identification and Validation of Chimeric nal1 Transcripts

The deleted region of nal1 in W149, which included part of the exon 4, exon 5, 3′-UTR, and downstream regions, was confirmed in the RNA-Seq analysis. The adjacent downstream gene LOC_Os04g52500 (lecithine cholesterol acyltransferase) was downregulated in W149 compared with Cypress. While Cypress expressed all known Nal1 transcripts, W149 formed two types of chimeric transcripts with LOC_Os04g52500. In one chimeric transcript (Nal1-Cht2), the exon 3 of LOC_Os04g52479 merged with the exon 2 of the LOC_Os04g52500 and the transcript continued up to the end of LOC_Os04g52500. The second chimeric transcript (Nal1-Cht1) was generated by the fusion of exon 4 of LOC_Os04g52479 with the exon 1 of LOC_Os04g52500 (Figure 7). These chimeric transcripts were identified in all three replicates of W149 RNA-Seq data but not in any replicate of Cypress (Figure S6). Although the reference-guided transcript assembly of RNA-Seq data revealed both chimeric transcripts with similar expression level (Figure 8; Table S7), we could confirm only the Nal1-Cht2 chimeric transcript from the cDNA of W149 by PCR amplification and sequencing (Figure S7). The unsuccessful amplification of the Nal1-Cht1 chimeric transcript could be due to very low abundance for PCR amplification.

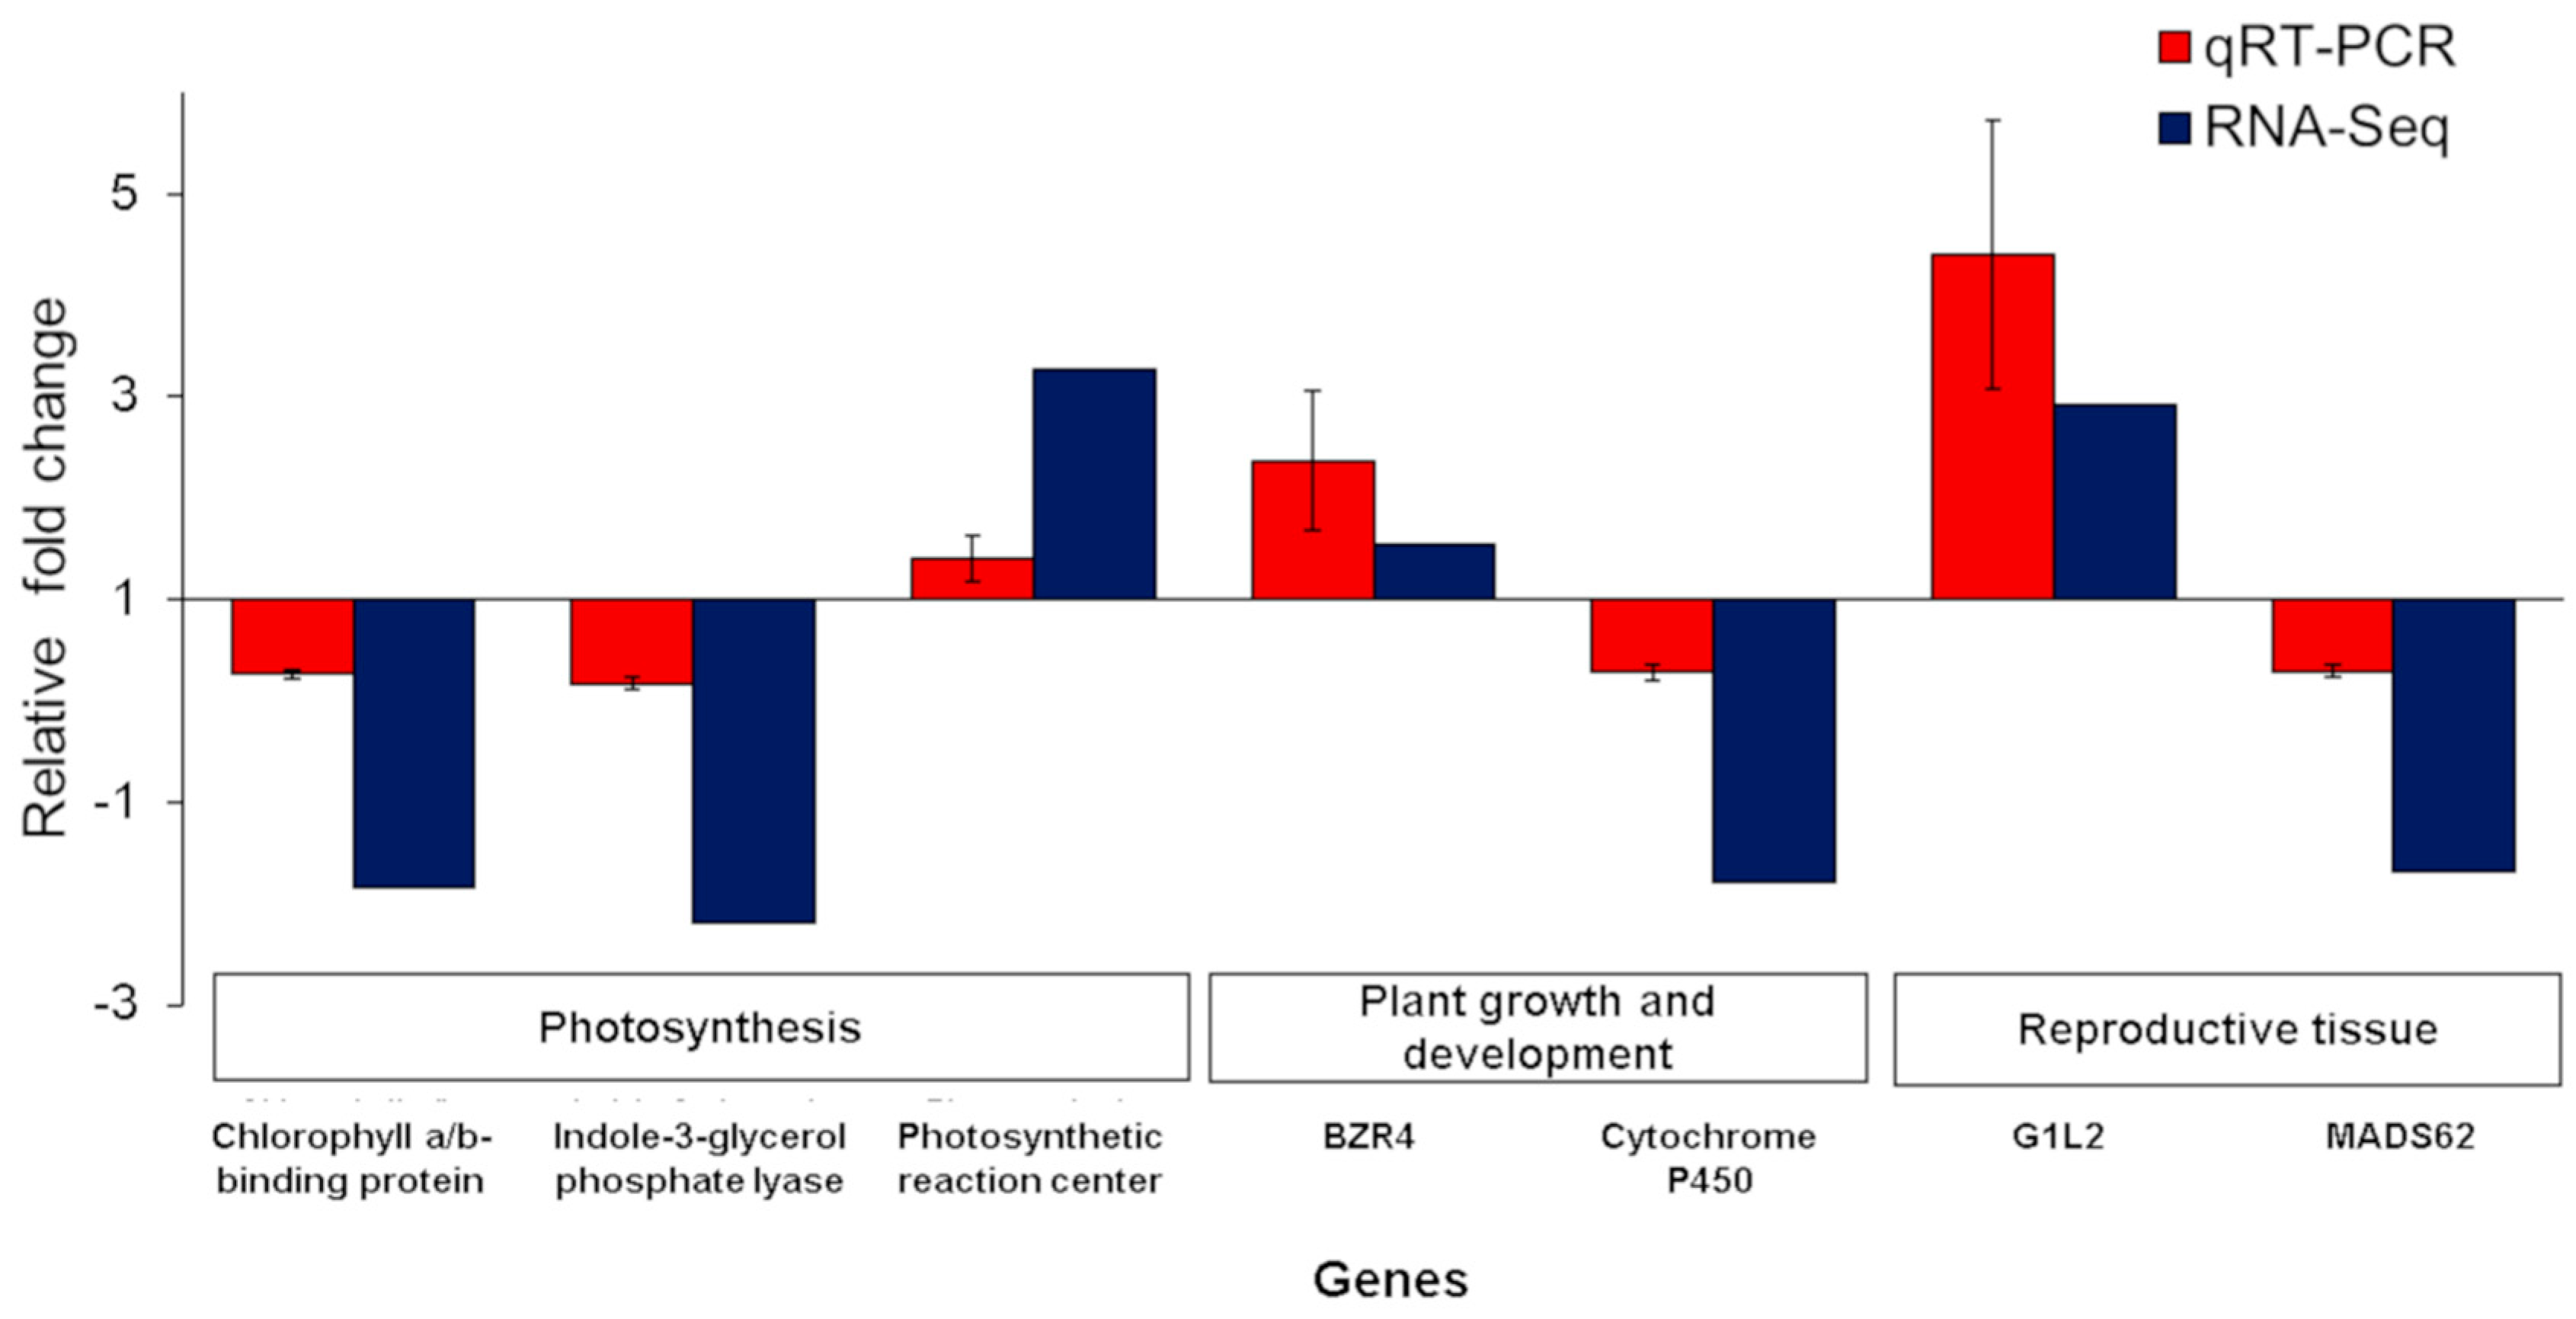
2.7. qRT-PCR of Differentially Expressed Genes

The relative mRNA expression of seven representative differentially expressed genes (three involved in photosynthesis, two each involved in plant growth and development and reproduction) based on RNA-seq analysis was compared in W149 relative to Cypress. Overall, the qRT-PCR results validated the expression pattern of these genes from the RNA-seq analysis, suggesting the reliability of data (Figure 9). Among the photosynthesis-related genes, chlorophyll a/b-binding protein (LOC_Os01g52240) and indole-3-glycerol phosphate lyase (LOC_Os03g58290) showed downregulation while photosynthetic reaction center protein (LOC_Os10g39880) was upregulated in W149 compared with Cypress. In the case of the other two groups of genes related to plant growth and development and reproduction, one gene in each group was upregulated and downregulated. The upregulated genes were BZR4 (LOC_Os02g13900) and G1L2 (LOC_Os06g46030), whereas cytochrome P450 (LOC_Os01g24780) and MADS62 (LOC_Os08g38590) were downregulated.

3. Discussion

Since the demonstration of Nal1 controlling narrow leaf phenotype [13], several studies have highlighted the utility of natural variants of this gene to improve rice productivity due to its favorable pleiotropic effects on many agronomic traits: enhanced photosynthesis, increased flag leaf size, leaf width, panicle length, number of spikelets, regulation of source–sink relationship, and adventitious root development [14,15,16,17,18,20]. Most of these published studies involved normal statured plants with natural Nal1 variants. However, we characterized a novel nal1 mutant in this study and compared the nature of this mutation and its phenotypic consequences and the associated mechanisms with previously reported mutants and variants.

3.1. Origin and Nature of the Mutation

As the mutant line W149 was identified in an advanced backcross generation involving a weedy rice as the donor, it was initially suspected to be due to introgression of weedy rice genomic segments. However, our mapping experiment followed by PCR sequencing and whole-genome sequence analysis revealed a large deletion at the 3′ end of the Nal1 gene. Chromosomal rearrangements were known to be triggered due to ‘genomic shock’ during hybridization [25]. The spontaneous mutations, novel chromosomal changes, and retrotransposon activations had been reported in several plant species during hybridization [26,27]. As the weedy rice accession is genetically distant to japonica cultivars [28], this mutation most likely spontaneously originated from this distant cross. The absence of any narrow leaved plant in the introgression line population of ‘PSRR-1′ in another rice cultivar ‘Bengal’ background [29] provided further evidence against the origin of this mutant through introgression.
Jiang et al. [19] used two nal1 mutants to investigate its role in cell division in which nal1-2 had a deletion of a whole promoter and 404 bp of exon 1 and nal1-3 mutant had a 6-bp deletion in exon 1. The nal1 mutant of Qi et al. [13] had 30 bp deletions in the 4th exon. An earlier study grouped the natural variants in rice germplasm into seven categories [21]. The Nal1 variant (SPIKE) had three amino acid substitutions between IR64 (indica) and Daringan (tropical japonica) [14]. The same three amino acid substitutions differed between narrow leaved Koshihikari (temperate japonica) and Takanari (indica) with normal leaf width and high photosynthesis [15]. There was an insertion of a 5895-bp retrotransposon in the 2nd exon of Koshihikari and a 30-bp deletion in Takanari. On the other hand, Nipponbare and 93-11 (indica), which were used to map QTLs for leaf shape and chlorophyll content, differed in promoter region in addition to the same three nonsynonymous SNPs [16]. The nal1 allele of D50 (narrow leaf) (tropical japonica) used by Chen et al. [17] was the same as IR64 and 93-11. In this study, sequence comparison revealed a 1395-bp deletion in the nal1 gene in W149 compared to Cypress. Cypress sequence was identical to Nipponbare but differed from PSRR-1 in three nonsynonymous (ns) SNPs.
We demonstrated that due to loss of the stop codon, two different types of chimeric transcripts were generated by fusion of the readthrough partial transcripts of nal1 (LOC_Os04g52479) and the adjoining LOC_Os04g52500. Preference for the transcript (exon 3-exon 2) was observed, and this differential production of chimeric transcripts was validated by RNA-Seq data. This finding suggests that our mutant is unique and a rare molecular event most likely led to the formation of this chimeric gene. A human fusion gene, KUA-UEV, generated through readthrough transcription and alternative splicing, has been reported [30]. In rice, a chimeric rice gene GN2 controlling grain number evolved due to insertion of a 1094-bp fragment from LOC-Os02g45150 into the exon 3 of LOC_Os02g56630 from the wild rice O. rufipogon [31]. The formation of chimeric genes reported in the rice genome largely involved retrotransposition [32]. As chimeric genes can have both beneficial and detrimental consequences on phenotype due to the evolution of novel functions, this may provide clues for the synthesis of artificial genes in the future [33]. Although several kinds of splice variants for Nal1 transcripts were reported in both japonica and indica cultivar [15,16,17], production of chimeric transcripts involving the adjacent gene was not reported earlier, which warrants further investigation to explain the phenotypic consequences of nal1 based on variation in the expression pattern.

3.2. Alteration in Plant Architecture Due to Pleiotropic Action of Nal1

In this study, we demonstrated that nal1 deletion was correlated to the overall mutant phenotype. Several studies have implicated nal1 to pleiotropic effects on rice plant architecture, photosynthetic rate, leaf morphology, and grain yield using mutants [13,19,20] and natural variants [14,15,16,17,18,21]. Takai et al. [15] indicated that the partial loss-of-function nal1 allele in ‘Takanari’ was correlated to increased photosynthetic performance and grain yield with little to no undesirable effect on the plant morphology and physiology compared with ‘Koshihikari’. Compared to the above studies, complete loss-of-function due to a large deletion involving the stop codon in the W149 mutant had a detrimental effect on the plant architecture despite enhanced chlorophyll content, which was consistent with the observation in the nal1-mutant of ‘Taichung 65’ and RNAi-Nal1 transgenic plants [15].
In W149, enhanced cell division in the periclinal orientation and inhibition of cell division in the anticlinal direction were responsible for short stature with thick, narrow, and shortened leaves like an earlier studied mutant [19]. The W149 culm diameter/area and panicle neck reduction were accompanied by a reduction in vascular bundles along the stem periphery. There were variations in height reduction among the mutants used by researchers. In addition, disruption in the stem vascular arrangement of W149 was not evident, contrary to the nal1 mutant used by Qi et al. (2008) [13]. Such differences in the phenotypes among the Nal1 mutants suggest that the level of severity and degree of pleiotropy varied among nal1 mutants and natural variants with different genetic backgrounds.
W149 showed an altered vein patterning due to the reduced number of SVs between two LVs while maintaining normal numbers of LVs. As SVs develop later than the LVs during leaf development [34,35], the limited space between LVs may hinder the formation of SVs. Although variation in polar auxin transport activities has been reported to influence the change in vein patterning like the reduction in SVs observed in nal1 mutants [13,20], the absence of any auxin transport-related genes among the DEGs indicated a different mechanism controlling the plant architecture in W149. Significant reduction in grain yield in the complete loss-of-function nal1 mutant W149 was in complete agreement with earlier studies [14,15,24].

3.3. Physiological and Molecular Basis of Mutant Phenotype

Due to the pleiotropic nature of the Nal1, it has been promoted as a developmental tool to modulate leaf characteristics for enhanced photosynthesis and yield [36]. Compared to 4277 DEGs identified in a nal1 mutant [23], we identified only 330 DEGs in the transcriptome analysis of the W149 mutant, which could be largely attributed to the near-isogenic nature of the mutant. The nature of mutation, genetic background, and spatial and temporal differences during tissue sample collection may have contributed to such a variation in number of DEGs. Regarding the nature of mutation, Qi et al. [13] used a nal1 mutant containing a 30-bp deletion, whereas our mutant harbored a large deletion with loss of the stop codon, resulting in a chimeric gene.
Another remarkable phenotype of our nal1 mutant was its dark green and thick leaves. About ten DEGs were at least related to photosynthesis and/or chloroplastic activities. These include photosynthetic reaction center protein, Type I chlorophyll a/b-binding protein b (Lhcb1.1), and NADPH-dependent oxidoreductase, while other genes involved in chloroplastic protein translation activities were 30s and 50s ribosomal proteins and translation initiation factor IF-1. A chloroplastic precursor, indole-3-glycerol phosphate lyase, was also differentially expressed [37]. Takai et al. [15] concluded that the partial loss-of-function nal1 allele was responsible for thick leaves and enhanced photosynthesis without any detrimental effect, leading to increased productivity. Although our nal1 mutant had thick leaves and high chlorophyll content, severely altered plant architecture made it highly unproductive. It is obvious that nal1 in this study was nonfunctional due to the loss of nuclear localization signal peptides and serine/cysteine protease domains. Therefore, further investigation is needed to explore the function of the chimeric transcripts for understanding the impact of this mutation on rice plant growth and development.
Previous studies showed that Nal1 was responsible for mutant phenotypes through regulation of polar auxin transport and cell division [13,19,23]. In those studies, the members of the auxin response factor (ARF) gene family and PIN-like genes involved in auxin signaling were downregulated. There was only one auxin efflux carrier gene (LOC_Os08g41720), which was downregulated and had two SNPs in the intronic region. It is possible that this gene might be regulated by nal1. However, the involvement of this gene could be ruled out because downregulation of this gene in our study had undesirable effects on plant architecture and grain yield, which was contradictory to an earlier study [38], in which reduced expression of the gene had beneficial effects such as increased tiller number, better root system, longer panicles, and enhanced grain yield. Apart from this gene, no ARF gene showed differential expression, suggesting different molecular and physiological mechanisms controlling the mutant phenotype.
Our expression studies also revealed genes involved in cell growth and cell wall synthesis (i.e., Acyltransferase 19, A-expansin, and ß-expansin precursors), leaf and culm development (i.e., Brittle Culm 7, Homeobox 10, Cell Proliferating Factor 5), and flowering and seed-related genes (i.e., Heading Date 3A, Flowering Time Locus 1, Mads Box Gene 62, Receptor-Like Cytoplasmic Kinase 82). Several cytochrome P450 genes, which are involved in plant growth and developmental processes and stress responses, were downregulated in W149.

3.4. Role of Gibberellins (GA) and Brassinosteroid (BR)-Related Genes

Both phytohormones, GA and BR, are known to regulate many physiological and developmental processes in plant [39,40], and therefore, significant crosstalk occurs between the genes involved in signaling and biosynthesis pathways [41,42]. The GA responsiveness of W149 was indicative of disruption in either GA signaling or biosynthetic pathway [41]. Two downregulated genes involved in GA signaling pathways were identified in W149. LOC_Os01g06210 (GID1L2) is a soluble gibberellin receptor involved in GA signaling through interaction with a GA signaling repressor SLR1 [43], whereas LOC_Os03g41060 (GASR2-Gibberellin-regulated GASA/GAST/Snakin family protein precursor) has a role influencing the plant developmental process through their involvement in hormone crosstalk [44]. Based on network analysis in the string database (https://string-db.org/network), this gene may be interacting with many indole-3-acetic acid-amido synthetase genes involved in a mechanism to deal with excess auxin.
Brassinosteroids (BR) are known to regulate the biosynthesis of GA in rice [41,42]. A closer look at the expression profile of plant growth and development-related genes revealed two important genes essential for the brassinosteroid (BR) signaling pathway: LOC_Os11g31540 (Brassinosteroid Insensitive 1-associated receptor kinase 1 [BAK1]) and LOC_Os02g13900 (brassinazole-resistant 1 protein homolog [BZR4]). BAK1 plays an important role in mediating the BR signaling pathway regulating plant growth and development [45]. Downregulation of BAK1 reduced the cell number in leaves, which was consistent with our observation in W149 with respect to gene regulation and mutant phenotype. On the other hand, BZR4, which was upregulated in the W149 mutant, is a transcriptional repressor for the target genes encoding key enzymes for BR biosynthesis [46]. In our study, both BAK1 and BZR4 most likely affected the levels of BRs and expression of BR-responsive genes. BRs are involved in controlling photomorphogenesis and chloroplast development via direct interactions with BR signaling pathways and key transcriptional regulators [47]. As BRs also play an important role in vascular development [48], the altered expression of BR signaling elements may be responsible for reducing the number of SVs in the W149 mutant. The differential expression of some BR signaling elements (i.e., BAK1 and BZR4) in GA-responsive W149 suggested their involvement in regulating both BR and GA signaling and/or biosynthetic pathways.

4. Materials and Methods

4.1. Plant Materials and Cultivation

Two rice cultivars (Cypress and Bengal) and a weedy rice accession ‘PSRR-1’ were used for this study. Both rice cultivars were developed by the LSU Agricultural Center [49,50]. ‘PSRR-1’ is a tall medium-grain weedy accession with light green leaves, red pericarp, high seed shattering, and deep seed dormancy. Staggered planting of the above rice genotypes was done to synchronize flowering for crossing. Emasculation was performed by the clipping method, and pollination was done manually the following day. Advanced backcrossed materials were generated by successive backcrossing to the recurrent rice cultivar. The plants were cultivated in semi-controlled greenhouse conditions maintained at 27/21 °C day/night temperature at the greenhouse complex of the Louisiana State University Agricultural Center, Baton Rouge, LA, USA.

4.2. Origin of the W149 Mutant

While developing introgression lines of the weedy rice accession ‘PSRR-1’, a mutant plant with an altered plant architecture was identified in the BC4F2 generation. The mutant plant was genotyped with the polymorphic simple sequence repeat (SSR) markers spread over the rice genome [51]. As the mutant harbored chromosome segments from chromosomes 3, 4, and 12, it was again backcrossed to ‘Cypress’ for one more generation to generate a population of 279 F2 plants from which one plant with a homozygous mutant phenotype (named as W149) and single chromosome segment on chromosome 4 was identified in the BC5F2 generation (Figure S8; Figure 1).

4.3. Phenotypic Characterization of W149 Mutant

Comparative phenotyping of Cypress and W149 was done by measuring several quantitative traits such as plant height (PH), tiller number (TN), panicle length (PL), leaf length (LL), leaf width (LW), and leaf greenness or chlorophyll content (SPAD values); the leaf morphological parameters such as leaf vein pattern, leaf thickness (LTH), interveinal distance (IVD), mesophyll cell (MC) area between two veins, vascular bundle (VB) area, bundle sheath cell (BSC), and bundle sheath extension area; and the culm profile such as internode length, culm, and panicle neck size. For the above traits, measurements were taken in the following manner: pH was measured from the base of the plant to the tip of the longest leaf; PL was measured from the start of panicle node to the end of the panicle; LL was measured from the base to tip of the penultimate leaf; LW was measured at the widest portion of the penultimate leaf; and the greenness of leaf was measured thrice at the midportion of the penultimate leaf using a SPAD-502 chlorophyll meter (Spectrum Technologies, Inc., Aurora, IL, USA).
Leaf morphological studies were performed by observing the surface and cross-sections of the leaves. The leaf surface images of fresh leaf samples were taken to determine the vein patterns by counting the major/large veins (LV) and minor/small veins (SV). Leaves were stored in 2% glutaraldehyde (v/v of phosphate buffer) at 4 °C for further leaf section analyses. The free-hand section technique was used to view the detailed leaf morphology of the wild-type and mutant. Thin leaf sections were stored in 0.1 M phosphate buffer and transferred to 100% sodium hypochlorite solution for about 1 min to clear the leaf sections. Cleared leaf sections were rinsed with phosphate buffer followed by staining with a droplet of 0.5% toluidine blue for 2 min and washing in distilled water. Leaf sections were viewed under a compound microscope (FisherbrandTM Micromaster Model CK, Fisher Scientific, Houston, TX, USA) to check the clarity of the leaf sections, and then images were taken using a Leica DM6B microscope (Leica Biosystems, Buffalo Grove, IL, USA). For leaf morphological measurements, images were analyzed using Image J ver. 1.8.0 software and the leaf morphological differences between wild-type and mutant were tested for their significance using Student’s t-test. For the culm profile study, lengths of all internodes were measured and the contribution of each internode to the total plant height was determined. The cross-sections of culm internodes and panicle neck were taken to measure the differences in sizes (area) between the wild-type and the mutant. The procedure for the stem sections and analyses was like the leaf sections mentioned earlier.

4.4. Hormonal Response

Morphological responses of Cypress and W149 mutant to various plant hormones such as IBA, NAA, 2,4-dichlorophenoxyacetic acid (2,4-D), and gibberellic acid (GA3) were examined. Rice seeds of both genotypes were sterilized with 1.7% NaClO and germinated on petri-plates under 28 °C for 5 days. Ten germinated plants were transferred to each hydroponics setup without any hormones (control) and with 0.5 mg of each hormone per liter of Yoshida solution. Plants were grown for four weeks and plant height and root length were measured. The change in plant height and root length in each genotype to hormone treatment compared to the control was expressed in percent, and one-way ANOVA was used to determine significant differences in response of different hormone treatments compared to the control.

4.5. Mapping Populations for Cosegregation Test and Bulk Segregant Analysis (BSA)

F2 populations were developed from three cross-combinations: W149 × PSRR-1, W149 × Cypress, and W149 × Bengal. All three populations were evaluated for overall morphology and the population from the W149 × PSRR-1 was used for BSA [52]. DNA from parents and the mapping populations were extracted from young leaf tissues using the cetyltrimethylammonium bromide (CTAB) method [53]. For mapping of the mutant locus, thirty mutant-type plants and thirty normal-type plants were selected to constitute the mutant-bulk and normal-bulk, respectively. Both mutant-bulk and normal-bulk along with parents W149 and PSRR-1 were screened using 200 simple sequence repeat (SSR) markers distributed over the rice genome. A partial linkage map was constructed using Mapmaker 3.0 for mapping the mutant locus.

4.6. Whole-Genome Sequencing (WGS) and Analysis of W149, Cypress, and PSRR-1

The DNA samples from W149, Cypress, and PSRR-1 were sent to the Virginia Bioinformatics Institute (Blacksburg, VA, USA). Genomic libraries were constructed and sequenced using paired-end sequencing on an Illumina HiSeq 2000 platform using standard Illumina protocols [54]. A Burrows–Wheeler Aligner (BWA; MEM-algorithm; version 0.7.8 [55]) was used for the mapping of the high-quality filtered reads against the rice reference genome (Os-Nipponbare-Reference-IRGSP-1.0, downloaded from the Rice Genome Annotation Project (http://rice.plantbiology.msu.edu/cgi-bin/ORF_infopage.cgi)) [56,57]. Structural variants (SV) were called using TIDDIT [58] while genomic variant discovery was done using GATK4 [59]. Additionally, hard filtering was done using VariantFiltration with the basic filtering threshold discussed in the GATK Best Practices documentation. Genome-wide coverage was estimated using SAMtools version 1.9 [55]. SnpEff version 4.3 [60] was used to determine the effects of single nucleotide polymorphisms (SNPs), insertions-deletions (InDels), and structural variants. All bioinformatic analyses were performed using high-performance computing resources available at the Louisiana State University (http://www.hpc.lsu.edu).

4.7. Confirmation of the Nal1 Deletion

The primer pair used to confirm the Nal1 deletion was as follows: Nal-Del-F (5′-TACGAGCTGACGGTGCATTT-′3) and Nal-Del-R (5′-TTCCGGTCCCACCTAGTCAT-′3). For PCR amplifications, a 20 µL PCR cocktail was prepared for each sample containing the following components: 2.0 µL of 10× PCR buffer, 0.4 µL of Taq polymerase, 2.0 µL of 10 µM of each primer, 0.4 µL of 10 mM dNTPs, 1.2 µL of mM MgCl2, 3.0 µL of 100 ng/µL DNA, and 9.0 µL distilled water. The following PCR cycle condition was followed: Initial step of 94 °C for 2 min, 35 core cycles (94 °C for 30 s, 55 °C for 20 s, 72 °C for 30 s), and final step of 72 °C for 7 min. About 18 µL of each PCR sample was mixed with 2.0 µL of 10× loading dye before loading and electrophoresed in a 1.5% agarose gel at 100 V for 60 min. The amplification bands with correct size (Cypress:1650 bp and W149: 250 bp) were cut from the gel and purified using a Gel/PCR DNA fragment extraction kit (IBI scientific, Dubuque, IA, USA). Samples were sequenced from both directions via Sanger sequencing at the Genomics Facility of the Louisiana State University.

4.8. Phenotyping and Genotyping of Nal1

Phenotyping based on the overall morphology was performed to quantify the number of F2 plants having the phenotype like Cypress (recurrent parent) and Bengal (different background) and W149. Each F2 plant was scored as either mutant or normal phenotype based on overall morphology, and the Mendelian segregation was tested using the chi-square test.
Co-segregation of the nal1 allele with the mutant phenotype was determined by genotyping two F2 populations using two primer pairs spanning the deleted region of the nal1 gene:
  • NalDel-W149-1F (5′-TGCCGCCCCATTATGGATTT-3′),
  • NalDel-W149-1R (5′-GTACGCCAAACCGGATGAAG-3′),
  • NalDel-CPRS-2F (5′-GGTGATAGCGGAAGCCTTATT-3′),
  • and NalDel-CPRS-2R (5′-CGACATACCGACGAAGTTTGA-3′).
The first set of primer (1F and 1R) was used to detect the deletion in the nal1 gene; Cypress, Bengal, and PSRR-1 alleles had amplifications (608 bp), but there was no amplification for the W149 allele. The second primer set (2F and 2R) was used to identify the heterozygous plants for the nal1 gene in the mapping populations (Cypress and Bengal: 1774 bp and W149: 376 bp). Two primer sets were used instead of the NalDel_W149 primer set alone to confirm the nal1 deletion because NalDel_W149 showed some bias in amplifications between two fragments due to a large difference in size (1774 and 376 bp) for heterozygous samples. The design of the nested primers was explained (Figure S9). PCR amplifications and electrophoresis were done in the same way as described earlier. Genotypes were scored and the fitness-to-Mendelian segregation ratio was tested using the chi-square test.

4.9. RNA-Seq Analysis

Two rice genotypes, Cypress and W149 mutant, were used for RNA-sequencing. Plants were grown under greenhouse conditions at the Louisiana State University Campus Greenhouse in Baton Rouge, Louisiana (30°24′41.7″ N 91°10′21.8″ W) during February–April 2018. Fully expanded leaves were collected at the booting stage (~53 days after sowing). Samples were taken from three biological replicates and were stored in a −80 °C refrigerator until RNA extraction.
Total RNA was extracted using TRIzol (Invitrogen, Carlsbad, CA, USA) based on the manufacturer’s protocol. The quality and quantity of the extracted RNA were assessed using the ND-1000 Spectrophotometer (Thermofisher Scientific, Waltham, MA, USA) and Agilent 2100 Bioanalyzer (Agilent Technologies, Santa Clara, CA, USA). DNAse treatment was done using PerfeCTa DNase I (Quantabio, Beverly, MA, USA) following the manufacturer’s instructions. Purified RNA samples were submitted to Novogene Corporation Inc. (Sacramento, CA, USA) for cDNA library construction and sequencing using the Illumina NovaSeq 6000 platform with 150-bp paired-end sequencing.
The quality of the raw reads was checked with FastQC (Babraham Bioinformatics, Cambridgeshire, UK, https://www.bioinformatics.babraham.ac.uk/), wherein reads with ≥30 Phred quality score were used in downstream analysis. The processed paired-end reads were mapped to the rice reference genome (Os-Nipponbare-Reference-IRGSP-1.0 downloaded from the Rice Genome Annotation Project) using HISAT2 version 2.1.0 [61]. The resulting mapped reads were processed using featureCounts [62] and DEGs were determined from a raw count table using “DESeq2” R package [63]. To identify the DEGs, a Benjamini–Hochberg-adjusted p-value of <0.05 and log2 fold change ≥1.5 were set as criteria. Gene ontology enrichment of the DEGs was performed using the singular enrichment analysis with agriGO v2 [64] to determine the biological significance with respect to biological processes (BP), molecular functions (MF), and cellular components (CC).
Transcripts of each biological sample were reconstructed to identify novel transcripts using Stringtie (v2.1.0, Johns Hopkins University, Baltimore, MD, USA; https://github.com/gpertea/stringtie) [65]. Identified transcripts were then compared with the MSU release 7 annotations [57]. The Stattest function of R package ballgown (v2. 18.0, R 3.6.2) [66] was used to test for differentially expressed transcripts between Cypress and W149 using all three biological replicates with a false discovery rate at 0.05. All raw read sequences of W149 and Cypress were deposited in the NCBI’s Sequence Read Archive (SRA) under the accession number PRJNA605404.

4.10. Validation of Gene Expression

To validate the gene expression patterns identified in the RNA-Seq analysis, one μg DNase-treated RNA was used to synthesize cDNA with the iScript cDNA Synthesis Kit (Bio-Rad Laboratories, Inc., Hercules, CA, USA). Representative genes were chosen from each group of different biological functions. Transcript sequences were retrieved from (RAP-DB/Phytozome) and primer pairs were designed using PrimerQuest Tool (Integrated DNA Technologies, Inc., Coralville, IA, USA) (Table S8).
Expression analyses of Lhcb1.1 (chlorophyll a/b binding protein) (LOC_Os01g52240), indole-3-glycerol phosphate lyase (LOC_Os03g58290), photosynthetic reaction center protein (LOC_Os10g39880), BZR4 (LOC_Os02g13900), cytochrome P450 (LOC_Os01g24780), G1L2 (LOC_Os06g46030), and MADS62 (LOC_Os08g38590) were performed in 96-well plates on an Applied Biosystems QuantStudio 3 Real-Time PCR system using iTaqTM Universal SYBR Green Supermix (Bio-Rad Laboratories, Inc., Hercules, CA, USA) in a total reaction volume of 10 μL containing the following components: 5.0 µL of 2× iTaqTM universal SYBR® Green supermix, 0.3 µL of 5 µM of each primer, 1.0 µL of 1:10 cDNA, and 3.4 µL sterilized distilled water. The cycling conditions were 5 min of initial denaturation at 95 °C, followed by 40 cycles of 95 °C for 15 s, and 60 °C for 1 min. The melting curve was carried out in the 60–95 °C range. The negative control used was no-tissue control. The expression levels of the target genes and a reference gene (EF1α) were measured in three biological replicates per tissue using gene-specific primers. Expression levels for genes were determined using the 2−ΔΔCT method as described previously [67].

4.11. Validation of Chimeric Nal1 Transcript

There were two types of chimeric transcripts detected from the RNA-Seq data in W149 due to the deletion of the stop codon in LOC_Os04g52479 but not in Cypress. In one transcript, the exon 3 of LOC_Os04g52479 joined to the exon 2 of the adjacent locus LOC_Os04g52500. The second transcript involved the joining of exon 4 of LOC_Os04g52479 to exon 1 of LOC_Os04g52500. To validate these chimeric transcripts, two pairs of primers were designed: Exon3-52479F (5′-CACTGGCAACAAGCAGGTTGG-3′), Exon2-52500R (5′-CATGTCGGGGTCCAGAGTGTC-3′), Exon4-52479F (5′-GGAGGCAAGTATGCAAAGTTGGC-3′), and Exon1-52500R (5′-CATCAACGGCTTCAAGAATCGAGC-3′). PCR amplification using cDNA from both W149 and Cypress was done using all combinations of forward and reverse primers following a similar PCR condition and profile described earlier. About 48 µL of each PCR sample was mixed with 2.0 µL 10× loading dye, and these were loaded in 1.5% agarose gel and electrophoresed at 120 V for 60 min. Target amplification band sizes (Cypress: No amplification and W149: 283 bp) were cut from the gel and purified using a Gel/PCR DNA fragment Extraction kit (IBI scientific, Dubuque, IA, USA). Samples were sequenced from both directions via Sanger sequencing at the Genomic Facility of the Louisiana State University.

5. Conclusions

Despite the important role of the nal1 gene in plant developmental processes [36] and numerous investigations on its variants and mutants, it is still unclear how Nal1 affects multiple traits. While most studies focused on the impacts and utility of this gene for crop improvement using natural variants [14,15,16], few studies provided a molecular basis of the physiological impacts on rice plant using mutants [13,19,23]. Nal1 was shown to have control on some aspects of the leaf characteristics through its regulation of the cell cycle [19] and polar auxin transport [13]. Another study revealed its role in interaction with the FZP gene to increase rice yield [24]. Using a novel near-isogenic mutant, our study revealed that nal1 does affect the whole plant architecture (not just the flag leaf) by regulating the expression of a large number of genes involved in cell proliferation and expansion, plant growth and development, reproduction, and photosynthetic apparatus. The GA responsiveness of our mutant added a new angle to our understanding of the overlapping functions of nal1 on genes involved in hormone signaling in addition to cell cycle regulation and plant developmental processes. Along with its impact on the above processes, nal1 was shown to regulate genes involved in GA and BR signaling pathways, contributing toward the plants’ overall architecture [68], which is in sharp contrast to earlier studies suggesting the role of nal1 in polar auxin transport [13]. Although we demonstrated the formation of chimeric transcripts by fusion of the partial readthrough transcripts of nal1 and the adjacent gene due to loss of the stop codon in this mutant, the role of these chimeric transcripts on plant phenotype remains to be investigated in the future.

Supplementary Materials

Supplementary materials can be found at https://www.mdpi.com/1422-0067/21/21/8106/s1.

Author Contributions

Conceptualization, P.K.S.; methodology and data analysis, R.S.G., S.C. and T.B.D.L.; draft preparation, R.S.G. and P.K.S.; review and editing, P.K.S., R.S.G., S.C. and T.B.D.L. All authors have read and agreed to the published version of the manuscript.

Funding

This research was supported by the National Institute of Food and Agriculture, U.S. Department of Agriculture (Grant No. 2006-35320-16555).

Acknowledgments

This manuscript is approved for publication by the Director of Louisiana Agricultural Experiment Station, USA as manuscript number 2020-306-34873.

Conflicts of Interest

The authors declare no conflict of interest. California Cooperative Rice Research Foundation, Inc. and the funders had no role in the design of the study; in the collection, analyses, or interpretation of data; in the writing of the manuscript, or in the decision to publish the results.

Abbreviations

GAgibberellin
BRbrassinosteroid
QTLquantitative trait loci
GPSgreen for photosynthesis
FZPfrizzy panicle
UTRuntranslated region
LVlarge vein
SVsmall vein
IVDinterveinal distance
BSCbundle sheath cells
VBvascular bundle
MCmesophyll cell
BSABulked segregant analysis
SSRsimple sequence repeat
SNPsingle nucleotide polymorphism
InDelinsertions-deletions
IBAindole-3-butyric acid
NAA1-Naphthaleneacetic acid
2,4-D2,4-dichlorophenoxyacetic acid
DEGdifferentially expressed genes
GOgene ontology
qRT-PCRquantitative real-time polymerase chain reaction
nsnonsynonymous
ARFauxin response factor
BPbiological process
MFmolecular function
CCcellular component
SRASequence Read Archive

References

  1. Yang, X.C.; Hwa, C.M. Genetic modification of plant architecture and variety improvement in rice. Heredity 2008, 101, 396–404. [Google Scholar] [CrossRef] [PubMed] [Green Version]
  2. Kurata, N.; Miyoshi, K.; Nonomura, K.; Yamazaki, Y.; Ito, Y. Rice mutants and genes related to organ development, morphogenesis and physiological traits. Plant Cell Physiol. 2005, 46, 48–62. [Google Scholar] [CrossRef] [PubMed]
  3. Krishnan, A.; Guiderdoni, E.; An, G.; Hsing, Y.-I.C.; Han, C.-D.; Lee, M.C.; Yu, S.-M.; Upadhyaya, N.M.; Ramachandran, S.; Zhang, Q.; et al. Mutant resources in rice for functional genomics of the grasses. Plant Physiol. 2009, 149, 165–170. [Google Scholar] [CrossRef] [PubMed] [Green Version]
  4. Wang, Y.; Li, J. Molecular basis of plant architecture. Annu. Rev. Plant Biol. 2008, 59, 253–279. [Google Scholar] [CrossRef]
  5. Spielmeyer, W.; Ellis, M.H.; Chandler, P.M. Semidwarf (sd-1), green revolution rice, contains a defective gibberellin 20-oxidase gene. Proc. Natl. Acad. Sci. USA 2002, 99, 9043–9048. [Google Scholar] [CrossRef] [Green Version]
  6. Zhu, L.; Hu, J.; Zhu, K.; Fang, Y.; Gao, Z.; He, Y.; Zhang, G.; Guo, L.; Zeng, D.; Dong, G.; et al. Identification and characterization of shortened uppermost internode 1, a gene negatively regulating uppermost internode elongation in rice. Plant Mol. Biol. 2011, 77, 475–487. [Google Scholar] [CrossRef]
  7. Hu, J.; Zhu, L.; Zeng, D.; Gao, Z.; Guo, L.; Fang, Y.; Zhang, G.; Dong, G.; Yan, M.; Liu, J.; et al. Identification and characterization of narrow and rolled leaf 1, a novel gene regulating leaf morphology and plant architecture in rice. Plant Mol. Biol. 2010, 73, 283–292. [Google Scholar] [CrossRef] [PubMed]
  8. Fujino, K.; Matsuda, Y.; Ozawa, K.; Nishimura, T.; Koshiba, T.; Fraaije, M.W.; Sekiguchi, H. Narrow leaf 7 controls leaf shape mediated by auxin in rice. Mol. Genet. Genom. 2008, 279, 499–507. [Google Scholar] [CrossRef] [PubMed] [Green Version]
  9. Cho, S.H.; Yoo, S.C.; Zhang, H.; Pandeya, D.; Koh, H.J.; Hwang, J.Y.; Kim, G.T.; Paek, N.C. The rice narrow leaf2 and narrow leaf3 loci encode WUSCHEL-related homeobox 3A (OsWOX3A) and function in leaf, spikelet, tiller and lateral root development. New Phytol. 2013, 198, 1071–1084. [Google Scholar] [CrossRef]
  10. Jiao, Y.; Wang, Y.; Xue, D.; Wang, J.; Yan, M.; Liu, G.; Dong, G.; Zeng, D.; Lu, Z.; Zhu, X.; et al. Regulation of OsSPL14 by OsmiR156 defines ideal plant architecture in rice. Nat. Genet. 2010, 42, 541–544. [Google Scholar] [CrossRef] [PubMed]
  11. Miura, K.; Ikeda, M.; Matsubara, A.; Song, X.J.; Ito, M.; Asano, K.; Matsuoka, M.; Kitano, H.; Ashikari, M. OsSPL14 promotes panicle branching and higher grain productivity in rice. Nat. Genet. 2010, 42, 545–549. [Google Scholar] [CrossRef]
  12. Zhao, K.; Tung, C.-W.; Eizenga, G.C.; Wright, M.H.; Ali, M.L.; Price, A.H.; Norton, G.J.; Islam, M.R.; Reynolds, A.R.; Mezey, J.G.; et al. Genome-wide association mapping reveals a rich genetic architecture of complex traits in Oryza sativa. Nat. Commun. 2011, 2, 467. [Google Scholar] [CrossRef] [PubMed]
  13. Qi, J.; Qian, Q.; Bu, Q.; Li, S.; Chen, Q.; Sun, J.; Liang, W.; Zhou, Y.; Chu, C.; Li, X.; et al. Mutation of the rice narrow leaf1 gene, which encodes a novel protein, affects vein patterning and polar auxin transport. Plant Physiol. 2008, 147, 1947–1959. [Google Scholar] [CrossRef] [Green Version]
  14. Fujita, D.; Trijatmiko, K.R.; Tagle, A.G.; Sapasap, M.V.; Koide, Y.; Sasaki, K.; Tsakirpaloglou, N.; Gannaban, R.B.; Nishimura, T.; Yanagihara, S.; et al. NAL1 allele from a rice landrace greatly increases yield in modern indica cultivars. Proc. Natl. Acad. Sci. USA 2013, 110, 20431–20436. [Google Scholar] [CrossRef] [Green Version]
  15. Takai, T.; Adachi, S.; Taguchi-Shiobara, F.; Sanoh-Arai, Y.; Iwasawa, N.; Yoshinaga, S.; Hirose, S.; Taniguchi, Y.; Yamanouchi, U.; Wu, J.; et al. A natural variant of NAL1, selected in high-yield rice breeding programs, pleiotropically increases photosynthesis rate. Sci. Rep. 2013, 3, 2149. [Google Scholar] [CrossRef] [PubMed]
  16. Zhang, G.-H.; Li, S.-Y.; Wang, L.; Ye, W.-J.; Zeng, D.-L.; Rao, Y.-C.; Peng, Y.-L.; Hu, J.; Yang, Y.-L.; Xu, J.; et al. LSCHL4 from japonica cultivar, which is allelic to NAL1, increases yield of indica super rice 93–11. Mol. Plant 2014, 7, 1350–1364. [Google Scholar] [CrossRef] [PubMed] [Green Version]
  17. Chen, M.; Luo, J.; Shao, G.; Wei, X.; Tang, S.; Sheng, Z.; Song, J.; Hu, P. Fine mapping of a major QTL for flag leaf width in rice, qFLW4, which might be caused by alternative splicing of NAL1. Plant Cell Rep. 2012, 31, 863–872. [Google Scholar] [CrossRef] [PubMed]
  18. Xu, J.L.; Wang, Y.; Zhang, F.; Wu, Y.; Zheng, T.Q.; Wang, Y.H.; Zhao, X.Q.; Cui, Y.R.; Chen, K.; Zhang, Q.; et al. SS1 (NAL1)- and SS2-mediated genetic networks underlying source-sink and yield traits in rice (Oryza sativa L.). PLoS ONE 2015, 10, e0132060. [Google Scholar] [CrossRef] [Green Version]
  19. Jiang, D.; Fang, J.; Lou, L.; Zhao, J.; Yuan, S.; Yin, L.; Sun, W.; Peng, L.; Guo, B.; Li, X. Characterization of a null allelic mutant of the rice nal1 gene reveals its role in regulating cell division. PLoS ONE 2015, 10, e0118169. [Google Scholar] [CrossRef] [Green Version]
  20. Cho, S.H.; Yoo, S.H.; Zhang, H.; Lim, J.H.; Paek, N.C. Rice NARROW LEAF1 regulates leaf and adventitious root development. Plant Mol. Biol. Rep. 2014, 32, 270–281. [Google Scholar] [CrossRef]
  21. Taguchi-Shiobara, F.; Ota, T.; Ebana, K.; Ookawa, T.; Yamasaki, M.; Tanabata, T.; Yamanouchi, U.; Wu, J.; Ono, N.; Nonoue, Y.; et al. Natural variation in the flag leaf morphology of rice due to a mutation of the NARROW LEAF 1 gene in Oryza sativa L. Genetics 2015, 201, 795–808. [Google Scholar] [CrossRef] [Green Version]
  22. Kubo, F.C.; Yasui, Y.; Kumamaru, T.; Sato, Y.; Hirano, H.Y. Genetic analysis of rice mutants responsible for narrow leaf phenotype and reduced vein number. Genes Genet. Syst. 2016, 91, 235–240. [Google Scholar] [CrossRef] [PubMed] [Green Version]
  23. Lin, L.; Zhao, Y.; Liu, F.; Chen, Q.; Qi, J. Narrow leaf 1 (NAL1) regulates leaf shape by affecting cell expansion in rice (Oryza sativa L.). Biochem. Biophys. Res. Commun. 2019, 516, 957–962. [Google Scholar] [CrossRef] [PubMed]
  24. Huang, Y.; Zhao, S.; Fu, Y.; Sun, H.; Ma, X.; Tan, L.; Liu, F.; Sun, X.; Sun, H.; Gu, P.; et al. Variation in the regulatory region of FZP causes increases in secondary inflorescence branching and grain yield in rice domestication. Plant J. 2018, 96, 716–733. [Google Scholar] [CrossRef] [Green Version]
  25. Baack, E.J.; Rieseberg, L.H. A genomic view of introgression and hybrid speciation. Curr. Opin. Genet. Develop. 2007, 17, 513–518. [Google Scholar] [CrossRef] [Green Version]
  26. Zou, J.; Fu, D.; Gong, H.; Qian, W.; Xia, W.; Pires, J.C.; Li, R.; Long, Y.; Mason, A.S.; Yang, T.-J.; et al. De novo genetic variation associated with retrotransposon activation, genomic rearrangements, and trait variation in a recombinant inbred line population of Brassica napus derived from interspecific hybridization with Brassica rapa. Plant J. 2011, 68, 212–224. [Google Scholar] [CrossRef] [PubMed]
  27. Bashir, T.; Mishra, R.C.; Hasan, M.M.; Mohanta, T.K.; Bae, H. Effect of hybridization on somatic mutations and genomic rearrangements in plants. Intl. J. Mol. Sci. 2018, 19, 3758. [Google Scholar] [CrossRef] [PubMed] [Green Version]
  28. Chai, C.; Shankar, R.; Jain, M.; Subudhi, P.K. Genome-wide discovery of DNA polymorphisms by whole genome sequencing differentiates weedy and cultivated rice. Sci. Rep. 2018, 8, 14218. [Google Scholar] [CrossRef]
  29. Subudhi, P.K.; De Leon, T.; Singh, P.K.; Parco, A.; Cohn, M.A.; Sasaki, T. A chromosome segment substitution library of weedy rice for genetic dissection of complex agronomic and domestication traits. PLoS ONE 2015, 10, e0130650. [Google Scholar] [CrossRef] [Green Version]
  30. Thomson, T.M.; Lozano, J.J.; Loukili, N.; Carrió, R.; Serras, F.; Cormand, B.; Valeri, M.; DíazV, M.; Abril, J.; Burset, M.; et al. Fusion of the human gene for the polyubiquitination coeffector UEV1 with Kua, a newly identified gene. Genome Res. 2000, 10, 1743–1756. [Google Scholar] [CrossRef] [Green Version]
  31. Chen, H.; Tang, Y.; Liu, J.; Tan, L.; Jiang, J.; Wang, M.; Zhu, Z.; Sun, X.; Sun, C. Emergence of a novel chimeric gene underlying grain number in rice. Genetics 2017, 205, 993–1002. [Google Scholar] [CrossRef] [PubMed]
  32. Wang, W.; Zheng, H.; Fan, C.; Li, J.; Shi, J.; Cai, Z.; Zhang, G.; Liu, D.; Zhang, J.; Vang, S.; et al. High rate of chimeric gene origination by retroposition in plant genomes. Plant Cell 2006, 18, 1791–1802. [Google Scholar] [CrossRef] [PubMed] [Green Version]
  33. Long, M.; Betrán, E.; Thornton, K.; Wang, W. The origin of new genes: Glimpses from the young and old. Nat. Rev. Genet. 2003, 4, 865–875. [Google Scholar] [CrossRef]
  34. Itoh, J.; Hibara, K.; Sato, Y.; Nagato, Y. Developmental role and auxin responsiveness of Class III homeodomain leucine zipper gene family members in rice. Plant Physiol. 2008, 147, 1960–1975. [Google Scholar] [CrossRef] [Green Version]
  35. Itoh, J.; Nonomura, K.; Ikeda, K.; Yamaki, S.; Inukai, Y.; Yamagishi, H.; Kitano, H.; Nagato, Y. Rice plant development: From zygote to spikelet. Plant Cell Physiol. 2005, 46, 23–47. [Google Scholar] [CrossRef] [PubMed] [Green Version]
  36. Mathan, J.; Bhattacharya, J.; Ranjan, A. Enhancing crop yield by optimizing plant developmental features. Development 2016, 143, 3283–3294. [Google Scholar] [CrossRef] [Green Version]
  37. Frey, M.; Chomet, P.; Glawischnig, E.; Stettner, C.; Grün, S.; Winklmair, A.; Eisenreich, W.; Bacher, A.; Meeley, R.B.; Briggs, S.P.; et al. Analysis of a chemical plant defense mechanism in grasses. Science 1997, 277, 696–699. [Google Scholar] [CrossRef]
  38. Lu, G.; Coneva, V.; Casaretto, J.A.; Ying, S.; Mahmood, K.; Liu, F.; Nambara, E.; Bi, Y.M.; Rothstein, S.J. OsPIN5b modulates rice (Oryza sativa) plant architecture and yield by changing auxin homeostasis, transport and distribution. Plant J. 2015, 83, 913–925. [Google Scholar] [CrossRef]
  39. Saini, S.; Sharma, I.; Pati, P.K. Versatile roles of brassinosteroid in plants in the context of its homoeostasis, signaling and crosstalks. Front. Plant Sci. 2015, 6, 950. [Google Scholar] [CrossRef] [Green Version]
  40. Schwechheimer, C. Gibberellin signaling in plants—The extended version. Front. Plant Sci. 2011, 2, 107. [Google Scholar] [CrossRef] [Green Version]
  41. Tong, H.; Xiao, Y.; Liu, D.; Gao, S.; Liu, L.; Yin, Y.; Jin, Y.; Qian, Q.; Chua, C. Brassinosteroid regulates cell elongation by modulating gibberellin metabolism in rice. Plant Cell 2014, 26, 376–4393. [Google Scholar] [CrossRef] [PubMed] [Green Version]
  42. Hofmann, N.R. Taking hormone crosstalk to a new level: Brassinosteroids regulate gibberellin biosynthesis. Plant Cell 2015, 27, 2081. [Google Scholar] [CrossRef] [Green Version]
  43. Ueguchi-Tanaka, M.; Nakajima, M.; Motoyuki, A.; Matsuoka, M. Gibberellin receptor and its role in gibberellin signaling in plants. Annu. Rev. Plant Biol. 2007, 58, 183–198. [Google Scholar] [CrossRef] [Green Version]
  44. Nahirnak, V.; Almasia, N.I.; Hopp, H.E.; Vazquez-Rovere, C. Snakin/GASA proteins: Involvement in hormone crosstalk and redox homeostasis. Plant Signal. Behav. 2012, 7, 1004–1008. [Google Scholar] [CrossRef] [Green Version]
  45. Khew, C.Y.; Teo, C.J.; Chan, W.S.; Wong, H.L.; Namasivayam, P.; Ho, C.L. Brassinosteroid insensitive 1-associated kinase 1 (OsI-BAK1) is associated with grain filling and leaf development in rice. J. Plant Physiol. 2015, 182, 23–32. [Google Scholar] [CrossRef] [PubMed]
  46. He, J.X.; Gendron, J.M.; Sun, Y.; Gampala, S.S.L.; Gendron, N.; Sun, C.Q.; Wang, Z.Y. BZR1 is a transcriptional repressor with dual roles in brassinosteroid homeostasis and growth responses. Science 2005, 307, 1634–1638. [Google Scholar] [CrossRef] [Green Version]
  47. Wang, Z.Y.; Bai, M.; Oh, E.; Zhu, J.Y. Brassinosteroid signaling network and regulation of photomorphogenesis. Annu. Rev. Genet. 2012, 46, 701–724. [Google Scholar] [CrossRef] [PubMed]
  48. Caño-Delgado, A.; Yin, Y.; Yu, C.; Vafeados, D.; Mora-García, S.; Cheng, J.C.; Nam, K.H.; Li, J.; Chory, J. BRL1 and BRL3 are novel brassinosteroid receptors that function in vascular differentiation in Arabidopsis. Development 2004, 131, 5341–5351. [Google Scholar] [CrossRef] [Green Version]
  49. Linscombe, S.D.; Jodari, F.; Mckenzie, K.S.; Bollich, P.K.; White, L.M.; Groth, D.E.; Dunand, R.T. Registration of Cypress rice. Crop. Sci. 1993, 33, 355. [Google Scholar] [CrossRef]
  50. Linscombe, S.D.; Jodari, F.; Mckenzie, K.S.; Bollich, P.K.; White, L.M.; Groth, D.E.; Dunand, R.T. Registration of Bengal rice. Crop. Sci. 1993, 33, 645–646. [Google Scholar] [CrossRef]
  51. Subudhi, P.K.; Parco, A.; Singh, P.K.; De Leon, T.; Karan, R.; Biradar, H.; Cohn, M.A.; Brar, D.S.; Sasaki, T. Genetic architecture of seed dormancy in US weedy rice in different genetic backgrounds. Crop. Sci. 2012, 52, 2564–2575. [Google Scholar] [CrossRef]
  52. Michelmore, R.W.; Paran, I.; Kesseli, R.V. Identification of markers linked to disease resistance genes by bulked segregant analysis: A rapid method to detect markers in specific genomic regions by using segregating populations. Proc. Natl. Acad. Sci. USA 1991, 88, 9828–9832. [Google Scholar] [CrossRef] [PubMed] [Green Version]
  53. Doyle, J.J.; Doyle, J.L. A rapid DNA isolation procedure for small quantities of fresh leaf tissue. Phytochem. Bullet. 1987, 19, 11–15. [Google Scholar]
  54. Bentley, D.R.; Balasubramanian, S.; Swerdlow, H.P.; Smith, G.P.; Milton, J.; Brown, C.G.; Hall, K.P.; Evers, D.J.; Barnes, C.L.; Bignell, H.R.; et al. Accurate whole human genome sequencing using reversible terminator chemistry. Nature 2008, 456, 53–59. [Google Scholar] [CrossRef] [PubMed]
  55. Li, H.; Handsaker, B.; Wysoker, A.; Fennell, T.; Ruan, J.; Homer, N.; Marth, G.; Abecasis, G.; Durbin, R. The Sequence Alignment/Map format and SAMtools. Bioinformatics 2009, 25, 2078–2079. [Google Scholar] [CrossRef] [PubMed] [Green Version]
  56. Li, H.; Durbin, R. Fast and accurate short read alignment with Burrows-Wheeler Transform. Bioinformatics 2009, 25, 1754–1760. [Google Scholar] [CrossRef] [Green Version]
  57. Kawahara, Y.; De La Bastide, M.; Hamilton, J.P.; Kanamori, H.; McCombie, W.R.; Ouyang, S.; Schwartz, D.C.; Tanaka, T.; Wu, J.; Zhou, S.; et al. Improvement of the Oryza sativa Nipponbare reference genome using next generation sequence and optical map data. Rice 2013, 6, 4. [Google Scholar] [CrossRef] [Green Version]
  58. Eisfeldt, J.; Vezzi, F.; Olason, P.; Nilsson, D.; Lindstrand, A. TIDDIT, an efficient and comprehensive structural variant caller for massive parallel sequencing data. F1000 Res. 2017, 6, 664. [Google Scholar] [CrossRef]
  59. Van Der Auwera, G.A.; Carneiro, M.O.; Hartl, C.; Poplin, R.; Del Angel, G.; Levy-Moonshine, A.; Jordan, T.; Shakir, K.; Roazen, D.; Thibault, J.; et al. From FastQ data to high confidence variant calls: The Genome Analysis Toolkit best practices pipeline. Curr. Protoc. Bioinform. 2013, 43, 11.10.1–11.10.33. [Google Scholar]
  60. Cingolani, P.; Platts, A.; Wang, L.; Coon, M.; Nguyen, T.; Wang, L.; Land, S.; Lu, X.; Ruden, D. A program for annotating and predicting the effects of single nucleotide polymorphisms, SnpEff. Fly 2012, 6, 80–92. [Google Scholar] [CrossRef] [Green Version]
  61. Kim, D.; Paggi, J.M.; Park, C.; Bennett, C.; Salzberg, S.L. Graph-based genome alignment and genotyping with HISAT2 and HISAT-genotype. Nat. Biotechnol. 2019, 37, 907–915. [Google Scholar] [CrossRef]
  62. Liao, Y.; Smyth, G.K.; Shi, W. featureCounts: An efficient general-purpose program for assigning sequence reads to genomic features. Bioinformatics 2014, 30, 923–930. [Google Scholar] [CrossRef] [Green Version]
  63. Love, M.I.; Huber, W.; Anders, S. Moderated estimation of fold change and dispersion for RNA-seq data with DESeq2. Genome Biol. 2014, 15, 550. [Google Scholar] [CrossRef] [Green Version]
  64. Tian, T.; Liu, Y.; Yan, H.; You, Q.; Yi, X.; Du, Z.; Xu, W.; Su, Z. AgriGO v2.0: A GO analysis toolkit for the agricultural community, 2017 update. Nucl. Acids Res. 2017, 45, W122–W129. [Google Scholar] [CrossRef]
  65. Pertea, M.; Pertea, G.M.; Antonescu, C.M.; Chang, T.C.; Mendell, J.T.; Salzberg, S.L. StringTie enables improved reconstruction of a transcriptome from RNA-seq reads. Nat. Biotechnol. 2015, 33, 290–295. [Google Scholar] [CrossRef] [PubMed] [Green Version]
  66. Fu, J.; Frazee, A.C.; Collado-Torres, L.; Jaffe, A.E.; Leek, J.T. Ballgown: Flexible, Isoform-Level Differential Expression Analysis. R Package Version 2.18.0. 2019. Available online: https://rdrr.io/bioc/ballgown/ (accessed on 29 October 2020).
  67. Willems, E.; Leyns, L.; Vandesompele, J. Standardization of real-time PCR gene expression data from independent biological replicates. Anal. Biochem. 2008, 379, 127–129. [Google Scholar] [CrossRef] [PubMed]
  68. McSteen, P. Hormonal regulation of branching in grasses. Plant Physiol. 2009, 149, 46–55. [Google Scholar] [CrossRef] [Green Version]
Figure 1. (A) Overall morphology of Cypress (Left), W149 (middle), and PSRR-1 (right); (B) segregation of mutant and normal plants in field condition. The mutant plants are marked by red arrows.
Ijms 21 08106 g001
Figure 2. Location of the 1395-bp deletion in the nal1 locus (LOC_Os04g52479) in W149 genome. (A) The deletion encompasses a part of exon 4, exon 5, 3′ untranslated region (3‘UTR), and downstream regions of LOC_Os04g52479, indicated by red bars. (B) Sequence alignment of PSRR-1, Cypress, and W149 Nal1 alleles containing the deletion (highlighted in thick red bar) with genomic coordinates 31,213,519-31,214,913 of chromosome 4. The deletion was verified by Sanger sequencing of PCR fragments. Forward and reverse primers are highlighted with yellow and green boxes, respectively.
Ijms 21 08106 g002
Figure 3. Genotyping of representative F2 progenies of the cross W149 × Cypress to distinguish homozygous normal, heterozygous normal, and homozygous mutant plants. (A) PCR amplification by the Primer pair 1 (1F and 1R); (B) PCR amplification by the Primer pair 3 (2F and 2R).
Ijms 21 08106 g003
Figure 4. Morphological responses of Cypress and W149 mutant to various plant hormones application. Variations in plant height (A) and root length (B) after treatment of various phytohormones (0.5 mg/L of nutrient solution) compared to untreated (control) are shown. The hormones are indole-3-butyric acid (IBA), 1-naphthaleneacetic acid (NAA), 2,4-dichlorophenoxyacetic acid (2,4-D), and gibberellic acid (GA3). Means with similar letters indicate no difference in one-way ANOVA analysis (p < 0.05; n = 10).
Ijms 21 08106 g004
Figure 5. Volcano plot to identify differentially expressed genes in W149 compared with Cypress using DESeq2 R Package. The mean log2 fold change is plotted against the −log10 Benjamini–Hochberg-adjusted P-values for all expressed genes. X-axis dotted line represents log2 fold change threshold (≥1.5 and ≤−1.5) while y-axis dotted line is the adjusted p-value cut-off point (<0.05). Red dots represent 330 differentially expressed genes. Gray dots represent genes that did not pass the filtering criteria. Plot was visualized using R package “EnhancedVolcano.”
Ijms 21 08106 g005
Figure 6. Gene ontology (GO) analysis using agriGO v2.0 reveals enrichment of the differentially expressed genes in W149 compared with Cypress. The significant GO terms are shown on the panel on the left. Yellow bars represent −log (adjusted p-values), whereas green bars show the number of genes for each GO term.
Ijms 21 08106 g006
Figure 7. Sashimi plots showing spliced junction (marked yellow) between Nal1 (LOC_Os04g52479) and LOC_Os04g52500 in W149 compared to Cypress. The height of the bars represents read coverage. The splice junctions are displayed as loops. The exon numbers I through V of Nal1 are indicated on the top of the panel. The MSU v7.0 gene model with three known transcript variations of Nal1 is displayed below. The plots were visualized using IGV (v.2.8.4, Broad Institute, Cambridge, MA, USA).
Ijms 21 08106 g007
Figure 8. Transcripts identified in W149 and Cypress using Stringtie (v2.1.0). The LOC_Os04g52479.1 and LOC_Os04g52479.2 transcripts are ~2.6 kb in length while the LOC_Os04g52479.3 transcript is ~2.5 kb. The LOC_Os04g52500.1 is located downstream of the Nal1 gene with ~2.4 kb in length. The Nal1-chimeric transcript 1 (Nal-cht1) arises through splicing of the partial Nal1-exon 4 (Nal1-ex4) of W149 to the exon 1 of LOC_Os04g52500.1, producing a transcript with a length of ~4.3 kb. The Nal1-cht2 arises when Nal1-exon3 (Nal1-ex3) is spliced directly to the exon2 of LOC_Os04g52500.1, resulting in a ~3.2 kb transcript. The color shading represents the fragments per kilobase of transcript per million reads (FPKM) values of each transcript produced from Stringtie analysis. The transcripts were visualized using the R package “ballgown.”
Ijms 21 08106 g008
Figure 9. Relative mRNA expression of seven differentially expressed genes in W149 compared with Cypress. Genes plotted are representative of each significant GO term such as photosynthesis, plant growth and development, and reproductive tissue. The y-axis represents the relative mRNA expression value (mean ± standard deviation) from quantitative real-time PCR (qRT-PCR) and RNA-Seq results. Cypress was used as the control and the EF1α gene was used as the endogenous control. The genes are chlorophyll a/b-binding protein (LOC_Os01g52240), indole-3-glycerol phosphate lyase (LOC_Os03g58290), photosynthetic reaction center protein (LOC_Os10g39880), brassinazole-resistant 1 protein (BZR4) (LOC_Os02g13900), cytochrome P450 (LOC_Os01g24780), G1 Like Protein 2 (G1L2) (LOC_Os06g46030), and OsMADS62 (LOC_Os08g38590).
Ijms 21 08106 g009
Table 1. Phenotypic characteristics of Cypress and W149 mutant. The mean value of each attribute is indicated by the mean ± standard deviation and sample size is indicated in parentheses. Asterisks indicate significant differences between Cypress and W149 mutant, as determined by Student’s t-test.
AttributeCypressW149
Plant height (cm)81.1 ± 1.6 (10)50.7 ± 1.9 * (10)
Panicle length (cm)18.6 ± 0.3 (10)11.3 ± 0.3 * (10)
Leaf length (cm)43.0 ± 2.0 (10)22.9 ± 0.7 * (10)
Leaf width (cm)1.2 ± 0.0 (10)0.5 ± 0.0 * (10)
Leaf greenness (SPAD value)41.9 ± 0.8 (10)50.9 ± 0.6 * (10)
Number of large veins (LV)9.6 ± 0.3 (5)9.2 ± 0.4 ns (5)
Number of small veins (SV)52.4 ± 0.7 (5)29.6 ± 0.5 * (5)
Number of SV between LV6.14 ± 0.3 (7)3.6 ± 0.2 * (7)
Leaf midribPronouncedNot pronounced
Leaf thickness (µm)90.2 ± 3.3 (9)139.1 ± 0.6 * (9)
Interveinal distance (µm)198.1 ± 4.4 (9)152.3 ± 4.1 * (9)
Mesophyll cell (MC) area (µm2)10683.1 ± 254.5 (9)11941.7 ± 717.6 ns (9)
Lateral MC number10.1 ± 0.3 (9)5.0 ± 0.1 * (9)
MC layer number3.3 ± 0.2 (9)4.7 ± 0.2 * (9)
Vascular area (µm2)589.0 ± 29.4 (18)963.0 ± 75.3 * (18)
Bundle sheath cell (BSC) area (µm2)1557.6 ± 22.7 (18)2759.4 ± 131.8 * (18)
Vascular bundle + BSC area (µm2)2146.6 ± 31.71 (18)3722.4 ± 190.6 * (18)
Bundle sheath cell extension number1.9 ± 0.2 (18)5.2 ± 0.3 *(18)
Panicle neck (mm2)0.7 ± 0.0 (3)0.2 ± 0.0 * (3)
Number of grains per panicle270.2 ± 24.3 (9)89.6 ± 10.0 * (9)
100-grain weight (g)2.2 ± 0.04 (9)1.8 ± 0.05 * (9)
Total grain weight per panicle (g)5.9 ± 0.56 (9)1.6 ± 0.21 * (9)
* 0.01 ≤ p < 0.05, ns not significant.
Publisher’s Note: MDPI stays neutral with regard to jurisdictional claims in published maps and institutional affiliations.

