

Anti-TCP1 Antibody Is a Potential Biomarker for Diagnosing Systemic Lupus Erythematosus

 ,
,  , ,
, , 
Abstract
1. Introduction
2. Results
2.1. SLE Autoantibody Selection Using 21K Protein Chip
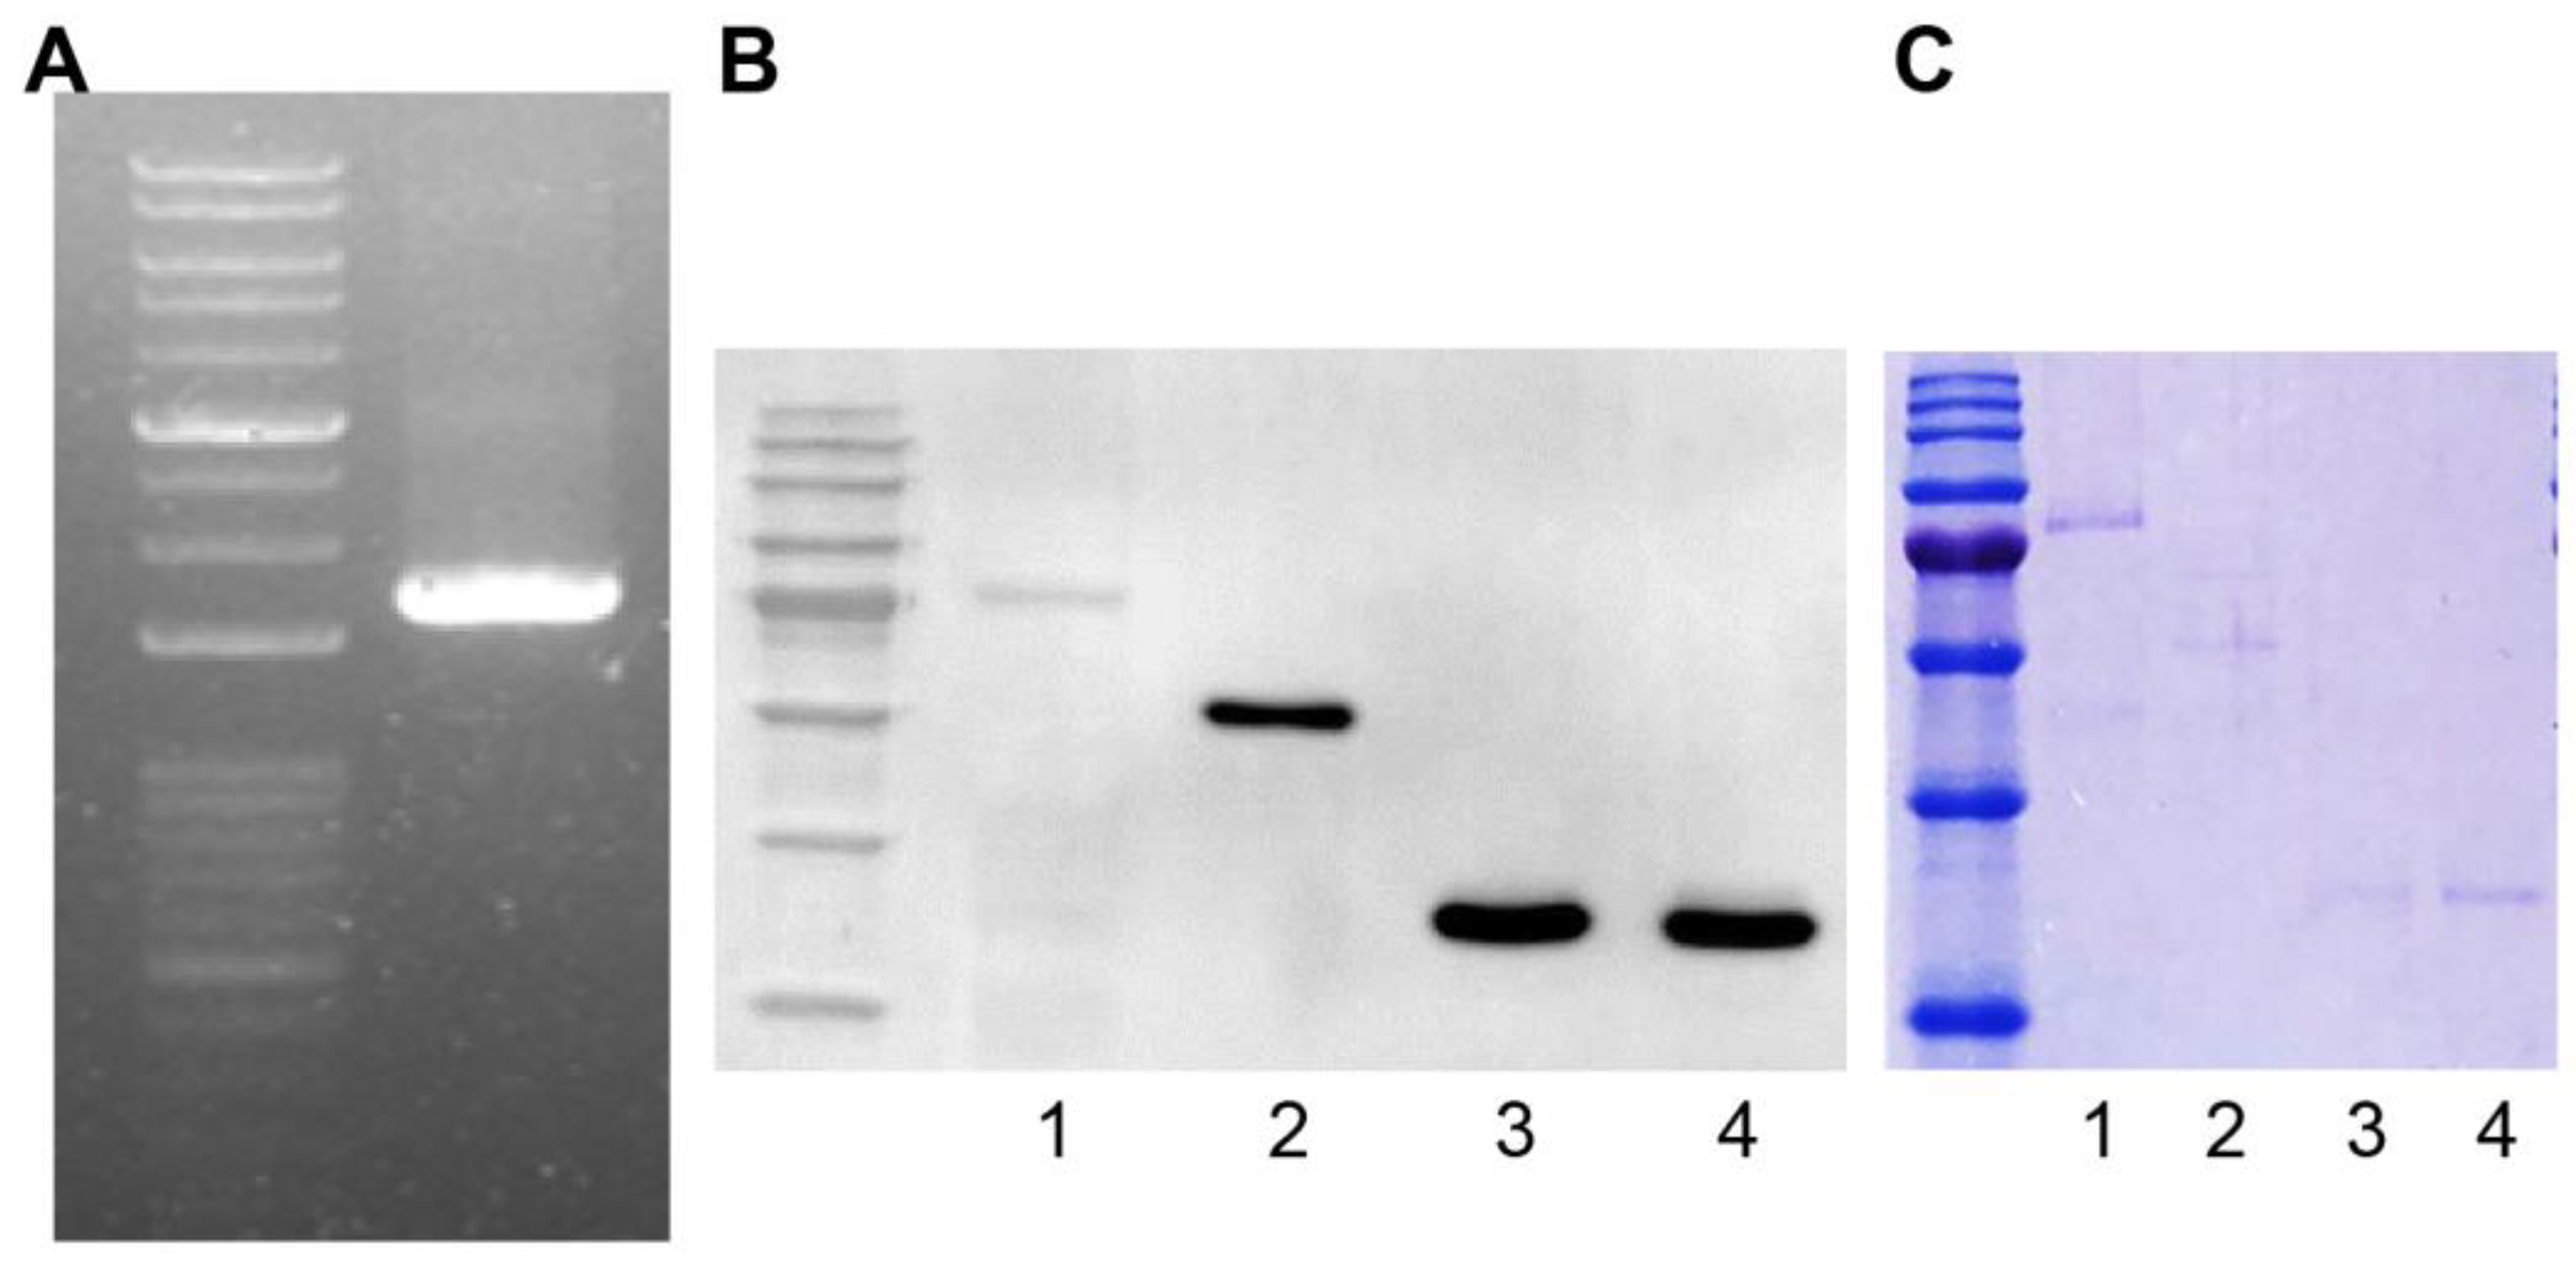
2.2. GST Fusion Protein Construction
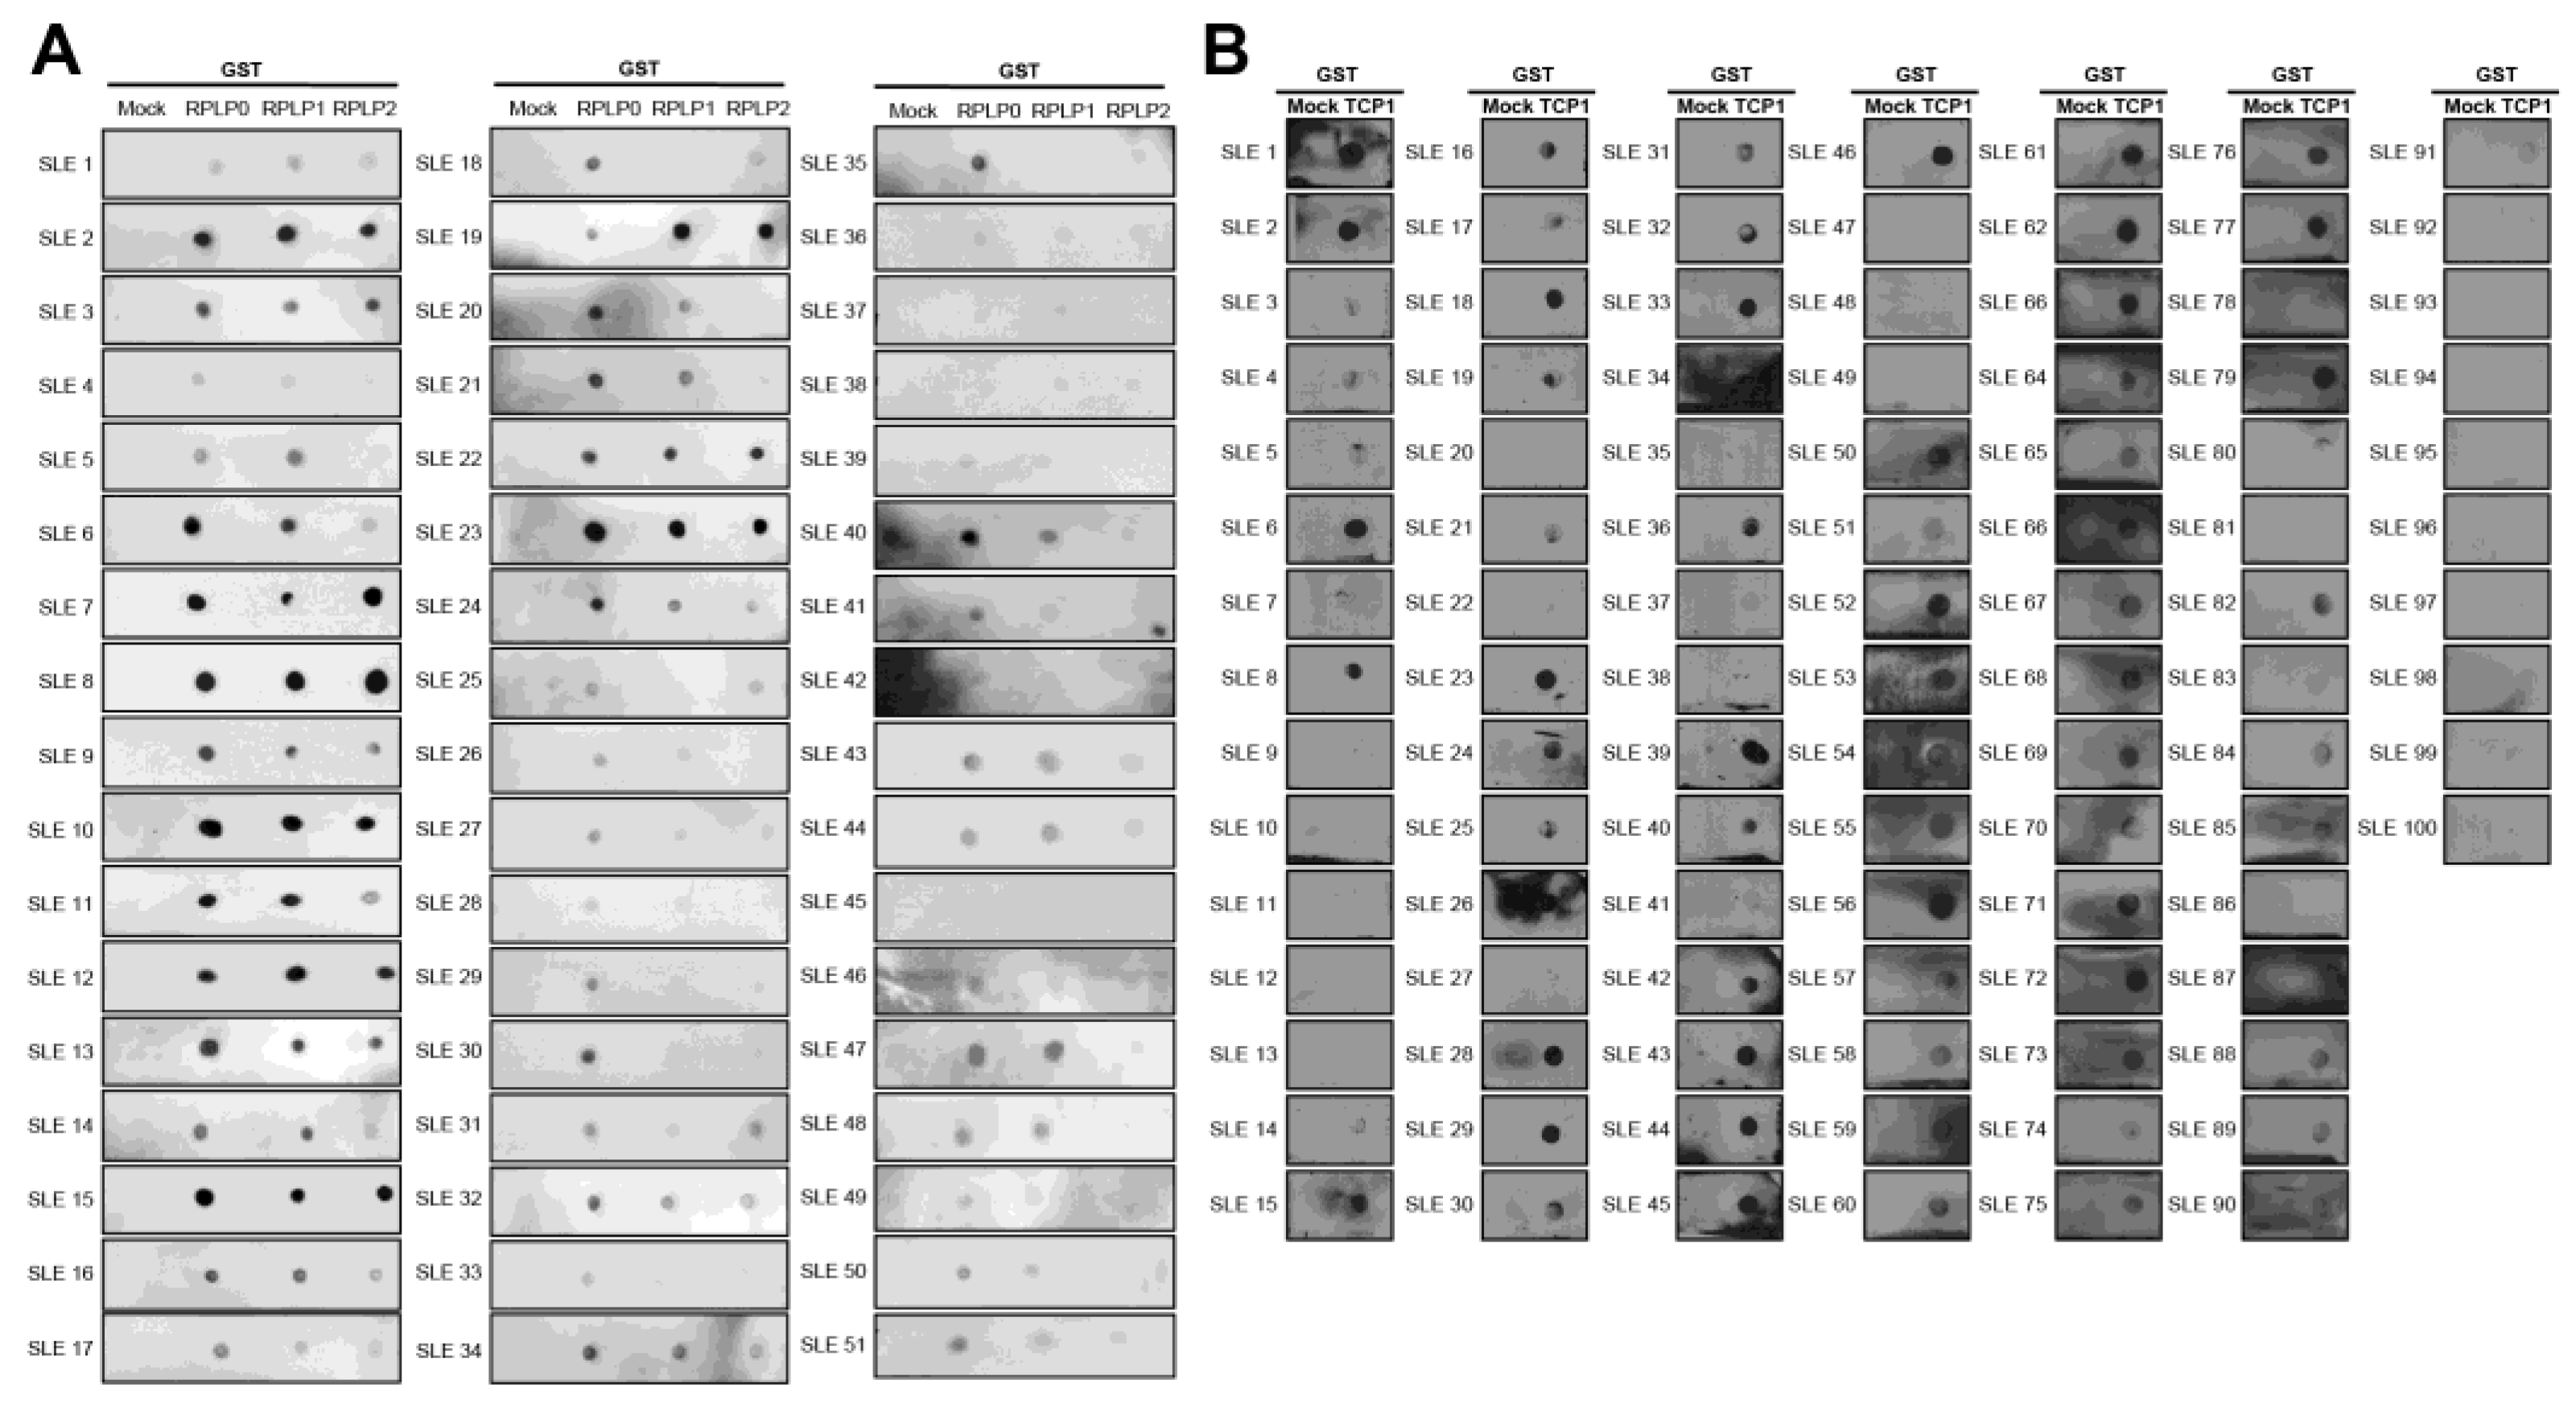
2.3. The Expression of Anti-TCP1 Antibody in Patients with SLE in the Dot Blot
2.4. Expression of Anti-TCP1 Antibody in Patients with Other Autoimmune Diseases in the Dot Blot
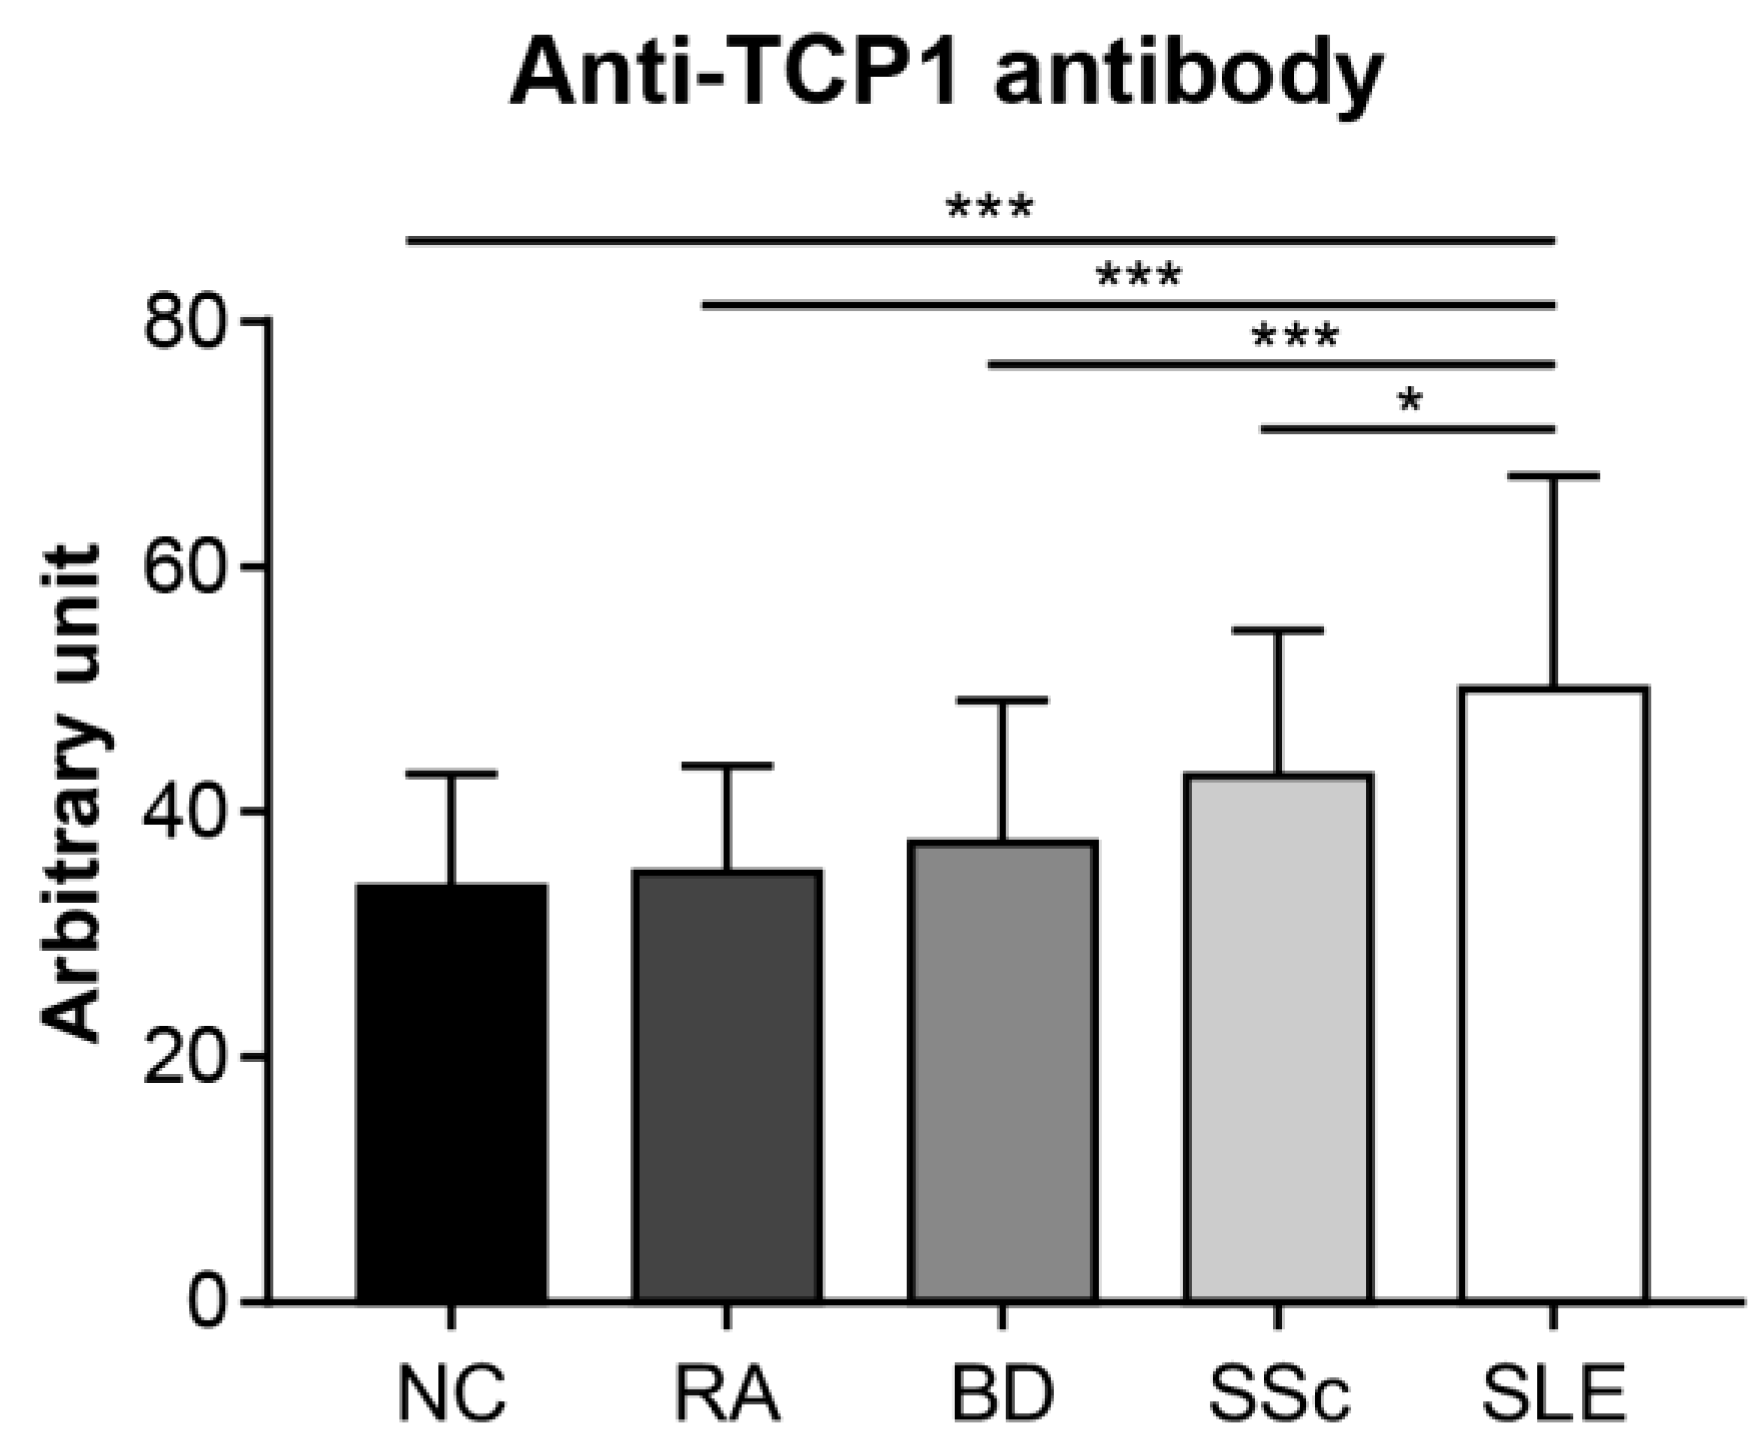
2.5. Anti-TCP1 Antibody Expression in the ELISA
3. Discussion
4. Materials and Methods
4.1. Patients and Samples
4.2. Human Protein Microarray
4.3. Polymerase Chain Reaction (PCR)
4.4. Cloning
4.5. Plasmid DNA Extraction and Sequencing
4.6. Inserting Recombinant DNA Using the Bac-to-Bac System and Bacmid Extraction
4.7. Transfection
4.8. Western Blotting Assay
4.9. GST-Fused Protein Purification
4.10. Dot-Blotting Assay
4.11. ELISA
4.12. Statistical Analysis
Supplementary Materials
Author Contributions
Funding
Institutional Review Board Statement
Informed Consent Statement
Data Availability Statement
Conflicts of Interest
Abbreviations
| RA | Rheumatoid arthritis |
| BD | Behçet disease |
| SSc | Systemic sclerosis |
| NC | Normal control |
| TCP1 | Chaperonin-containing t-complex polypeptide 1 |
| GST | Glutathione S-transferases |
| ELISA | Enzyme-linked immunosorbent assay |
| RPLP0 | 60S acidic ribosomal protein P0 |
| RPLP1 | 60S acidic ribosomal protein P1 |
| RPLP2 | 60S acidic ribosomal protein P2 |
| AU | Arbitrary unit |
| OD | Optical density |
| PCR | Polymerase chain reaction |
| SLEDAI | Systemic lupus erythematosus disease activity index |
| SD | Standard deviations |
| TBST | Tris-buffered saline with tween 20 |
| PBST | Phosphate-buffered saline with tween 20 |
References
- Duan, L.; Rao, X.; Sigdel, K.R. Regulation of Inflammation in Autoimmune Disease. J. Immunol. Res. 2019, 2019, 7403796. [Google Scholar] [CrossRef] [PubMed]
- Ahmadpoor, P.; Dalili, N.; Rostami, M. An update on pathogenesis of systemic lupus erythematosus. Iran J. Kidney Dis. 2014, 8, 171–184. [Google Scholar] [PubMed]
- Elkon, K.; Casali, P. Nature and functions of autoantibodies. Nat. Clin. Pract. Rheumatol. 2008, 4, 491–498. [Google Scholar] [CrossRef] [PubMed]
- Zeinab, M.; Hiam, K.-M.; Edmond, C.; Assem, E. Selective adsorption of antiphospholipid and anti-dsDNA autoantibodies on histidine based pseudobioaffinity adsorbent from sera of patients with systemic lupus erythematosus (SLE). J. Chromatogr. B Analyt. Technol. Biomed Life Sci. 2015, 975, 77–83. [Google Scholar] [CrossRef]
- Esdaile, J.M.; Abrahamowicz, M.; MacKenzie, T.; Hayslett, J.P.; Kashgarian, M. The time-dependence of long-term prediction in lupus nephritis. Arthritis Rheum. 1994, 37, 359–368. [Google Scholar] [CrossRef]
- Petri, M.; Orbai, A.; Alarcón, G.S.; Gordon, C.; Merrill, J.T.; Fortin, P.R.; Bruce, I.N.; Isenberg, D.; Wallace, D.J.; Nived, O.; et al. Derivation and validation of the Systemic Lupus International Collaborating Clinics classification criteria for systemic lupus erythematosus. Arthritis Rheum. 2012, 64, 2677–2686. [Google Scholar] [CrossRef]
- Su, D.; Liu, R.; Li, X.; Sun, L. Possible novel biomarkers of organ involvement in systemic lupus erythematosus. Clin. Rheumatol. 2014, 33, 1025–1031. [Google Scholar] [CrossRef]
- Yu, C.; Gershwin, M.E.; Chang, C. Diagnostic criteria for systemic lupus erythematosus: A critical review. J. Autoimmun. 2014, 48–49, 10–13. [Google Scholar] [CrossRef]
- Aringer, M.; Costenbader, K.; Daikh, D.; Brinks, R.; Mosca, M.; Ramsey-Goldman, R.; Smolen, J.S.; Wofsy, D.; Boumpas, D.T.; Kamen, D.L.; et al. 2019 European League Against Rheumatism/American College of Rheumatology Classification Criteria for Systemic Lupus Erythematosus. Arthritis Rheumatol. 2019, 71, 1400–1412. [Google Scholar] [CrossRef]
- Ahmad, A.; Imran, M.; Ahsan, H. Biomarkers as Biomedical Bioindicators: Approaches and Techniques for the Detection, Analysis, and Validation of Novel Biomarkers of Diseases. Pharmaceutics 2023, 15, 1630. [Google Scholar] [CrossRef]
- Huang, Y.; Zhu, H. Protein Array-based Approaches for Biomarker Discovery in Cancer. Genom. Proteom. Bioinform. 2017, 15, 73–81. [Google Scholar] [CrossRef] [PubMed]
- Poetz, O.; Schwenk, J.M.; Kramer, S.; Stoll, D.; Templin, M.F.; Joos, T.O. Protein microarrays: Catching the proteome. Mech. Ageing Dev. 2005, 126, 161–170. [Google Scholar] [CrossRef] [PubMed]
- Sutandy, F.X.; Qian, J.; Chen, C.-S.; Zhu, H. Overview of protein microarrays. Curr. Protoc. Protein. Sci. 2013, 27, 2711–27116. [Google Scholar] [CrossRef] [PubMed]
- Fava, A.; Petri, M. Systemic lupus erythematosus: Diagnosis and clinical management. J. Autoimmun. 2019, 96, 1–13. [Google Scholar] [CrossRef] [PubMed]
- Leitner, A.; Joachimiak, L.A.; Bracher, A.; Mönkemeyer, L.; Walzthoeni, T.; Chen, B.; Pechmann, S.; Holmes, S.; Cong, Y.; Ma, B.; et al. The molecular architecture of the eukaryotic chaperonin TRiC/CCT. Structure 2012, 20, 814–825. [Google Scholar] [CrossRef]
- Reissmann, S.; Joachimiak, L.A.; Chen, B.; Meyer, A.S.; Nguyen, A.; Frydman, J. A gradient of ATP affinities generates an asymmetric power stroke driving the chaperonin TRIC/CCT folding cycle. Cell Rep. 2012, 2, 866–877. [Google Scholar] [CrossRef] [PubMed]
- Kubota, H.; Hynes, G.; Willison, K. The chaperonin containing t-complex polypeptide 1 (TCP-1). Multisubunit machinery assisting in protein folding and assembly in the eukaryotic cytosol. Eur. J. Biochem. 1995, 230, 3–16. [Google Scholar] [CrossRef] [PubMed]
- Han, W.; Jin, M.; Liu, C.; Zhao, Q.; Wang, S.; Wang, Y.; Yin, Y.; Peng, C.; Wang, Y.; Cong, Y. Structural basis of plp2-mediated cytoskeletal protein folding by TRiC/CCT. Sci. Adv. 2023, 9, eade1207. [Google Scholar] [CrossRef] [PubMed]
- Ma, H.; Murphy, C.; Loscher, C.E.; O’Kennedy, R. Autoantibodies—Enemies, and/or potential allies? Front. Immunol. 2022, 13, 953726. [Google Scholar] [CrossRef] [PubMed]
- Pisetsky, D.S. Pathogenesis of autoimmune disease. Nat. Rev. Nephrol. 2023, 19, 509–524. [Google Scholar] [CrossRef]
- Toubi, E.; Shoenfeld, Y. Clinical and biological aspects of anti-P-ribosomal protein autoantibodies. Autoimmun. Rev. 2007, 6, 119–125. [Google Scholar] [CrossRef] [PubMed]
- Hu, C.; Huang, W.; Chen, H.; Song, G.; Li, P.; Shan, Q.; Zhang, X.; Zhang, F.; Zhu, H.; Wu, L.; et al. Autoantibody profiling on human proteome microarray for biomarker discovery in cerebrospinal fluid and sera of neuropsychiatric lupus. PLoS ONE 2015, 10, e0126643. [Google Scholar] [CrossRef] [PubMed]
- Artero-Castro, A.; Perez-Alea, M.; Feliciano, A.; Leal, J.A.; Genestar, M.; Castellvi, J.; Peg, V.; Cajal, S.R.Y.; Lleonart, M.E. Disruption of the ribosomal P complex leads to stress-induced autophagy. Autophagy 2015, 11, 1499–1519. [Google Scholar] [CrossRef] [PubMed]
- Karassa, F.B.; Afeltra, A.; Ambrozic, A.; Chang, D.; De Keyser, F.; Doria, A.; Galeazzi, M.; Hirohata, S.; Hoffman, I.E.A.; Inanc, M.; et al. Accuracy of anti-ribosomal P protein antibody testing for the diagnosis of neuropsychiatric systemic lupus erythematosus: An international meta-analysis. Arthritis Rheum. 2006, 54, 312–324. [Google Scholar] [CrossRef]
- Naganuma, T.; Shiogama, K.; Uchiumi, T. The N-terminal regions of eukaryotic acidic phosphoproteins P1 and P2 are crucial for heterodimerization and assembly into the ribosomal GTPase-associated center. Genes Cells 2007, 12, 501–510. [Google Scholar] [CrossRef] [PubMed]
- Vanderlugt, C.J.; Miller, S.D. Epitope spreading. Curr. Opin. Immunol. 1996, 8, 831–836. [Google Scholar] [CrossRef] [PubMed]
- Aletaha, D.; Neogi, T.; Silman, A.J.; Funovits, J.; Felson, D.T.; Bingham, C.O., 3rd; Birnbaum, N.S.; Burmester, G.R.; Bykerk, V.P.; Cohen, M.D.; et al. 2010 rheumatoid arthritis classification criteria: An American College of Rheumatology/European League Against Rheumatism collaborative initiative. Ann. Rheum. Dis. 2010, 69, 1580–1588. [Google Scholar] [CrossRef] [PubMed]
- Criteria for diagnosis of Behcet’s disease. International Study Group for Behcet’s Disease. Lancet 1990, 335, 1078–1080. [Google Scholar]
- van den Hoogen, F.; Khanna, D.; Fransen, J.; Johnson, S.R.; Baron, M.; Tyndall, A.; Matucci-Cerinic, M.; Naden, R.P.; Medsger, T.A., Jr.; Carreira, P.E.; et al. 2013 classification criteria for systemic sclerosis: An American college of rheumatology/European league against rheumatism collaborative initiative. Ann. Rheum. Dis. 2013, 72, 1747–1755. [Google Scholar] [CrossRef]
- Chung, J.M.; Jung, Y.; Kim, Y.P.; Song, J.; Kim, S.; Kim, J.Y.; Kwon, M.; Yoon, J.H.; Kim, M.-D.; Lee, J.-K.; et al. Identification of the Thioredoxin-Like 2 Autoantibody as a Specific Biomarker for Triple-Negative Breast Cancer. J. Breast Cancer 2018, 21, 87–90. [Google Scholar] [CrossRef]


Disclaimer/Publisher’s Note: The statements, opinions and data contained in all publications are solely those of the individual author(s) and contributor(s) and not of MDPI and/or the editor(s). MDPI and/or the editor(s) disclaim responsibility for any injury to people or property resulting from any ideas, methods, instructions or products referred to in the content. |
© 2024 by the authors. Licensee MDPI, Basel, Switzerland. This article is an open access article distributed under the terms and conditions of the Creative Commons Attribution (CC BY) license (https://creativecommons.org/licenses/by/4.0/).
Share and Cite
Lee, S.-W.; Baek, W.-Y.; Park, S.-W.; Chung, J.-M.; Park, J.-H.; Kang, H.C.; Jung, J.-Y.; Suh, C.-H. Anti-TCP1 Antibody Is a Potential Biomarker for Diagnosing Systemic Lupus Erythematosus. Int. J. Mol. Sci. 2024, 25, 8612. https://doi.org/10.3390/ijms25168612
Lee S-W, Baek W-Y, Park S-W, Chung J-M, Park J-H, Kang HC, Jung J-Y, Suh C-H. Anti-TCP1 Antibody Is a Potential Biomarker for Diagnosing Systemic Lupus Erythematosus. International Journal of Molecular Sciences. 2024; 25(16):8612. https://doi.org/10.3390/ijms25168612
Chicago/Turabian StyleLee, Sang-Won, Wook-Young Baek, So-Won Park, Jee-Min Chung, Ji-Hyun Park, Ho Chul Kang, Ju-Yang Jung, and Chang-Hee Suh. 2024. "Anti-TCP1 Antibody Is a Potential Biomarker for Diagnosing Systemic Lupus Erythematosus" International Journal of Molecular Sciences 25, no. 16: 8612. https://doi.org/10.3390/ijms25168612
APA StyleLee, S.-W., Baek, W.-Y., Park, S.-W., Chung, J.-M., Park, J.-H., Kang, H. C., Jung, J.-Y., & Suh, C.-H. (2024). Anti-TCP1 Antibody Is a Potential Biomarker for Diagnosing Systemic Lupus Erythematosus. International Journal of Molecular Sciences, 25(16), 8612. https://doi.org/10.3390/ijms25168612