An Application of Entropy in Survey Scale

Department of Statistics, Dokuz Eylül University; Fen Edebiyat Fakültesi, Tınaztepe Kampüsü 35160 Buca İzmir, Turkey
*
Author to whom correspondence should be addressed.
Entropy 2009, 11(4), 598-605; https://doi.org/10.3390/e11040598
Submission received: 7 July 2009
/
Accepted: 11 October 2009
/
Published: 14 October 2009
Abstract
:This study demonstrates an application of entropy for information theory in the field of survey scale. Based on computer anxiety scale we obtain that the desired information may be achieved with fewer questions. In particular, one question is insufficient and two questions are necessary for a survey subscale.
Classification:
PACS 89.70.Cf.Classification:
MSC 94A171. Introduction
Surveys are used to collect quantitative information about items in a population. Developing a survey is as much an art as it is a science. In addition, just as an artist has a variety of different colors to choose from the palette, one has a variety of different question formats for inquiring one’s customers, clients and issues that are important to them. A good survey question should be short and straightforward. The scale used in a survey is defined by a set of two or more survey items that cohere in terms of individual’s responses. A scale combines an individual’s responses to a number of survey items into one score. Survey studies are common in political polling and government, health, social science and marketing research.
A scale that measures computer anxiety is dealt with in this study. The number of questions for intended information to be reached using this scale together with entropy values was investigated. Known to be the second law of thermodynamics and the measurement of uncertainty, the concept of entropy has had a wide variety of applications in almost all fields of science led by Shannon [1] within the scope of information theory. The use of entropy in psychological studies began as early as the 1950s by Cronbach [2]. Since then it has been continuing with an increasing trend. Lemay [3] brought the application of entropy in information theory to the studies in the field of psychology. This study applies also entropy in information theory.
The Department of Statistics at Dokuz Eylül University (DEU) has been heavily providing a computer-assisted instruction (CAI) by Problem Based Learning since 2001. Despite its advantages for students, CAI causes several disadvantages as well. Particularly for the students who have just encountered CAI, using computer creates some negative emotions, anxiety, worrying and stress. With a view to measuring this anxiety, the Computer Anxiety scale survey, developed by Ceyhan and Namlu [4] was applied to the freshmen of the Department of Statistics in the Faculty of Arts and Sciences at Dokuz Eylül University during 2007–2008 academic years. Scaling in this survey was examined under 3 subscales (factor) titles and the subscales were named “Emotion towards Computer (ETC)”, “Thought of Making a Mistake (TMM)” and “Anxiety towards Learning (ATL)”. First, the probability distribution tables were constructed by using the answers given by the students concerning the subscales of ETC, TMM and ATL. By using these tables, the Shannon entropy, joint entropy, relative entropy and mutual information values were calculated. Calculated entropy values were interpreted within the scope of the information theory and various recommendations were made to the researchers who may apply a similar study. Furthermore, whether there was a significant difference between these computer anxiety scores of students depending on genders by the “Computer Anxiety” scale was investigated by two sampling t tests and compared with the relative entropy.
2. Concepts of Entropy
This section briefly defines Shannon entropy, relative entropy (Kullback-Leibler divergence), joint entropy and mutual information. Shannon entropy is a simple quantitative measure of uncertainty in a data set. Let X be a discrete random variable, taking a finite number of possible values with respective probabilities for and . The Shannon entropy is defined by
in the works Cover [5] and Shannon [1]. The joint entropy measures how much uncertainty is contained in a joint system of two random variables. If the random variables are X and Y, the joint entropy given in Cover and Thomas [5] is
The mutual information of two random variables is a quantity that measures the mutual dependence of the two variables. The interpretation is that when mutual information is absent, marginal distributions are independent and their entropies add up to total entropy. When mutual information is positive, marginal distributions are dependent as some combinations occur relatively more often than other combinations do, and marginal entropies exceed total entropy by an amount equal to the mutual information. Mutual information for the random variables X and Y is evaluated by the formula
see Cover [5].
The Kullback-Leibler divergence is not a symmetric function of p and q. is also sometimes called the information gain about X if p is used instead of q. It is also called the relative entropy for q in the place of p. The relative entropy is an appropriate measure of the similarity of the underlying distribution. It may be calculated from
The properties of the relative entropy Equation (4) make it non-negative and it is zero if both distributions are equivalent namely, . The smaller the relative entropy is the more similar the distribution of the two variables and vice versa, see Kullback [6]. Note that throughout the paper log represents .
3. Methods
The survey was applied to 44 freshmen in order to measure computer anxiety in the Department of Statistics at the Faculty of Arts and Sciences of DEU at the beginning of academic year 2007–2008 before taking Computer Assisted Education. It consisted of 28 questions and its Cronbach’s coefficient α was determined from
as where n is the number of components, is the variance of the observed total test scores and is the variance of component i. In the first part, there was a section where demographical features were asked. This part was excluded from the 28 questions. Moreover, each question was evaluated with 1 to 4 scores in such a way that it would be one of the scales of “never, sometimes, frequently and always”. The attitude or information scores of the respondents of the survey was added separately and ordered. Accordingly, the students could get a minimum of 28 scores and a maximum of 112 scores in the survey carried out within the framework of this study. The change in this score also showed the anxiety degrees of students. For instance, the high score of any student as a result of this survey was an indication of the fact that the student concerned was stressful. In addition, several subscales were determined for these 28 questions. The scaling included in the survey was examined under 3 subscale titles. The first subscale was mentioned in the literature as “Emotion towards Computer”. The second is “Thought of Making a Mistake” and the final scale as “Anxiety towards Learning”. The subscale ETC had a total of 13 questions whereas the subscale TMM had 9 questions and the subscale ATL had 6 questions. The questions representing the subscales in the survey were determined separately and probability distribution tables were constructed separately for each subscale from the frequency values calculated considering the scores of the questions representing each subscale. Using these probability distribution tables, Shannon entropy values were computed for ETC, TMM and ATL. Equation (1) was used for this purpose. With a view to examining what kind of entropy values the subscales of ETC, TMM and ATL had with gender, joint probability distribution tables were constructed separately from the frequencies obtained from Gender-ETC, Gender-TMM and Gender-ATL scores. The joint entropy values of all subscales and gender were calculated separately from the joint probability distribution tables constructed by means of Equation (2). Mutual information values were computed separately for all subscales and gender using the same joint probability distribution tables. These values were calculated using Equation (3). Furthermore, the relative entropy values were computed by means of Equation (4) in order to examine whether the probability distributions of genders, calculated separately depending on all subscales, were similar or not. Then all values were interpreted within the scope of the information theory. In addition, whether there was a significant difference between the computer anxiety subscale scores depending on genders was examined by two sampling t tests. With the Chi-Square test, it was also investigated whether there was a statistically significant difference between the gender of students and whether they had their own computer.
4. Results
In the 44 freshmen undertaking the questionnaire, 21 were female and 23 were male. In addition, 18 of the female students and 17 of the male students had a computer. According to the result of the Chi-Square test, no statistically significant difference was found between gender of the students and computer ownership (p-value = 0.332). The descriptive statistics for computer anxiety score according to gender computed separately for three subscales are given in Table 1.

| Male | Female | |||||
| N | Mean | Stdev | N | Mean | Stdev | |
| Statotal | 23 | 40.96 | 10.61 | 21 | 54.48 | 15.45 |
| StaETC | 23 | 19.13 | 5.65 | 21 | 25.05 | 9.30 |
| StaTMM | 23 | 10.652 | 1.945 | 21 | 15.667 | 4.282 |
| StaATL | 23 | 11.174 | 4.345 | 21 | 13.762 | 2.982 |
Whether there was a significant difference in the mean computer anxiety subscale scores depending on genders was examined by two sampling t tests. The hypotheses and results of this test are given in Table 2. According to these results, a statistically significant difference was found between the mean anxiety scores of male and female students with the “Computer Anxiety” scale both in total and among the subscales (). The mean computer anxiety score for male students was lower.
| Hypotheses | p-value | |
| [2mm]Statotal | ||
| StaETC | ||
| StaTMM | ||
| StaATL | ||
| *Significant at M: Male, F: Female | ||
The subscales of ETC, TMM and ATL were regarded as random variables in the study in order to compute the entropy values. The Shannon entropy values were calculated by using the probability distributions constructed for the random variables of ETC, TMM and ATL. The frequencies, probabilities and entropy values of these random variables are given in Table 3.
| ETC | TMM | ATL | ||||
|---|---|---|---|---|---|---|
| Score | f | P | f | P | f | P |
| 1 | 338 | 0.59 | 248 | 0.63 | 77 | 0.29 |
| 2 | 144 | 0.25 | 124 | 0.31 | 120 | 0.45 |
| 3 | 58 | 0.10 | 17 | 0.04 | 33 | 0.13 |
| 4 | 32 | 0.06 | 7 | 0.02 | 34 | 0.13 |
| Total | 572 | 1.00 | 396 | 1.00 | 264 | 1.00 |
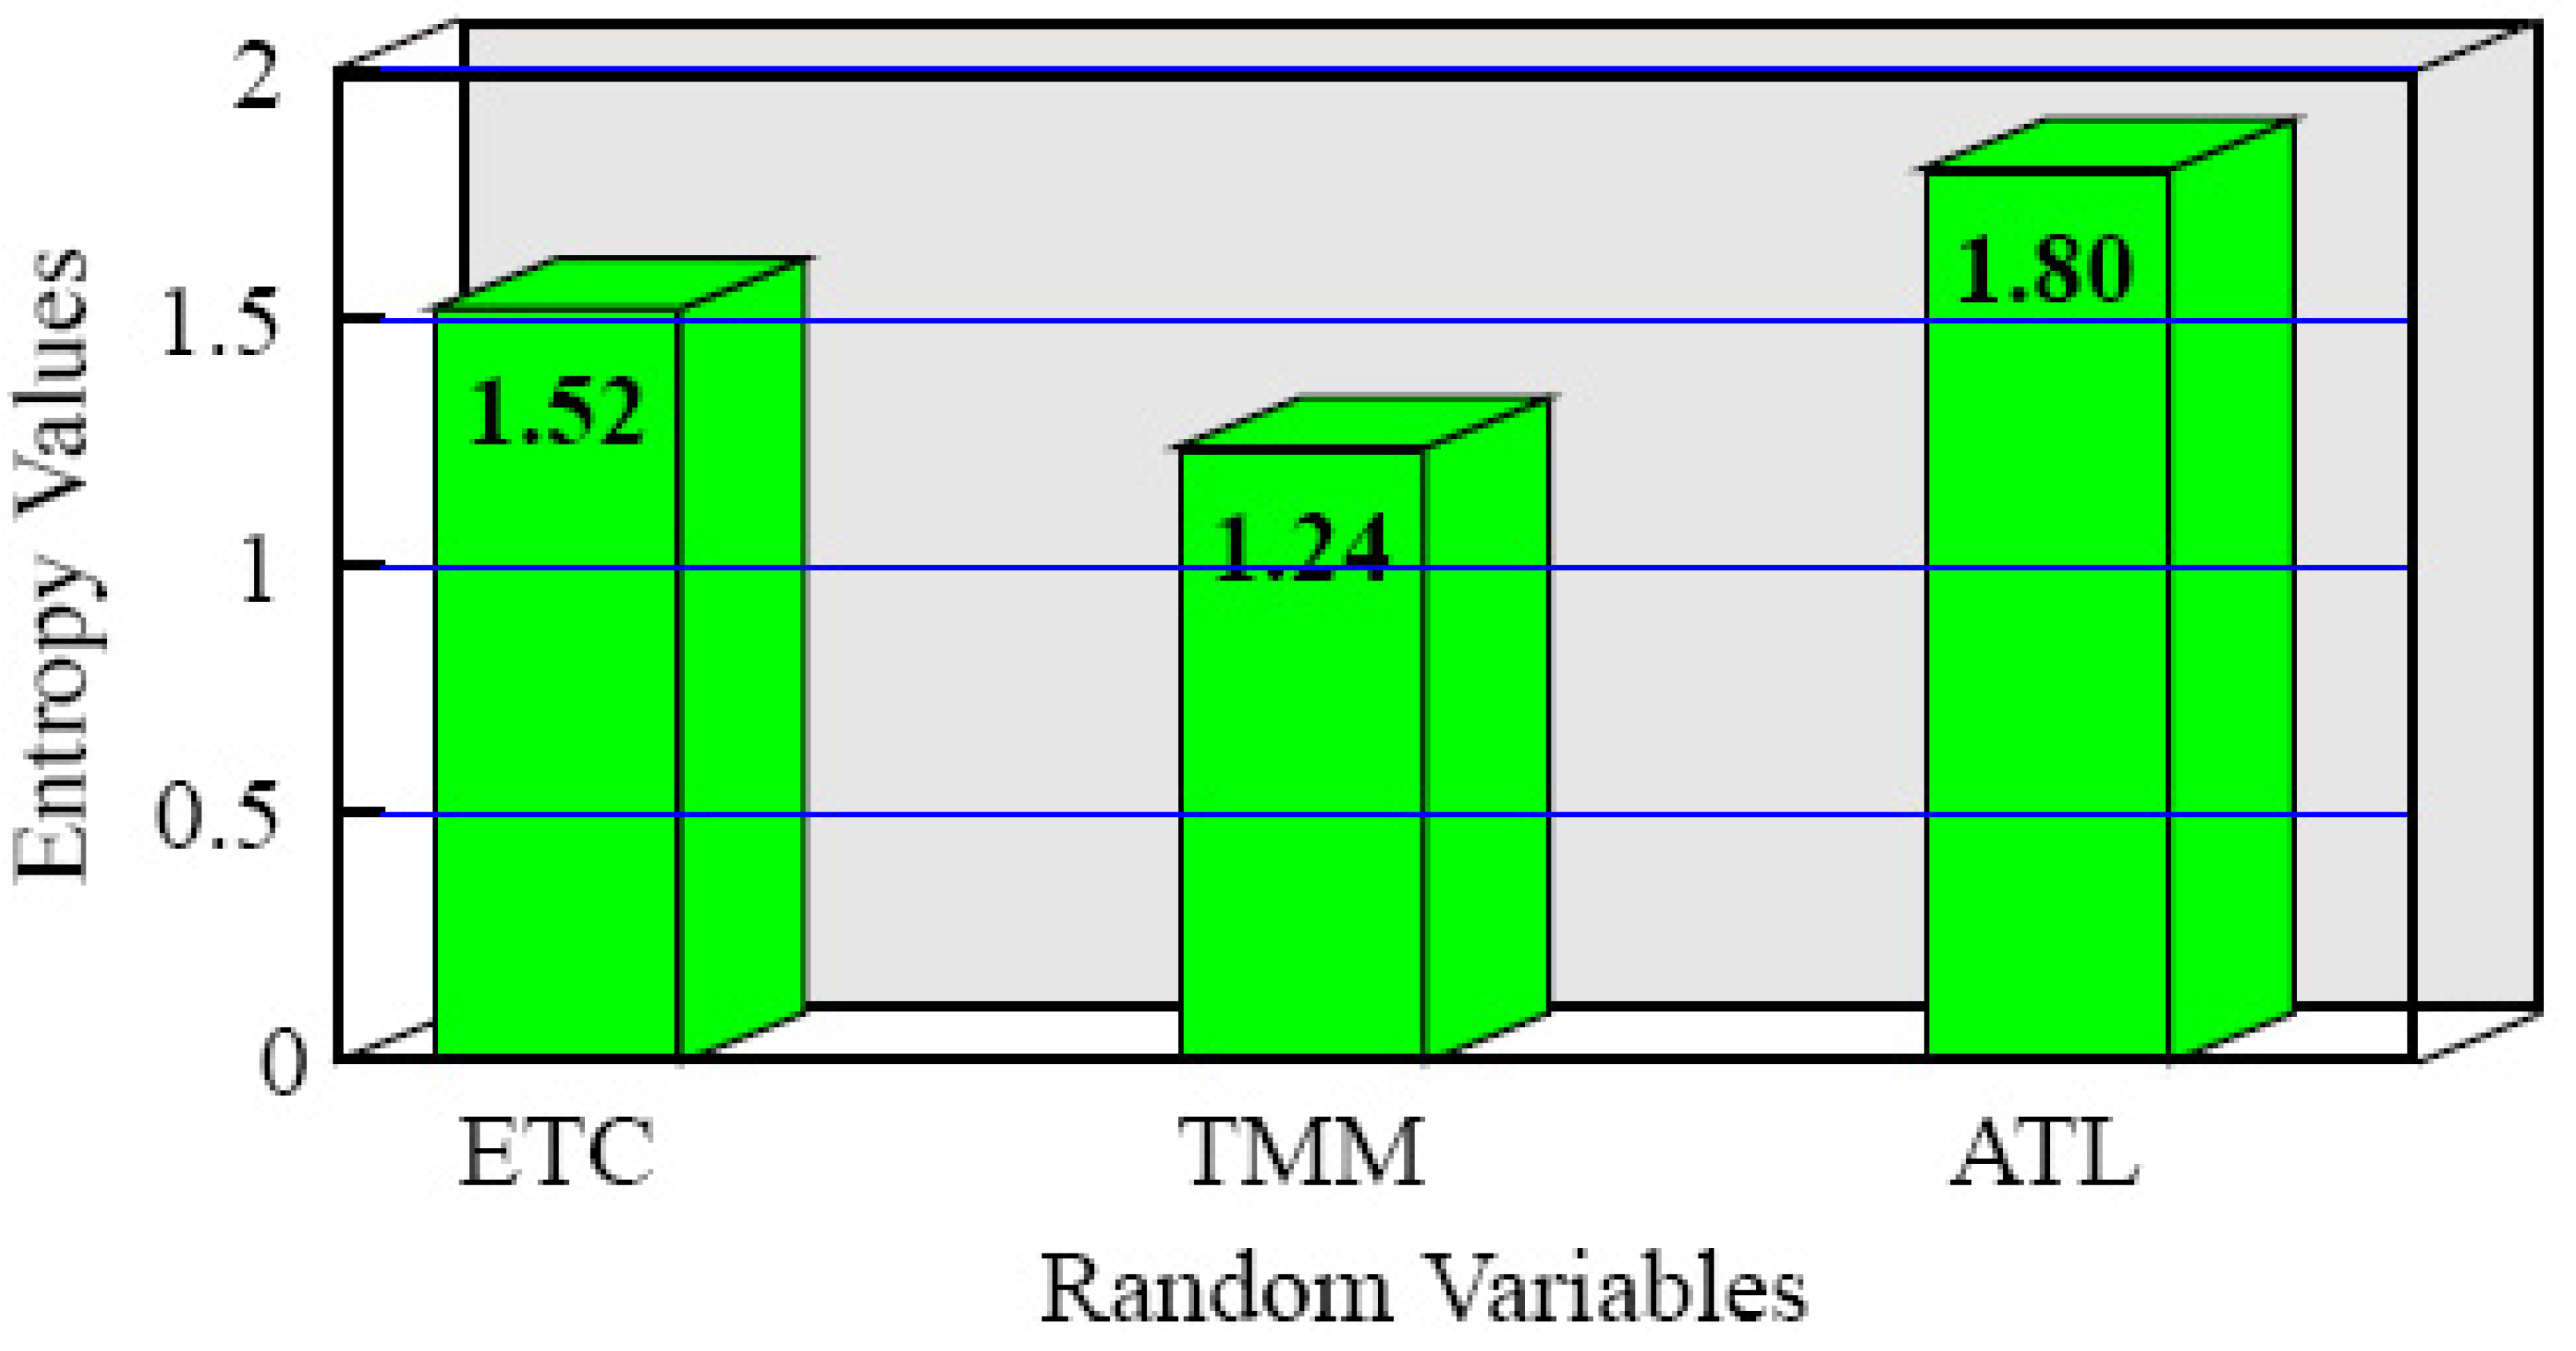
| Entropy | 1.52 | 1.24 | 1.80 | |||
Moreover, the histogram of the entropy values of three random variables is observed in Figure 1.
Figure 1.
Entropy Values for ETC, TMM and ATL Random Variables.

We remark that entropy provides a theoretical bound of the minimum number of bits for the information, and the ratio between average code length and the entropy represents the code efficiency. Information theory says that the best a lossless symbolic compression scheme can do is to encode a source with an average number of bits equal to the entropy of the source. This occurs when efficiency equals 100%. The entropy value was found as 1.52 bits for ETC variable while it was found as 1.24 bits for TMM variable and 1.80 bits for ATL variable. The average code length and efficiency values for the variables ETC, TMM and ATL are respectively (1.57;0.97), (1.43;0.87), and (1.97;0.91). Since efficiency values are quite close to 1, information about the variables in order to determine sufficient number of questions can be determined with the entropy values. The entropy value 1.52 of ETC indicates that it is enough to ask two questions for ETC. Likewise, the entropy values found for TMM and for ATL also indicate that it would be sufficient to ask two questions in order to be informed to this end. In the scale applied, 13 questions were asked in order to be informed about ETC, 9 questions were asked in order to be informed about TMM and 6 questions were asked in order to be informed about ATL. As a consequence this part, it was sufficient to ask two questions so as to be informed about each of these variables.
To investigate what kind of entropy values the variables of ETC, TMM and ATL had with gender, joint probability distribution tables were constructed separately from the frequencies obtained from Gender-ETC, Gender-TMM and Gender-ATL scores. Table 4 demonstrates an example in joint probability distribution of ETC-Gender. Table 5 gives joint entropy values of all subscales and gender.
| ETC | |||||
|---|---|---|---|---|---|
| Gender | 1 | 2 | 3 | 4 | Total |
| Male (0) | 0.357 | 0.100 | 0.031 | 0.035 | 0.523 |
| Female (1) | 0.234 | 0.152 | 0.070 | 0.021 | 0.477 |
| Total | 0.591 | 0.252 | 0.101 | 0.056 | 1.000 |
| Variables | Joint Entropy |
|---|---|
| ETC | 2.476 |
| TMM | 2.097 |
| ATL | 2.718 |
The result in the joint entropy with Gender and ETC means that on average it would require three questions to guess the level of both variables. The same result is also valid for ETC and ATL. Mutual information values were computed using the joint probability distribution calculated for gender and all subscales. The entropy value was found as 0.998 bits for gender and mutual information value calculated for Gender-ETC is shown in Equation (5). Mutual information values are given for all variables in Table 6.
| Variables | Mutual Information |
|---|---|
| ETC | 0.042 |
| TMM | 0.041 |
| ATL | 0.080 |
In probability theory and information theory, the mutual information or transformation of two random variables is a quantity that measures the mutual dependence of the two variables. Intuitively, mutual information measures the information that X and Y share: it measures how much knowing one of these variables reduces uncertainty about the other. For example, if X and Y are independent, then knowing X does not give any information about Y and vice versa, so their mutual information is zero. The mutual information value calculated for the ETC-Gender variables, which are not independent, can be interpreted as follows. The variables ETC and Gender seem not to have a lot of information in common, only 0.042 bits of information. The mutual information values also found for TMM-Gender and ATL-Gender are interpreted in the same way. It was observed that the variable of gender, among the mutual information values obtained, was not able to restrict the uncertainty on the other variables so much. Table 6 exhibits shared information between pairs of variables. The pair sharing the most information is ATL-Gender, while the least is TMM-Gender.
The relative entropy is an appropriate measure of the similarity of the underlying distribution. If the distributions f and g are similar, the difference between and is small. In this study, the marginal probability distributions of both genders were found depending on each subscale. The marginal probability distribution of both genders for the subscale of ETC is given in Table 7.
| Male(Y) | 1 | 2 | 3 | 4 | Total |
| ) | 0.68 | 0.19 | 0.06 | 0.07 | 1.00 |
| Female(X) | 1 | 2 | 3 | 4 | Total |
| ) | 0.49 | 0.32 | 0.15 | 0.04 | 1.00 |
In order to investigate whether these distributions are similar or not, the relative entropy (Kullback-Leibler distance) values are computed as follows:
The fact that these values are found to be close demonstrates that both genders show a similar distribution. Likewise, the relative entropy values found for genders according to TMM are found in the following way. We observe from the values that there is a significant difference in the distribution of genders for TMM. This result is supported by two sampling t tests as well;
The fact that the relative entropy values found close states that both genders show a similar distribution in this subscale as in ATL.
Two sampling t tests support these values too.
5. Conclusions
The analysis performed in this study prove useful to find the degree of uncertainty and to determine the number of questions in a selected scale with entropy method. It was found out that if we only want to be informed about the level of anxiety, the number of questions in the scale to be designed has to be fewer while the number of questions concerned has to be increased if it is desired to determine the level of anxiety together with gender.
For further studies, the survey can be reorganized by designing the scale with a new number of questions determined by the entropy method and the reliability analyzes can be made again and information on computer anxiety can be accessed in a shorter period of time.
In addition, the entropy values were interpreted within the scope of the information theory and various recommendations were made for the researchers, who may apply such a study in the future, pertaining to the number of questions of the new scales to be designed so as to rapidly access information about computer anxiety.
Acknowledgements
The authors would like to thank to the reviewers for their comments that improved the paper.
References
- Shannon, E.C. A Mathematical theory of communication. The Bell System Technical Journal 1948, 27, 379–423. [Google Scholar]
- Cronbach, L.J. On the non-rational application of information measures in psychology. In Information Theory in Psychology Problems and Methods; Quastler, H., Ed.; Free Press: Glencoe, IL, USA, 1954; pp. 14–30. [Google Scholar]
- Lemay, P. The Statistical Analysis of Dynamics and Complexity in Psychology. A Configural Approach; Ph.D. Dissertation; University of Lausanne: Lausanne, Switzerland, 1999. [Google Scholar]
- Ceyhan, E.; Namlu, A. Bilgisayar Kaygısı Ölçeği: Gerçeklik ve Güvenilirlik Çalışması. Anadolu Ünviversitesi Eğitim Fakültesi Dergisi 2000, 10, 77–93. (in Turkish). [Google Scholar]
- Cover, T.M.; Thomas, J.A. Elements of Information Theory, 2nd ed.; John Wiley and Sons: Somerset, NY, USA, 2006. [Google Scholar]
- Kullback, S. The Kullback-Leibler distance. Amer. Statist. 1987, 41, 340–341. [Google Scholar]
© 2009 by the authors; licensee Molecular Diversity Preservation International, Basel, Switzerland. This article is an open-access article distributed under the terms and conditions of the Creative Commons Attribution license http://creativecommons.org/licenses/by/3.0/.
Share and Cite
MDPI and ACS Style
Oruç, Ö.E.; Kuruoğlu, E.; Vupa, Ö. An Application of Entropy in Survey Scale. Entropy 2009, 11, 598-605. https://doi.org/10.3390/e11040598
AMA Style
Oruç ÖE, Kuruoğlu E, Vupa Ö. An Application of Entropy in Survey Scale. Entropy. 2009; 11(4):598-605. https://doi.org/10.3390/e11040598
Chicago/Turabian StyleOruç, Özlem Ege, Emel Kuruoğlu, and Özgül Vupa. 2009. "An Application of Entropy in Survey Scale" Entropy 11, no. 4: 598-605. https://doi.org/10.3390/e11040598