1. Introduction
Networks offer mathematical representations of the interdependence that links decisions and behavior [
1,
2,
3,
4]. Identifying the structural properties of networks can shed light into how they shape dynamic processes like the diffusion of information or cascading behavior. These dynamics underlie relevant social phenomena, for instance, political mobilizations. Recent events suggest that online networks facilitate the large-scale diffusion of protest information in relatively short time-spans [
5,
6,
7,
8,
9]. However, networks are not stable structures: people discontinue their contribution to communication flows or decide to join anew. On a local level, the composition of networks changes constantly, but it remains an empirical matter to determine whether these changes generate structural shifts that impact the way in which dynamic processes unfold. This article considers that question using data on how information diffused around the political protests that emerged in Spain in May of 2011, and again in May of 2012 to celebrate the first anniversary of the movement. We also consider communication dynamics in the year that separates these two events. Our aim is to shed light into the temporal dimension of diffusion through networks that also change in time.
We analyze the structural properties of the networks that emerged to exchange messages about the protests, networks that helped diffuse relevant information before and after the mobilization days. We compare the size of information cascades and how the composition of the network changed during the year that separates the two mass mobilizations, paying special attention to how actors migrate across different regions of the network. We show that local changes in network structure underlie aggregated differences in how information diffused: an increase in network hierarchy goes hand in hand with a reduction in the average side of cascades. Although we can’t disentangle the effects that exogenous factors (like political fatigue) have on the online patterns we observe, we believe that our findings qualify models of information diffusion and add important nuances to the discussion of how the structure of networks relates to their function.
3. Data: Diffusion Events, Communication Networks, and Information Cascades
The data we analyze track online communication through Twitter during the protests that emerged in Spain in May 2011 [
5,
25] and again in May 2012 [
26,
27]. Media accounts of the events were quick to attribute to Twitter an instrumental role in the spread of calls for action and the coordination of demonstrations; this role has subsequently been spelled out by ethnographic work and interviews with protesters [
28,
29]. For both events, messages using relevant protest hashtags were collected for the period of one month, spanning days preceding and following the main demonstration days (15 May 2011 and 13 May 2012, respectively); we also collected activity during the intervening year.
Table 1 summarizes the three data sets.
Table 1.
Summary of data collected.
Table 1.
Summary of data collected.
| Protests 2011 | Protests 2012 | Intervening Period |
|---|
| Date range | 25 April to 25 May | 30 April to 30 May | 1 June to 31 March |
| Total number of messages | 581,749 | 1,026,292 | 555,521 |
| Total number of unique users | 85,933 | 127,930 | 115,992 |
In both years the data were collected using the streaming API, which returns a maximum of 1% of all messages published in the Twitter public timeline. The actual percentage of messages returned, however, varies depending on the filters applied and the size of the underlying population of messages of interest. The same hashtags that were used to collect messages in 2011 were again used in 2012, but the lack of control on how APIs return the sample of messages—which is susceptible to bias [
30]—means that the difference in sample sizes might only partly result from greater awareness about the protests in 2012. Although we have good reasons to believe that in 2012 the protest movement was better known by a wider public (it was no longer unexpected, as in 2011), and that this surely translated into higher levels of online activity (the movement had more time to build up a base during the passing year), the analyses that follow might overestimate the actual amount of change from year to year if the sampling method is introducing artificial variation; however, the aggregated patterns we identify still reveal dynamics that are intrinsic to the diffusion of protest information through this online network.
Using the sampled messages, we reconstructed the communication networks for both events and the intervening year using the mentions and re-tweets (RTs) to infer links between users: if user
i mentions or RTs user
j, an arc is created from
i to
j; this resulted in three weighted, directed networks, one for each observation period. We also reconstructed the following/follower structure of the users sending protest messages, which resulted in unweighted, directed networks: again, if user
i follows user
j, an arc is formed from
i to
j. The following/follower structure was filtered so that only users active in protest communication (according to our samples) are retained. Information about followers was obtained at the end of each observation period in 2011 and 2012, once the sample of relevant messages had been collected. These networks capture the topological and dynamic structures underlying communication around the protests: we take the follower structure as a proxy to the relative size of the audience that each user has (relative to other users, and to the number of people they follow); and we take the mentions structure as a proxy to their visibility in this specific stream of protest-related information. These networks are summarized in
Table 2.
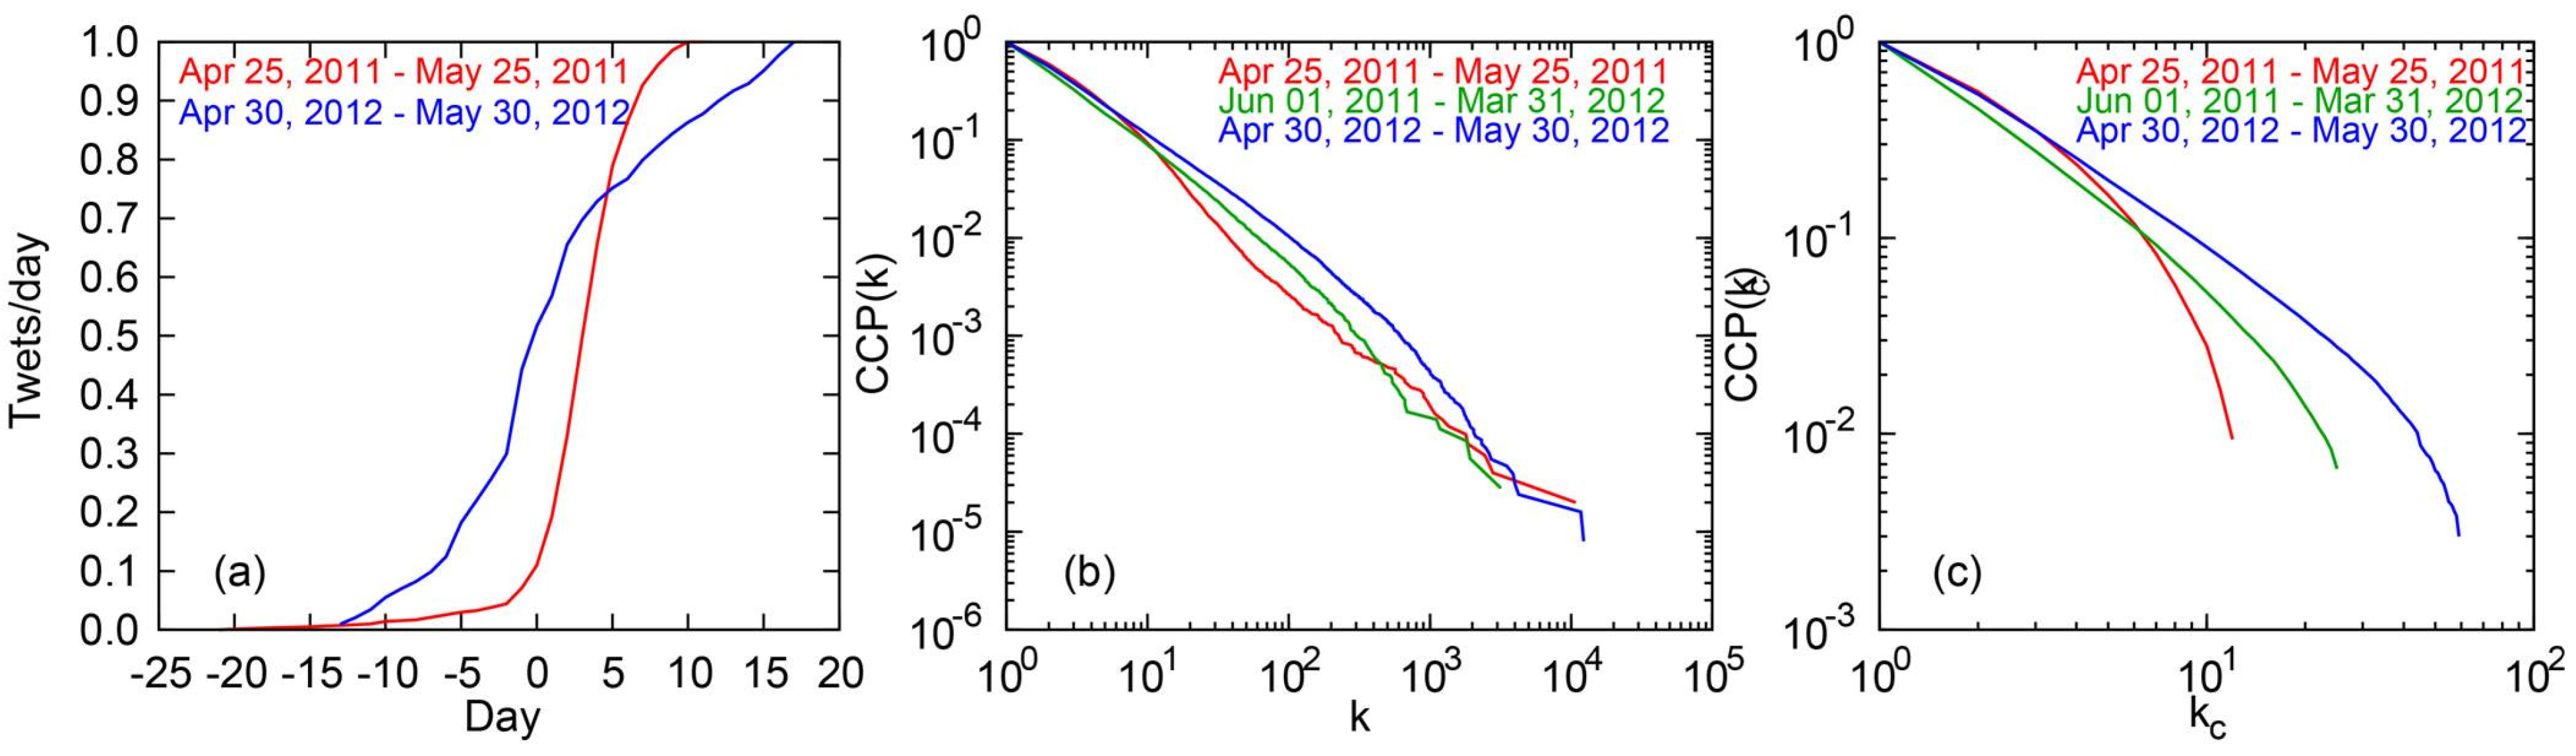
The diffusion curves for each event are shown in
Figure 1, panel (a). The vertical axis tracks the normalized cumulative proportion of users that had sent at least one message in time
t, as tracked by the horizontal axis, centered on the protest day. The figure shows that the acceleration rate was higher, but happened later, in 2011, in line with the sudden (and unexpected) explosion of the movement as protests unfolded; in 2012 the momentum started to build earlier, prior to the long-planned mass demonstrations, but at a slower pace. The degree (sum of in-degree and out-degree) and
k-core distributions for the dynamic networks of mentions are shown in panels (b) and (c), respectively. Degree centrality measures the number of adjacent nodes [
31];
k-cores, in turn, partition the network into groups that correspond to the maximal sub-graph to which nodes belong in which each node is connected to at least
k other nodes in the same sub-graph [
32]. Panels 1(b) and 1(c) show that the 2012 network is slightly more asymmetrical, with more extreme outliers in the degree distribution; it also has cores with higher degree, which means that there are more actors with high degree connected to each other than the year before. Although these differences need to be interpreted cautiously given that networks differ in size, they suggest that during the passing year communication dynamics around the political movement grew more cohesive at its core, with clearer gravity centers attracting most of the activity; this core is formed by an elite of users that grew more prominent in the exchange of information.
Table 2.
Summary of networks.
Table 2.
Summary of networks.
| 2011 | 2011–2012 | 2012 |
|---|
| following/er (topological) | @s (dynamic) | following/er (topological) | @s (dynamic) | following/er (topological) | @s (dynamic) |
|---|
| N (# nodes) | 85,712 | 50,369 | 113,677 | 35,815 | 127,400 | 127,068 |
| M (# arcs) | 6,030,459 | 135,637 | 10,191,085 | 98,709 | 7,459,518 | 522,430 |
| <k> (avg degree) | 7.36 | 2.69 | 89.65 | 2.76 | 58.55 | 4.11 |
| max(kin) (max indegree) | 5,773 | 10,781 | 8,262 | 3,118 | 12,552 | 12,269 |
| max(kout) (max outdegree) | 31,798 | 245 | 37,810 | 651 | 34,892 | 658 |
| C (clustering) | 0.022 | 0.002 | 0.028 | 0.015 | 0.026 | 0.013 |
| l (path length) | 2.45 | 3.97 | 2.52 | 4.18 | 2.71 | 4.00 |
| D (diameter) | 6 | 15 | 7 | 16 | 8 | 15 |
| r (assortativity) | −0.13 | −0.07 | −0.11 | −0.09 | −0.13 | −0.08 |
| # strong components | 3,392 | 23,445 | 10,871 | 20,309 | 12,151 | 59,792 |
| N giant component | 82,253 | 26,881 | 102,750 | 15,572 | 115,105 | 67,331 |
| N 2nd component | 4 | 2 | 3 | 2 | 4 | 2 |
We used the size of information cascades to characterize the communication dynamics taking place in the underlying network of followers (what we call the topological, more stable structure). Following previous work [
9,
33], we operationalize cascades assuming that activity that follows within short time periods is part of the same chain reaction. When a user sends a message at time
t, all their followers are exposed to the information; if a little while after that, at time
t + ∆
t, some of these followers decide to post a message as well, they are counted as part of the same cascade; so do the followers of the followers that post at
t + 2∆
t, and so on. The parameter ∆ regulates the width of the time window used to count messages that are part of the same cascade. The final size of a cascade can then be measured as the sum of all users that send a message (we call these users “active spreaders”), or as the total number of users that are exposed to the messages, whether or not they send a message themselves (we call these users “listeners”). This operationalization is based on the notion that time-constrained activity (
i.e., activity that takes place within short time windows) is correlated and indicative of a chain reaction triggered by the same stimuli. The key notion is not that the same bit of information is being diffused, but rather that information about the same topic flows through the network; in our case, the topic are the political protests.
Figure 1.
(a) Diffusion curve of protest activity for both events showing the normalized cumulative fraction of users sending at least one message at a given day. (b) Complementary cumulated (CCP) degree distribution for the dynamic network constructed using mentions and re-tweets between users. (c) Complementary cumulated k-core distribution for the dynamic network.
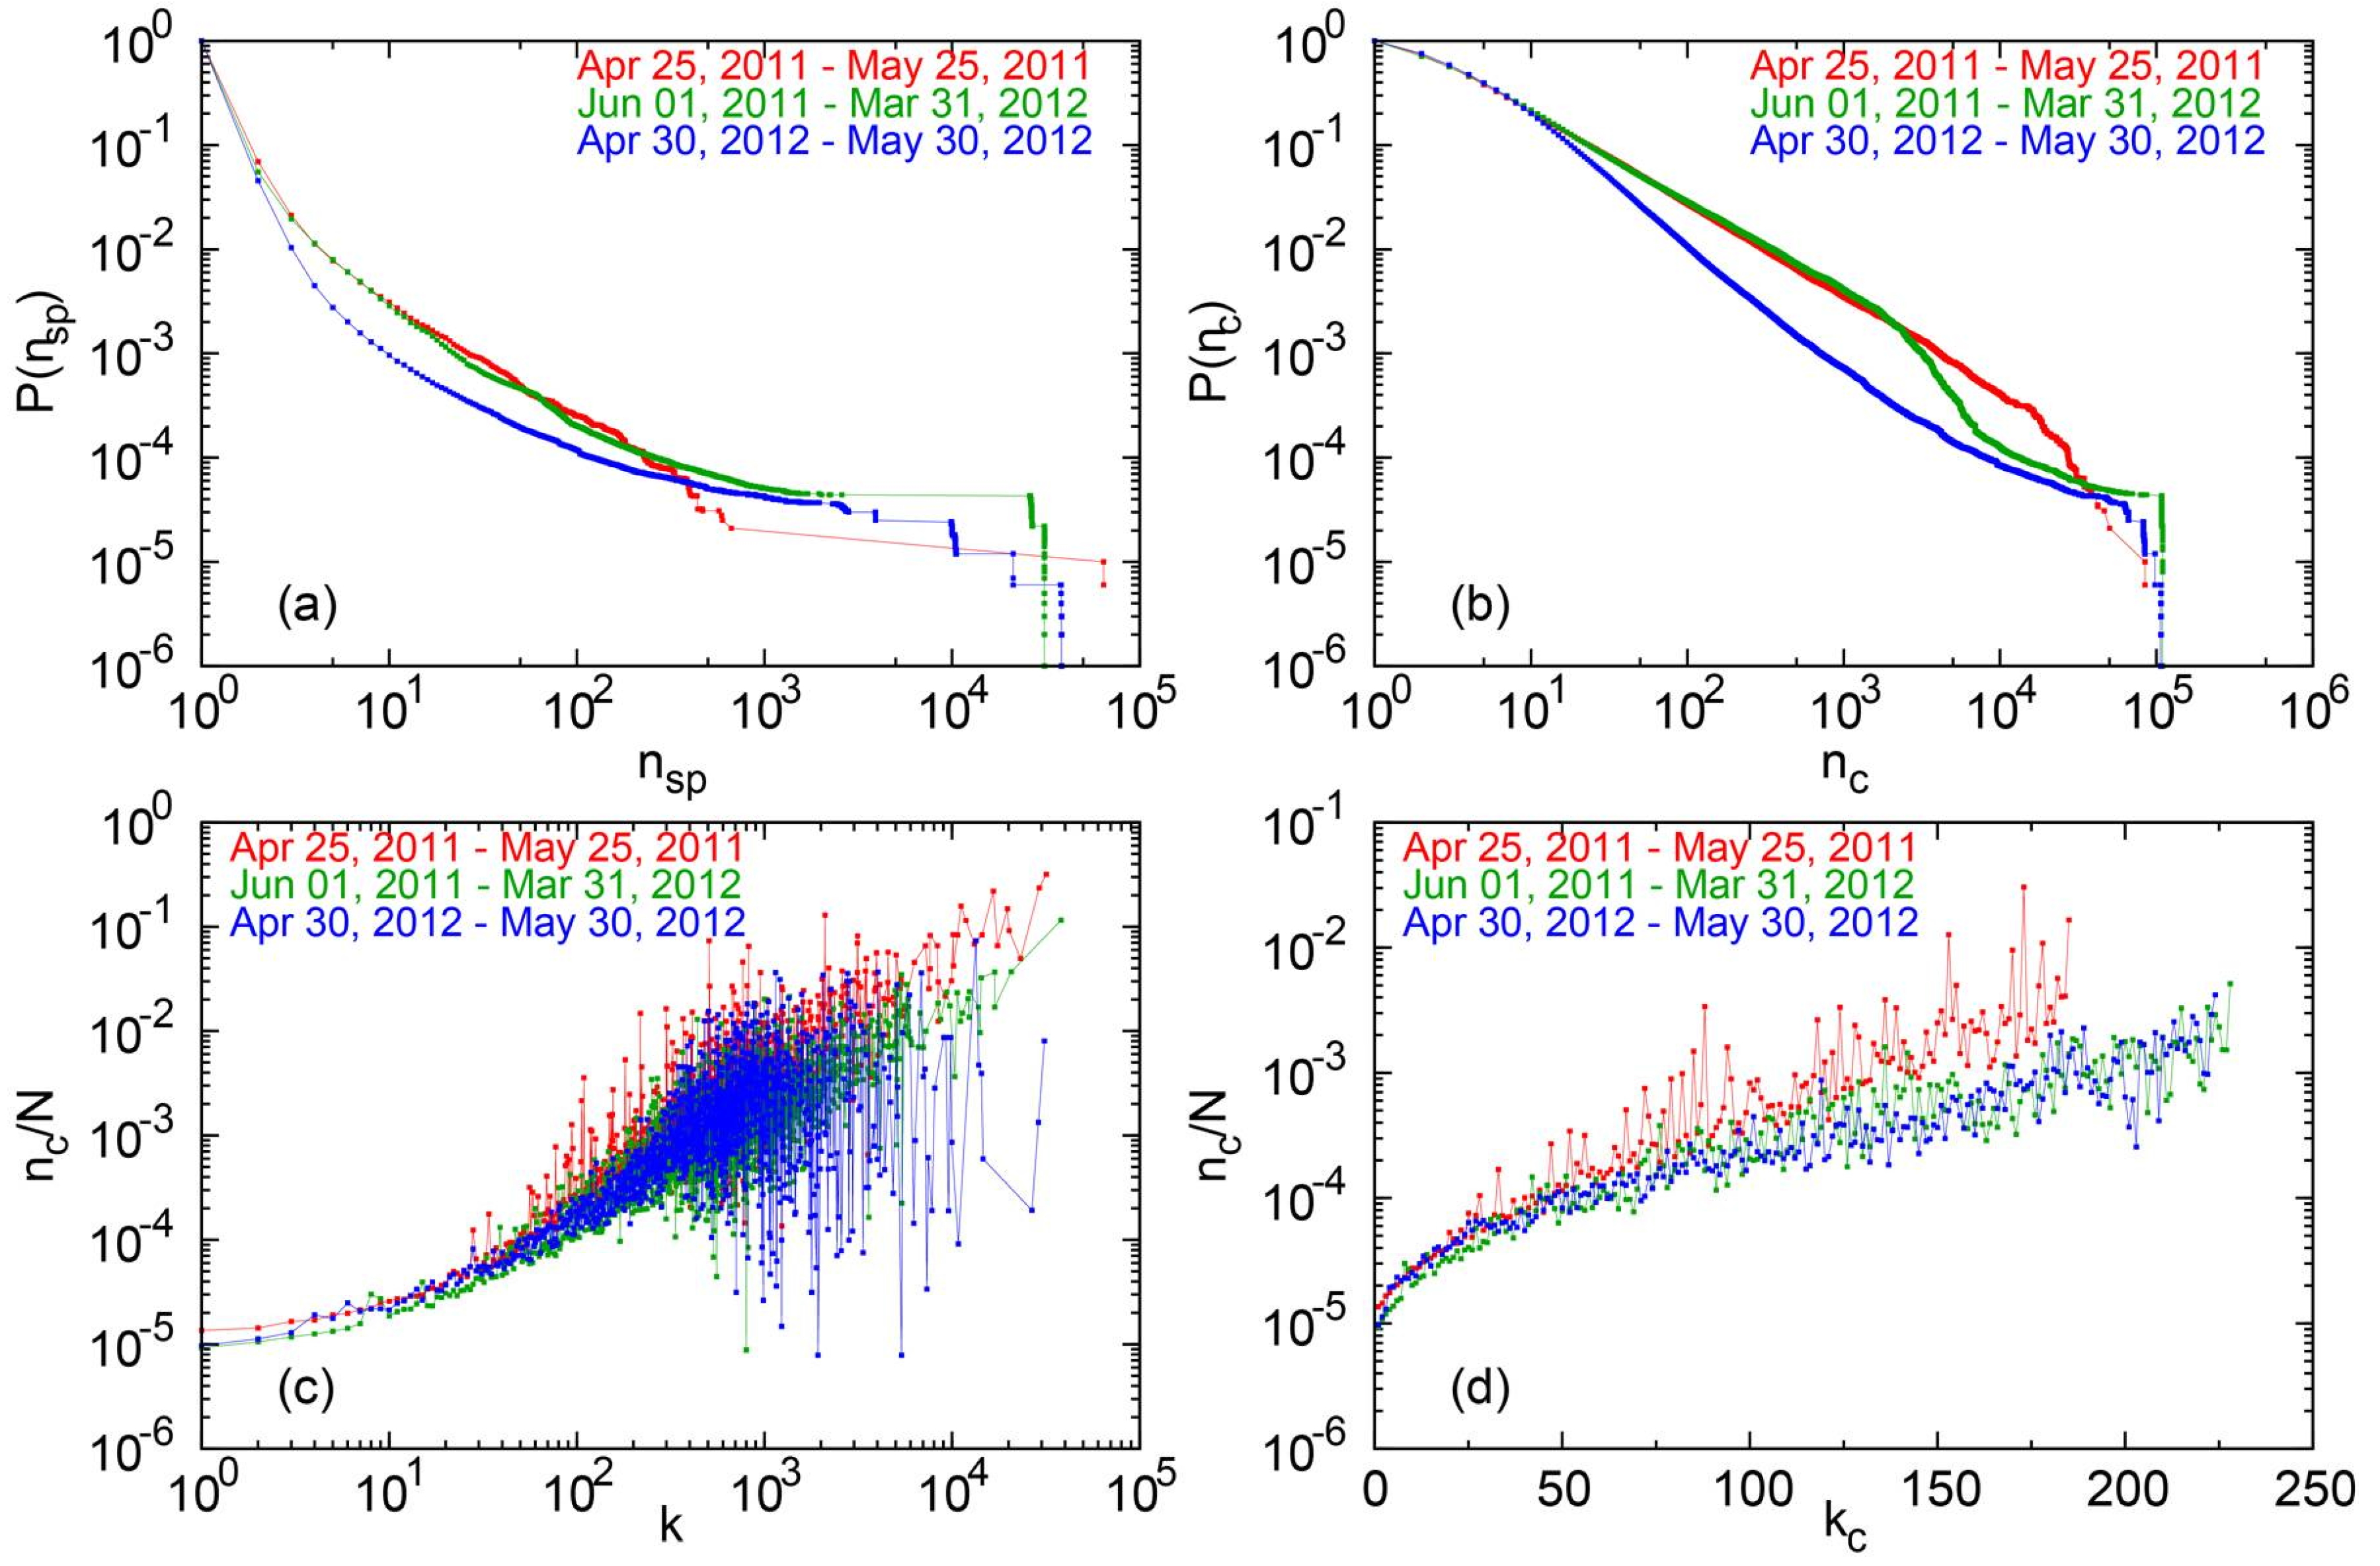
Figure 2 shows the distribution of cascade sizes both for active spreaders (panel a) and listeners (panel b), with the parameter ∆ set for 1 h (for the protest months) and for 1 day (for the intervening period). The figures show that information cascades were, for the most part, larger in 2011, although the few cases that grew extremely large reached a higher number of people in 2012 (not surprisingly, since the network is also larger).
Panels (c) and (d) show the association of average cascade size with the centrality of users that started them, as measured by degree and k-core, respectively. In both cases, there is a clear association between network centrality and reach: more central users trigger, on average, cascades that activate a larger number of people; for users with similar centrality, however, cascades were larger in 2011 than in 2012—at this level of aggregation, activity in 2012 resembles more the dormant, intermediate period separating the two protests.
Figure 2.
(a) Complementary cumulative probability distribution of cascade sizes for spreaders. (b) Complementary cumulative probability distribution of cascade sizes for listeners. (c) Correlation between degree centrality of the initial seed triggering the cascade and its final size comprising all nodes reached, rescaled by the network size (topological network). (d) Correlation between k-core of the seed node and the final cascade size rescaled by the network size (topological network).
4. Changes in Network Composition and Visibility in Information Flow
The analyses above suggest that, compared to 2011, the network in 2012 was significantly larger and with a higher number of highly connected users at its core, but not necessarily as successful in terms of triggering large chains of information diffusion. During the year that separates the two observations, the network changed its composition significantly: many users that were active in 2011 disappear from the 2012 sample; even more users joined the communication exchange in 2012; and of those staying in the network, some changed their structural position.
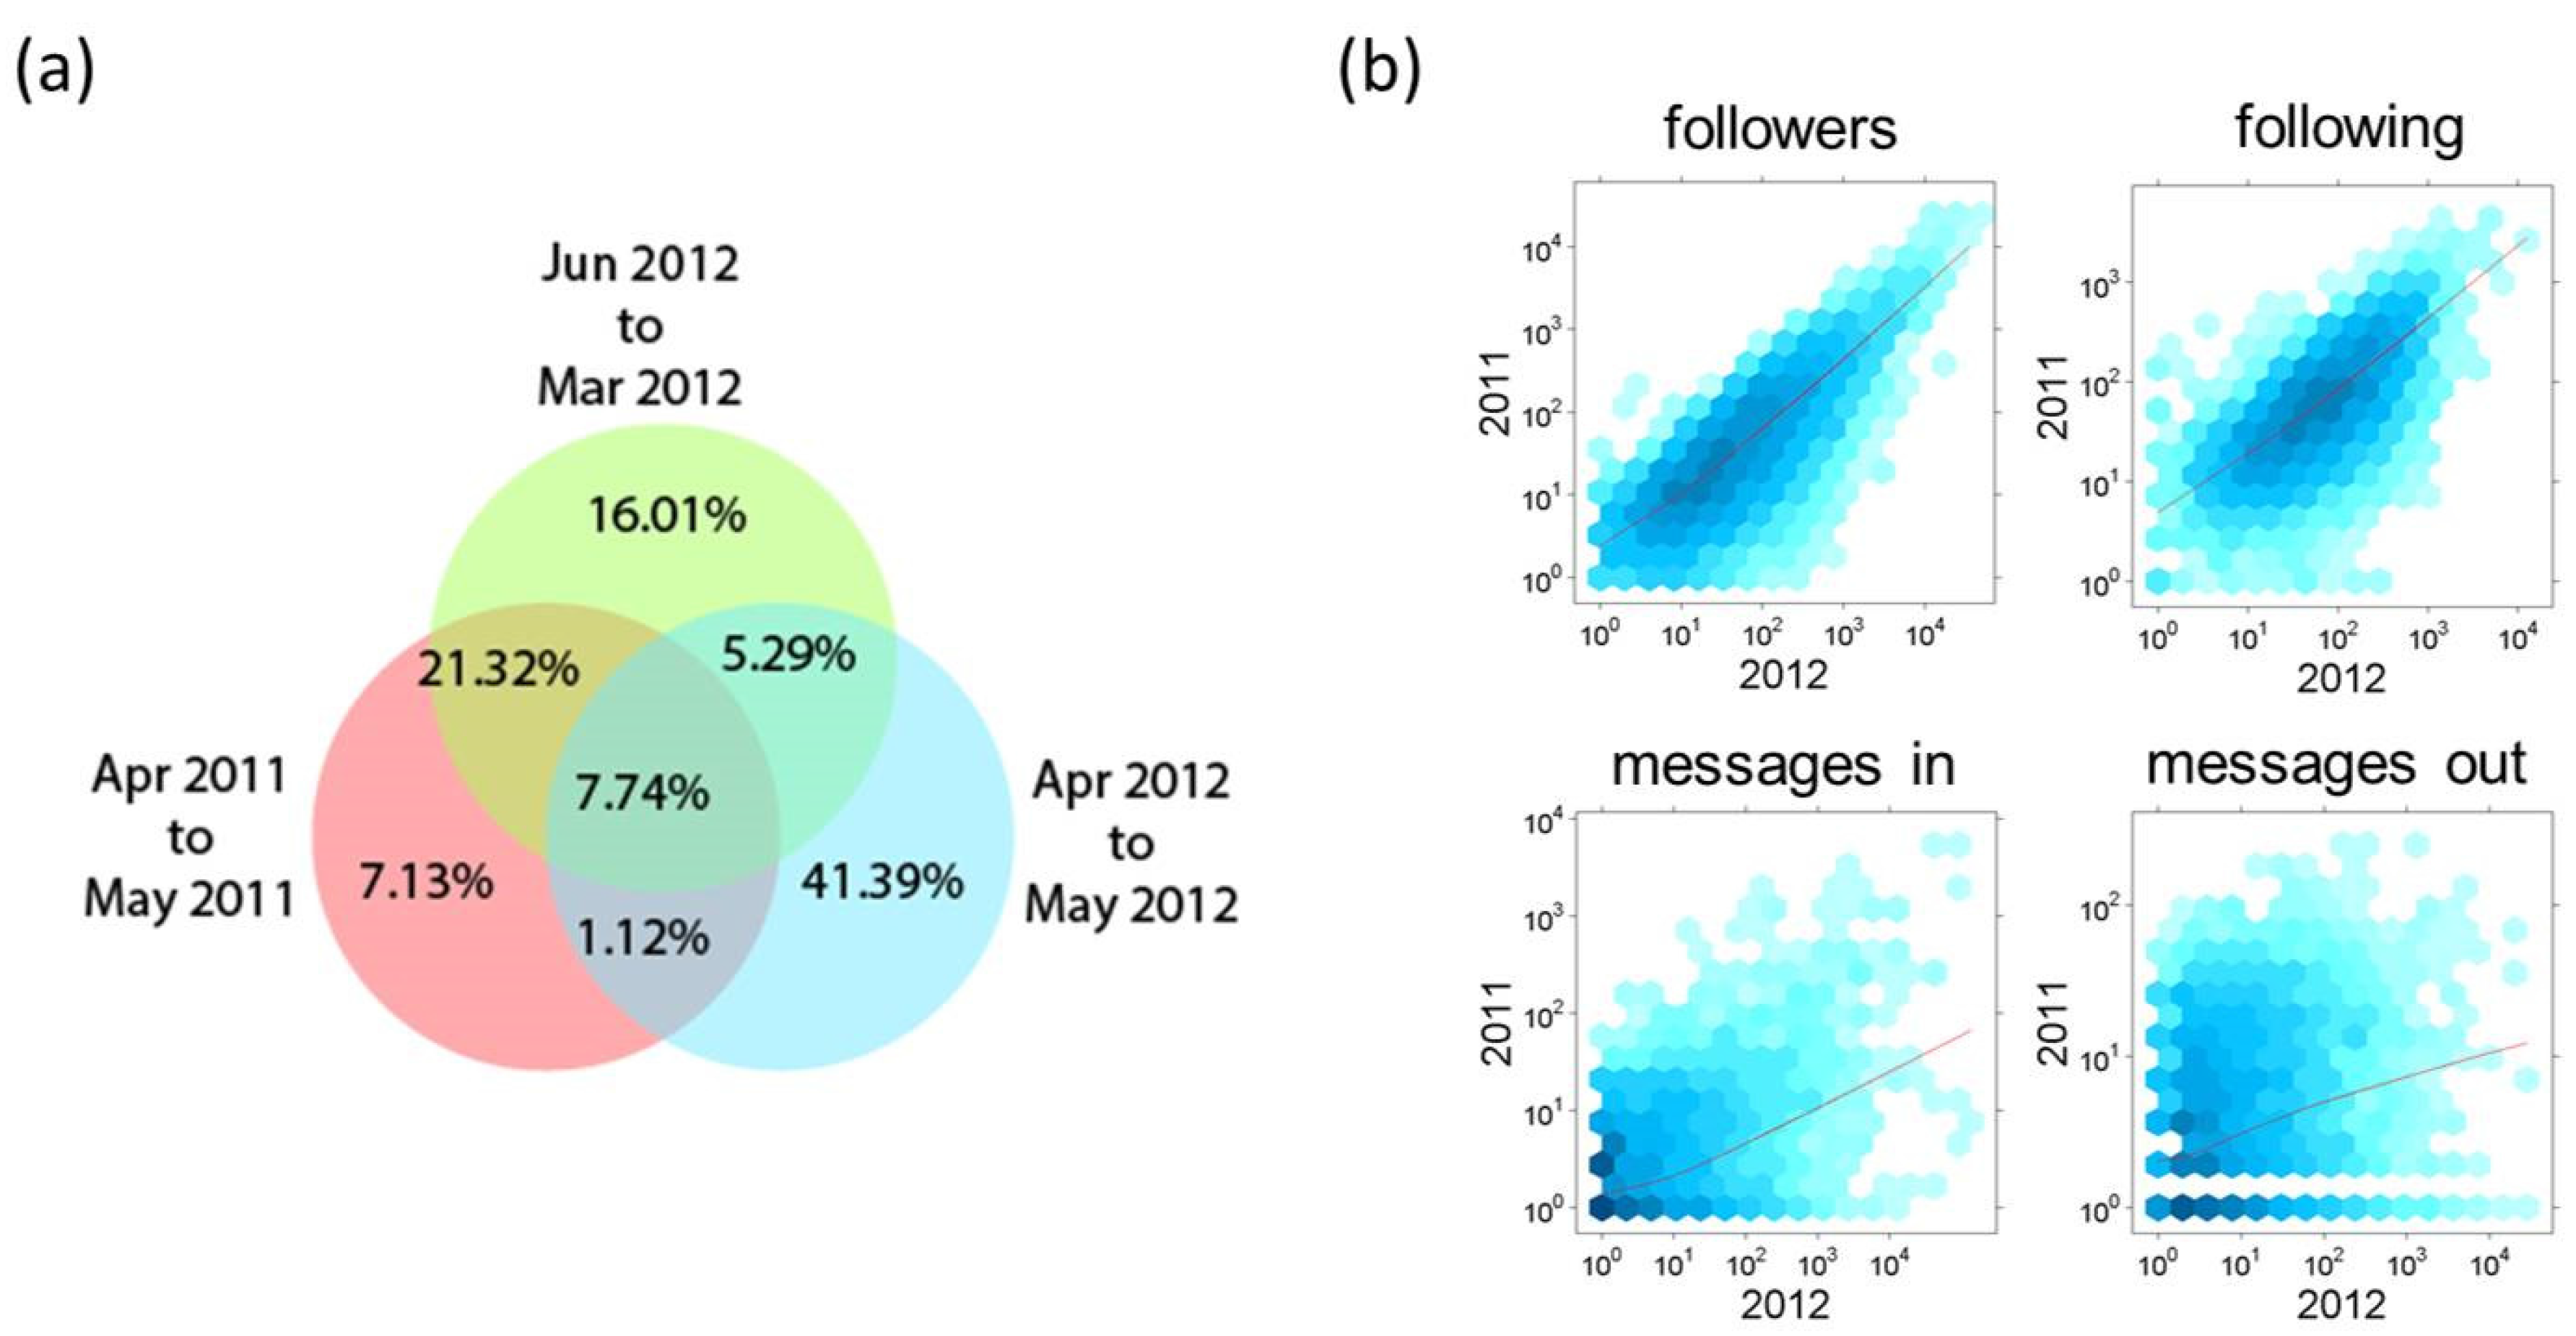
Figure 3 summarizes these differences. About 7% of the users we capture in our sample discontinued their engagement from 2011 to 2012, and about 41% joined anew in 2012; only about 8% of all users captured by the samples appear in the three observation periods. As panel (b) suggests, the network position of these users changes substantially from year to year, especially in the network of explicit protest communication.
Following previous work [
8], we distinguish four types of users on the basis of their position in the networks. Our goal with this classification is to identify users who might not be very central in the underlying topology of the Twitter network but who have high visibility in the more dynamic, protest-specific stream of information. This is similar to the aims of related work (for instance, [
34]); the difference is that our classification emphasizes the relative position of users as they distribute along two axes: inverse audience size (as measured by the follower network, in particular, the ratio of users being followed over the number of followers; this helps identify the outliers in the long tail of the indegree distribution who also have asymmetrical networks, that is, a low number of reciprocated connections); and visibility in the flow of protest-related information (as measured by the dynamic network of mentions and RTs, that is, the ratio of mentions or RTs received over the number of mentions or RTs sent). This later measure is about how visibility is allocated; the former is about the broadcasting potential of users.
Figure 3.
(a) Changes in the composition of the communication network, showing the percentages of users in different categories according to their presence in the different periods under consideration. (b) Correlation of centrality measures (degree) of users present in 2011 and 2012 for the topological network (top) and the dynamic network (bottom). Hexagons bin data points, with darker colour indicating more users in that area of the scatterplot.
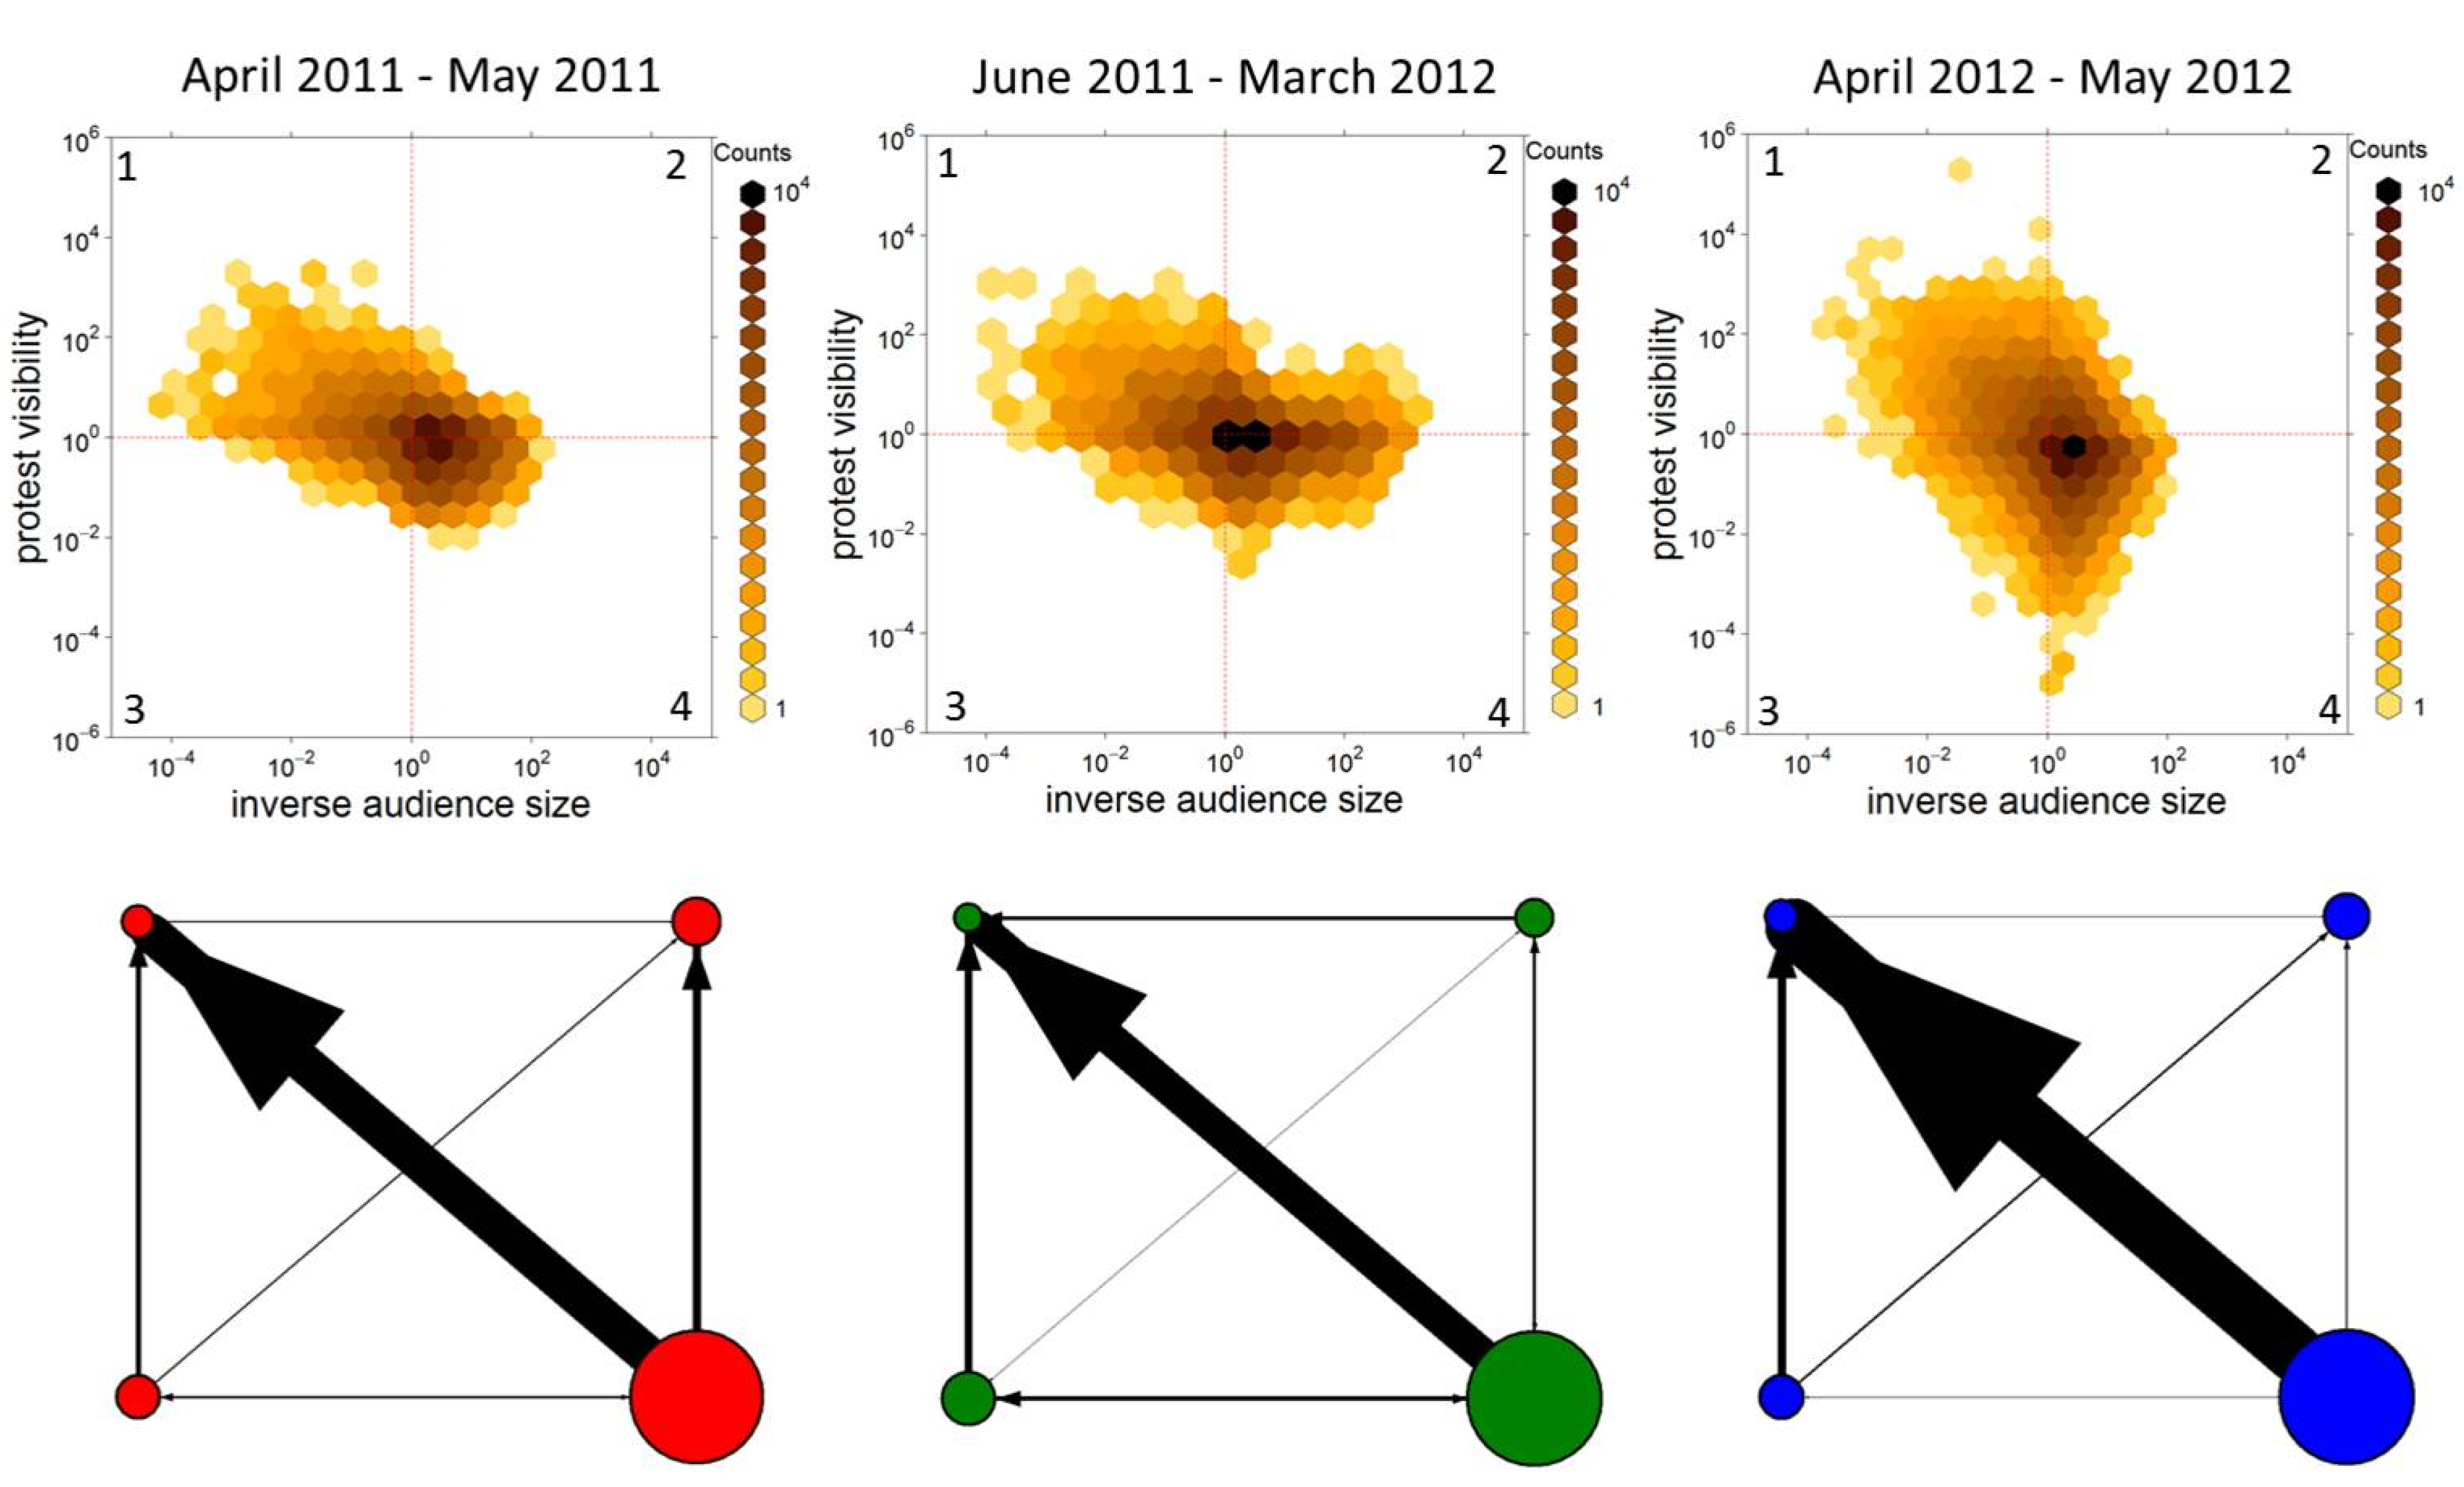
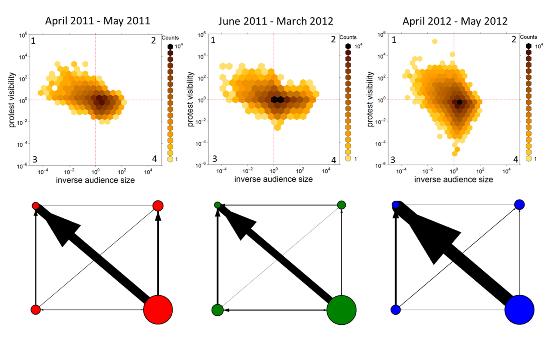
Users located in quadrant 2 of the upper plots of
Figure 4, for instance, are not outstanding in terms of relative audience size and how they compare to the vast majority of users; but they are outstanding in terms of visibility. We label these users “hidden influential” to distinguish them from users who are very visible in this stream of information but also very central in the overall Twitter network—these are the users in quadrant 1, labeled “influential” because of their relatively larger audiences. Users in quadrants 3 and 4 are labeled “broadcasters” and “common users”, respectively: they share a relatively lower visibility in protest communication, but those in the former category have a larger number of followers, relative to the users the follow back. What the plots reveal is that the association between relative audience size and visibility is stronger in 2012 than in 2011, with more outliers that accumulate most of the mentions and the largest audiences. This falls in line with the increasing centrality in the degree distribution discussed above.
The networks in the lower panels of
Figure 4 capture the dynamic aspect of the distribution of users in the four categories. These networks highlight the allocation of visibility across groups, that is, they identify which users are more likely to direct attention at other users with their mentions and RTs. Node sizes are proportional to the number of users classified in each group (over the total for each period), and the width of links is proportional to the number of messages coming out of each category directed to users in the other three categories (again, percentages are calculated over the total number of messages for each period). Compared to 2011, there is a visible increase in the allocation of visibility towards “influential” users (quadrant 1) and a reduction towards “hidden influential” (quadrant 2). In the intermediate period, there is a slight decentralization in how visibility is distributed, although a minority of users is still at the center of this flow of targeted messages.
Figure 4.
Upper panels: Distribution of users in the three observation periods according to the relation between their inverse audience size, measured by the ratio of users being followed over the number of followers, and their protest visibility, defined as the ratio of mentions or RTs received over the number of mentions or RTs sent. Bottom panels: allocation of visibility across the four categories in the different periods. Nodes sizes are proportional to the number of users in the corresponding group, and the width of the links between them is proportional to the number of mentions and RTs across groups.
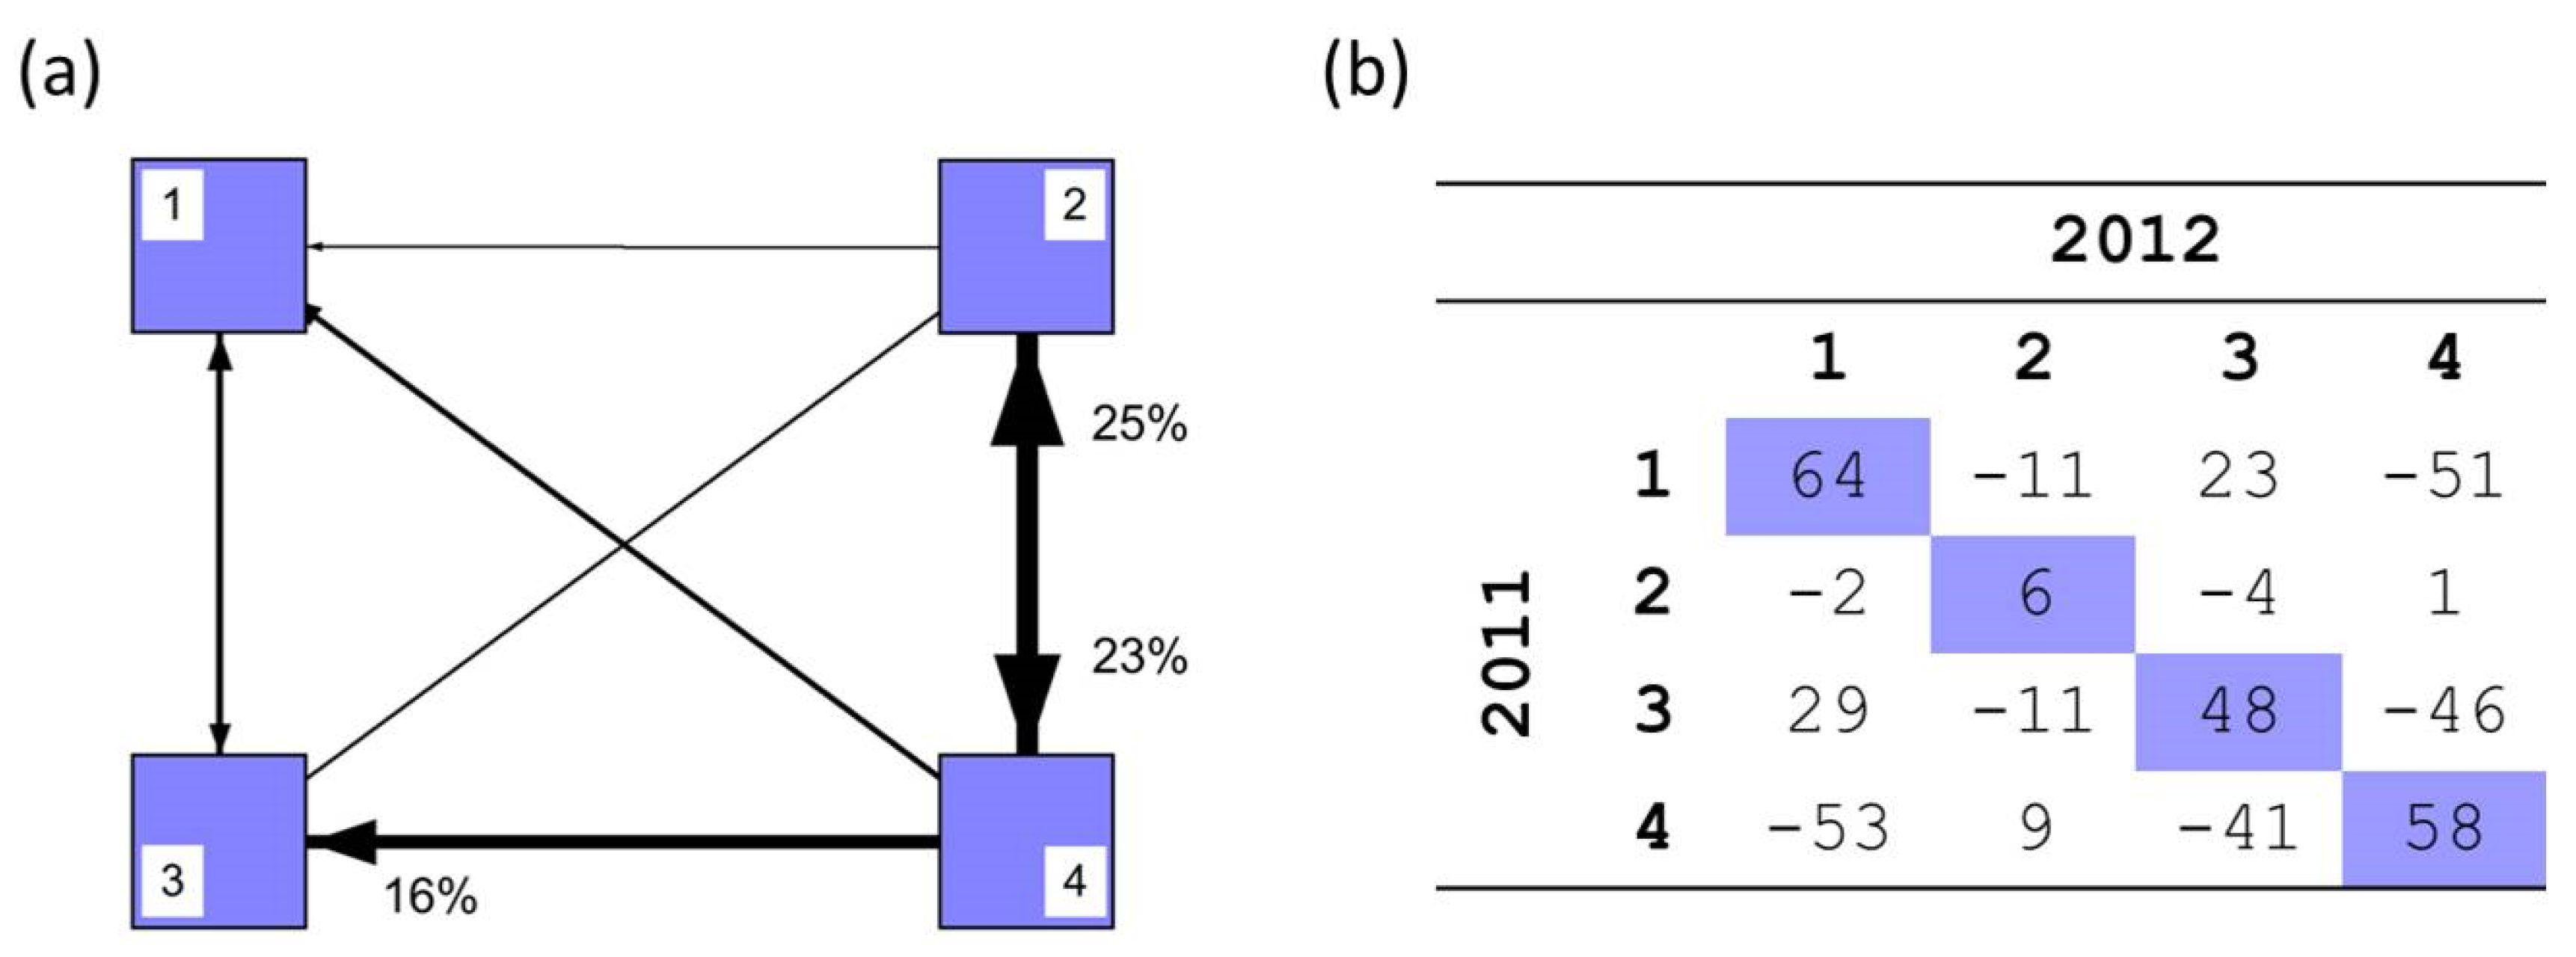
Of all the users that remain active in both years, 34% migrate across categories.
Figure 5 panel (a) shows that a quarter of all these migrating users go from category 4 (“common users”) to category 2 (“hidden influentials”); approximately the same amount of users are downgraded in the opposite direction. The second largest stream of migrating users bridges categories 4 and 3: 16% go from being “common” in 2011 to becoming “broadcasters” in 2012; not many users go in the other direction (only 4%). Overall, these patterns suggest that the dynamic network of communication is more volatile than the underlying topological structure, and that path dependence is less consequential for its evolution: gaining visibility in the flow of protest related information is no guarantee that this visibility will remain constant over time; however, gaining followers, and enlarging audiences, translates into a more durable shift in the network.
Figure 5.
(a) Migration of users across categories from 2011 to 2012, indicated by a directed link between groups. (b) Standardized residuals resulting from the comparison of observed frequencies and expected frequencies, which can be interpreted as z-scores measuring the distance from no difference; the values correspond to movement from rows to columns (that is, movements from the classification in 2011 to the classification in 2012).
A comparison of observed and expected frequencies for all users present in both years reveals that differences across categories are statistically significant (
p < 0.001, according to a resampling method [
35]).
Figure 5 panel (b) shows the standardized residuals that result from comparing observed frequencies and those expected under the null hypothesis of no difference; these residuals can be interpreted as z-scores that help identify the number of standard deviations above or below the expected counts. The colored cells indicate that more users remain in the same category from one year to the next than a random distribution of frequencies would allow. The other cells suggest that the categories that depart the most from expected counts are categories 1 and 4, followed by categories 3 and 4: migration across these groups is comparatively smaller than across other groups. The table also reveals that a higher number of users than expected move vertically in the network, at least across groups 1 and 3 (mobility across groups 2 and 4 does not depart significantly from what would be expected by random chance, although it does from 4 to 2). This reinforces the conclusion that volatility is higher in the network of protest-related communication than in the underlying channels allowing that communication to happen. It is easier to rise and fall in the visibility around a particular topic (in this case, political protest) than in the centrality of a network that channels communication in many different domains (with politics being just one of the many). The minority of influential users in category 1 arises as the exception to this volatility: they constitute the more stable part of the network, both in terms of topological position and visibility.
These changes in the flow of information and network composition relate to global diffusion dynamics. As suggested above, the acceleration rate of the diffusion curve is slower in 2012, and the average size of cascades is smaller; compared to the previous year, the overall network structure in 2012 was also more hierarchical and centralized.
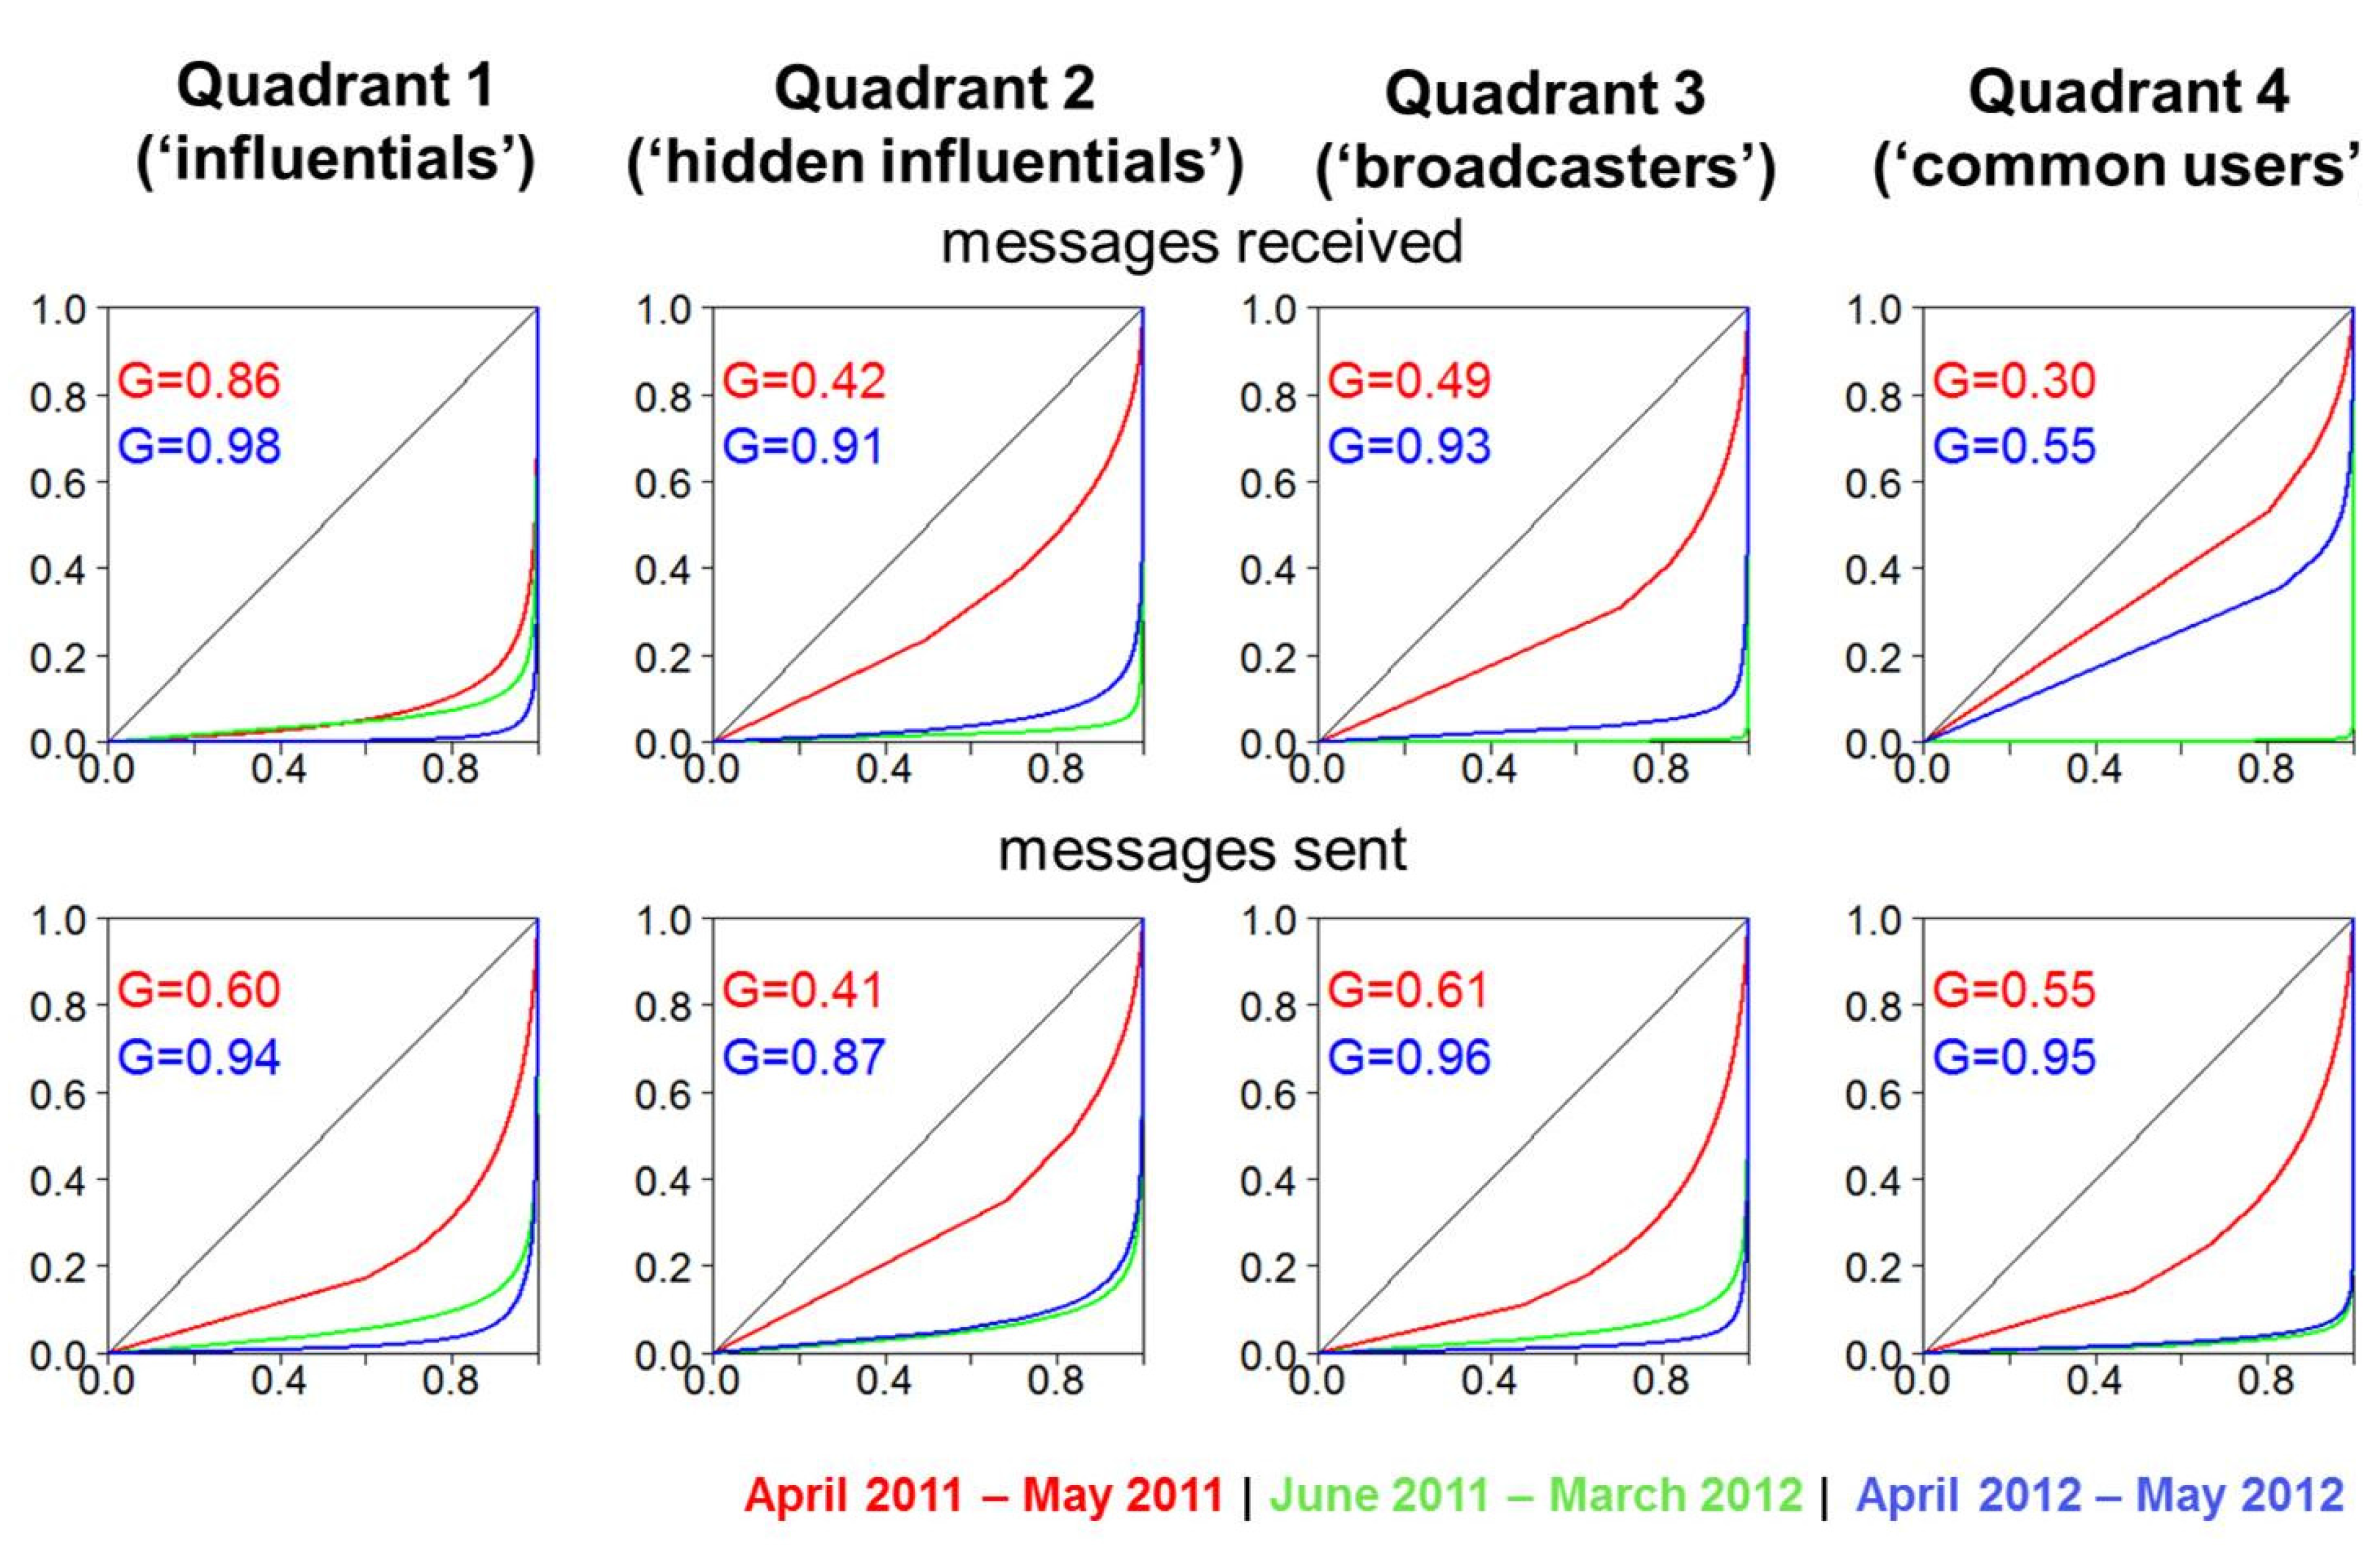
Figure 6 tries to identify the origin of this shift towards increased centralization; it displays the Gini coefficient for each category of users as a measure of inequality in the distribution of messages sent and received, for the protests in 2011 and 2012, and for the intervening period. Again, “messages sent” refers here to the number of mentions and RTs that users employ (that is, how prolific they are in assigning visibility to other users); and “messages received” refers to the how visible users are according to other users (measured as the number of mentions and RTs they get); the assumption is that both RTs and mentions are equally important as “votes” that count towards greater visibility. The diagonal line acts as the benchmark of perfect equality, and a lower coefficient indicates a more equal distribution.
What
Figure 6 shows is that the allocation and distribution of visibility grew more concentrated for all categories of users over time, but especially so for those classified as “hidden influential”. After the burst of activity that accompanied the emergence of the protests in 2011, activity entered a dormant phase where a small minority of users arise as the active senders and recipients of protest information; but when activity built up again to celebrate the first anniversary in 2012, the distribution of activity remained closer to the dormant period than to the original protests. Only visibility amongst “common users” gets closer to the 2011 levels, although it is still substantially more unequal. This means that the bottlenecks that already existed in 2011 become narrower in 2012, which could partially explain why cascades grew less, on average.
Figure 6.
Concentration of mentions and RTs received and sent by category of user. The inequality in the distribution of visibility (i.e., in how it is received and allocated) is measured by the Gini coefficient; the diagonal line is shown as a benchmark of perfect equality.
Figure 6.
Concentration of mentions and RTs received and sent by category of user. The inequality in the distribution of visibility (i.e., in how it is received and allocated) is measured by the Gini coefficient; the diagonal line is shown as a benchmark of perfect equality.
The bottlenecks, in fact, narrow down in several parts of the network. “Influentials” and “broadcasters” (who are not as visible but also have relatively large audiences and, as a consequence, are in a position to trigger more chain reactions) are less prone to allocate visibility in 2012—that is, fewer of them help direct attention to other active users. To the extent that they are the target of most messages in the network, the ratio of visibility received/redistributed becomes inevitably larger, which translates into lost information because these users do not continue the chain reaction as often as they could, as measured by the number of inputs they receive; this exacerbates a phenomenon already identified in the 2011 protests [
5].
Figure 6 reveals that in 2012 there were more bottlenecks both at the source and at the destination of visibility allocation. This increasing concentration in the dynamics of visibility might be consistent with a preferential attachment mechanism [
36], but the migration patterns identified in
Figure 5 suggest that some additional mechanism, related to the volatility in the network, might also drive changes in communication patterns.
5. Discussion
The two examples of information diffusion analyzed in this paper relate to successful instances of mass political mobilization: we track communication activity that run in parallel to the build-up and explosion of massive protests. However, the mobilizations in 2012 were, by most accounts, less successful than in 2011, if only because they couldn’t capitalize on the surprise factor and the passions that characterize the emergence of a political movement [
28,
29]. Although it would be naïve—and a stretch of facts—to imply that the different development of these two protests can be attributed to different uses of social media and online communication, they still offer a good case study to analyze how networks behave when diffusion follows less successful paths. Less people might have been interested in the protests in 2012, and consequently created less demand for information; and this might explain the lower activity levels amongst online broadcasters. But these dynamics still leave an imprint on networks and the way in which they mediate information diffusion. We have offered some evidence illustrating how these dynamics are manifested.
Our analyses reveal that a decrease in cascades sizes is associated with increased network centrality, both in the underlying network of connections and the more dynamic network of communication. Changes take place in the degree distributions but also in the composition of the networks: less than 10% of the users captured in 2011 re-appear in 2012, and amongst those who reappear, many change their structural position; volatility is particularly consequential in the communication network where visibility is distributed: users who were very visible in the stream of protest-related information cease being so one year later; the number of users sending the bulk of messages and therefore assigning visibility becomes also smaller, and activity more concentrated.
These changes are necessarily related to agency, that is, to the fact that nodes in this network are people who decide whether to keep on being active in the exchange of communication (political activity is, in this respect, particularly eroding). But they are also related to the interaction effects that arise from the co-evolution of networks that change at different speeds; in this case, the relatively stable structure of communication channels (the following/follower network), and the more fluid network of actual communication exchange (based on mentions and RTs). The increasing centrality in both networks creates more bottlenecks that generate capacity overload; this could explain why cascades are smaller and the diffusion curve slower in 2012 compared to 2011. These empirical observations are consistent with previous theoretical models that highlight the detrimental role of hubs when it comes to facilitating diffusion. The changes in composition we identify, however, make networks evolve in ways that are not predicted by traditional mechanisms like preferential attachment: many nodes disappear, and many downgrade from central to peripheral positions. Networks in the real world change composition with different speed and at different rates, and this impacts their performance in ways that we are only beginning to understand.
In spite of these local changes, on the aggregate level there is a clear tendency towards increased centralization. As indicated above, we cannot be certain that these changes are reflecting a genuine trend towards more hierarchical structures or are instead a partial artefact of the sampling procedure, over which we do not have full control. However, even if we restrict the analysis to the users that appear in both observations (disregarding those who leave the network and the new additions), we still observe increasing levels of concentration; we also observe uneven migrating patterns: all users tend to focus their attention on a narrower set of other users, but not all of them are as likely to move from one part of the network to another. These patterns of change are intriguing and not likely to result from the sampling process; they reveal local changes in how the network of communication allocates visibility that run in parallel, but not necessarily in the same direction, as changes in the underlying structure of more stable connections.

 and
and 
