2. Evaluating Thermodynamic Variables
Multispectral scanners of the Landsat satellites capture the reflected radiation within the wavelengths of 0.450–2.350 µm with the spatial resolution of 30 × 30 m. The heat flux is captured within the range of 10.120–14.500 µm, based on heat channel with the 60 × 60 m resolution for Landsat 7 ETM+ and 120 × 120 m—for Landsat 5 ТМ. In summary, the combined ranges of Landsat ТМ and ЕТМ+ channels cover 22.8% of the solar spectrum range and account for 42.4% of the spectral power. The Landsat users receive data on reflective properties in each channel in the form of “digital numbers” (DN) that are proportional to the energy flow captured by the sensor. DN values are dimensionless and proportional to the volume of upcoming radiation as well as radiation captured by the sensor (“at-sensor radiance”, “spectral radiance”), which is measured in W/m
2µm. The methodology of converting the channel luminance for Landsat 7 TM and ETM+ into energy units is described in detail by Chander with co-authors [
5]. Calibration coefficients for sensors are included in data files, which are provided along with imagery data.
The values of DN could be expressed in energy units by using the following formula:
where
![Entropy 15 03970 i002]()
—amount of radiation captured by the sensor (W/m
2µm) in the spectral range
v (channel);
![Entropy 15 03970 i002]()
min—amount of incoming radiation, which after scaling becomes Qmin;
![Entropy 15 03970 i002]()
max—amount of incoming radiation, which after scaling becomes Qmax;
Qmin—minimal calibrated value of DN;
Qmax—maximal calibrated value of DN (equal to 255);
Qcal—calibrated value of DN.
The incoming solar radiation is estimated based on the solar constant for each channel (values of the constant are provided in data files and special manuals,
e.g., Chander with co-authors [
6]) and is corrected according to the solar heights of the sun and the distance from the Sun to the Earth:
where
![Entropy 15 03970 i004]()
—incoming solar radiation in the range
v (channel), W/m
2µm;
![Entropy 15 03970 i005]()
—solar constant
v (W/m
2µm);
θ—solar zenith angle (90°—sun elevation),
d—distance between the Earth and the sun (astronomical units). Recalculation from heat long-wave channel to energy units results in the heat flux from the studied surface, which could be used to calculate the temperature of that surface. The following formula is used:
where Т—is temperature in Kelvin; К
1—constant for calibration in W/m
2µm, К
2—constant for calibration in Kelvin;
e6—incoming radiation measured by the sensor in the 6-th “heat” channel, W/m
2.
Examples of the calculation of thermodynamic variables based on multispectral images from Landsat TM and ETM+ were suggested by Jorgensen and Svirezhev [
3] and further developed by Puzachenko and Sandlerskiy [
4,
7]. These studies also present the theoretical basis of interpreting the thermodynamic variables. Such interpretation is mostly qualitative since many key parameters such as the noise level in measurement channels and degrees of absorption and dissipation of solar radiation when it passes through the atmosphere remain unknown.
The calculation of exergy of the reflected solar radiation based on the multispectral images for a unit of surface is performed by evaluating the “distance” between the real frequency distribution of absorption spectrum of solar energy and the “equilibrium” frequency distribution. The degree of difference between the distributions is measured by the increment of Kullbak entropy. The increment is zero when the frequency distribution of incoming radiation is equivalent to the frequency distribution of reflected radiation across the spectrum (meaning that the information receptor is equivalent to the information transmitter). If the Kullbak entropy increment is positive, then there is an increment of information at the level of receptor and the reflective surface is in non-equilibrium state relative to the radiation spectrum.
The increment of Kullbak entropy (К, nit) is calculated as:
where
![Entropy 15 03970 i008]()
—is the ratio of incoming radiation in the spectral range
v and the total incoming radiation;
![Entropy 15 03970 i009]()
—ratio of reflected radiation in the spectral range
v to the total reflected radiation.
The plant cover is the main absorbing landscape surface and morphological and biochemical changes in this surface are associated with the extraction of information from the environment, including the solar spectrum [
7]. The exergy of solar radiation (Ex) is estimated as:
where E
in—incoming solar radiation, E°
ut—reflected solar radiation, R = E
in − E°
ut—absorbed energy, and E°
ut/E
in—albedo.
When the albedo is fixed the larger increment of Kullbak information means the greater solar radiation exergy.
The entropy of reflected solar radiation (S
out, nit) is calculated as follows:
The entropy is a measure of structural complexity of the system that transforms the incoming solar radiation and is proportional to energy dissipation.
The amount to “bound” energy (STW), which is not converted to useful work is calculated as:
where TW is the heat flux from the active surface captured by the 6-th long wavelength channel.
An increment of the internal energy (DU) (transition from solar energy into internal energy) is evaluated from the “balance” equation, where R is absorbed energy:
The direct consumption of energy for biological production is calculated from the difference between reflected energy in the red (RED) and short-range infrared ranges (NIR) and is measured by the vegetative index (VI), or “productivity index”. This index (VI) measures the difference in energies reflected by mesophyll and chlorophyll. Greater mass of mesophyll translates into greater reflection by its layer, while the lower reflection by chlorophyll means that more energy is transformed into mesophyll in the process of photosynthesis. For spectral channels of Landsat TM and ETM+ the VI index is calculated as:
where
![Entropy 15 03970 i013]()
—reflected solar radiation in the 4-the channel (0.77–0.90 µm),
![Entropy 15 03970 i014]()
—reflected solar radiation in the 3-d channel (0.63–0.69 µm).
Another index that is used more frequently is the Normalized Difference Vegetation Index— NDVI, which is equal to the ratio of VI to the sum of RED and NIR reflectivity values. Many studies have showed strong non-linear relationship of this index with the net primary production (for example, [
5]). On the basis of a large volume of data it has been demonstrated that the NPP measured in grams per square meter is a non-linear function of NDVI [
8]. The advantage of NDVI is its fixed range from (−1) to (1), where the negative values are typical for the areas without vegetation. Water objects have NDVI of (−0.25), snow (−0.05), artificial materials (asphalt, concrete) – (−0.5). At the same time, when proper corrective factors are used the VI index better reflects expenditures on biological production. For instance, in a pilot region for the current study at 11 am of June 4th the value of this index was on average 2.5% from the incoming photosynthetically active solar radiation (PAR), which is close to the coefficient of performance of photosynthesis with a maximal intensity.
Direct measurement of thermodynamic variables that reflect the process of converting solar radiation into exergy (free energy), heat flux and biological production provides an opportunity to research the functioning of living matter as a non-linear dissipative and self-organizing system. In the first half of the 20th century Vernadskiy [
9,
10] and Bauer [
11] put forward the notion of thermodynamic non-equilibrium of living matter. Bauer was proving that during the course of evolution the living matter tends to maximize the free energy, while Vernadskiy was arguing that two variables that are maximized during the course of evolution are the energy of biogeochemical transformation and the free energy of biosphere. These theses are practically the same to those about maximization of exergy postulated by Jorgensen [
12,
13] and could be generalized as follows: a biological system is more advanced if it has the higher exergy (or useful energy) content.
The second key aspect of functioning of biological systems is related to their capacity of “organizing” themselves (self-organization). Vernadskiy [
9] claimed that the living matter cannot be fully understood without the reference to the degree of its “organization”, which he interpreted as an evolving order in system functionality and structure. The topic of “organization” and “self-organization” has attracted significant attention in the 1950s in the area of cybernetic research (for example [
14,
15]). Already at that stage the role of the second law of thermodynamics and the transfer of energy and information in the creation of system structure, interconnectivity and mutual limitations has been postulated.
To measure the level of organization H. Foerster [
16] suggested the following formula:
where H is entropy, H
max = log
2k, where k is the number of discrete classes. A system has a tendency to self-organize is the derivative dR/dt is more than zero. If the derivative is less than zero than the system reduces its degree of organization (order). Later Kay [
17] has introduced a metric for organization for a multidimensional case, which was based on the combined entropy of several variables. An increment of Kullbak entropy [see Equation (4) above] could be viewed as a measure of departure from the equilibrium or stationary stage. Clearly, the multispectral remote-sensing measurements could enable one to directly measure entropy, incremental system information, and exergy (see equations above). Since the landscape cover system is complex and has synergetic properties, it is logical to study them by separating several independent subsystems, which transform solar energy. In particular this task could be solved by using the method of Principal Components (or Factor Analysis) [
18].
While the topics of organization and self-organization of biological systems have attracted very significant attention, it is still difficult to collect an appropriate amount of data for demonstrating how the theory could be used for predicting and explaining the systems behaviour. The current paper shows some initial results of using multispectral remote sensing data for studying variation in thermodynamic properties of taiga landscapes.
3. Selected Results
The factor analysis of 15 Landsat images taken during one summer day in the Russian Central Forest Reserve led to the isolation of
two subsystems in the plant cover (
Table 1). The first subsystem is defined by the structure of the reflection spectrum and the biological production index; the second—by exergy and heat flux. The absorption and dissipation of the solar energy are controlled by both subsystems to a similar degree. During the vegetative season specific coefficients and their weights could vary but the clear relations are seen in all the observations. It could be concluded that the first subsystem reflects structural transformations (organization) and biological productivity (biophysical processes) and the second—reflects exergy, connected with the heat use for evaporation and heat exchange (physical processes).
Table 1.
The typical 2-factor system of solar energy conversion, which describes 92% of its spatial variability (date of Landsat images: June 3, 2007).
Table 1.
The typical 2-factor system of solar energy conversion, which describes 92% of its spatial variability (date of Landsat images: June 3, 2007).
| Variable | Factors |
| First Factor | Second Factor |
| Absorbed radiation | 0.721 | 0.678 |
| Exergy | 0.577 | 0.797 |
| Increment of information | −0.970 | 0.199 |
| Entropy | 0.900 | −0.375 |
| Bound energy | 0.705 | −0.708 |
| Heat flux | 0.193 | −0.919 |
| Vegetation index | −0.959 | −0.269 |
| Explained variability | 4.057 | 2.693 |
| % Total variability | 0.580 | 0.385 |
Table 2.
Average values of thermodynamic variables for three types of landscape cover (definitions in the text).
Table 2.
Average values of thermodynamic variables for three types of landscape cover (definitions in the text).
| Variable | Type |
|---|
| All landscapes | Forest | Bog | Meadows, clear-cuts |
|---|
| Absorbed radiation, W/m2 | 125.4 | 126.2 | 123.4 | 122.2 |
| Exergy, W/m2 | 95.2 | 96.7 | 89.8 | 90.3 |
| Temperature, °C | 13.6 | 12.9 | 20.2 | 14.4 |
| Entropy, nit | 1.33 | 1.33 | 1.43 | 1.29 |
| Increment of information, nit | 0.25 | 0.25 | 0.17 | 0.3 |
| Bound energy, W/m2 | 10.1 | 10 | 12 | 9.9 |
| Increment of the internal energy, W/m2 | 20 | 19.5 | 21.6 | 22 |
| Vegetation index, W/m2 | 2.54 | 2.37 | 2.34 | 3.33 |
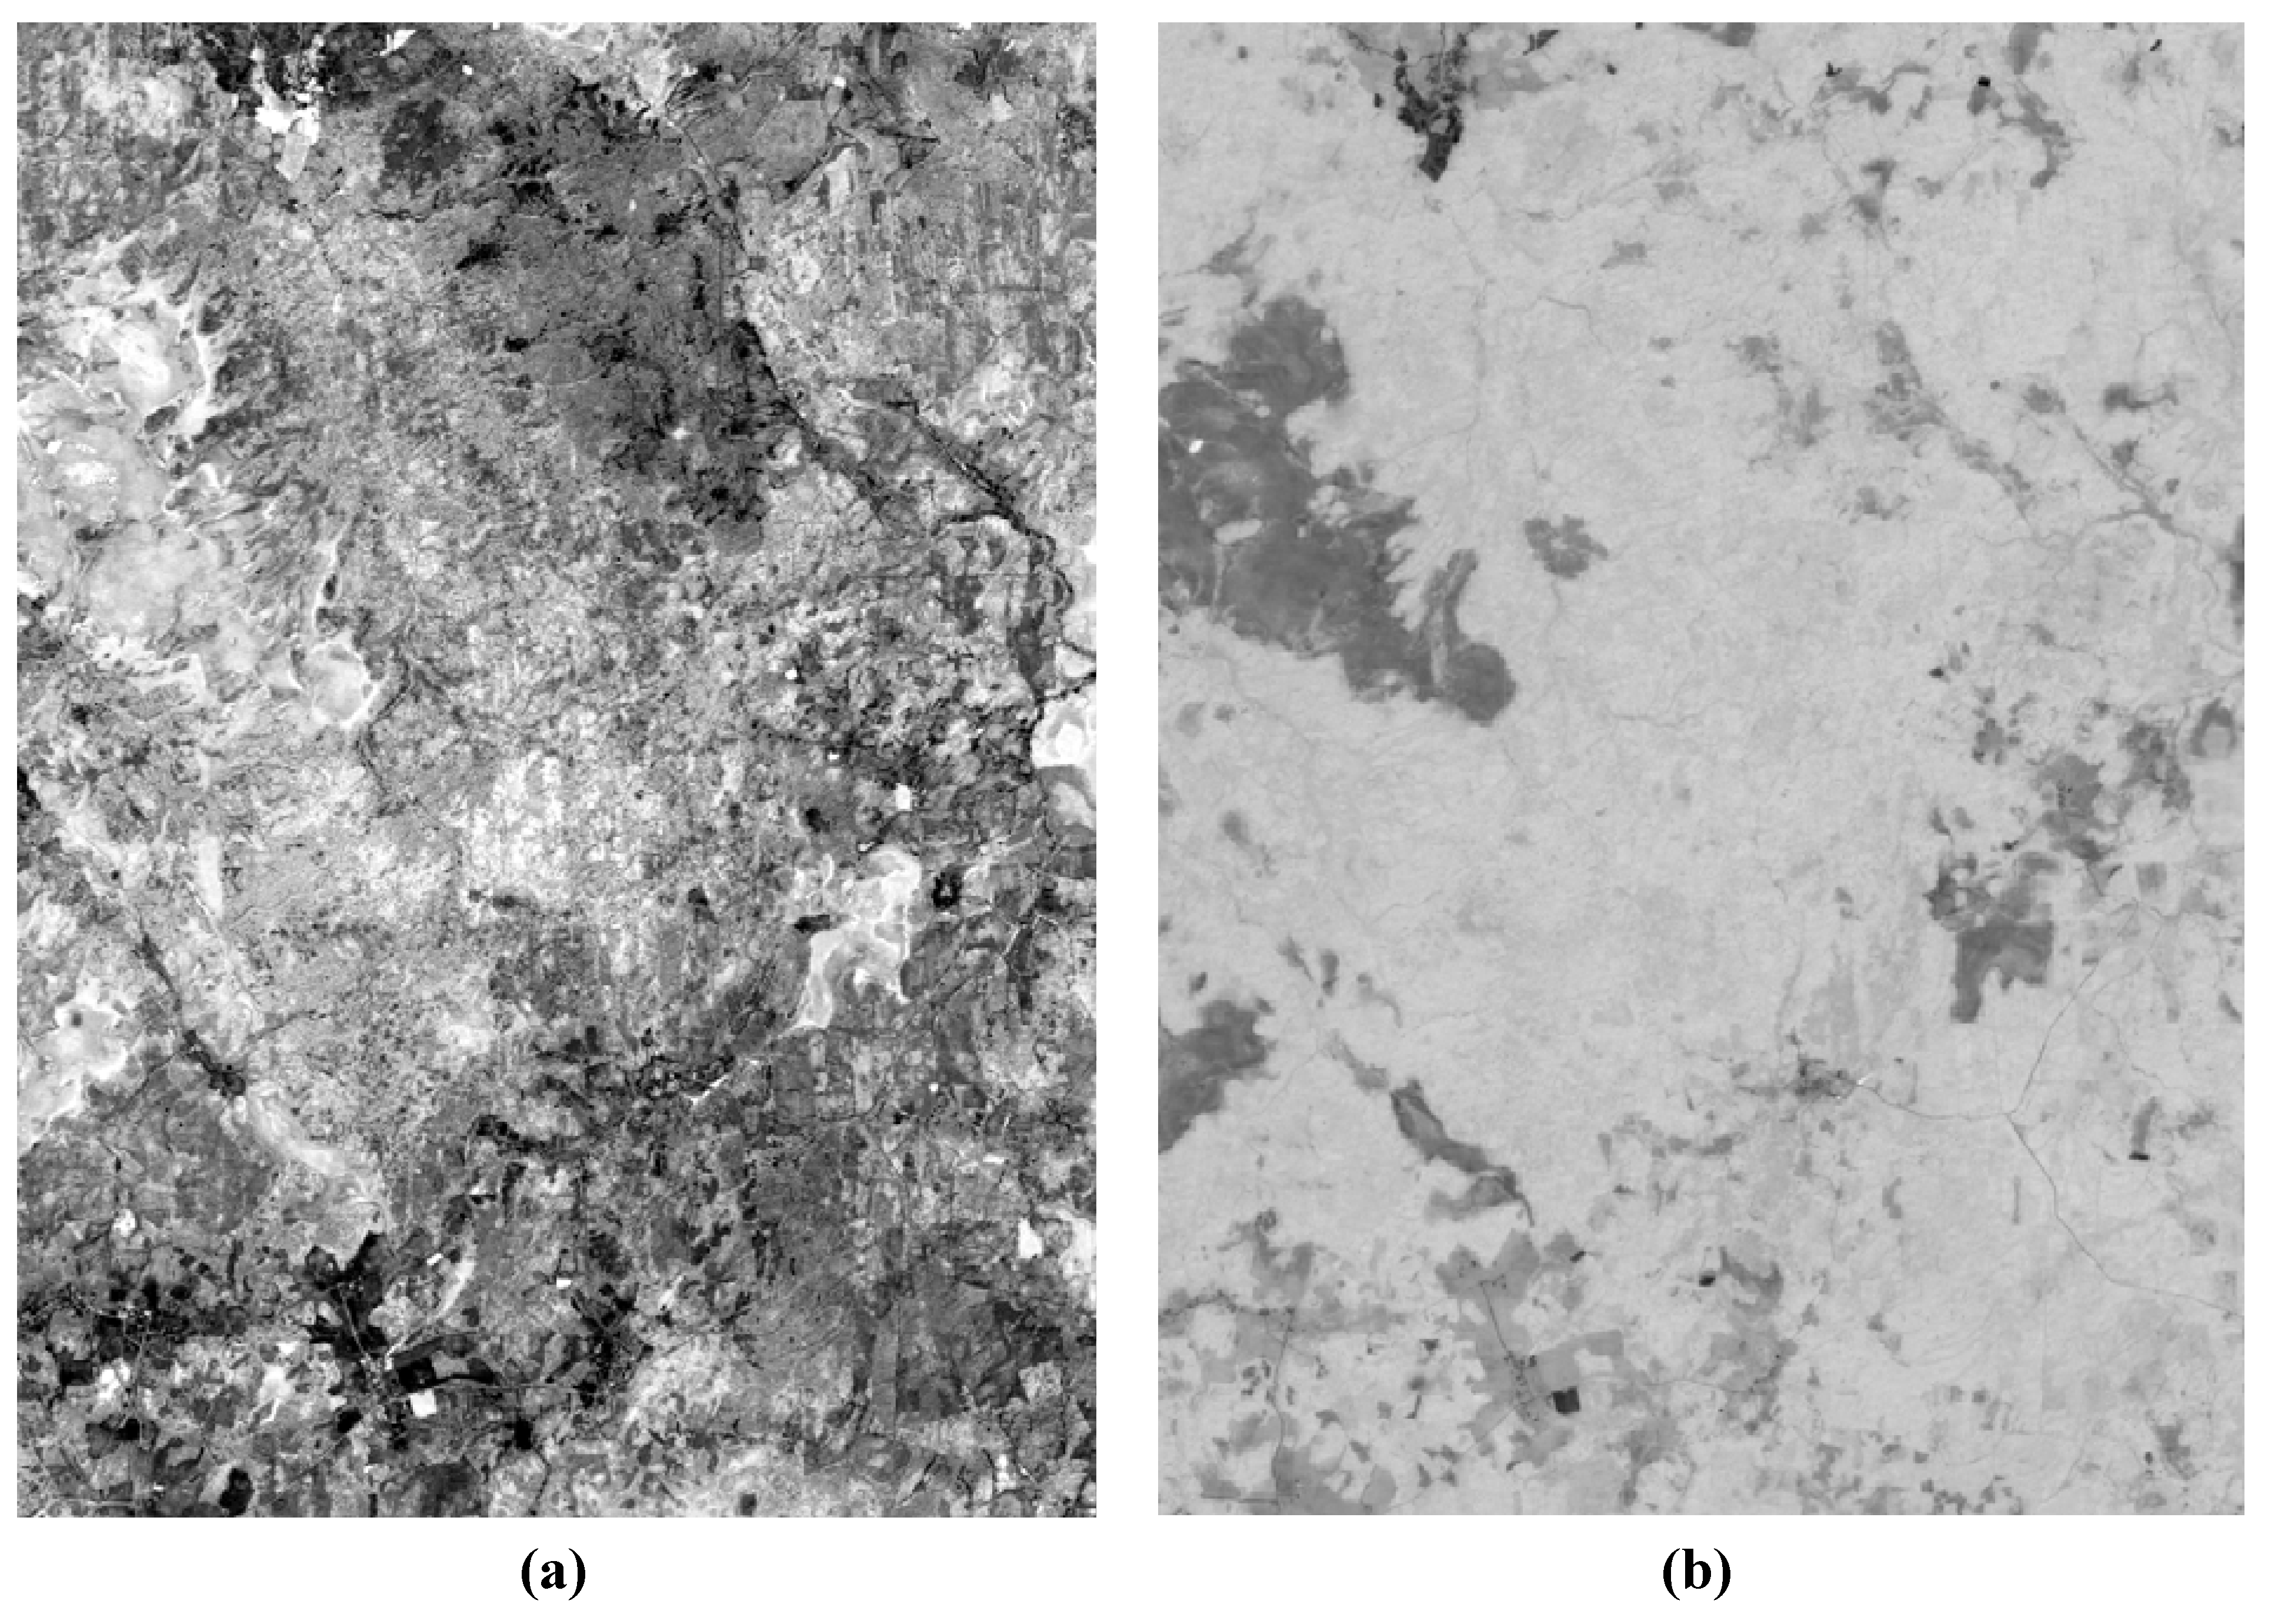
Figure 1 shows the spatial variation of these two subsystems.
Table 2 clearly demonstrates that forests and bogs have principally different thermodynamic properties. The temperature over bogs was by 7.3 °С higher than that over forest, exergy was minimal (close to that in meadows), increment of information—minimal and productivity—close to that in forests. On the opposite, forests have maximal exergy and minimal temperature. The exergy of meadows is about the same as that of bogs, but the temperature of their surface is substantially lower. The values of entropy and information for meadows are close to those in forests, while their biological productivity is maximal.
Figure 1.
(a) First factor: dark color—minimal entropy, maximal information increment and biological productivity, (b) Second factor: dark color—maximal surface temperature, minimal exergy.
Figure 1.
(a) First factor: dark color—minimal entropy, maximal information increment and biological productivity, (b) Second factor: dark color—maximal surface temperature, minimal exergy.
Data from
Table 2 could be interpreted in thermodynamic terms as follows: (1) forests convert major part of absorbed radiation into exergy and maintain the minimal temperature; (2) bogs and meadows have similar levels of exergy, but the temperature of a raised bog is much higher than both forests and meadows. Such radiation balance parameters have been demonstrated by Luvall and Holbo [
19], however, such principal differences between bogs on one side and forests and meadows on another side are demonstrated for the first time in the current study.
Structurally (as reflected by the First Factor) meadows are most “organized” (minimal entropy) and far from equilibrium (maximal information increment); they are also the most productive. On another hand the system of solar radiation transformation by bogs is less “organized”, closer to equilibrium and has minimum productivity. In general, vegetation of meadows and bogs uses water more economically than forests.
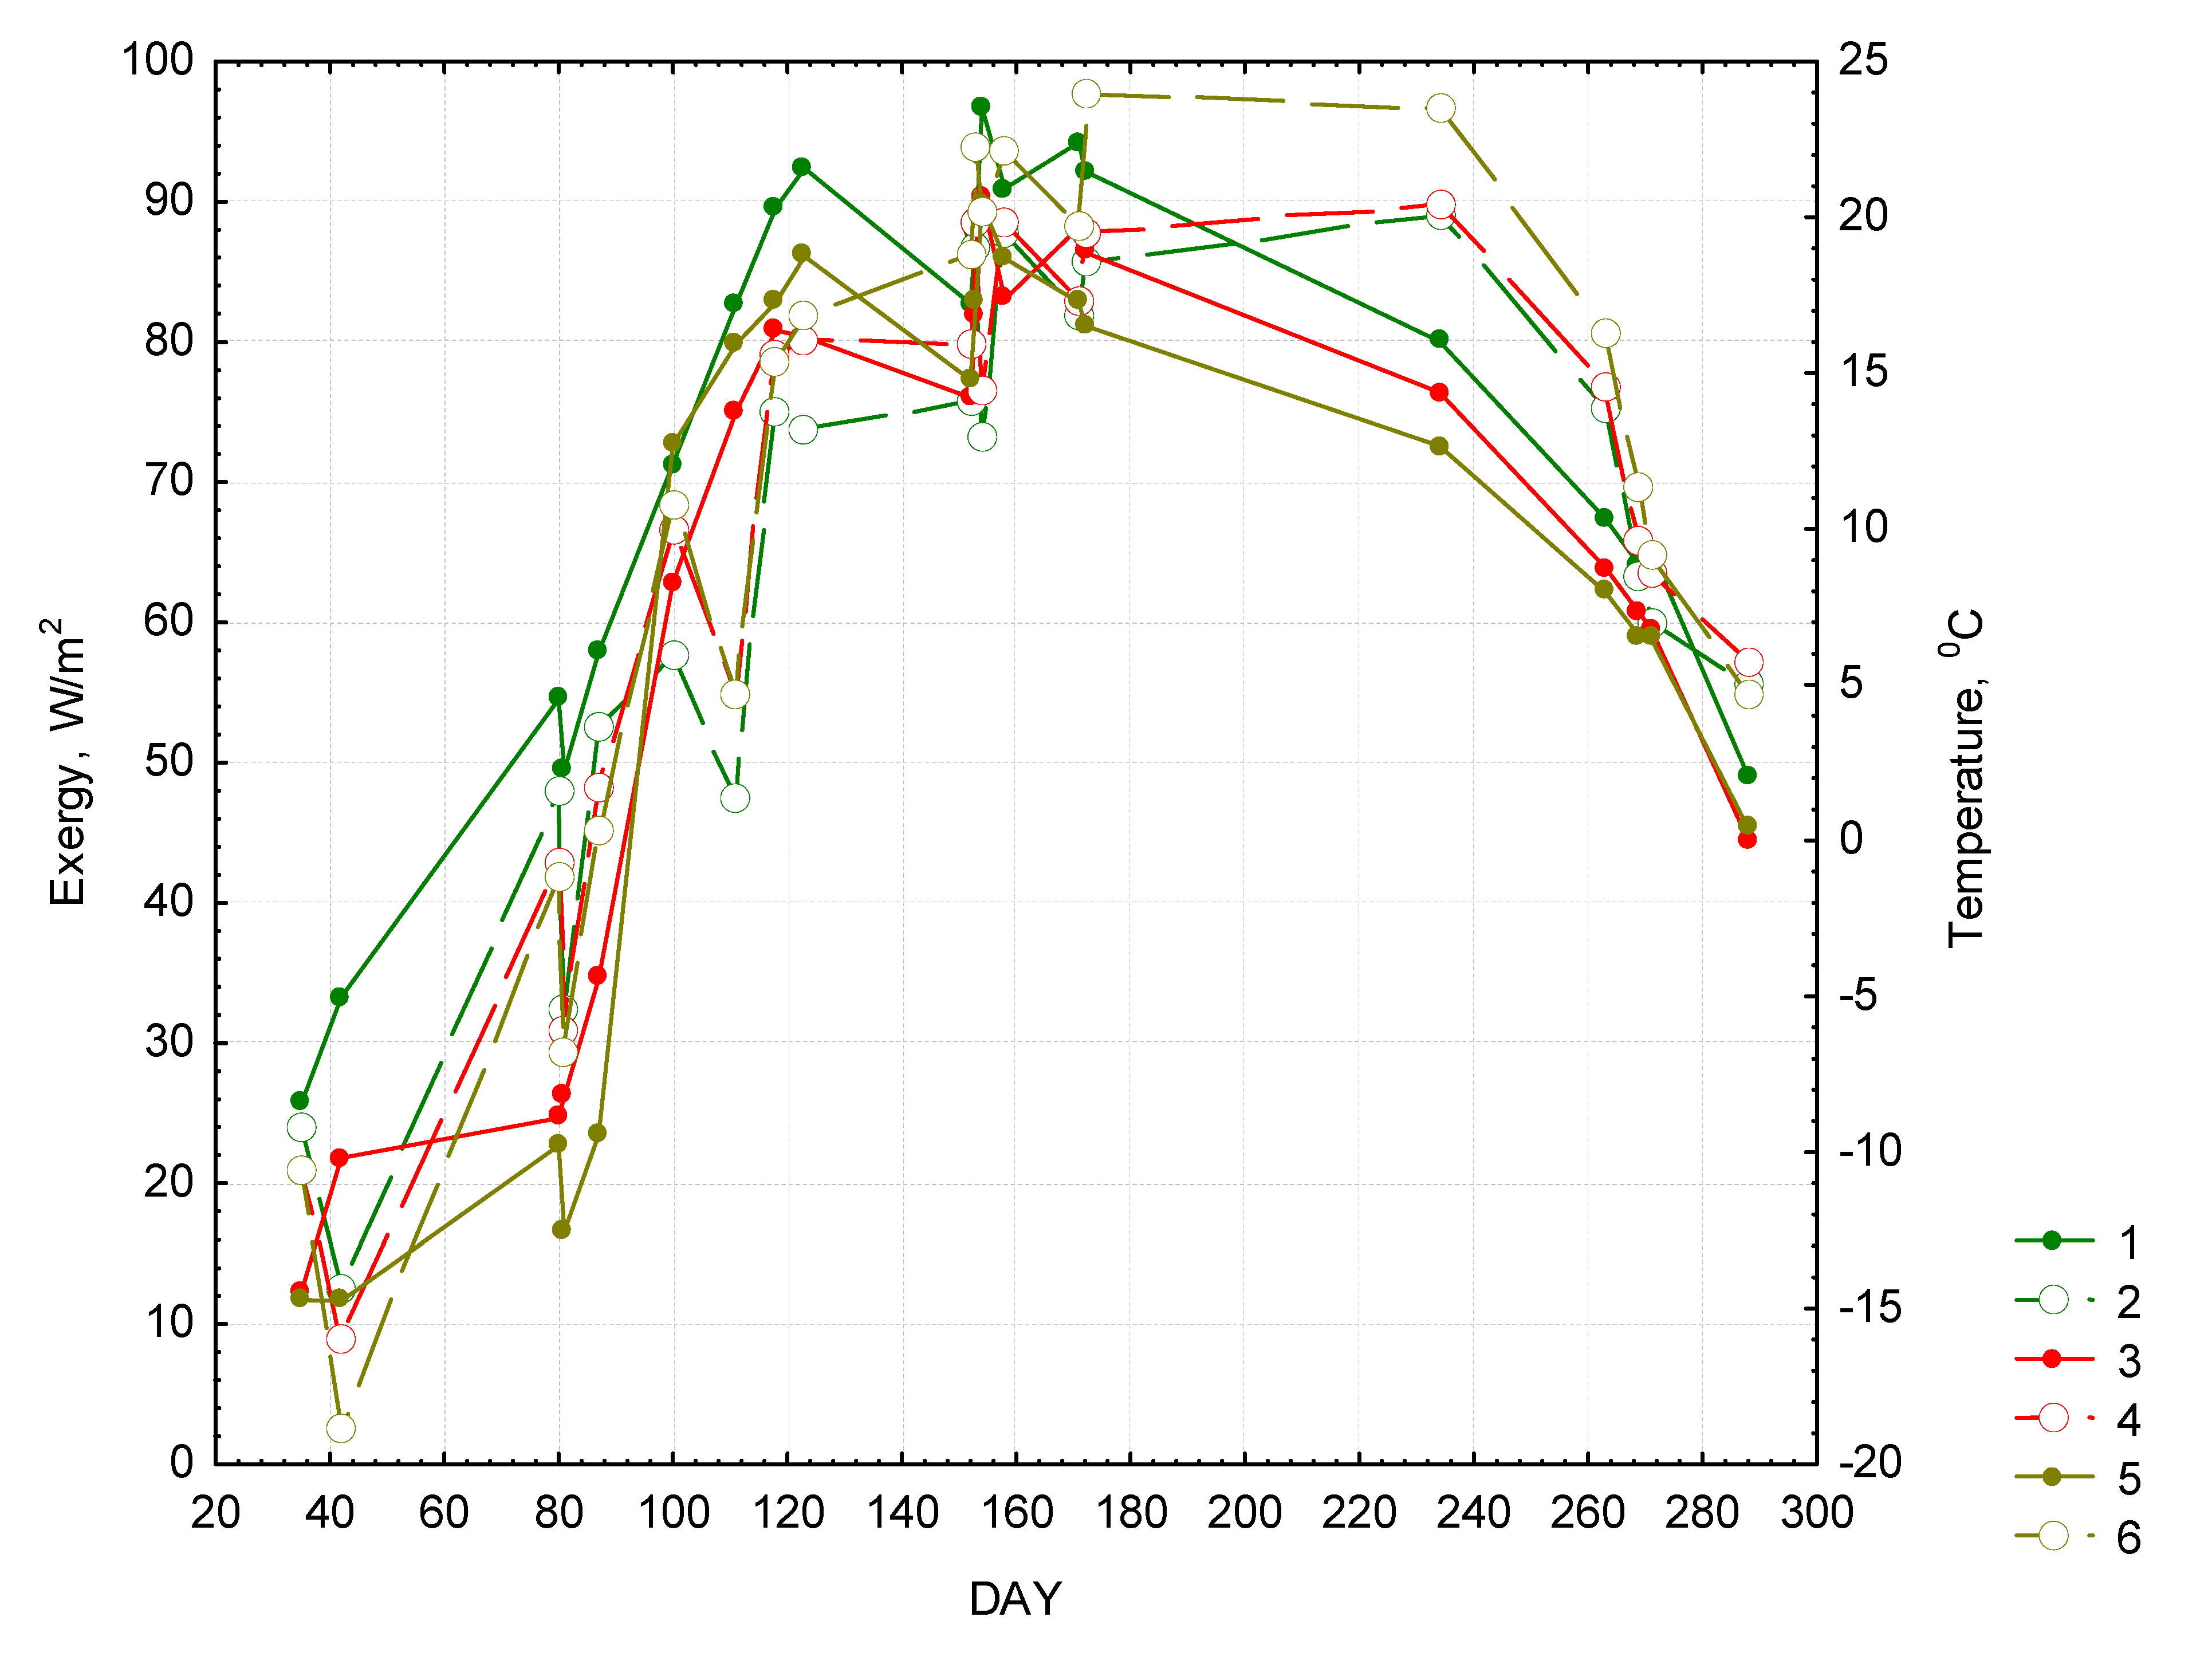
Figure 2 demonstrates the seasonal path of exergy and temperature. The graph shows that the exergy of forests is higher during the entire year and the temperature is lower than those of meadows and bogs. Only during early spring and late autumn the exergy of bogs approaches that of forests, while the temperature difference between all the landscape types become less pronounced. During the vegetative season the exergy in forests (Ex(F)) is determined solely by the incoming solar radiation (E
in) and is not sensitive to variation of temperature and precipitation in preceding periods of time (local sums of temperature and precipitation were obtained from the meteostation of the reserve). This relation is described as follows:
Figure 2.
Seasonal changes in exergy and temperature. Forests: “1”—exergy, 2—temperature. Meadows: “3”—exergy, “4”—temperature. Bogs: “5”—exergy, “6”—temperature.
Figure 2.
Seasonal changes in exergy and temperature. Forests: “1”—exergy, 2—temperature. Meadows: “3”—exergy, “4”—temperature. Bogs: “5”—exergy, “6”—temperature.
In case of meadows and bogs the corresponding correlation coefficients are lower and their exergy depends not only from incoming radiation by also from climatic parameters. The exergy equation for meadows [Ex(M)] looks as follows:
where Т24 is the sum of temperatures for the period of 24 days before the date of radiation measurement.
The equation for exergy of bogs (Ex(B)) is quite similar:
where TMP—is the temperature during the day when exergy is measured. The sample used for calculating these exergy equations contains only 15 observations (15 satellite images), which is not sufficient for accurately evaluating the impact of multiple variables. However, we could conclude that the surface temperature plays very different role in functioning of different land cover types.
Figure 3.
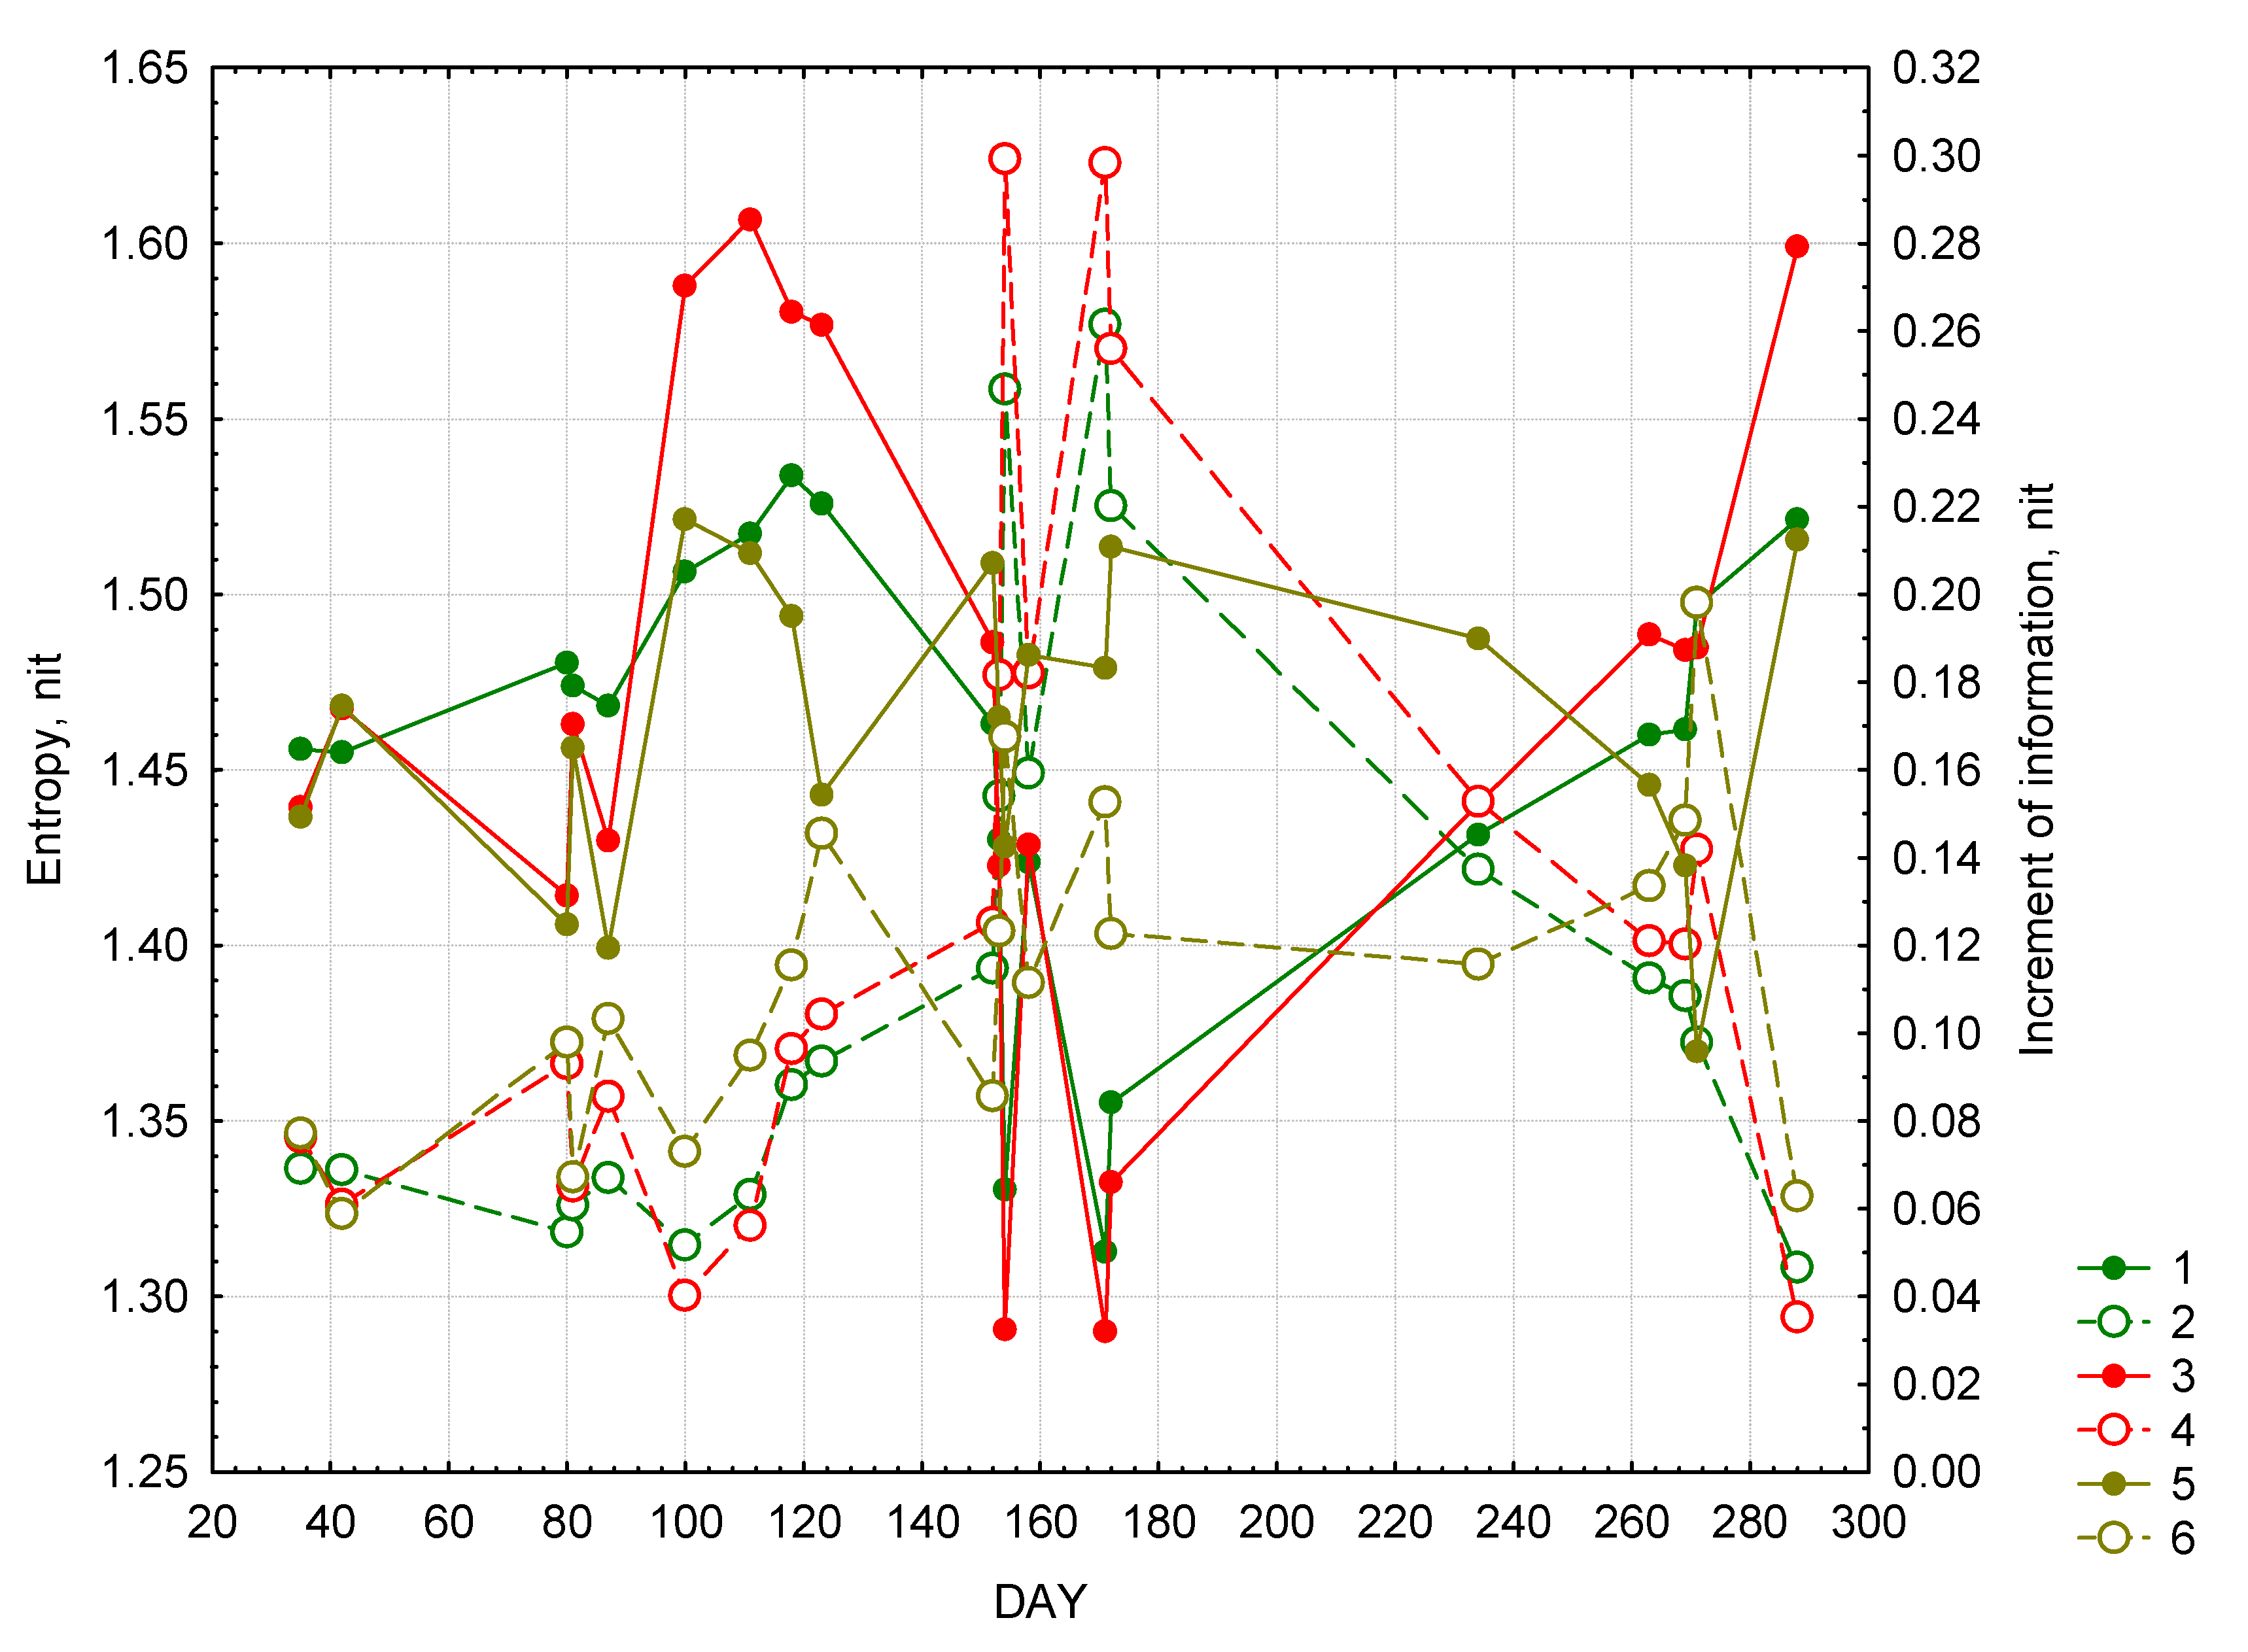
Seasonal changes in entropy and increment of information. Forest: 1—entropy, 2 —increment of information. Meadow: 3—entropy, 4—increment of information. Bog: 5—entropy, 6 – increment of information.
Figure 3.
Seasonal changes in entropy and increment of information. Forest: 1—entropy, 2 —increment of information. Meadow: 3—entropy, 4—increment of information. Bog: 5—entropy, 6 – increment of information.
Figure 3 shows temporal variation in entropy and incremental information. Overall, it could be inferred that all the landscape types are closer to equilibrium in the winter and late autumn. However, the entropy values during these two seasons are quite different: average during the winter and close to maximal during the autumn. In all types of landscapes the entropy grows in April and beginning of May. The most rapid changes occur in meadows and this system is most close to the equilibrium state in mid-April. The information increment increases in all types of landscapes starting from winter reaching its maximum levels during summer, when the entropy it at its lowest levels. During this season the systems of converting solar radiation in forests and meadows are most structured and far from equilibrium. In August and September the entropy in these two types of landscapes gradually increases and the information increment declines. The variation of both entropy and information increment is bogs during the entire vegetative season is insignificant relative to forests and meadows. The level of “organization” of this landscape type reaches maximum levels in the beginning of June and September and is relatively lower than in forests and meadows.
The type of dynamics of both entropy and information increment suggests that it is in part determined by weather. While the sample size is too small to draw any serious conclusions it could be suggested that the entropy of forests and meadows is correlated with the sum of temperatures for the preceding 24 days. The correlation coefficients for forests are 0.75 in case of entropy and 0.78 in case of information increment; and for meadow: −0.81 and 0.78, respectively. These relations are not as evident in case of bogs with the exception of negative correlation between entropy and the sum of precipitation for preceding 36 days (r = −0.51).
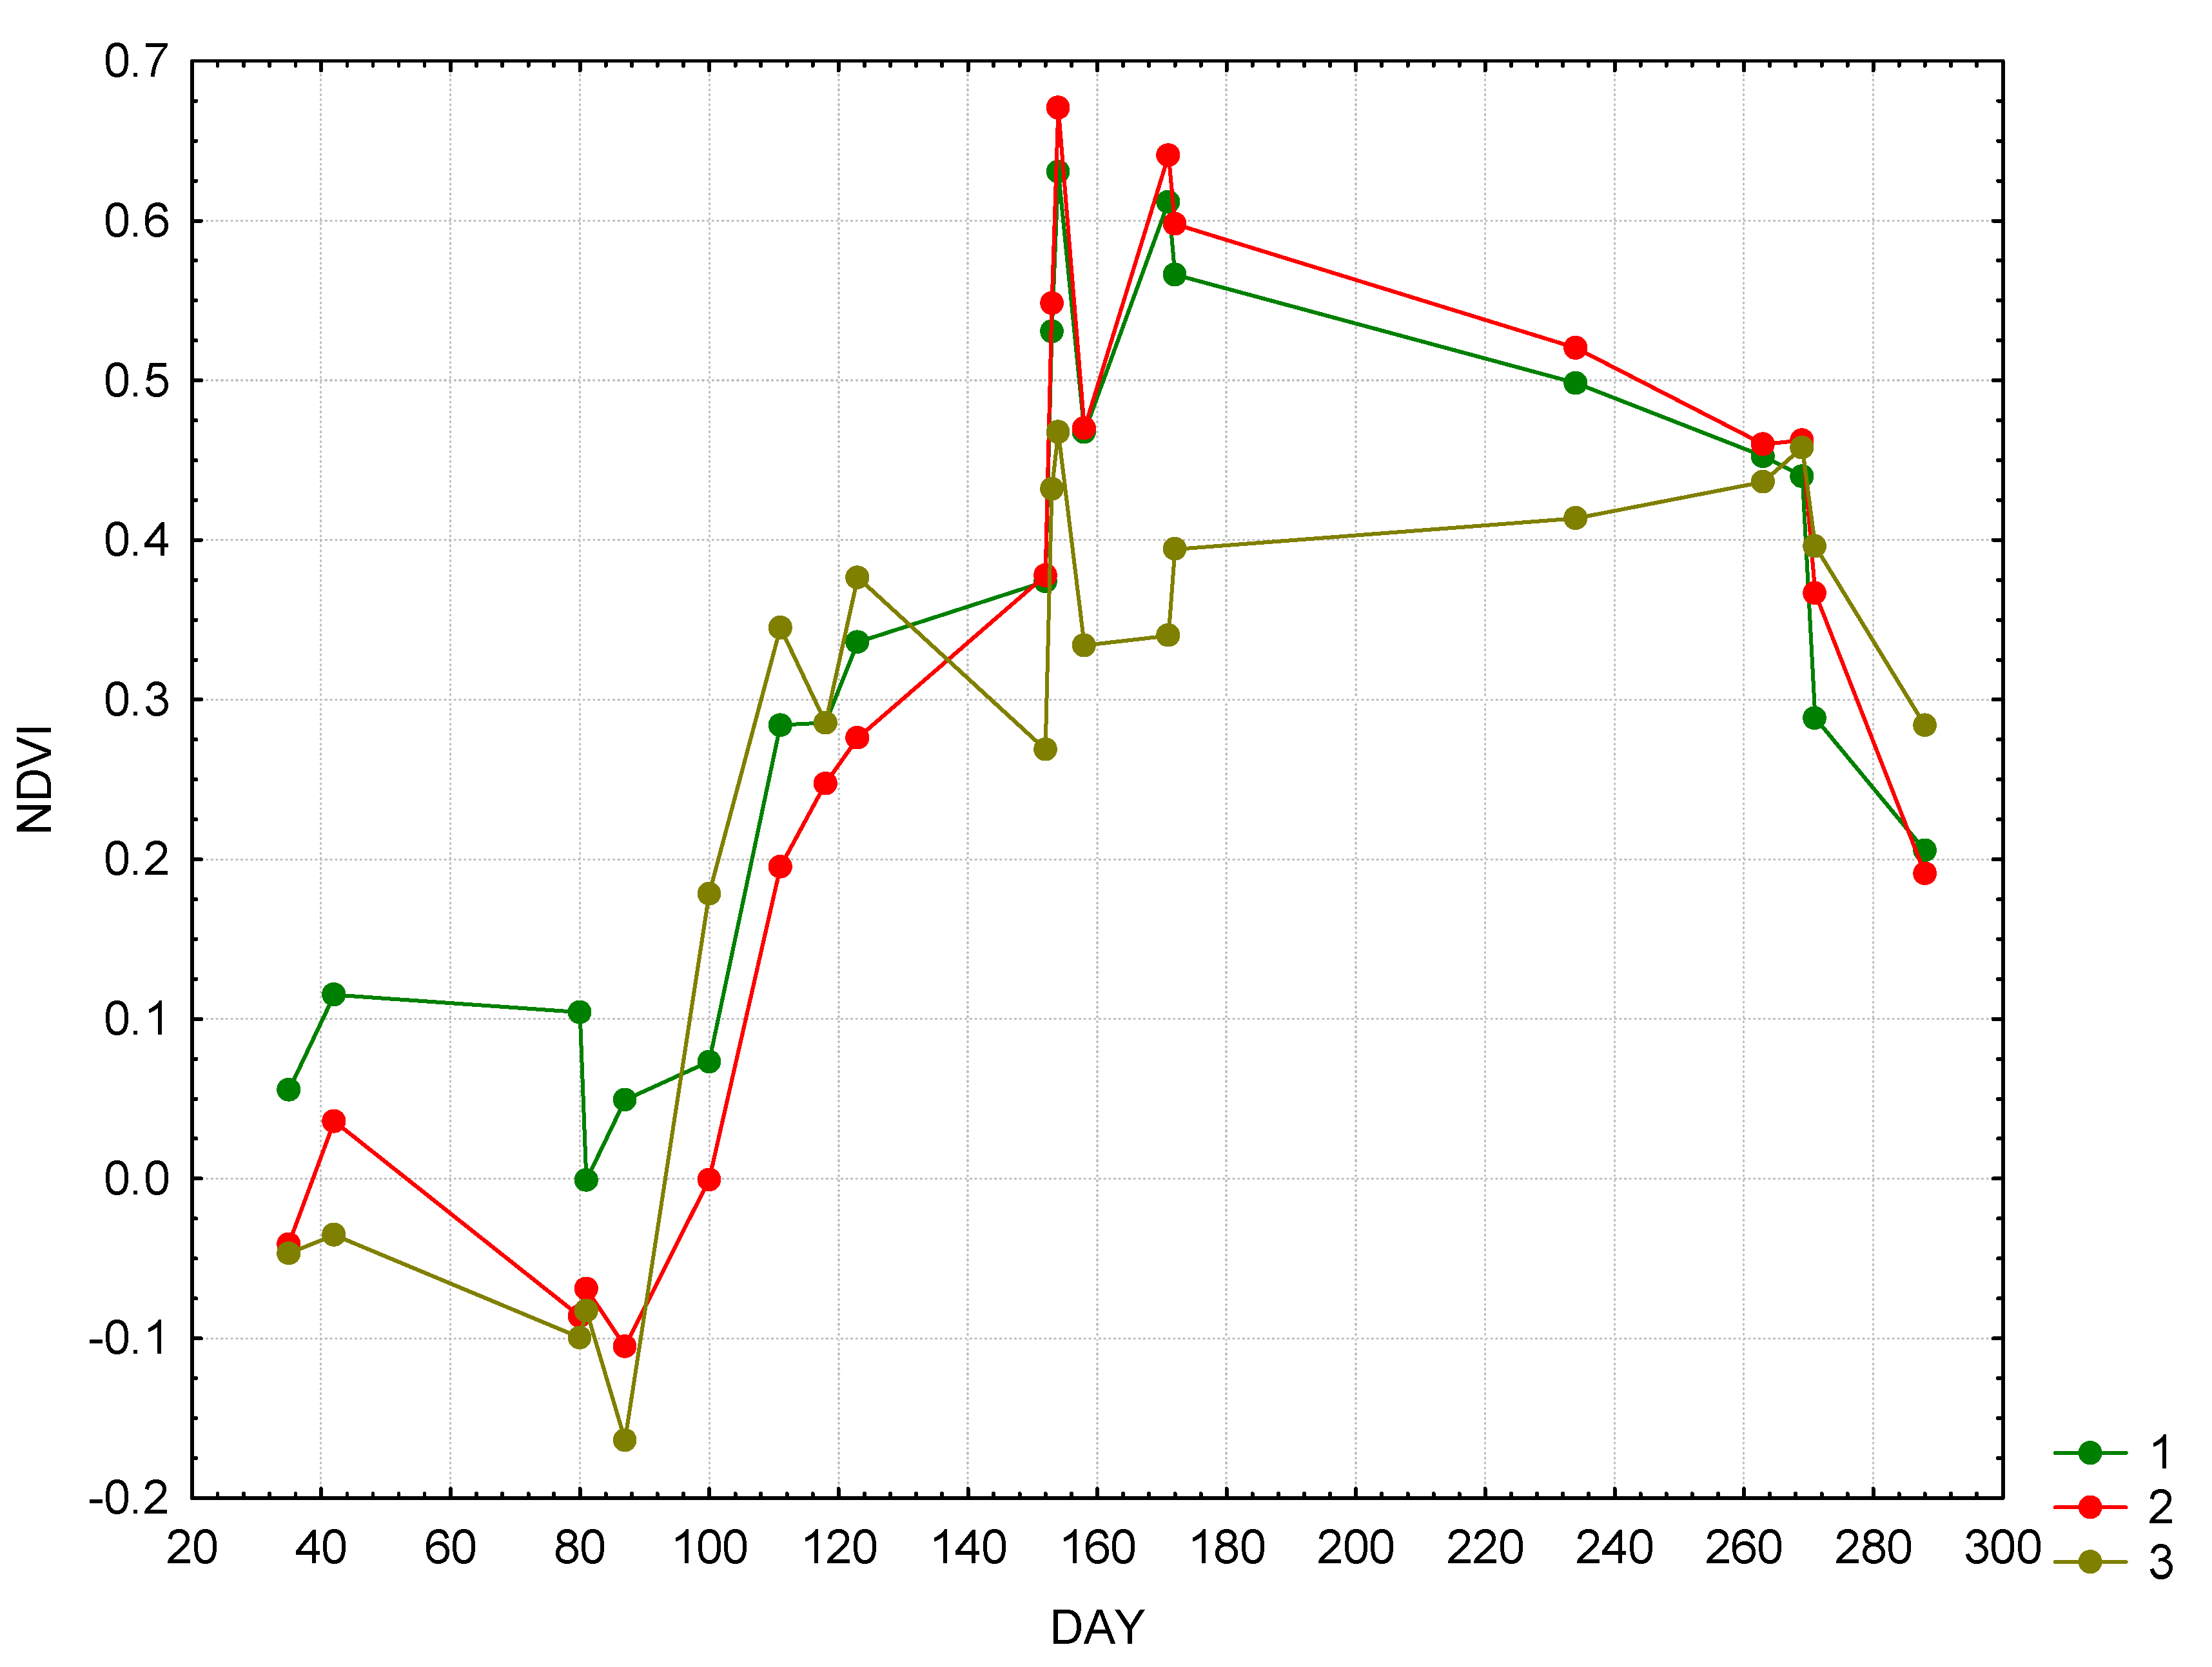
While exergy reflects the useful system work to transport water, NDVI reflects the input of solar radiation in forming the net primary production (NPP).
Figure 4 shows the NDVI annual dynamics and corresponding equations linking NDVI in different communities with thermodynamic parameters are as follows:
where K is Kullbak information increment, S – entropy of reflected solar radiation, and STW—bound energy.
Figure 4.
Seasonal dynamics of NDVI: 1—forests, 2—meadows, 3—bogs.
Figure 4.
Seasonal dynamics of NDVI: 1—forests, 2—meadows, 3—bogs.
The equation’s parameters were determined using the step-wise regression analysis, where all the thermodynamic properties and incoming solar radiation were independent variables. In the forest landscape the NDVI is strongly related to the information increment and bound energy, which in turn is the function of heat flux and entropy. NDVI of meadows is determined by the level of organization and NDVI of bogs—by the information increment, with rather weak correlation.
4. Conclusions
The analysis conducted for this paper leads to the conclusion that the transformation of solar energy by the plant cover occurs via two relatively independent sub-systems. The first subsystem governs the solar energy absorption and its conversion into exergy and heat flux. The second subsystem regulates the spectral structure of absorption and biological productivity. Each vegetation type (determined by a plant life form) generates different thermodynamic systems, which likely have different goal seek functions. Forest is the only community with the goal seek function that maximizes exergy. The goal seek function of meadows maximizes biological productivity, while the goal seek function for bogs is focused on minimization of intra-seasonal variation of biological productivity and exergy (preserving moisture). Bogs are also characterized by the maximum temporal variation in reflected radiation in spectral channels. During the high temperature and dry season the albedo of bogs increases and evapotranspiration (exergy) declines. Following several rains bogs change its absorption spectral structure and increases transpiration. Due to a relatively wide range of the variation in reflected radiation from different channels the entropy and information increment in bogs stays average during the entire vegetative season.
The zonal vegetation for the climate of southern taiga is represented by forests and raised bogs. Meadows typically replace abandoned pastures and arable lands. The first two community types are quite stable despite very different functional strategies. In fact, during the last six thousand years the area occupied by bogs expanded significantly at expense of the area covered by forests.
Meadow communities are more typical for lower latitudes and are less stable, however, it may still take dozens or even hundreds of years (depending of the area of individual meadow patches) before they are replaced with forests.
The current study revealed three principal strategies of thermodynamic organization in plant communities, which are the foundations of their stable functioning. It should be noted that the life form of trees is older (based on the geological time scale) than that of grass vegetation. It is also likely that raised bogs have started to emerge only in the end of Pliocene, when the climate of high and middle latitudes became distinctly seasonal [
20].
Certainly, the analysis of thermodynamic properties of different community types based on the multispectral analysis of reflected solar radiation does not allow for making very fundamental conclusions. However, the study results suggest that the maximization of exergy as the traditional definition of the goal seek function of living matter may not be supported by reality. The application of methodology suggested by Jorgensen and Svirezhev [
3] and based on multispectral and hyper-spectral measurements of thermodynamic properties of different community types across different biomes may lead to the discovery of live systems with different goal seek functions.
As follows from the current study, the parameter that is most easily interpolated (in time and space) is the solar radiation absorption and exergy, which primarily depend on the incoming solar radiation. Such an interpolation could be achieved by studying the relation between these variables in different daytime and cloud conditions. It is more difficult to interpolate measurements from the FluxNet system, biological productivity and other component of carbon balance. Net biological production (NPP) depends on the spectrum of absorbed radiation, while it’s dependence from the total photosynthetically active radiation (PAR) is not so strong. The spectrum of absorbed radiation might in turn be a function of heat and moisture, which is why NPP is described well by the non-linear function of these two variables [
8].


 —amount of radiation captured by the sensor (W/m2µm) in the spectral range v (channel);
 —incoming solar radiation in the range v (channel), W/m2µm;
  —solar constant v (W/m2µm); θ—solar zenith angle (90°—sun elevation), d—distance between the Earth and the sun (astronomical units). Recalculation from heat long-wave channel to energy units results in the heat flux from the studied surface, which could be used to calculate the temperature of that surface. The following formula is used:


 —is the ratio of incoming radiation in the spectral range v and the total incoming radiation;
  —ratio of reflected radiation in the spectral range v to the total reflected radiation.


 —reflected solar radiation in the 4-the channel (0.77–0.90 µm),
  —reflected solar radiation in the 3-d channel (0.63–0.69 µm).
