Discharge Estimation in a Lined Canal Using Information Entropy

Abstract
: This study applies a new method and technology to measure the discharge in a lined canal in Taiwan. An Acoustic Digital Current Meter mounted on a measurement platform is used to measure the velocities over the full cross-section for establishing the measurement method. The proposed method primarily employs Chiu’s Equation which is based on entropy to establish a constant ratio the relation between the maximum and mean velocities in an irrigation canal, and compute the maximum velocity by the observed velocity profile. In consequence, the mean velocity of the lined canal can be rapidly determined by the maximum velocity and the constant ratio. The cross-sectional area of the artificial irrigation canal can be calculated for the water stage. Finally, the discharge in the lined canal can be efficiently determined by the estimated mean velocity and the cross-sectional area. Using the data of discharges and stages collected in the Wan-Dan Canal, the correlation of stage and discharge is also developed for remote real-time monitoring and estimating discharge from the pumping station. Overall, Chiu’s Equation is demonstrated to reliably and accurately measure discharge in a lined canal, and can serve as reference for future calibration for a stage-discharge rating curve.1. Introduction
The increasing deficiency of water resources has gradually attracted worldwide attention. It is also the focus of issues in the related governmental units in Taiwan. Due to the increase in world population and advances brought about by industrialization, there is a heavy demand for water in various uses. Agricultural water is the top demand among the various water uses in Taiwan. Therefore, whenever a water deficit occurs, agricultural water is often diverted to supply the water requirements for other uses. The water deficit problem is getting more and more serious in Taiwan every year. Allocating agricultural water for supporting people’s livelihood and other industries often leads to fallow agricultural fields and disputes over the distribution of water resources among different governmental units. Water resources play a crucial role in the economic development and survival in Taiwan. How to effectively use and allocate existing water resources is an inevitable issue. Under the condition that water resources increase in importance, having possession of water rights has become relatively vital and studies regarding water rights and the water market have been carried out [1,2]. Consequently, accurate control over available water yield at any time is a matter of great urgency.
Irrigation Associations in Taiwan possess partial and important water resources. In order to effectively control the input and output of water, to reasonably allocate water for supplying water demands, and to reduce the probability of water deficit, the Irrigation Associations have to have rapid and accurate access to the water yield data of their irrigation canals. While discharge measurements were always ignored in the past, it has now been taken seriously by the Irrigation Associations due to the need to control water yields in irrigation areas and reasonably allocate the amount of water required. In consideration of sustainable water use in Taiwan, discharge gauging systems have to be installed to effectively monitor and control discharge in irrigation canals. The Wan-Dan First Pumping Station of the Irrigation Association of Pingtung did not have a system for monitoring and measuring discharge for its irrigation canals, hence this study, by carrying out a comprehensive estimate and calibration task, aimed to provide accurate discharge measurements in the irrigation canal of the Wan-Dan First Pumping Station.
In general, empirical equations are often applied to estimate the mean velocity and discharge in streams and canals. The Manning Equation is the most popular one among the empirical equations. However, the Manning Equation is based on the concept of uniform flow, and the roughness coefficient in the equation is not constant, and can be influenced by the factors such as velocity, hydraulic radius [3], and Froude number [4]. Applying the Manning Equation to estimate discharge in a non-uniform open channel flow will cause problems. Furthermore, under the condition of unsteady flow, the flow conditions vary dramatically, and discharge measurements must be completed in a short time.
It is time-consuming and therefore difficult to obtain the required data on the velocity and discharge with the conventional discharge measurement methods. Many methods have been applied for estimation of discharge in irrigation canals. The instruments and facilities to estimate discharge through measuring water stage or head include weirs and flumes [5]. Some methods combine velocity measurement instruments, such as current meters [6], acoustic Doppler profilers [7] with the velocity–area method to measure discharge [8,9]. In order to solve the problem of setting up an automatic monitoring and measuring instrument at a proper location of the Wan-Dan Canal, an Acoustic Digital Current Meter (ADC) is employed to make velocity measurements.
Recently information entropy has been applied in hydraulics [10–13] and in hydrology [14,15]. Combined with Chiu’s Equation, this study conducts discharge measurements for building up a stage–discharge rating curve, which will be convenient for the Wan-Dan First Pumping Station to remotely monitor discharge and further to allocate discharge in irrigation canals. In order to maintain the measurement accuracy, the rating curve has to be verified regularly. If the pumping station is able to rapidly and accurately measure the discharge, manpower and the cost of discharge measurements can be reduced. This study develops an efficient, simple and applicable method to measure discharge in a lined canal. While conducting this study, we first change the discharge in the lined canal to make velocity measurements over the full cross-section by using the ADC for calculating discharges and mean velocities of the cross-section at various water depths. The location of the y-axis where the maximum velocity occurs can also be determined from those observed velocities. Therefore the maximum velocity can be calculated from the velocity profile on the y-axis to determine the constant ratio of mean to maximum velocities, and further to establish a method of discharge measurement in the irrigation canal. With this discharge measurement method: (1) procedures for measuring discharge in lined canals will be established, (2) the time to measure discharge will be shortened, (3) the cost of human resources will be reduced, and (4) accuracy of measuring discharge in lined canals will be improved.
The rest of the paper is organized as follows: the computation algorithm is described in the section entitled “Discharge Computation in a Lined Canal” followed by a discussion of the method of data processing in the section “Measurements and Data Processing”. Finally, the data analysis of the Wan-Dan Canal is covered in “Results and Discussion”.
2. Materials and Methods
2.1. Discharge Computation in a Lined Canal
The discharge measurement method applied in this study can be used in any kind of flow conditions. It has been verified that the purposed method can be applied to measure discharge during floods [16], and in estuaries [17]. It has also been implemented in several places including Taiwan [18], US [19], Italy [20], and Algeria [21]. The method employs the constant ratio of mean to maximum velocities for efficiently estimating discharge. The method uses the velocity-area method of streamflow measurement [22]:
in which Qest = estimated discharge; ūest = estimated mean velocity of the cross-section; and Aest = cross-sectional area of the canal.
Chiu’s Equation [23,24], from which the method of discharge measurement can be derived, is able to fully describe and precisely simulate the maximum velocity of water flow occurring below or on the water surface [23]. It is given by:
where umax = maximum velocity in a given cross-section; u = velocity at ξ; ξ = variable with which u increases [24]; M = parameter of the probability distribution, when M increases, umax occurs on the water surface, in open channel flows, when M is less than 5.6, umax occurs below the water surface [24]; and ξmax = maximum value of ξ at which umax occurs. The ξ curves are the isovels; and points on an isovel have the same value of ξ. The ξ value along the y-axis is:
in which y = distance from the channel bed; D = water depth at the y-axis; and h = parameter for indicating the location of maximum velocity. If umax occurs below the water surface, h is the actual depth of umax below the surface. If umax occurs on the water surface, h < 0. Based on the probabilistic way of thinking, the probability of velocity being less than or equal to u is ξ/ξmax if the velocity is randomly sampled in a channel section. Thus:
in which p(u) = density function of u.
The information entropy [25] is defined as:
Mathematically p(u) must satisfy the following two conditions:
in which ū = mean velocity of cross section. If the entropy is maximized subject to Equations (6) and (7) by the method of Lagrange multipliers, the relation between mean and maximum velocities will be:
in which Φ is the constant ratio of ūobs to umax for a given cross-section; and ūobs = observed mean velocity as:
in which Qobs = observed discharge; and Aobs = observed cross-sectional area.
It is obvious that umax usually occurs in the center of a cross section if the channel is straight and the section has a symmetrical shape, but this does not happen in a natural channel. Fortunately the shape of irrigation canals is usually symmetrical and the course of the canal is usually straight upstream and downstream from the gauge site, thus it will not be too difficult to find the location of the y-axis in an irrigation canal by drawing a set of isovels.
In accordance with the method described above, this study first conducts discharge measurements by using the ADC, estimates the maximum velocity on the y-axis, and then obtains the mean velocity, which is determined by:
Because most of irrigation canals in Taiwan are rectangular in shape and built with reinforced concrete, the cross-sectional area can be estimated as:
in which W = width of the canal;. Finally, the discharge in the irrigation canal can be estimated by Equation (1) or Qest = ΦumaxWD.
After all of the velocity and water depth measurements are made, the observed discharge can be calculated by the mean-section method. By applying mean-section method, segment discharges are computed between successive verticals. The velocities and depths for successive verticals are each averaged as the mean velocity and depth of the segment. Therefore the discharge of segment is:
in which ai = area of the segment i; di = depth of water at the observed vertical i; and bi = distance from the reference point to the observed verticals i; qi = discharge of the segment i; v̄i = mean velocity at the observed vertical i. Thus the observed cross-sectional area and discharge are derived by:
The determination of mean velocity at a vertical will affect the accuracy of the discharge measurement. The vertical velocity curve method [26] is used to precisely estimate the mean velocity on each vertical. Instead of measuring the area between the curve and the ordinate axis with a planimeter and dividing the area by the length of the ordinate axis, Equation (2) is used to simulate the velocity distribution for determining the mean velocity of the vertical. Based on a series of velocity observations at points well distributed between the water surface and the stream bed, the parameters in Equation (2) can be determined with non-linear regression method. Therefore the mean velocity on the vertical is:
Ideally, a rating curve for an artificial irrigation canal can describe a unique functional relationship between water stage and discharge. Therefore the discharge can be estimated by using the stage–discharge rating curve, if the rating curve exists. After sufficient measurements of discharge and water stage suitably distributed throughout the range of water depth are made, a stage–discharge rating curve can be developed for monitoring the discharge in real-time and continuously. Usually the simple stage–discharge curve can be used in an irrigation canal:
in which Qr = discharge estimated by the stage-discharge rating curve; G = water stage; e, p and N = constants.
2.2. Measurements and Data Processing
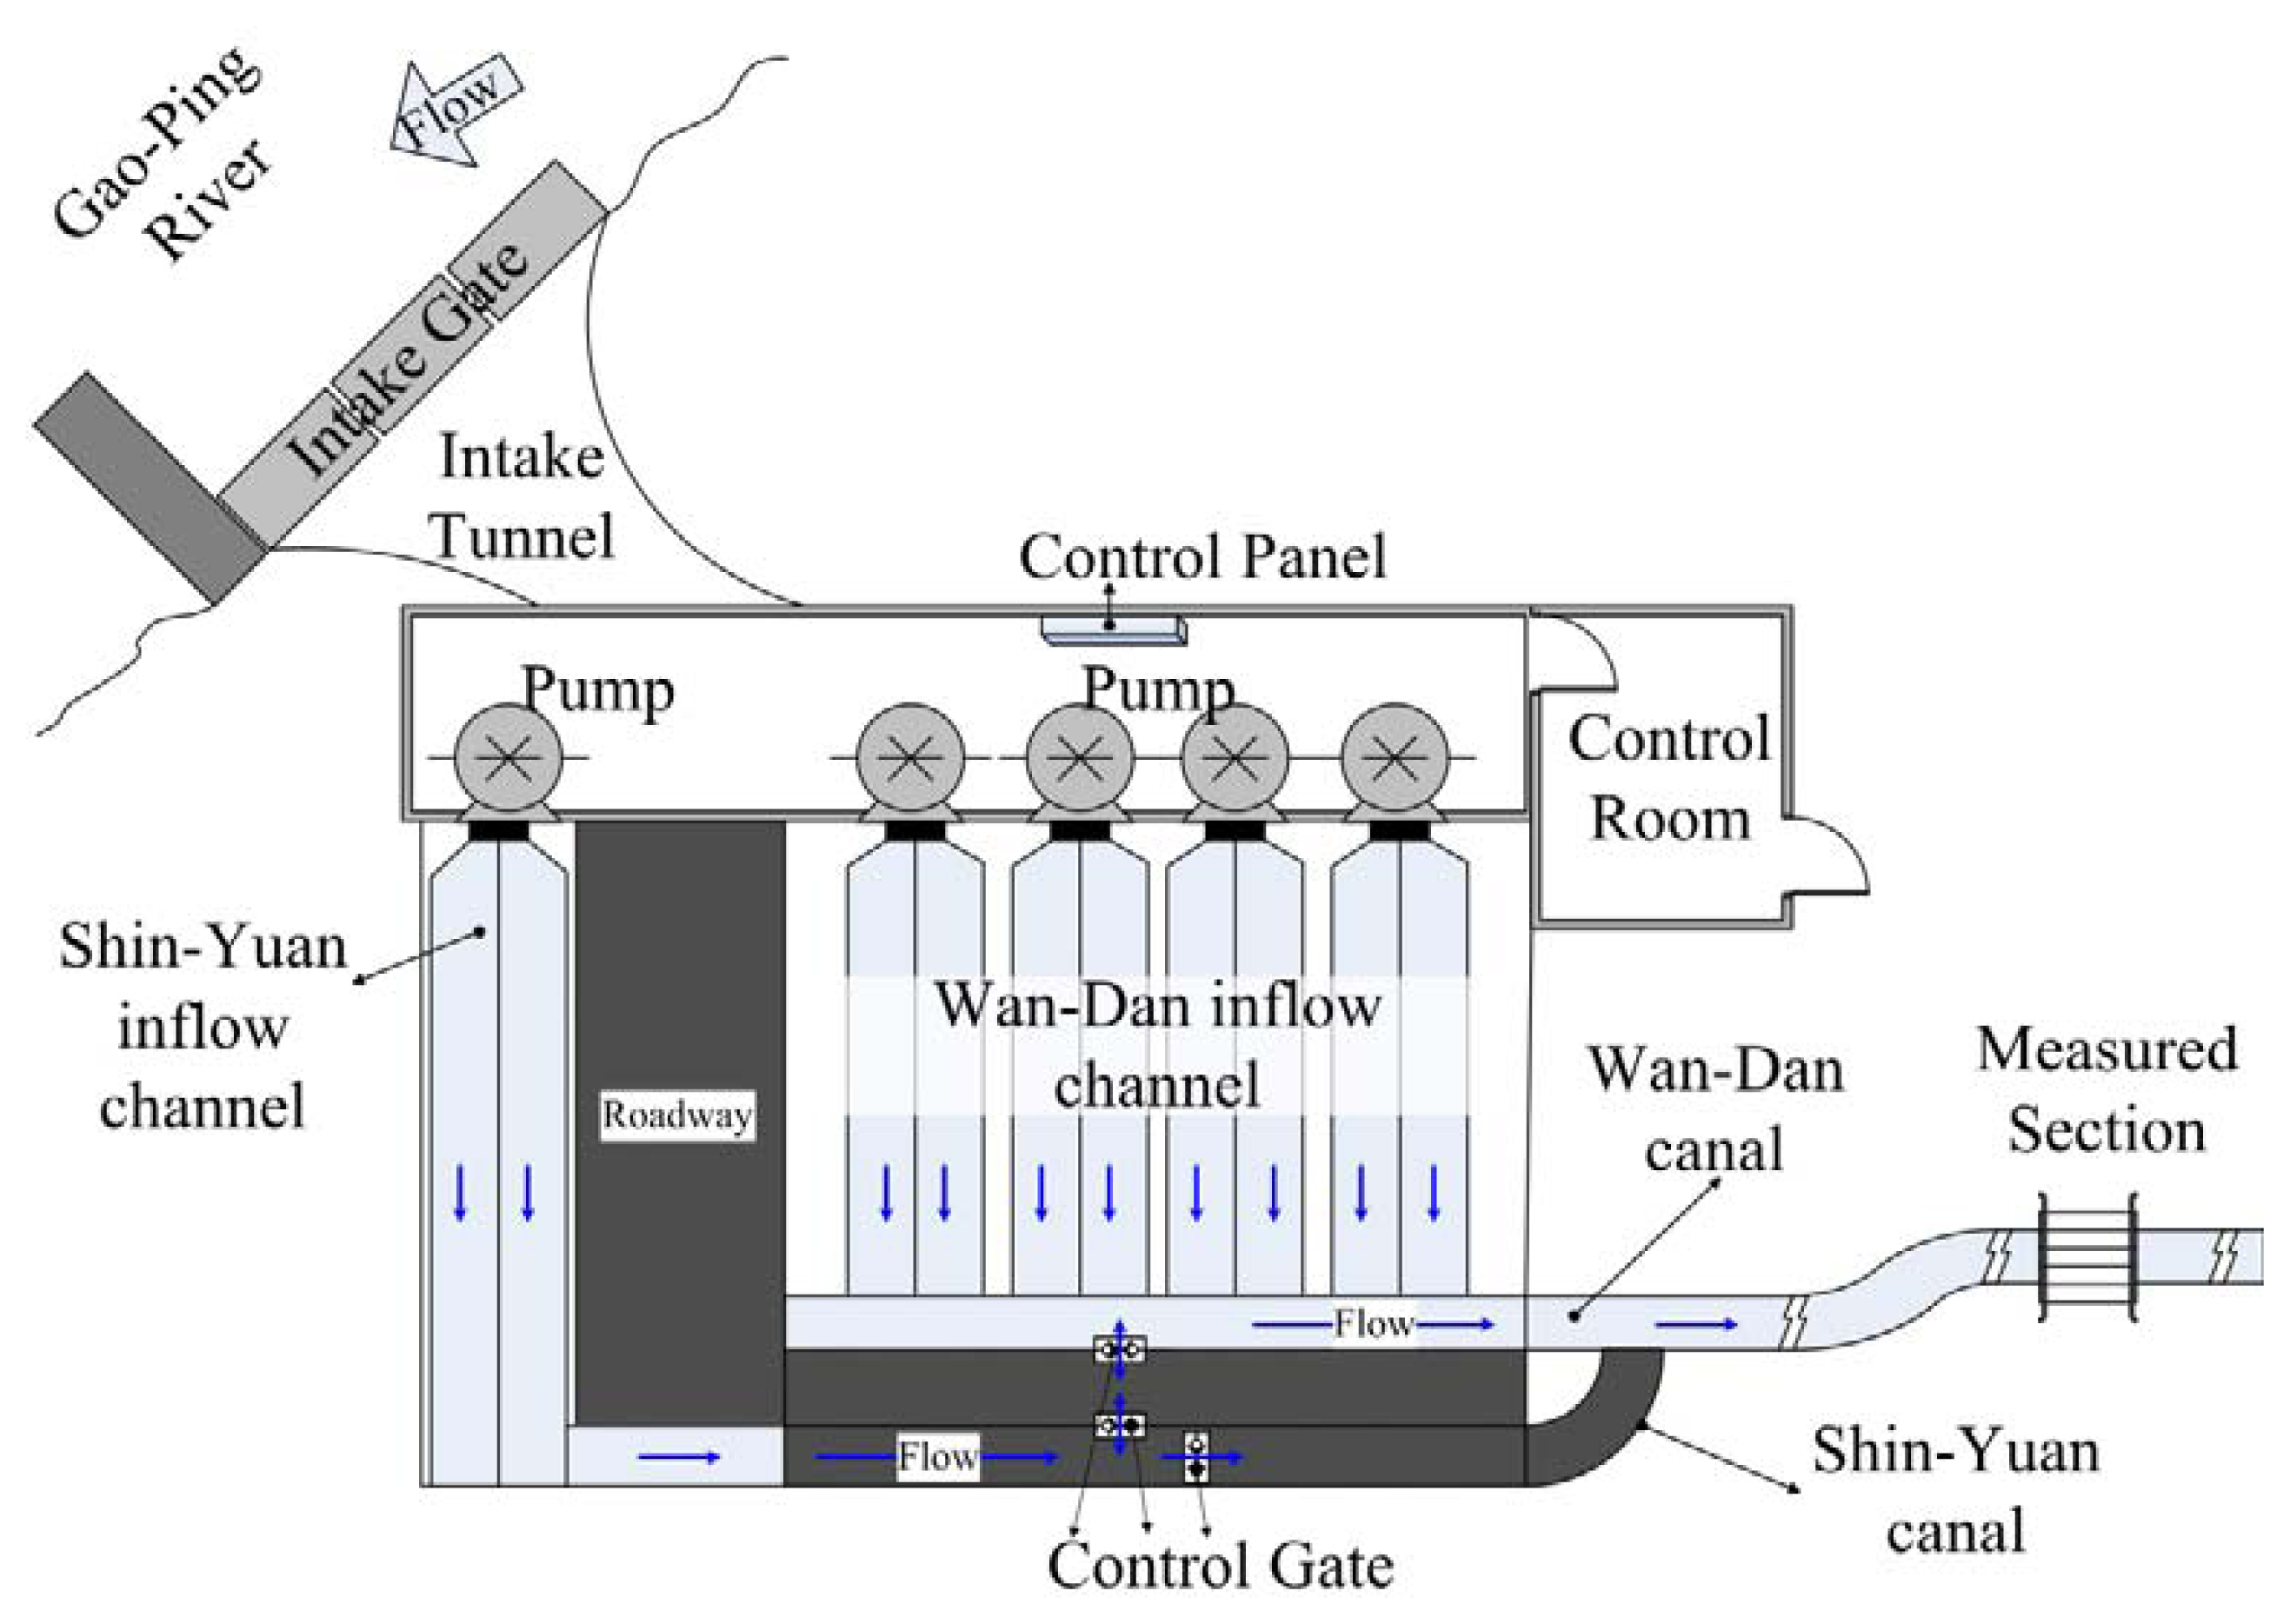
There are five pumps at the Wan-Dan Fist Pumping Station; four of them supply water from the Ga-Ping River to the Wan-Dan Canal, as shown in Figure 1. The Wan-Dan Canal flows away from the pumping station in an S shape. Inside the pumping station, the flow is very unstable and the depth at the weir crest is similar so it is difficult to accurately measure discharge by means of the weir at the pumping station.
A gauge system is installed in the Wan-Dan Canal, approximately 150 m away from the weir. The course of the canal is straight for more than 100 m upstream and downstream from the gauge site. Owing to the concrete lined irrigation canal, the channel bed is stable and free of growth and decay of aquatic matter. Flow is steady and fairly uniformly established across the entire width of canal at the gauge site; it is an ideal location for measuring discharge.
The instrument employed in the study is an ADC, which is a highly accurate measurement instrument and is primarily used to measure velocity in open channels, such as rivers and streams. The ADC measures the velocity of water using a physical principle called the Doppler effect [27,28]. The ADC consists of two transducers that operate independently of each other. Each transducer sends out a beam of acoustic waves at a fixed frequency and receives the echoes returning from sound scatters in the remote sample volume. The remote sample volume with diameter 1 cm is located 10 cm in front of the sensor. ADC is also installed with an absolute piezoresistive pressure cell, and is able to provide the accurate location of the measuring position. Capable of measuring velocities between −0.2 and 2.4 m/s, the accuracy of ADC is 1% of measured velocity.
In order to remotely monitor the discharge of the canal, a float-type gauge and a staff gauge are installed at the gauge site. The float-type gauge is equipped with an LCD indicating water depth and battery status. For safety, the gauge with default resolution in mm is protected in a 12.7 cm pipe for continuously and uninterruptedly measuring the water stage. Not only is the data stored in-situ, but also is sent to the control room of the Wan-Dan First Pumping Station via a RS-485 connection.
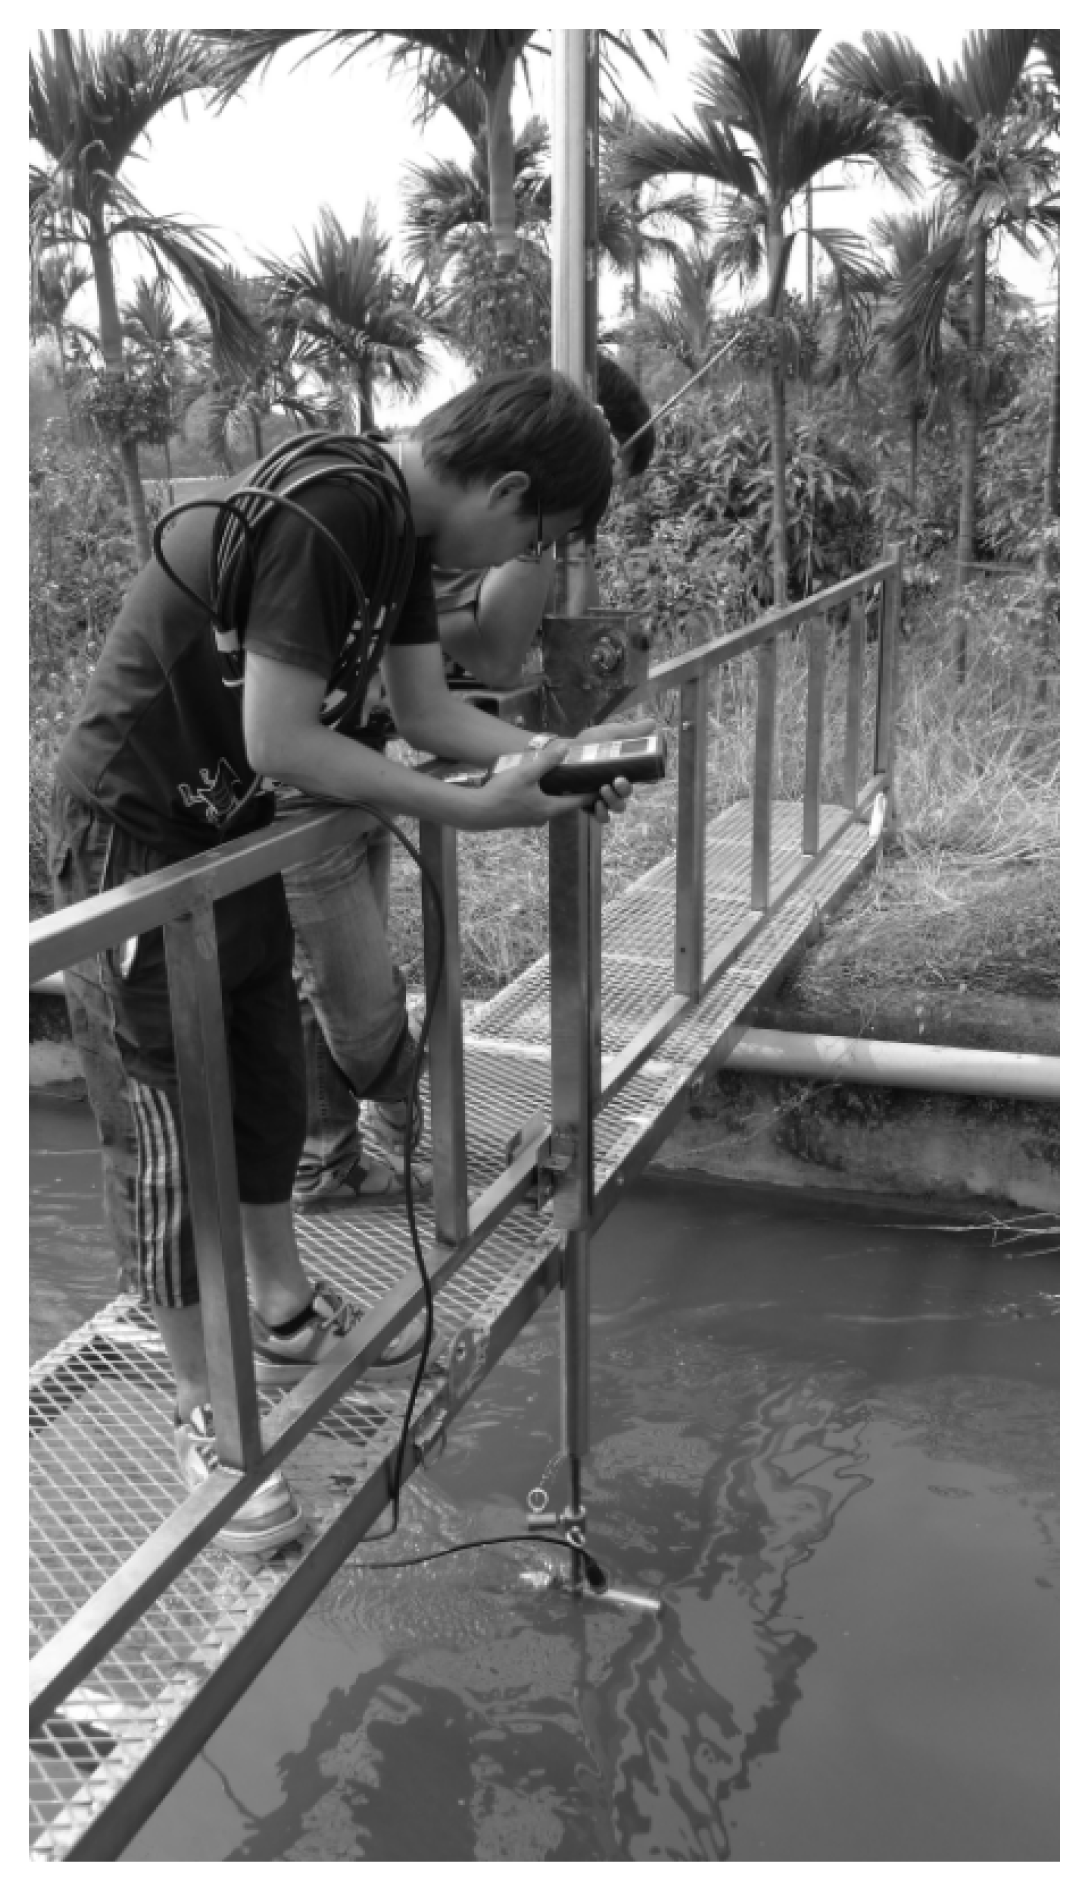
Furthermore, in order to measure velocities over the full cross-section of the canal, we design a measurement platform, on which operators can carry out the task and the facilities can be installed, such as the velocity instrument. The platform, which can be easily and quickly assembled and dismantled, is applicable to be used in irrigation canals. Also, after the platform is assembled, it can be lifted and moved easily to the gauge site by two men or a crane. A sounding rod with a gauge is connected with the ADC, and they are installed upon the sliding rail of the platform. By moving up and down or to the left and the right on the sliding rail, the ADC can be easily moved to the velocity measuring positions. Figure 2 shows the experimental platform installation and how the measurements were conducted.
The Wan-Dan Canal is a 3 m wide rectangular channel built with reinforced concrete. To develop a reliable and accurate discharge measurement method for the Wan-Dan Canal, a large amount of data on velocities over the full cross-section is collected. It is conventional to make the nine verticals equidistant for measuring the velocity profiles. Both of the verticals 1 and 2 are 0.2 m away from the vertical sides, and the remaining verticals are 0.325 m apart. Velocity observations in the vertical depend on the water depth. Ten velocity measurements are made equidistantly from the water surface to the channel bottom at each vertical when the water depth is higher than 0.5 m, but otherwise five velocity measurements are measured equidistantly.
While this study is carried out, flow is controlled by the pumps in order to maintain the stability of discharge and stage at the gauge site. After the first discharge measurement is completed, flow in the canal is adjusted for the next measurement. The task is conducted repeatedly till the data of discharge and stage is adequate to develop a stable stage–discharge relationship. Aiming to develop a reliable rating curve, 14 runs of discharge measurement were carried out over the range of water stage variation from 14 March to 16 March 2011, as shown in Table 1.
3. Results and Discussion
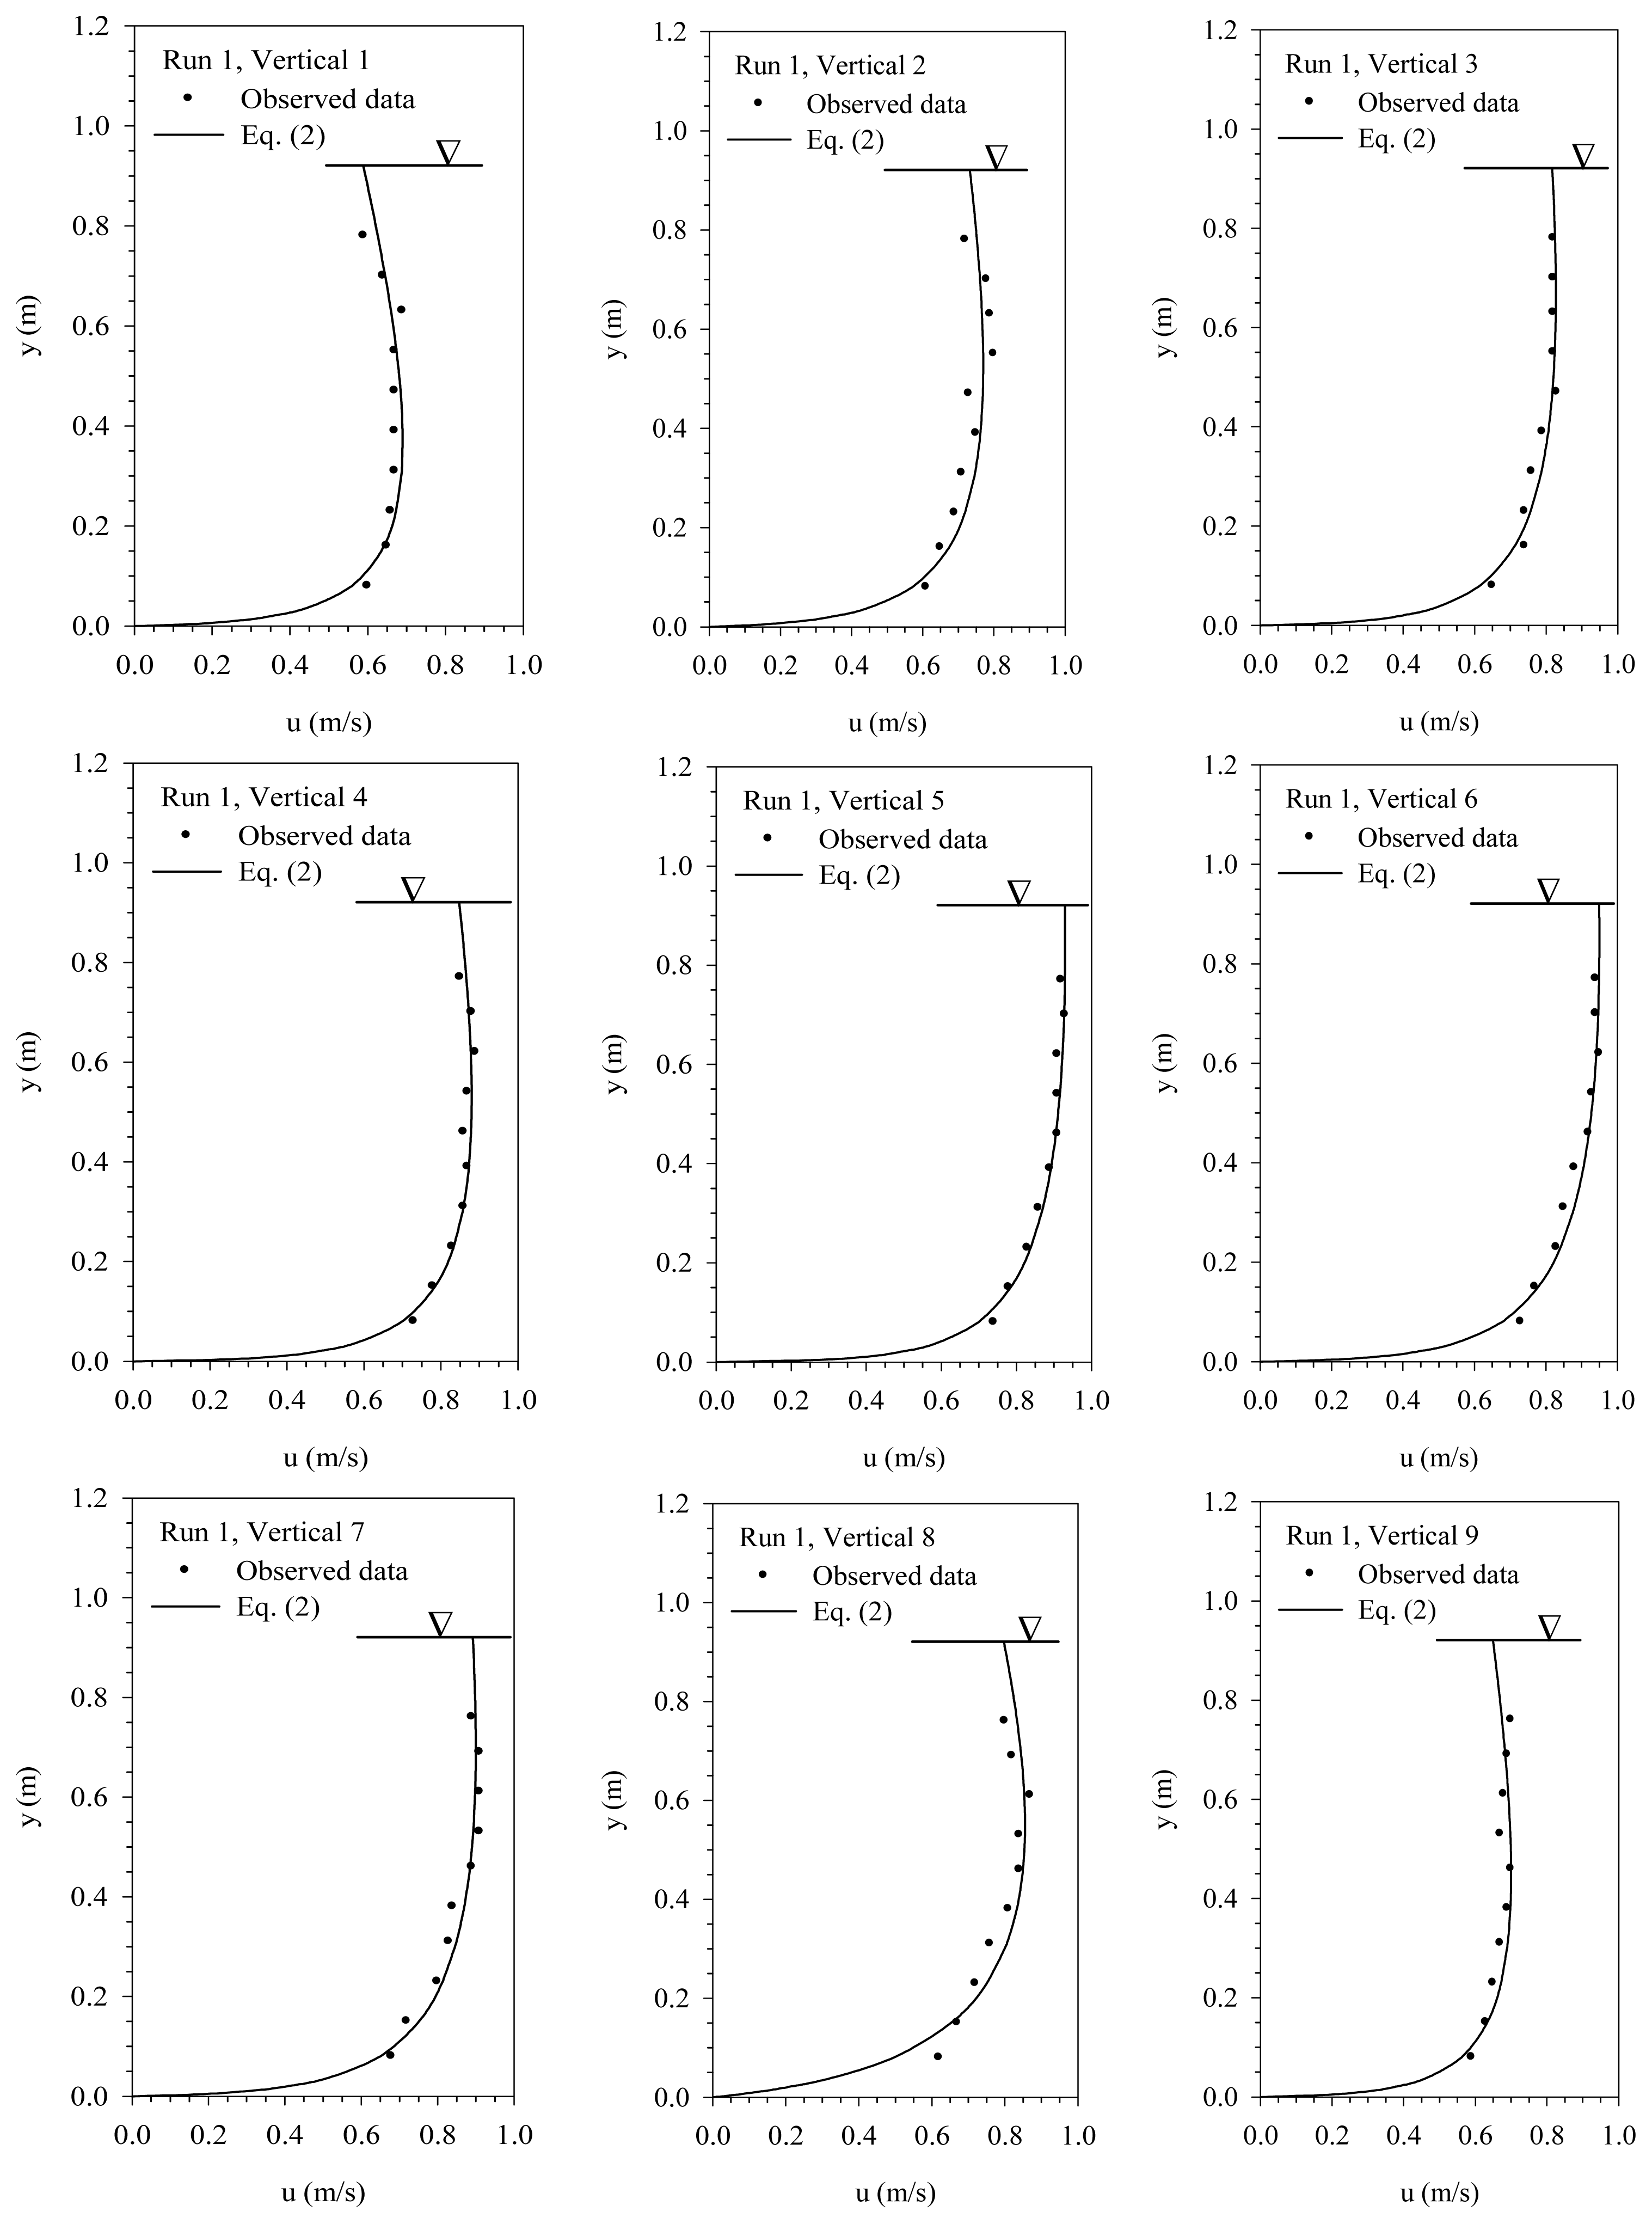
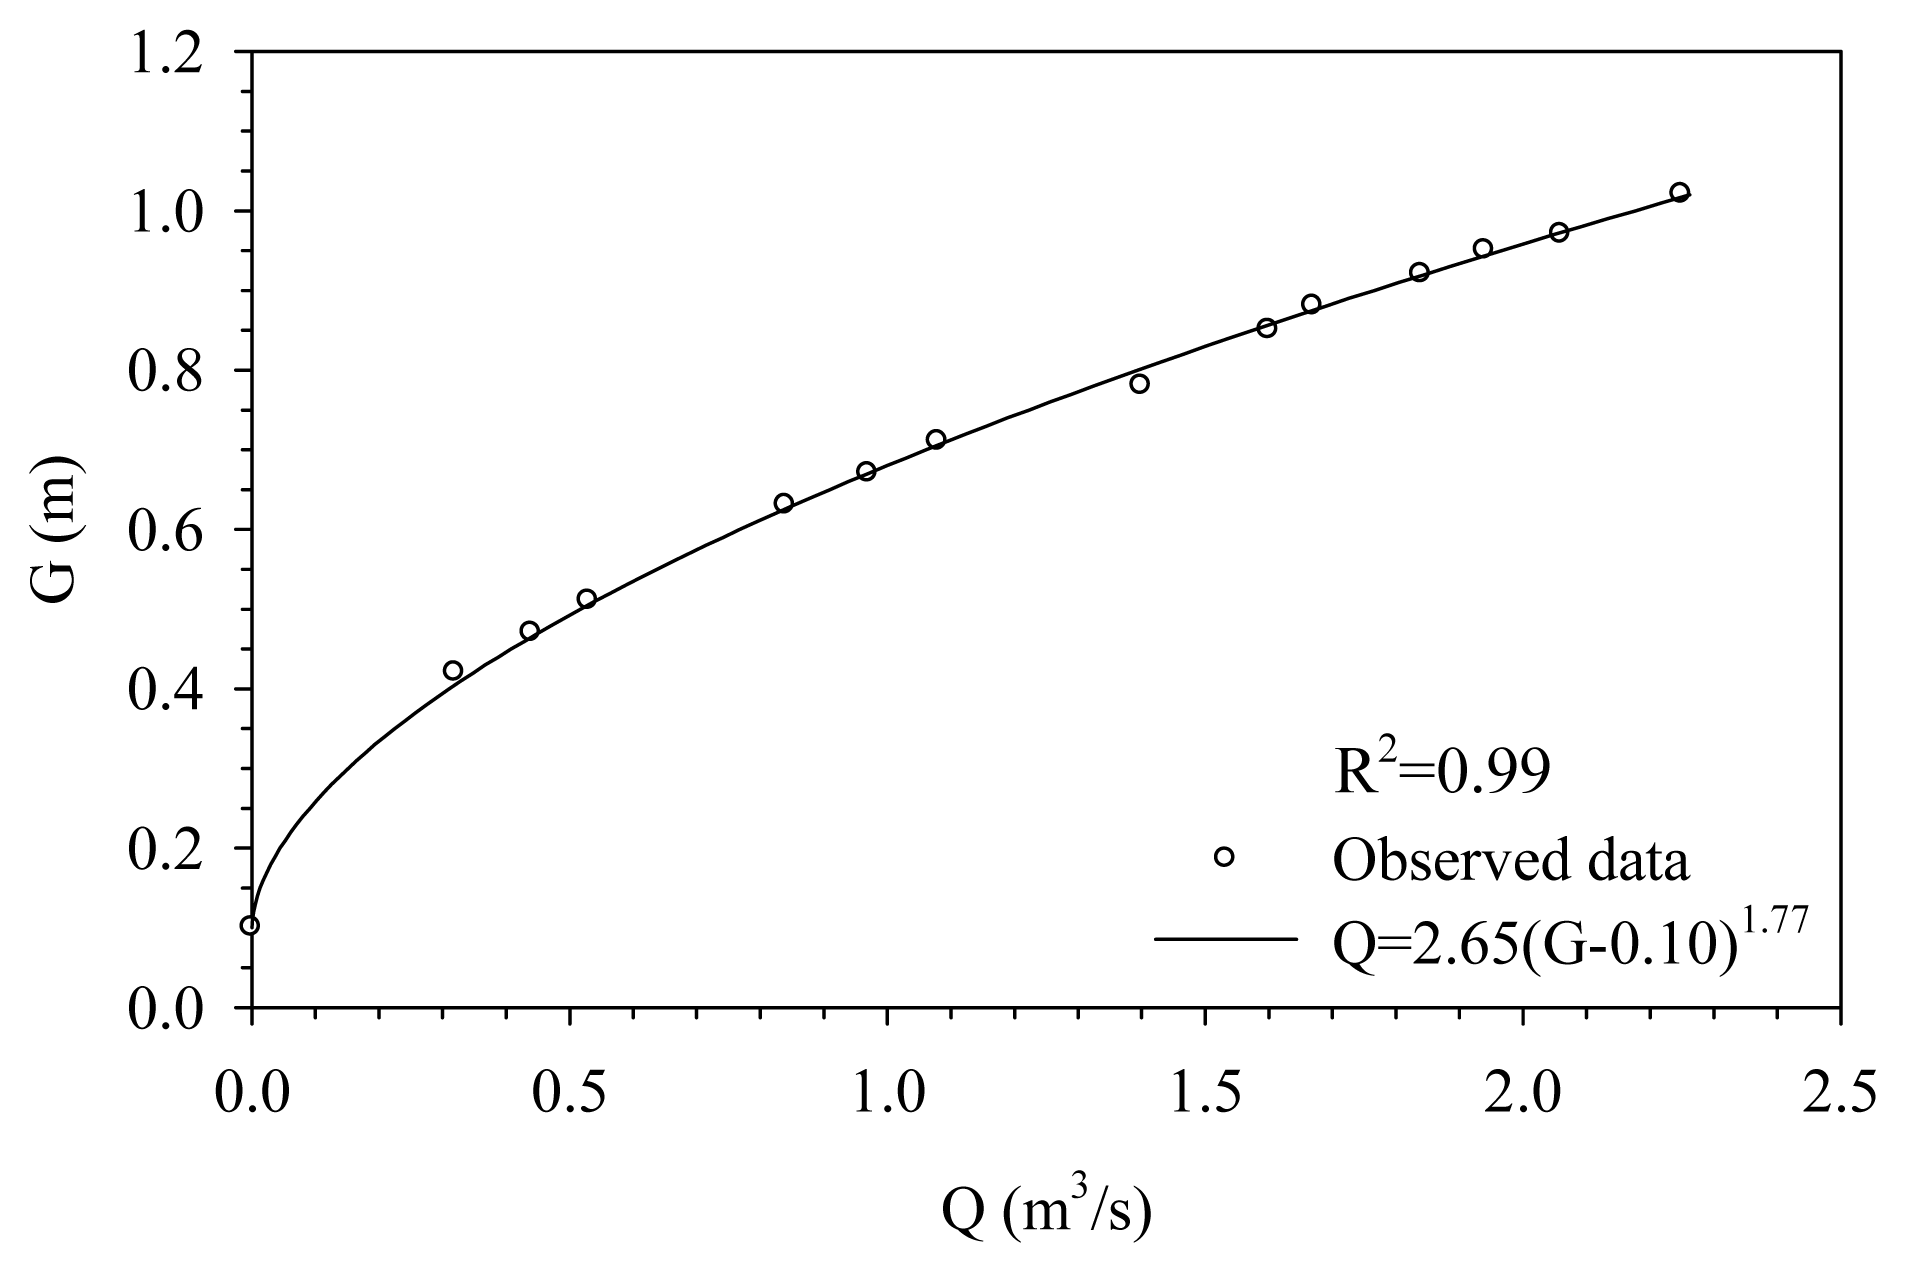
Figure 3 shows all observed velocity profiles of RUN 1 made by the ADC and the estimated velocity profiles simulated by employing Equation (2). As expected, the observed velocity profiles are very close to the simulated ones. It also shows the capability of Chiu’s Equation to compute the maximum velocity and simulate the velocity profile in the irrigation canal. The correlation of water stage and discharge is shown in Figure 4. The simple stage–discharge relation for the permanent control can be expressed as Q = 2.65(G − 0.10)1.77. The correlation coefficient which is a measure of relationship between two random variables is up to 0.996. The rating curve throughout the entire range of water stage is the basis for remotely real-time monitoring discharge from the Wan-Dan First Pumping Station.
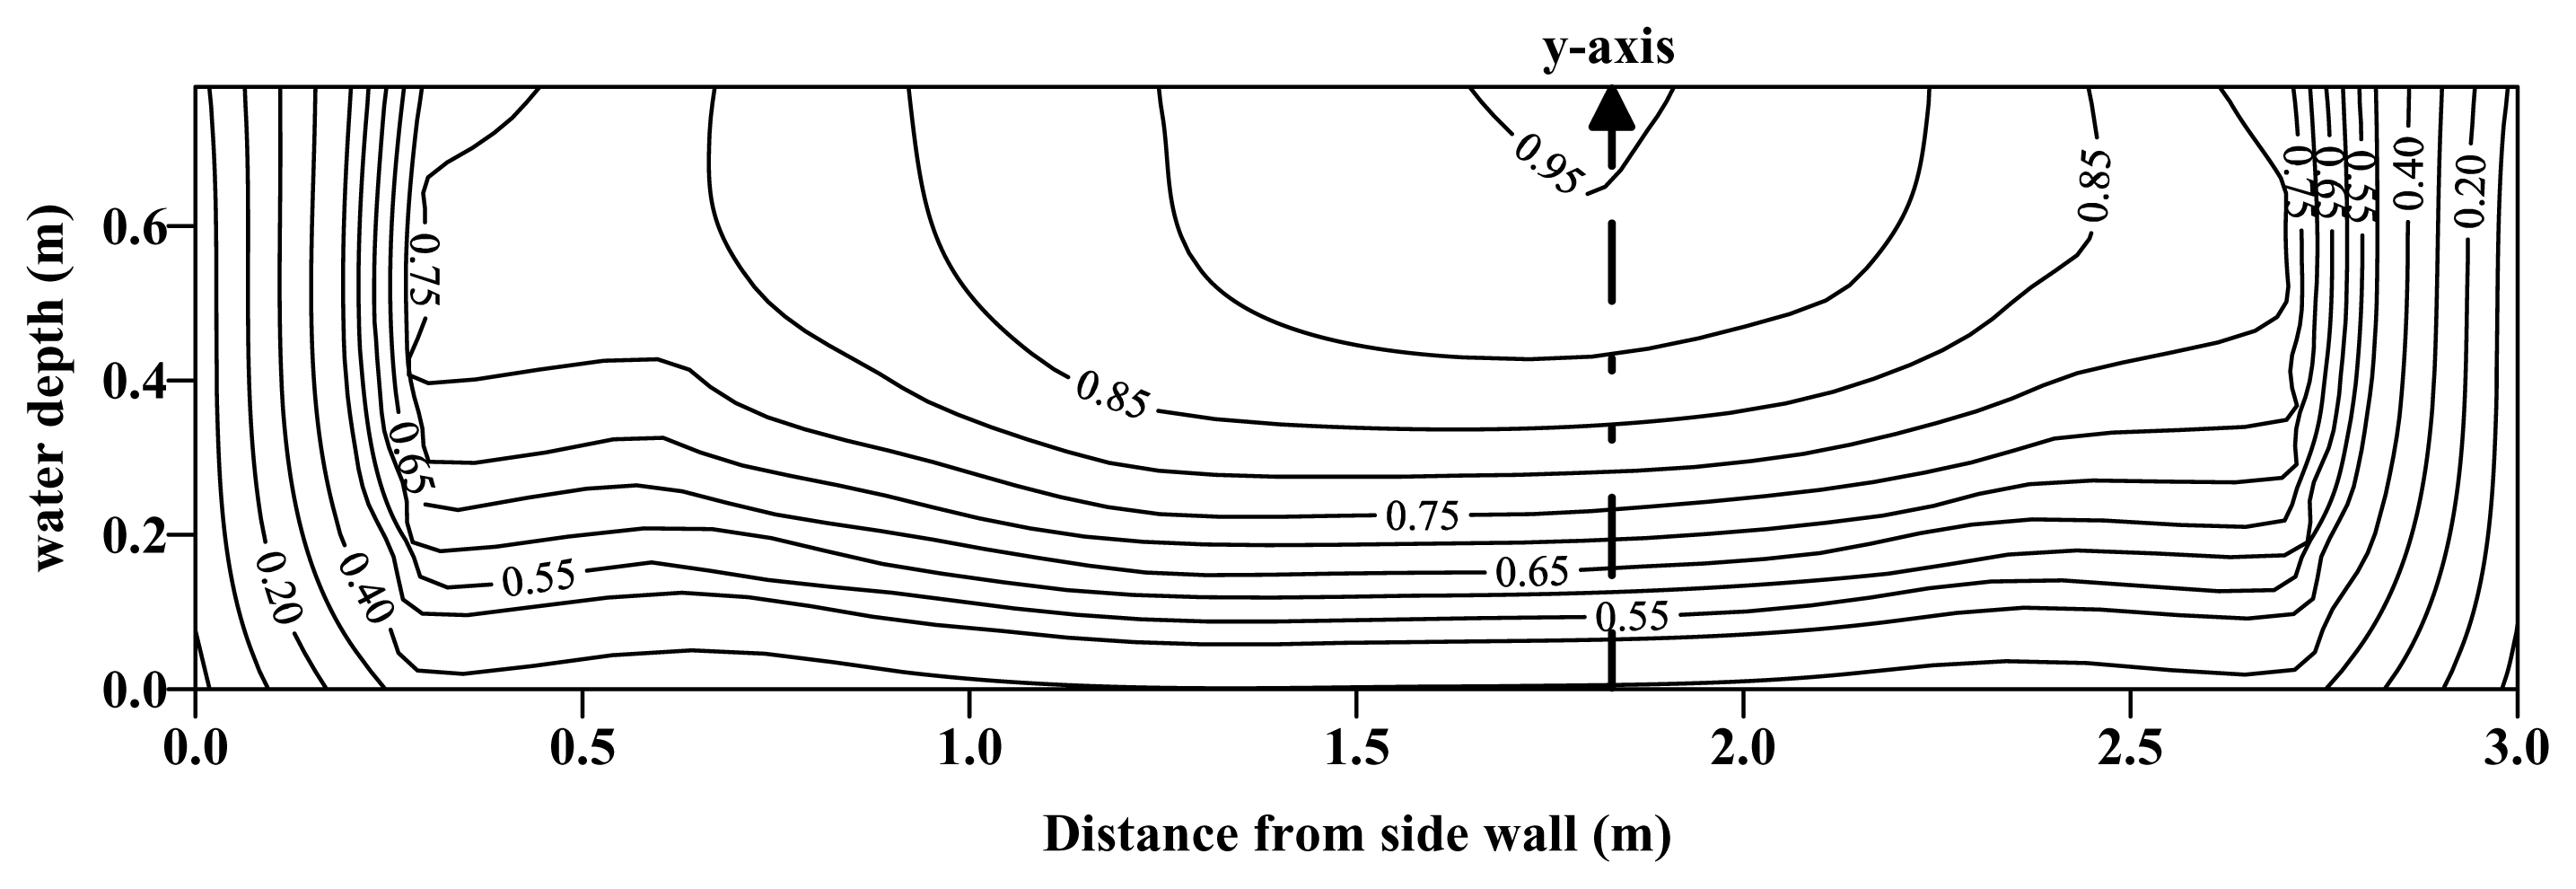
Figure 5 shows the isovels of RUN 1 in the Wan-Dan Canal. Like the velocity profiles in most open channels with solid boundaries, in which the maximum velocity occurs below the water surface a distance of 0.05–0.25 m of the depth [29], the maximum velocity of the canal occurs very close to the water surface. It also shows that the vertical 6 located at the center veering to the right of the canal is the y-axis. The figure also shows the velocities on the verticals closing to both vertical sides do not change too much from the channel bed to the water surface. However there is an obvious change in velocity on the y-axis.
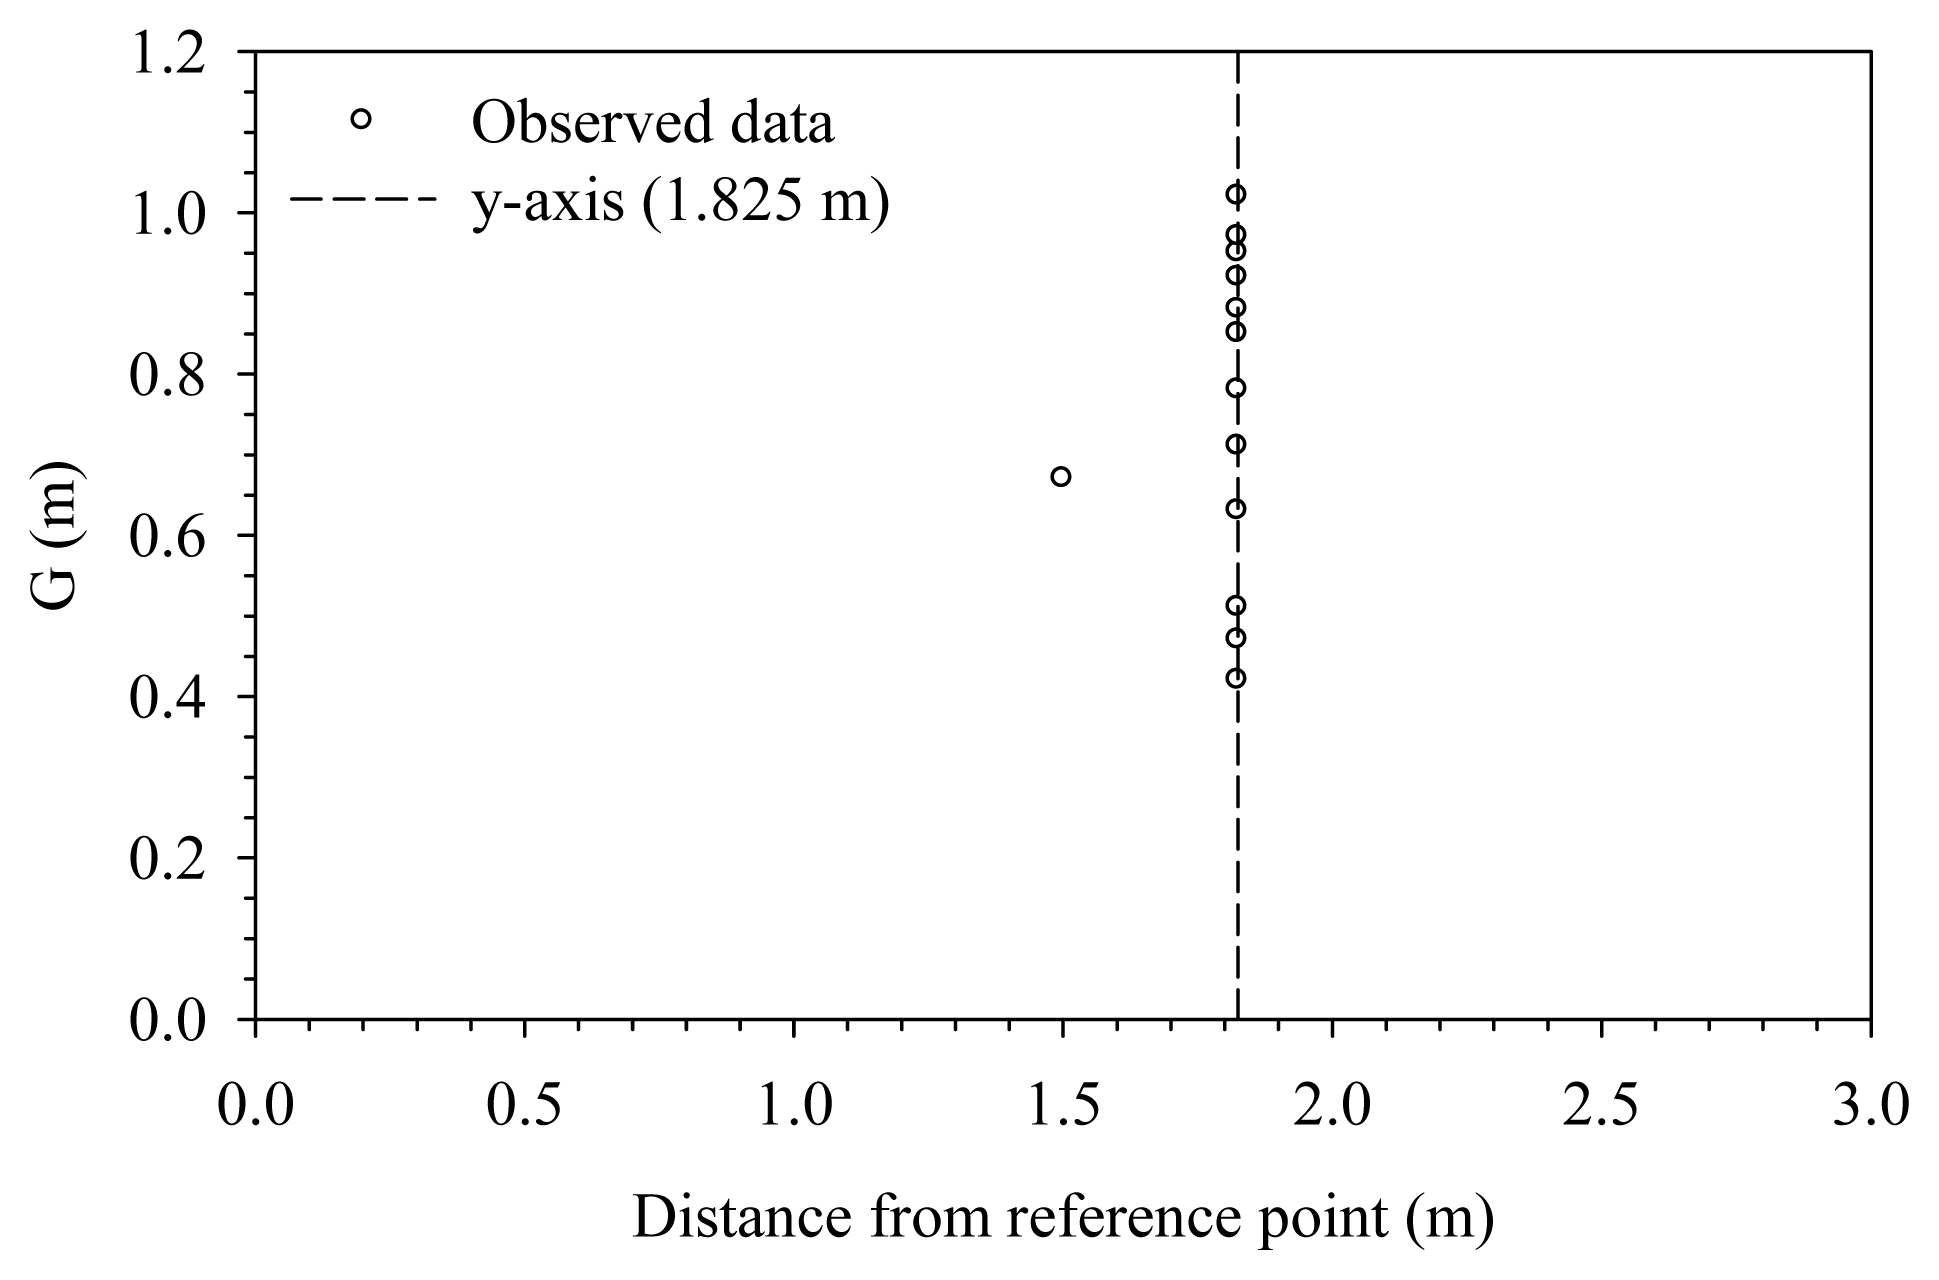
With the isovels as shown Figure 5, created from the 13 measurement runs, the analysis indicates that only one maximum velocity occurs slightly away from the vertical 6 and that the other 12 maximum velocities all occur on the vertical 6, as manifested in Figure 6. The result illustrates the stability of the y-axis in the Wan-Dan Canal and indicates that the y-axis is not under the influence of factors such as water stage and discharge, i.e. the location of the y-axis is fairly stable [17,19,30,31]. Therefore the maximum velocity of the flow area can be determined from velocity samples on the y-axis.
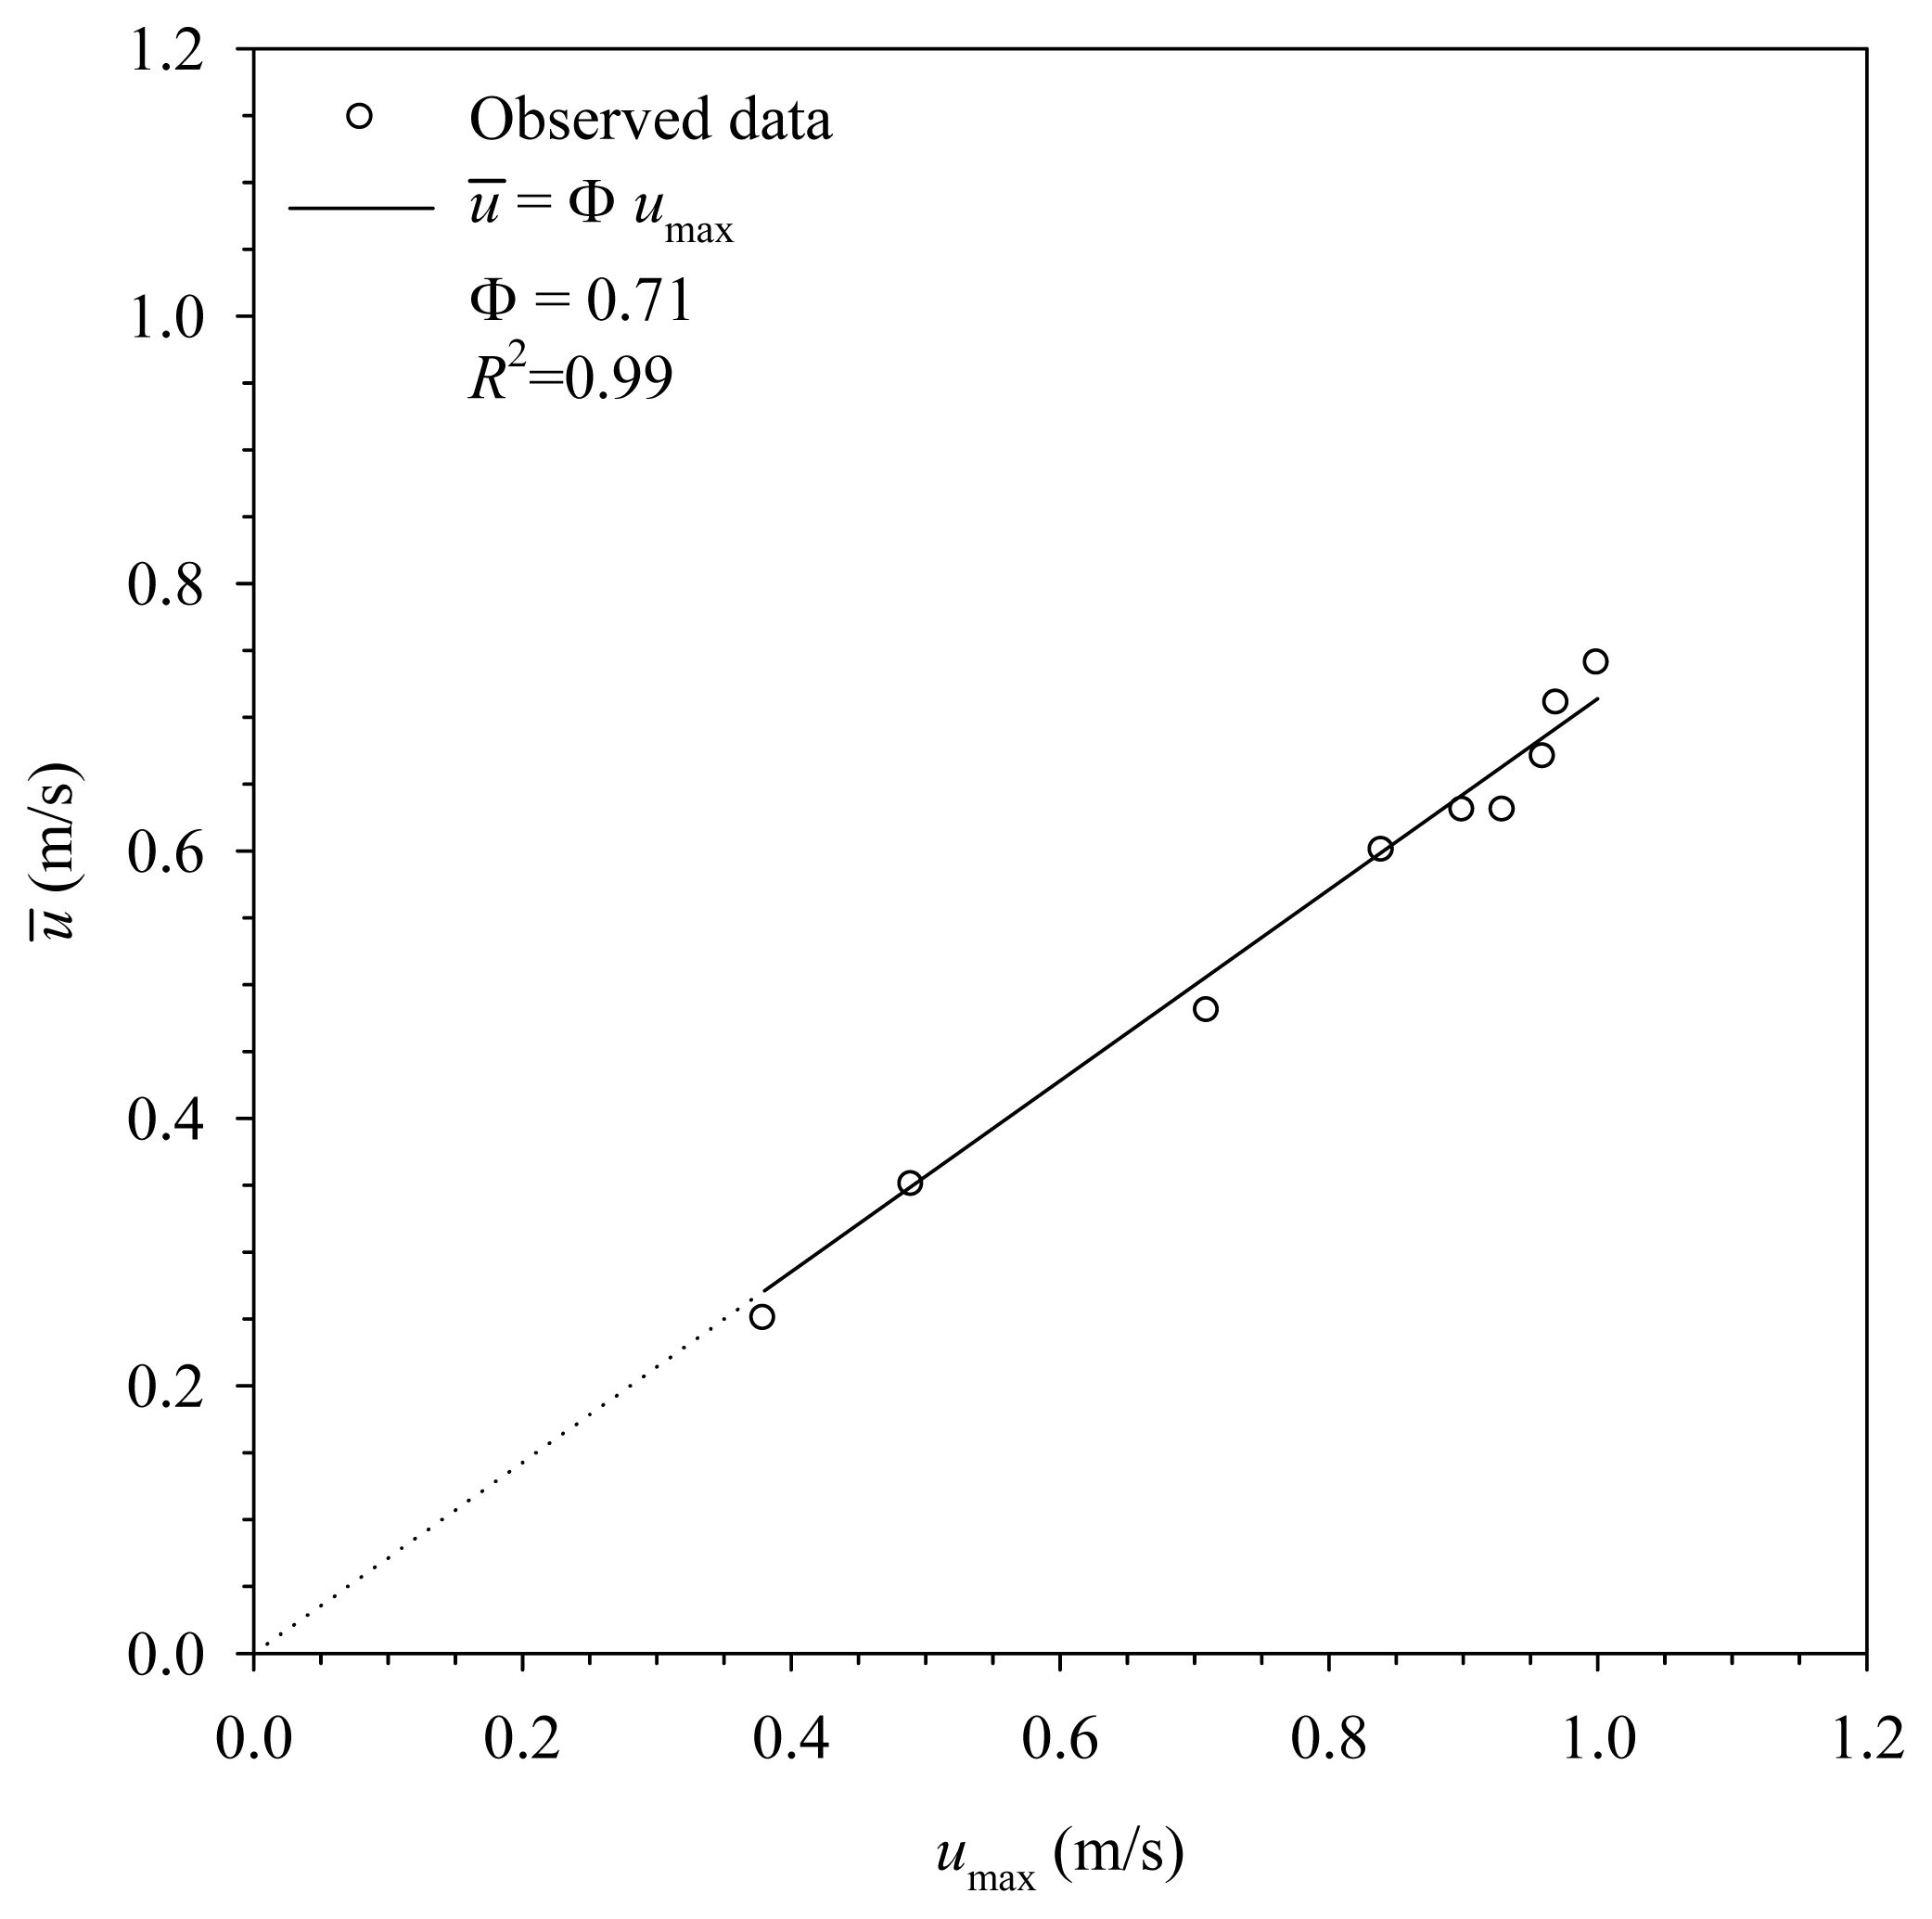
The observed data set is randomly split into two independent subsets: the calibration, and validation subsets. The calibration subset with nine sets of data is used for parameter estimation. The validation subset, which consists of four sets of data, is devoted to show the performance of the discharge estimation model. In the calibration phase, a linear relationship passing through origin with a large correlation coefficient (R) existing between the mean and maximum velocities in the gauge site is obtained, as shown in Figure 7. The result is in conformity with the argument in Equation (8) that the constant ratio, Φ, in a given cross-section will remain a steady relationship. It does not vary with water stage and discharge in the lined canal.
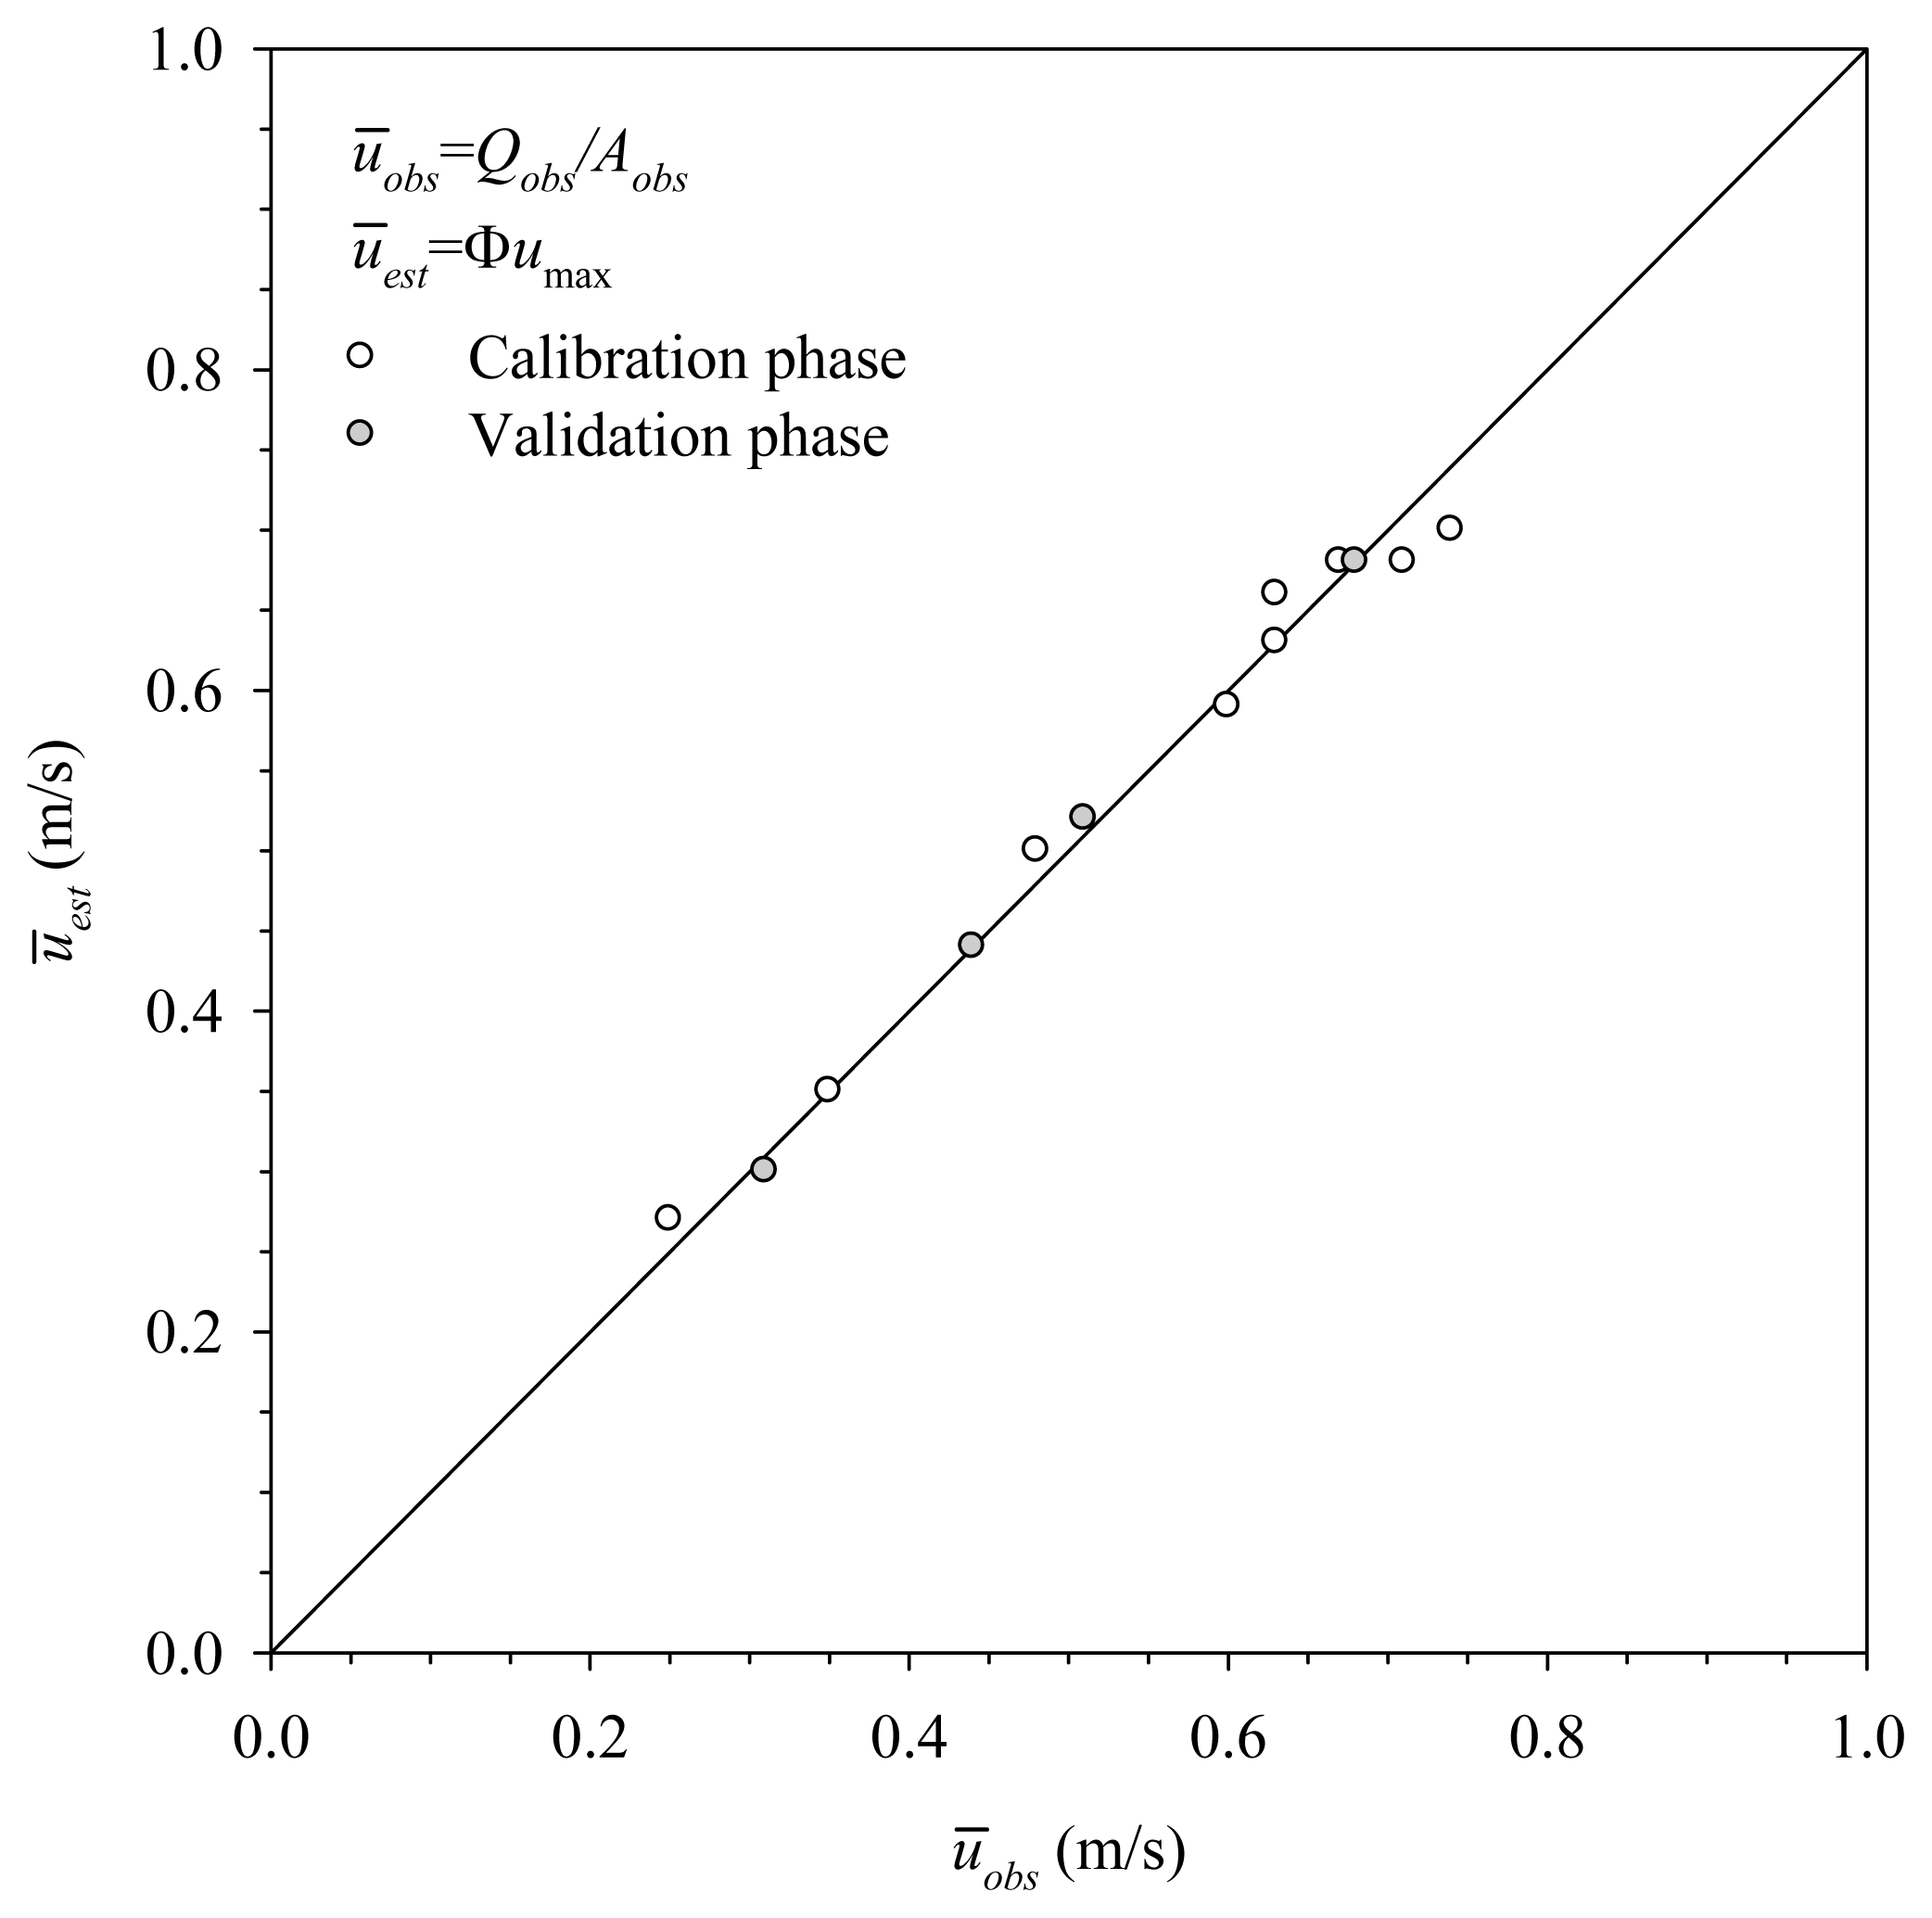
Figure 8 shows the relation of observed mean velocities obtained by Equation (9) and estimated mean velocities obtained by Equation (10) in the gauge site. To estimate ūest, Chiu’s Equation is applied to calculate the maximum velocity based on the velocity profile measurements on the y-axis. Excellent agreement between ūobs and ūest is found. It confirms the accuracy of the proposed method in computing the mean velocity in the irrigation canal.
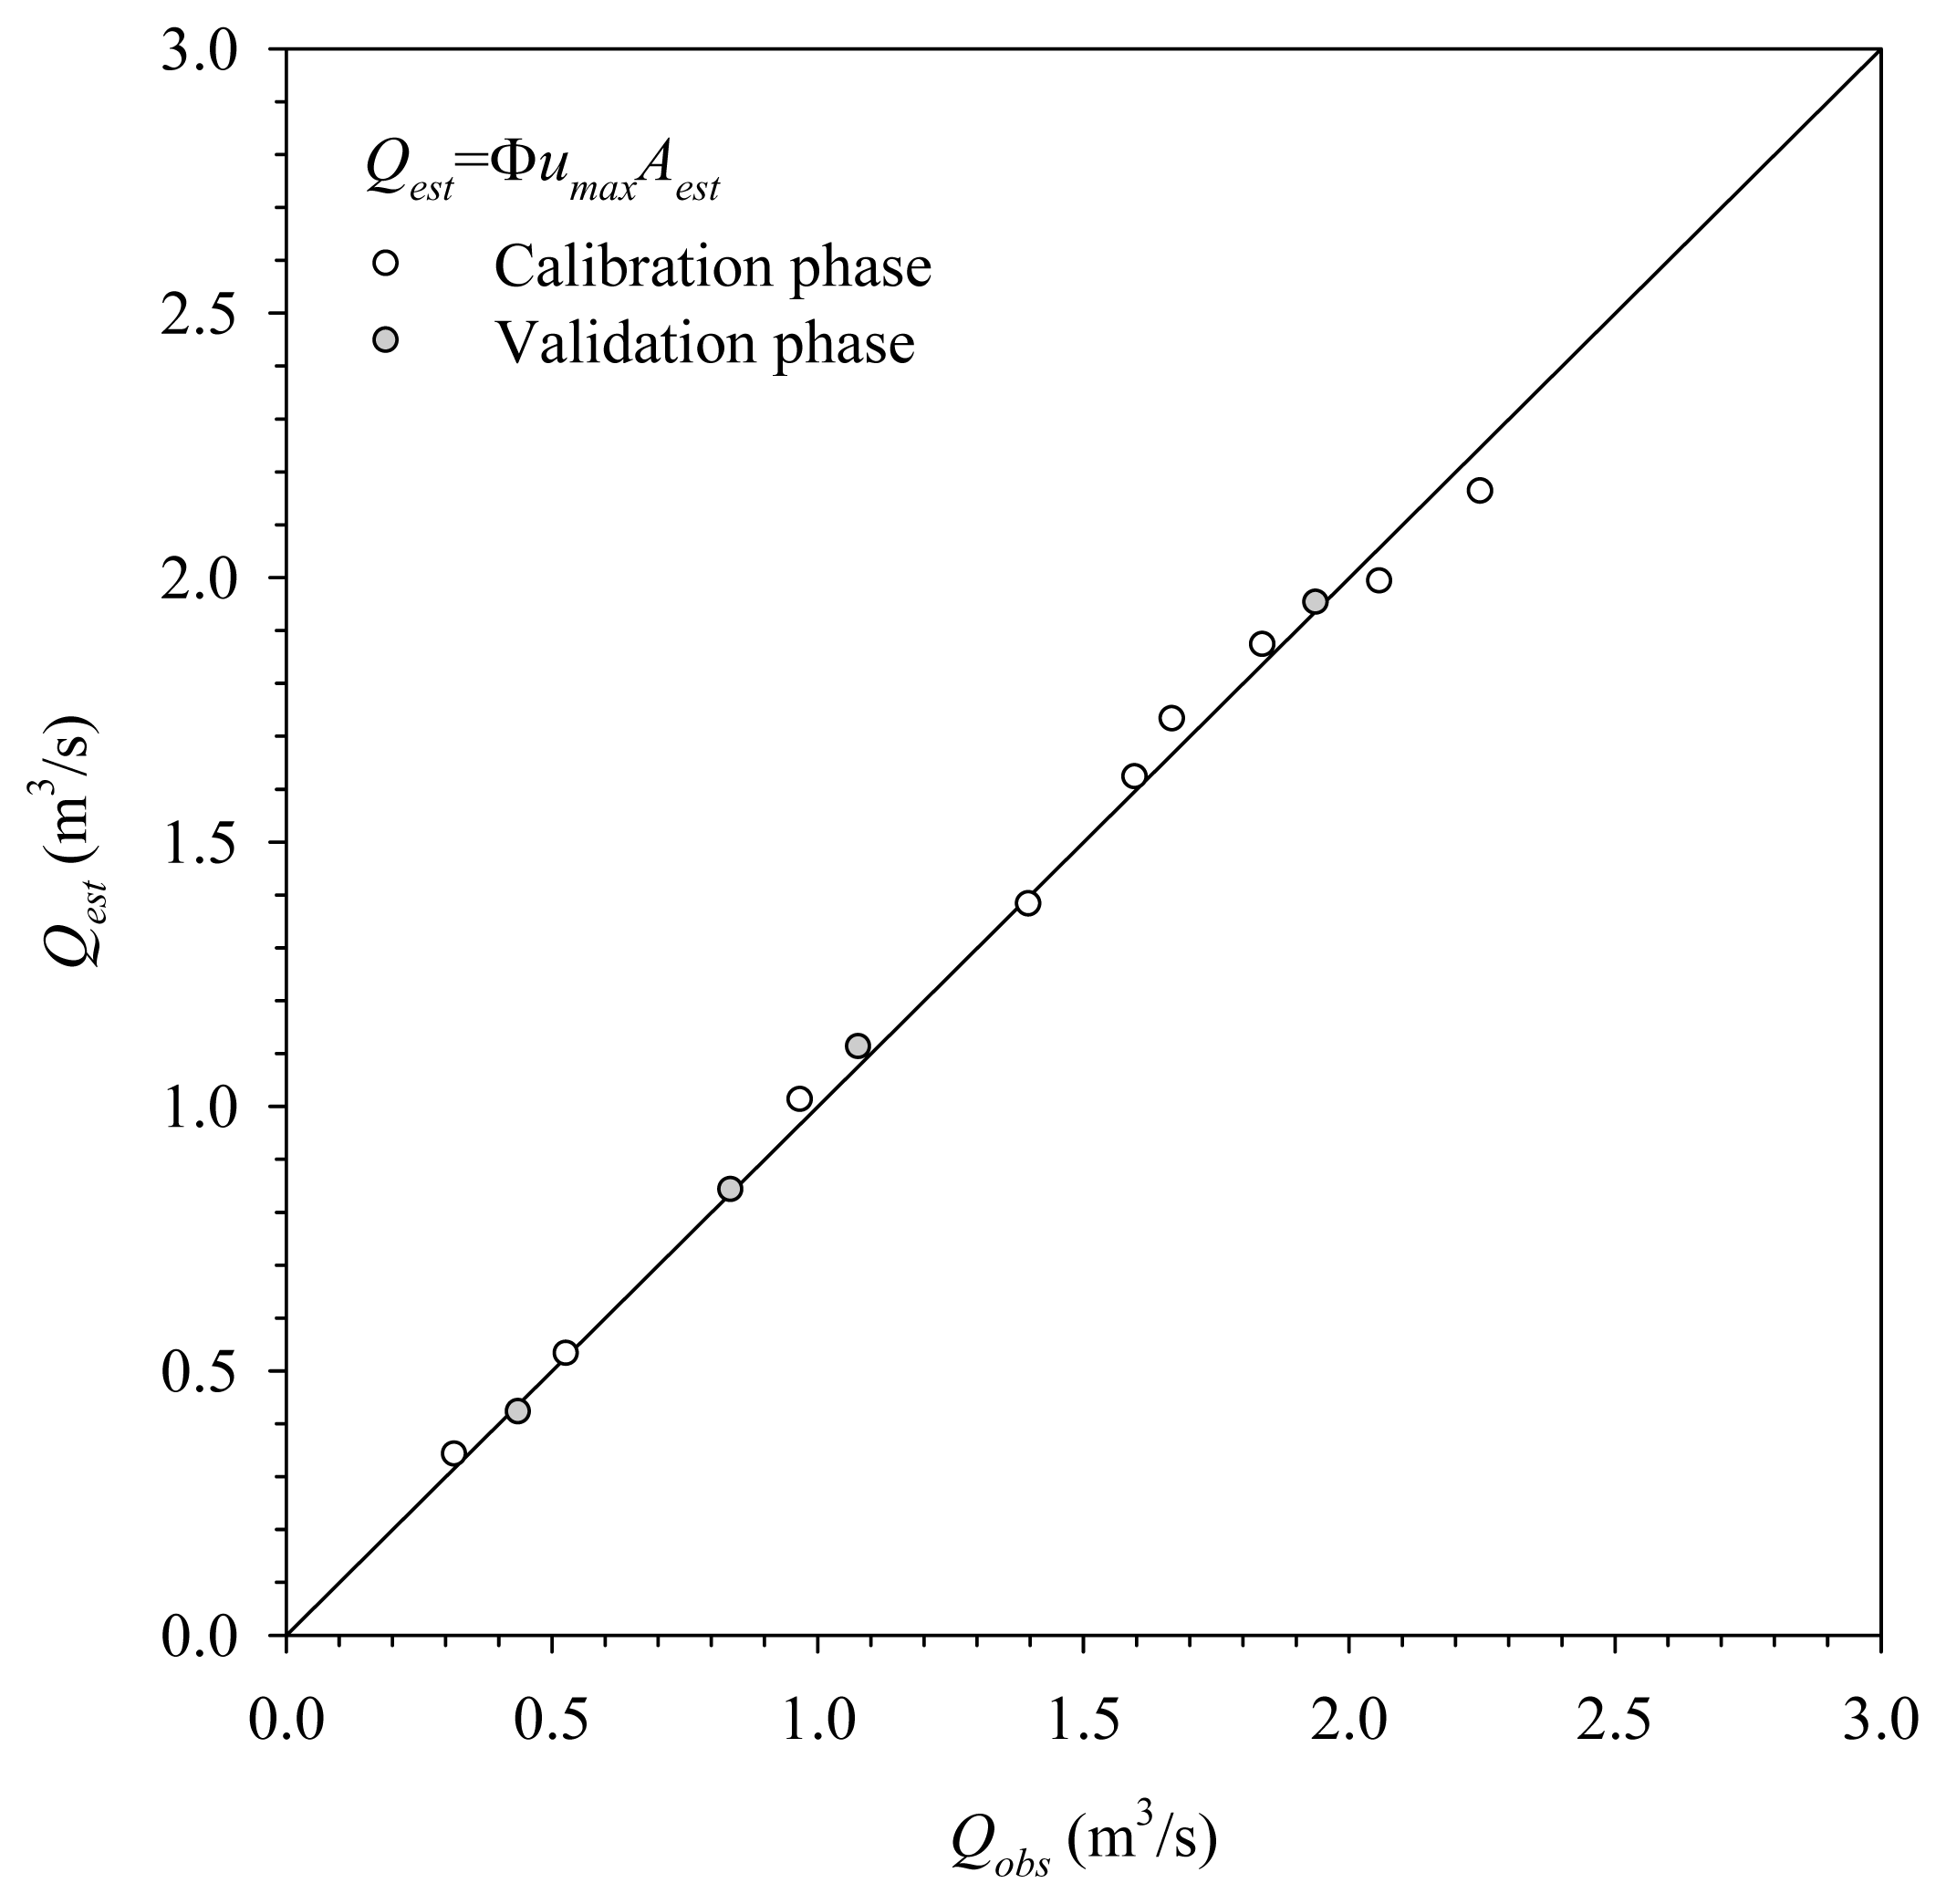
Figure 9 shows the observed and the estimated discharges in both calibration and validation phases. The estimated discharges calculated on the mean velocity derived from the y-axis and the cross-sectional area estimated by water stage are very close to the discharge measurements made by the ADC. The error is under 0.4%. The larger R2, 0.999, also confirms the precision of the proposed method used in the irrigation canal. This result indicates the capability of Chiu’s Equation to reliably and accurately estimate discharge in an irrigation canal.
The stage-discharge rating curve is then developed; the calibration of rating curve cannot be carried out just once. Several discharge measurements a year may be required to either confirm the consistence of the rating or to detect and follow shifts in the rating curve. With the proposed discharge method as the basis, the discharge of the Wan-Dan Canal can be measured in the gauge site in the future with only a few velocity measurements made on the y-axis for computing the mean velocity. Then the discharge can be rapidly and precisely estimated for calibrating the stage–discharge rating curve. It is no longer time-consuming and costly to measure discharge for verify the accuracy of the rating curve of the irrigation canal.
4. Conclusions
Combined with a new method of measurement and new technology, this study develops an efficient and simple method which is applicable to measure the discharge in lined canals. The ADC mounted on the measurement platform employed in the study is able to quickly and precisely measure the velocities over the full cross-section. By collecting a substantial amount of data on velocity observed in the canal for computing mean velocities by Chiu’s Equation, the accuracy of observed discharge can hence be improved for acquiring a precise stage-discharge rating curve.
The proposed method for measuring discharge in an irrigation canal principally applies the correlation of mean and maximum velocities. However it still needs to employ the velocity-area method to derive the observed discharge for computing the observed mean velocity. Then the ratio of observed mean velocity and maximum velocity derived for velocity measurements made by the ADC on the y-axis can be obtained. Finally the discharge can be estimated by a constant ratio, the maximum velocity and the cross-sectional area. Accuracy and reliability of the proposed method are proved by the results mentioned-above. The success of the discharge measurement method is demonstrated in the Wan-Dan Canal. By applying the stage–discharge rating curve, discharge in the irrigation canal can be remotely monitored and estimated. The biggest advantage of the discharge measurement method is that it can be used to measure discharge periodically for verifying the rating curve. By using this method, it is unnecessary to make velocity measurements over the full cross-section [32,33]. This can effectively reduce measuring time and cost, and successfully improve the management efficiency of the Irrigation Associations in Taiwan.
Acknowledgments
We are grateful to the Asia Pacific Instrument Corporation for their field coordination and assistance. The financial support was given by the Pingtung Irrigation Association, Taiwan and NSC 100-2625-M-366-001-MY3.
Conflicts of Interest
The authors declare no conflict of interest.
- Author ContributionsAll the authors contributed to the manuscript. Chen, Kuo, Yu, Liao and Yang have contributed to the research methods and the results have been discussed among all authors. Authorship credit are based on (1) Chen, Kuo, Yu, Liao and Yang contributed to conception and design, acquisition of data, or analysis and interpretation of data; (2) Chen, Yu, and Yang drafted the article or revised it critically for important intellectual content; and (3) Chen and Yang approved the final version to be published.
References and Notes
- Eheart, W.J.; Lund, R.J. Water-use management: Permit and water transfer systems. In Water Resources Handbook; McGraw-Hill: New York, NY, USA, 1996. [Google Scholar]
- Waye, V.; Son, C. Regulating the Australian water market. J. Environ. Law 2010, 22, 431–459. [Google Scholar]
- Wilson, C.A.M.E.; Horritt, M.S. Measuring the flow Resistance of submerged grass. Hydrol. Process 2002, 16, 2589–2598. [Google Scholar]
- Chen, Y.C.; Kao, S.P.; Lin, J.Y.; Yang, H.C. Retardance coefficient of vegetated channels estimated by the Froude number. Ecol. Eng 2009, 35, 1027–1035. [Google Scholar]
- Stringam, B.L.; Frizell, K.H. Flume or weir continuous water flow rate recorder for irrigation use. Irrig. Drain 2005, 54, 59–66. [Google Scholar]
- Carter, R.W.; Anderson, I.E. Accuracy of current meter measurements. J. Hydraul. Div. Proc. ASCE 1963, 4, 105–115. [Google Scholar]
- Chen, Y.C.; Kuo, J.T.; Yang, H.C.; Yu, S.R.; Yang, H.C. Discharge Measurement during High Flow. J. Taiwan Water Conserv 2007, 55, 21–33. [Google Scholar]
- Michalski, A. Flow measurements in open irrigation channels. IEEE Instrum. Meas. Mag 2000, 3, 12–16. [Google Scholar]
- Vougioukas, S.; Papamichail, D.; Georgiou, P.; Papadimos, D. River discharge monitoring using a vertically moving side-looking acoustic Doppler profiler. Comput. Electron. Agr 2011, 79, 137–141. [Google Scholar]
- Chiu, C.L. Entropy and probability concepts in hydraulics. J. Hydraul. Eng 1987, 113, 583–599. [Google Scholar]
- Singh, V.P.; Marini, G.; Fontana, N. Derivation of 2D power-law velocity distribution using entropy theory. Entropy 2013, 15, 1221–1231. [Google Scholar]
- Marini, G.; de Martino, G.; Fontana, N.; Fiorentino, M.; Singh, V.P. Entropy approach for 2D velocity distribution in open-channel flow. J. Hydraul. Res. IAHR 2011, 49, 784–790. [Google Scholar]
- Fontana, N.; Marini, G.; de Paola, F. Experimental assessment of a 2-D entropy-based model for velocity distribution in open channel flow. Entropy 2013, 15, 988–998. [Google Scholar]
- Singh, V.P. Entropy Theory and Its Applications in Environmental and Water Engineering; John Wiley: New York, NY, USA, 2013. [Google Scholar]
- De Martino, G.; Fontana, N.; Marini, G.; Singh, V.P. Variability and Trend in Seasonal Precipitation in the Continental United States. J. Hydrol. Eng. ASCE 2013, 18, 630–640. [Google Scholar]
- Chen, Y.C. Flood discharge measurement of a mountain river—Nanshih River in Taiwan. Hydrol. Earth Syst. Sci 2013, 17, 1951–1962. [Google Scholar]
- Chen, Y.C.; Chiu, C.L. An efficient method of discharge measurement in tidal streams. J. Hydrol 2002, 265, 212–224. [Google Scholar]
- Lu, J.Y.; Su, C.C.; Wang, C.Y. Application of a portable measuring system with acoustic Doppler current profiler to discharge observations in steep rivers. Flow Meas. Instrum 2006, 17, 179–192. [Google Scholar]
- Chiu, C.L.; Chen, Y.C. An efficient method of discharge estimation based on probability concept. J. Hydraul. Res 2003, 41, 589–596. [Google Scholar]
- Moramarco, T.; Saltalippi, C.; Singh, V.P. Estimation of mean velocity in natural channels based on Chiu’s velocity distribution equation. J. Hydrol. Eng 2004, 9, 42–50. [Google Scholar]
- Ammari, A.; Remini, B. Estimation of algerian rivers discharges based on Chiu’s equation. Arab. J. Geosci 2010, 3, 59–65. [Google Scholar]
- Herschy, R.W. Streamflow measurement; Taylor & Francis: New York, NY, USA, 2009. [Google Scholar]
- Chiu, C-L. Velocity distribution in open-channel flow. J. Hydraul. Eng 1989, 115, 576–594. [Google Scholar]
- Chiu, C.-L.; Chiou, J.-D. Entropy and 2-D velocity distribution in open-channels. J. Hydraul. Eng 1988, 114, 738–756. [Google Scholar]
- Shannon, C.E. A mathematical theory of communication. Bell Syst. Techn. J 1948, 27, 623–656. [Google Scholar]
- Rantz, S.E. Measurement and Computation of Streamflow: Volume1. Measurement of Stage and Discharge; Geological Survey Water-Supply Paper 2175; US Government Printing Office: Washington, DC, USA, 1982. [Google Scholar]
- Yang, H.C.; Chen, C.W. Potential hazard analysis from the viewpoint of flow measurement in large open-channel junctions. Nat. Hazards 2012, 61, 803–813. [Google Scholar]
- Yang, H.C.; Chen, Y.C. Discharge estimation of the Shin-Yuan Canal using indirect method. Paddy Water Environ 2013, 11, 217–225. [Google Scholar]
- Streeter, V.L.; Wylie, E.B. Fluid Mechanics; McGraw-Hill: New York, NY, USA, 1979. [Google Scholar]
- Chen, Y.C.; Hsu, Y.C.; Kuo, K.T. Uncertainties in the Methods of Flood Discharge Measurement. Water Resour. Manag 2013, 27, 153–167. [Google Scholar]
- Corato, G.; Melone, F.; Moramarco, T.; Singh, V. P. Uncertainty analysis of flow velocity estimation by a simplified entropy model. Hydrol. Process 2014, 28, 581–590. [Google Scholar]
- Moramarco, T.; Saltalippi, C.; Singh, V.P. Velocity profiles assessment in natural channels during high floods. Hydrol. Res 2011, 42, 162–170. [Google Scholar]
- Moramarco, T.; Corato, G.; Melone, F.; Singh, V.P. An entropy-based method for determining the flow depth distribution in natural channels. J. Hydrol 2013, 497, 176–188. [Google Scholar]


| RUN | Date | G (m) | Q (m3/s) |
|---|---|---|---|
| 1 | 3/14/2011 | 0.92 | 1.84 |
| 2 | 3/14/2011 | 0.85 | 1.60 |
| 3 | 3/15/2011 | 1.02 | 2.25 |
| 4 | 3/15/2011 | 0.95 | 1.94 |
| 5 | 3/15/2011 | 0.97 | 2.06 |
| 6 | 3/15/2011 | 0.88 | 1.67 |
| 7 | 3/16/2011 | 0.78 | 1.40 |
| 8 | 3/16/2011 | 0.71 | 1.08 |
| 9 | 3/16/2011 | 0.67 | 0.97 |
| 10 | 3/16/2011 | 0.63 | 0.84 |
| 11 | 3/16/2011 | 0.51 | 0.53 |
| 12 | 3/16/2011 | 0.47 | 0.44 |
| 13 | 3/16/2011 | 0.42 | 0.32 |
| 14 | 3/16/2011 | 0.10 | 0.00 |
© 2014 by the authors; licensee MDPI, Basel, Switzerland This article is an open access article distributed under the terms and conditions of the Creative Commons Attribution license (http://creativecommons.org/licenses/by/3.0/).
Share and Cite
Chen, Y.-C.; Kuo, J.-J.; Yu, S.-R.; Liao, Y.-J.; Yang, H.-C. Discharge Estimation in a Lined Canal Using Information Entropy. Entropy 2014, 16, 1728-1742. https://doi.org/10.3390/e16031728
Chen Y-C, Kuo J-J, Yu S-R, Liao Y-J, Yang H-C. Discharge Estimation in a Lined Canal Using Information Entropy. Entropy. 2014; 16(3):1728-1742. https://doi.org/10.3390/e16031728
Chicago/Turabian StyleChen, Yen-Chang, June-Jein Kuo, Sheng-Reng Yu, Yi-Jiun Liao, and Han-Chung Yang. 2014. "Discharge Estimation in a Lined Canal Using Information Entropy" Entropy 16, no. 3: 1728-1742. https://doi.org/10.3390/e16031728