Recent Theoretical Approaches to Minimal Artificial Cells


Abstract
: Minimal artificial cells (MACs) are self-assembled chemical systems able to mimic the behavior of living cells at a minimal level, i.e. to exhibit self-maintenance, self-reproduction and the capability of evolution. The bottom-up approach to the construction of MACs is mainly based on the encapsulation of chemical reacting systems inside lipid vesicles, i.e. chemical systems enclosed (compartmentalized) by a double-layered lipid membrane. Several researchers are currently interested in synthesizing such simple cellular models for biotechnological purposes or for investigating origin of life scenarios. Within this context, the properties of lipid vesicles (e.g., their stability, permeability, growth dynamics, potential to host reactions or undergo division processes…) play a central role, in combination with the dynamics of the encapsulated chemical or biochemical networks. Thus, from a theoretical standpoint, it is very important to develop kinetic equations in order to explore first—and specify later—the conditions that allow the robust implementation of these complex chemically reacting systems, as well as their controlled reproduction. Due to being compartmentalized in small volumes, the population of reacting molecules can be very low in terms of the number of molecules and therefore their behavior becomes highly affected by stochastic effects both in the time course of reactions and in occupancy distribution among the vesicle population. In this short review we report our mathematical approaches to model artificial cell systems in this complex scenario by giving a summary of three recent simulations studies on the topic of primitive cell (protocell) systems.1. Introduction
The chemical implementation of minimal artificial cells (MACs) from scratch is attracting the interest of a growing number of researchers in the fields of synthetic biology and origin of life studies [1–6], who are becoming aware of the potential of microcompartments and lipid vesicle technologies to uncover biologically relevant phenomena, as well as plausible prebiotic processes and evolutionary transitions. A MAC is a self-assembled chemical system that exhibits self-maintenance (i.e. autopoiesis), self-reproduction and the capability of evolution. Self-maintenance represents the capability of an organism to self-sustain itself by transforming chemical compounds available in the environment into building blocks and thus being in a dynamic state of continuous renewal of its constituents. Maturana and Varela formulated in the mid-seventies the theory of autopoiesis in order to define what are the minimal properties of living systems, expressed in terms of their molecular organization [7]. Self-maintained chemical structures can also reproduce themselves. This property also stems from their autopoietic organization, but requires that metabolic production of their components overcome their spontaneous degradation. Self-reproducing (proliferating) organisms may exhibit evolution capability in a Darwinian sense as a collective trait due to the transmission, generation by generation, of operational instructions in a coded form. Because reproduction is often imperfect, self-reproducing organisms generate “diversity” and evolve in a Darwinian sense, i.e., owing to the interplay between the generation of genotypic diversity and selection/competition processes in a world of limited resources. While self-reproduction and evolution are typical features of living cellular forms as we know them, it is reasonable to focus on autopoietic self-maintenance for determining the core feature that characterizes minimal “living” entities.
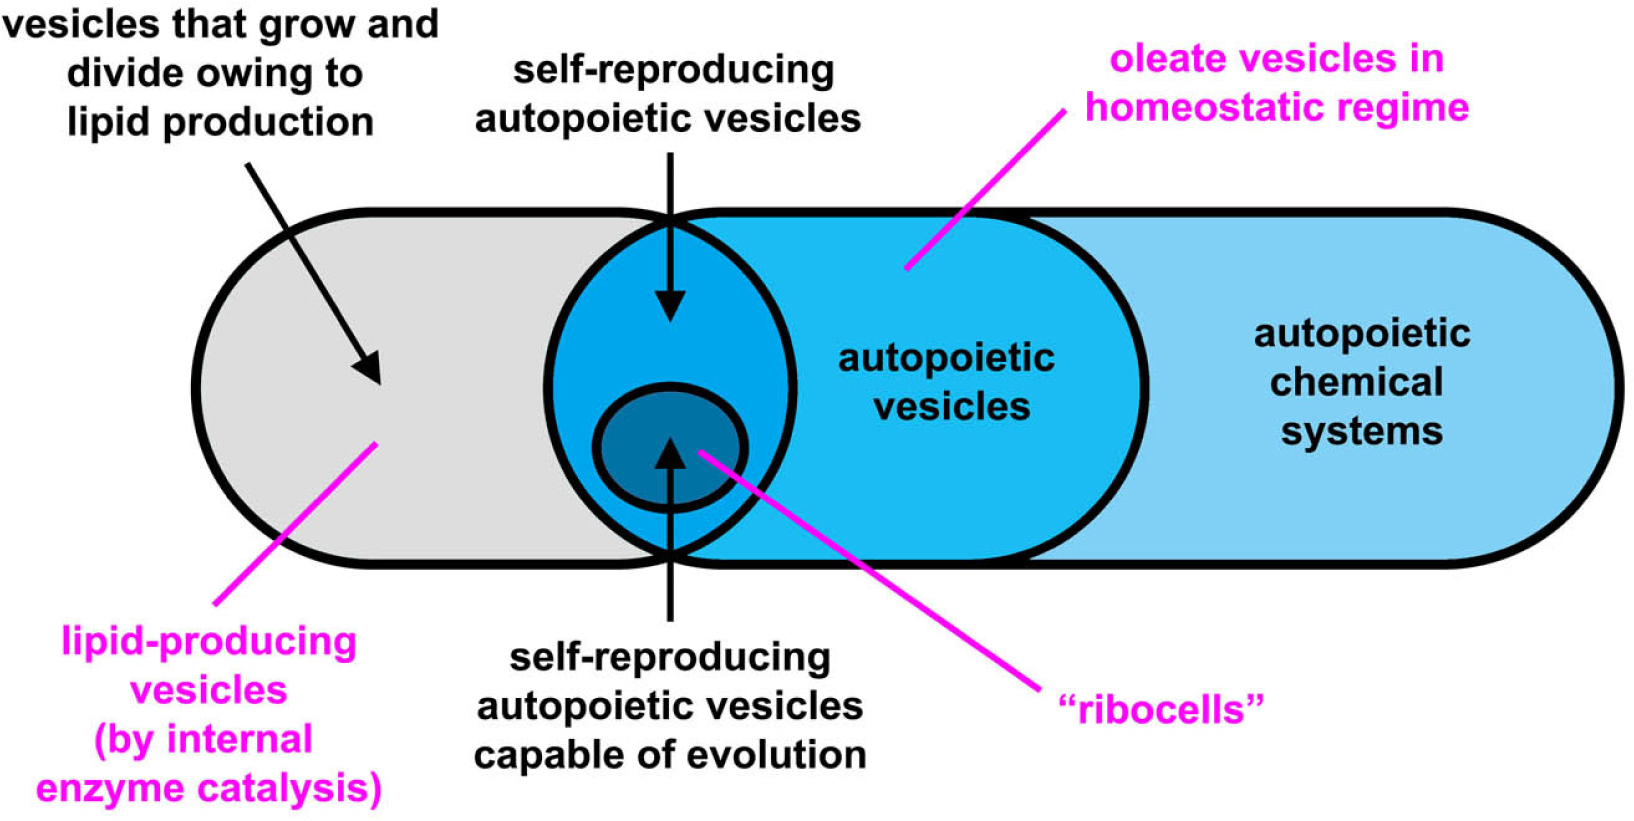
The experimental approach to the construction of MACs is mainly based on lipid vesicles (liposomes) that consist of a closed, spherical, semi-permeable membrane formed by the spontaneous self-assembly of lipid molecules. The membrane is a highly organized molecular bilayer that separates the molecules entrapped inside the vesicle (i.e., in the inner aqueous vesicle core) from the external environment. A variety of chemical and biochemical reactions have been implemented inside liposomes, from RNA synthesis to gene expression, from DNA amplification to lipid synthesis (for a review, see [8]). The latter reaction is particularly important because it allows the growth of vesicles through the enlargement of vesicle membrane. Division may also follow vesicle growth, so that two “daughter” vesicles are obtained from the original parent (i.e., self-reproduction). A schematic classification of artificial chemical structures [9–12] is tentatively shown in Figure 1, although the nomenclature of these structures are far from being uniformly adopted by the community. In this article, we use the term protocell according to the definition introduced by Ruiz-Mirazo [13], in order to indicate compartmentalized molecular systems (generally lipid vesicles [14], but other compartments have been also used [9,10]) built for understanding the origin of complex biological cells, or for investigating alternative forms of cellular organization [15]. As shown in Figure 1, here we will distinguish between truly autopoietic “self-reproducing” systems (capable of growing and dividing by producing the membrane building blocks—the lipids—as well as all catalytic components, for example those present in the aqueous core) and not-autopoietic “self-producing” systems (capable of growing and dividing by producing only membrane components). This distinction is useful because some experimental systems fall in the second category.
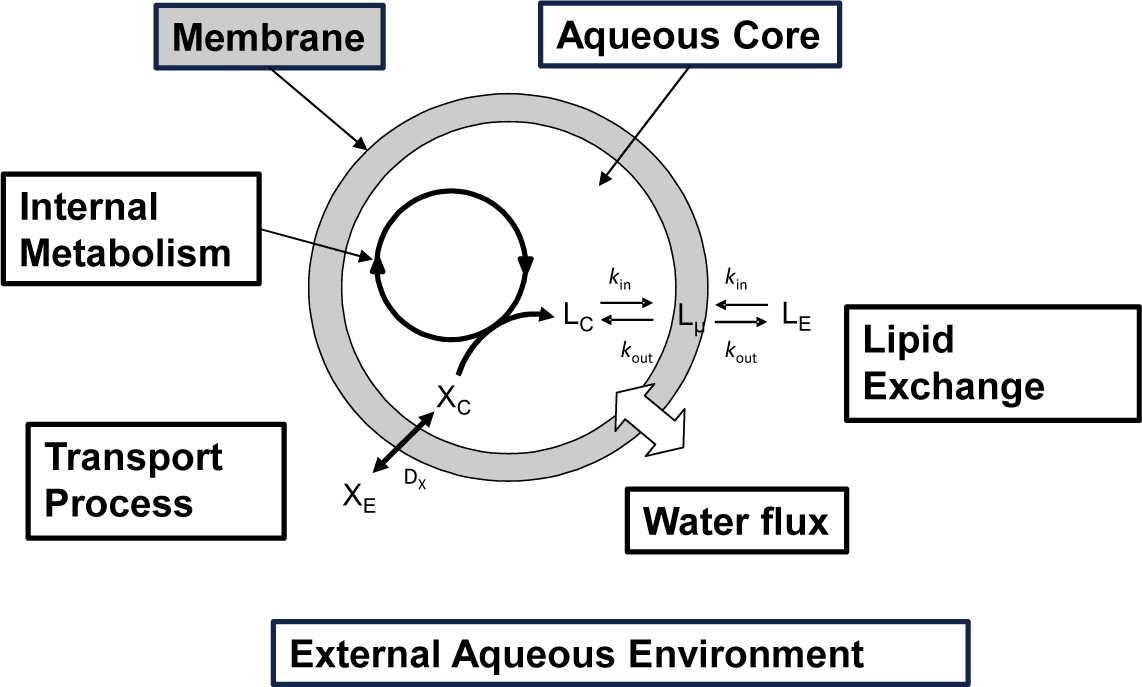
In Figure 2 a schematic drawing of a “self-producing” protocell endowed of an internal metabolic cycle that produces the lipid molecules forming the membrane is shown. In this rapidly progressing field, different theoretical approaches have been recently proposed at different levels of complexity, and making the underlying chemistry more or less explicit in the model. Bolton and Wattis focused on early examples of chemical autopoiesis studying the time evolution of the size distribution of autopoietic vesicles [16–18] by means of a deterministic kinetic stepwise aggregation model: The Becker-Döring model. In this approach a vesicle is described only in terms of its aggregation number or its size, i.e. the number of lipids that form the membrane, and by using a coarse grain reduction technique, these authors were able to reduce the entire vesicles population to a few aggregates groups of various sizes each described using a single time variable.
On the other hand, biophysical studies on vesicle self-reproduction have been reported by Bozic and Svetina [19,20] and have focused on morphological shape transitions of a single self-reproducing vesicle. These authors analyzed the physical conditions under which reproduction would take place under the assumption that chemical reactions provoke an exponential increase in the total membrane area of the vesicle. By minimizing the bending energy of the membrane, they were able to derive a deterministic equation for division in terms of the different physical magnitudes involved (permeability, spontaneous curvature, bending constant). With a similar approach, Fanelli and McKane also developed alternative models [21]. In contrast, Surovtsev et al. [22,23] proposed a much more explicit chemical reaction network and studied how internal chemical oscillations are critical to induce adequate shape transformations and membrane division. Making use again of the principle of minimal bending energy, they showed, in this case, how system-controlled fission is nearly impossible to accomplish without a rather sophisticated mechanism (e.g., A contractile ring to ensure the effective narrowing of the division neck). More elaborate models have been proposed by Macia and Solé [24] who explored how chemical/metabolic symmetry-breaking concentration patterns can generate osmotic differences across the global volume of the vesicle, inducing changes in its morphology and, eventually, a division process. The types of reaction networks they studied were reasonably simple and embedded in a spatially explicit 2D model of membrane growth and deformation [25].
We have been involved in the field of synthetic cell modelling with mathematical models implemented by a specialized Monte Carlo platform called ENVIRONMENT [26] which tries to couple the membrane energy state with the internal metabolism of a single protocell or of population of protocells. The aim of this paper is to summarize our recent studies on MACs, and it is not intended to be a comprehensive review on the entire topic. In particular, we aim at introducing the mathematical framework we used to describe the time behaviour of reacting protocells in terms of the deterministic versus the stochastic approach [27]. We also would like to focus on a recently emerging theme, namely the interplay between internalized reactions, vesicle growth and self-reproduction.
In our approach, protocells are seen as compartmentalized chemically reacting systems that can change their size and morphology during their lifetime. These variations, which are well evident in terms of reaction volume and membrane area, can highly influence the protocell time behaviour, affecting for instance the integral reaction rates and transport processes. Moreover, since the rate of change of the aqueous core volume and the lipid membrane surface are not directly coupled, a rapid increase of the core volume can bring a protocell into an unstable state and eventually to an osmotic crisis, while conversely a rapid growth of the membrane area can bring vesicles to a deflated state which will eventually result in protocell division. In order to grasp this complex phenomenology, we have introduced a simplified model of reacting vesicles that can be reduced to deterministic equations suitable for the description of the protocells’ time-averaged behaviour. Furthermore, the size range of a population of lipid vesicle protocells can be very broad (from tens of nanometers to tens of micrometers). The distribution of biomolecules encapsulated inside vesicles can be largely affected by randomness, giving rise to a population of individual compartments very different from one another in their chemical composition. In order to take into account the role of stochasticity in the protocells’ time behaviour, a novel theoretical approach is necessary. This will allow the study of an entire population of protocells instead of a single compartment, like in the deterministic approach. In turn, such an approach might be useful to test and then overcome the main assumption of the deterministic approach, namely that the time behaviours of all the protocells in the population are, on average, statistically equivalent.
This theoretical review is structured as follows: in Section 2 the deterministic and stochastic approaches will be presented and our in silico reacting vesicle model will be used to elucidate the main difference between them, while in Section 3 some examples of protocell modelling will be presented, showing how random fluctuations can bring the system very far from the deterministic forecast. Finally some conclusions will be drawn and an outlook of future work presented.
2. Mathematical Approaches
In this section, we will introduce and discuss a lipid vesicle model that allows the description of reacting vesicles. The corresponding mathematical equations will be presented according to deterministic and stochastic approaches. In both approaches we will adopt the “continuous stirred tank reactor” assumption for all microcompartments, which is commonly adopted in biological modelling, from environmental analysises to pharmacokinetics studies.
2.1. In Silico Reacting Vesicles
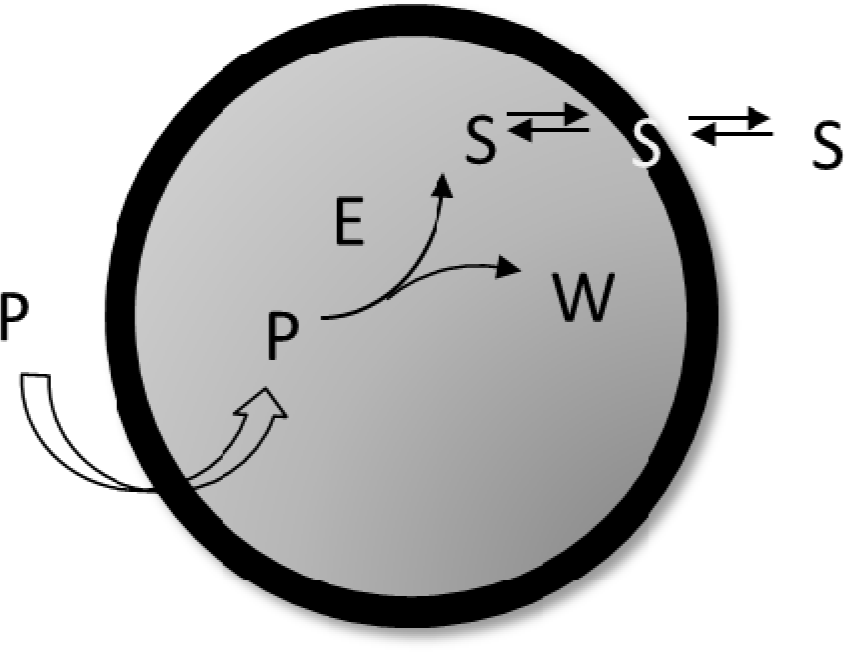
According to the schematic drawing shown in Figure 2 self-producing vesicles are described as compartmentalized systems made up of two different homogeneous domains: the membrane and the aqueous core [28]. Lipids can be exchanged between the membrane and aqueous core and between the membrane and the external aqueous environment. Transport processes can also occur, allowing for the exchange of molecules from the external environment to the internal water pool. The vesicle membrane surface Sµ can be determined as it follows:
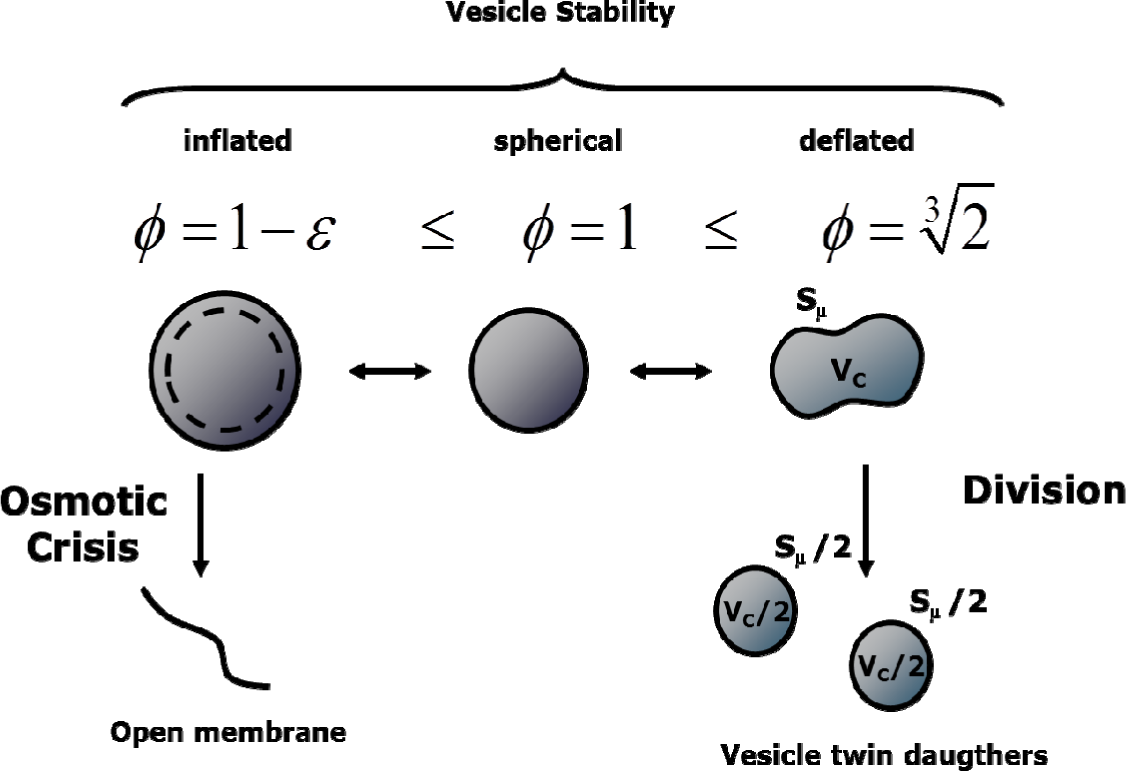
where the contributions of different lipids present in the bilayered membrane is calculated by the product of hydrophilic head area αi, times the number of lipids and neglecting the membrane thickness ~4 nm (this assumption works better for vesicles with diameter larger than 30 nm). In the rest of this paper we will deal with vesicles whose membranes are made of a single lipid so that the previous equation simplifies to . In the presence of osmotic pressure unbalance, the internal aqueous volume VC is considered to be affected by a water flux, so that the variations of the core volume and the membrane surface are not necessarily directly coupled. The vesicle state can be described by the reduced surface ϕ:
defined as the ratio between the actual membrane surface Sμ and the area of a sphere with the actual vesicle core volume Vc, (Figure 3).
Therefore, ϕ equals 1.0 for spherical vesicles, while it is less than 1.0 or greater than 1.0 for inflated or deflated vesicles, respectively. In fact, a flux of water can take place across the lipid membrane driven by an osmotic pressure unbalance. An osmotic rupture takes place when the internal volume increases until eventually the membrane rupture when ϕ < (1−ε), with ε being the osmotic tolerance. Parameter ε is experimentally derived, and determined by measuring the maximum increase ΔCmax in the internal concentration C that vesicles can support without breaking [29]:
On the other hand, in the present model, deflated vesicles are assumed to divide when the membrane surface is large enough to form two twin spherical daughters: . This event has been observed under some experimental conditions [30]. However, the dynamics of a deflated vesicle are not at all trivial, and modelling the division process will become more accurate as more experimental data become available.
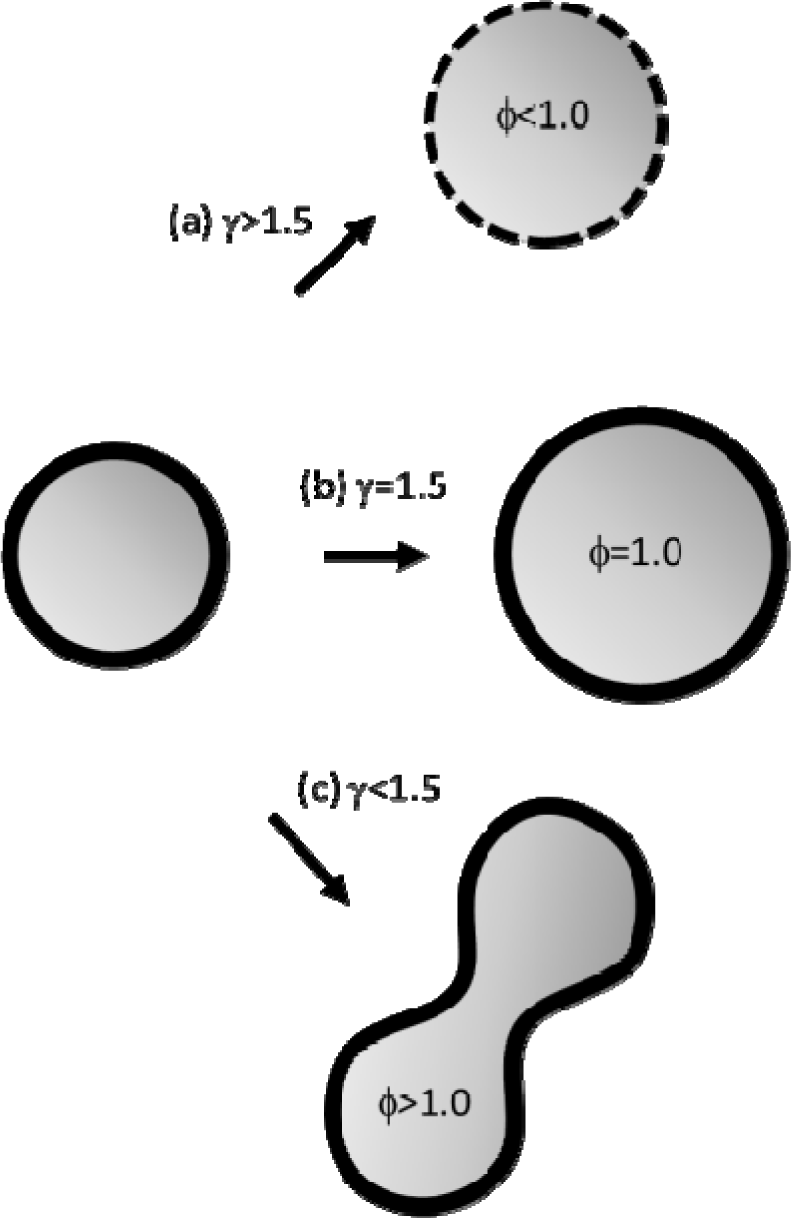
Since the aqueous core volume VC and the membrane surface Sµ may follow independent time trends, in order to describe the various possible behaviours of the system, it is convenient to introduce the growth control coefficient γ [31]:
This dimensionless observable is defined as the ratio between the relative rate of volume variation, and the relative rate of surface variation. In presence of an endogenous (biosynthetic or protometabolic) production of lipid dS > 0 thanks to the spontaneous uptake of fresh lipid by the membrane and, in these conditions, γ >0 indicates a real growth regime. Therefore, just by applying some straightforward geometry rules for a generic growing sphere of radius R: d(lnV)/3 = d(lnS)/2 = d(lnR), three different scenarios among all possible growth regimes may be distinguished (Figure 4).
2.2. Deterministic Modelling
If in the vesicle aqueous core, N species Xi (i = 1,2…N) react according to ℜ chemical elementary reactions:
then the average time evolution of the reacting vesicles can be described in terms of the average number of molecules xi of internal aqueous species Xi (i=1,2…N, i≠L), the lipid molecules xL in the aqueous core, the lipid molecules in membrane and core volume VC by solving the following ordinary differential equation set (ODES) [27]:

where NA is Avogadro’s number, kin and kout are the kinetic constants of the lipid uptake and release to/from the membrane and the external and internal aqueous solutions, while is the membrane permeability and [Xi]Ex and xi/(VCNA) are the external and internal concentrations of i-species, respectively. The term vρ is the reaction rate of the ρ-th reaction (ρ = 1,2…ℜ) of the internal metabolism given by the mass action law:
where kρ is the kinetic constant. It is worthwhile to stress that the ODE set in Equation (6) has been written for the case of aggregates formed by a single type of lipid XL. Others simplifying assumptions include: (i) the molecular diffusion of species both within the internal core volume and in the external environment are neglected; and (ii) the external concentrations [Xi]Ex are considered constant in time (i.e., the environment is considered as an infinite source of external compounds and a sink to waste).
Going into details, the molecular number of each aqueous species xi changes in time due to the internal metabolic reaction and to the transport process from the outside. The transport across the membrane is driven by a concentration gradient as shown by the following scheme:
where [Xi] = xi/(VCNA) is the internal concentration of the ith species. Instead, the rate of change of the lipid number in the core, dxL/dt, takes into account the exchange between the aqueous internal phase and the membrane described as follows:
where [XL] = xL/(VCNA) is the internal concentration of the lipid. Moreover, the lipid exchange towards the outside is not explicitly considered in the rate equation of the membrane lipids since the external lipid concentration is assumed to be constantly equal to the equilibrium value [26]. The last equation in the ODE set Equation describes the core volume change rate due to a flux of water driven by the difference of the total osmolite concentration (i.e. an osmotic pressure unbalance, being ℘aq the water permeability and ωaq the water molecular volume). It is important to remark that the deterministic approach gives the time evolution of the vesicles solution as the average time course calculated over the vesicles population, so that although xi (I = 1,2…N) and are not positive integer numbers but positive real values, nevertheless they represent amounts of molecules. Therefore the vesicle state is represented by the array X = (x1, x2, …, xN)T and the core volume VC. When the condition for division is satisfied , then the vesicle divides in two twin daughters with volume equal to VC/2 and all the elements of the state array are accordingly divided by 2.
2.3. Stochastic Simulations
The stochastic kinetic approach explicitly takes into account the discrete nature of molecule numbers and the intrinsic randomness of reacting events. Therefore, the state of a reacting vesicle is defined by an array of integer molecular numbers ni: and the core volume VC. Moreover, for each elementary reacting event a propensity density probability aρ(N) is introduced instead of the deterministic reaction rate so that aρ(N)dt gives the probability that the ρ-th reaction will take place in the next infinitesimal time interval dt [27]:
while the propensity density probabilities for transport processes and lipid exchange can be predicted according to Equations (5) and (6) [26]. The stochastic time evolution of a well stirred chemically reacting system can be then obtained by solving the following master equation (ME) [27]:
that expresses the change rate of the Markov density function P(N, t|N0, t0), i.e. the density probability to find the system in the state N in the time interval [t, t + dt) given the system in the state N0 at time t0. ΔNρ is the jump array, that is the stoichiometric variation of the number of molecules due to the ρ-th reaction. By solving analytically the ME, the average time behaviour of the reacting system can be obtained, along with displacements from the average species time course due to random fluctuations. These fluctuations can bring the system towards regimes unpredictable by the deterministic approach [27]. ME is very difficult to solve analytically, but it can be simulated exactly by the well know Monte Carlo Direct Method introduced by Gillespie [32]. Based on this method we developed a software platform [26] suitable for simulating the stochastic time evolution of a collection of reacting vesicles, assuming that spatial diffusion processes can be neglected and the concentration gradients take place only across the lipid membranes. Moreover, this program allows one to study the case of vesicle self-reproduction, since it is able to follow a collection of reacting compartments that increases in number (see [26], and[33–35] for further details). We wish to remark here that this software is also suitable to study the influence of extrinsic stocasticity. In fact, reacting molecules can be distributed randomly among compartments at the starting time or between daughters at the division time , simulating how this source of randomness affects the system time behaviour.
3. Results and Discussion
In this section three examples of protocells will be reviewed and discussed. Firstly, we will present a model of autopoietic oleic acid vesicles in a homeostatic regime. This study, based on experimental data [12], focuses on a minimal model that can describe the observed behaviour by also taking into account the role of random fluctuations. Then, we will derive a general formula suitable for predicting when the stationary self-reproduction of protocells can take place according to our assumptions. This formula will be applied to the simple case of enzymatic self-producing vesicle, a short name to indicate those lipid-synthesizing vesicles that are capable of growth and division due to the enzyme-catalysed conversion of a molecular precursor in the membrane-forming molecule L. Note that in these vesicles the enzyme itself is not produced by any internal mechanism. Despite its apparent simplicity, no experimental data are currently available for such systems. Finally, a more complex case will be presented: RNA-based protocells (“ribocells”) which are self-reproducing protocells based on ribozyme catalysts. By means of numerical simulation, it will be checked whether such a hypothetical minimal cellular model [36] is robust enough to be implemented in a test tube.
3.1. Autopoietic Vesicles in Homeostatic Regime
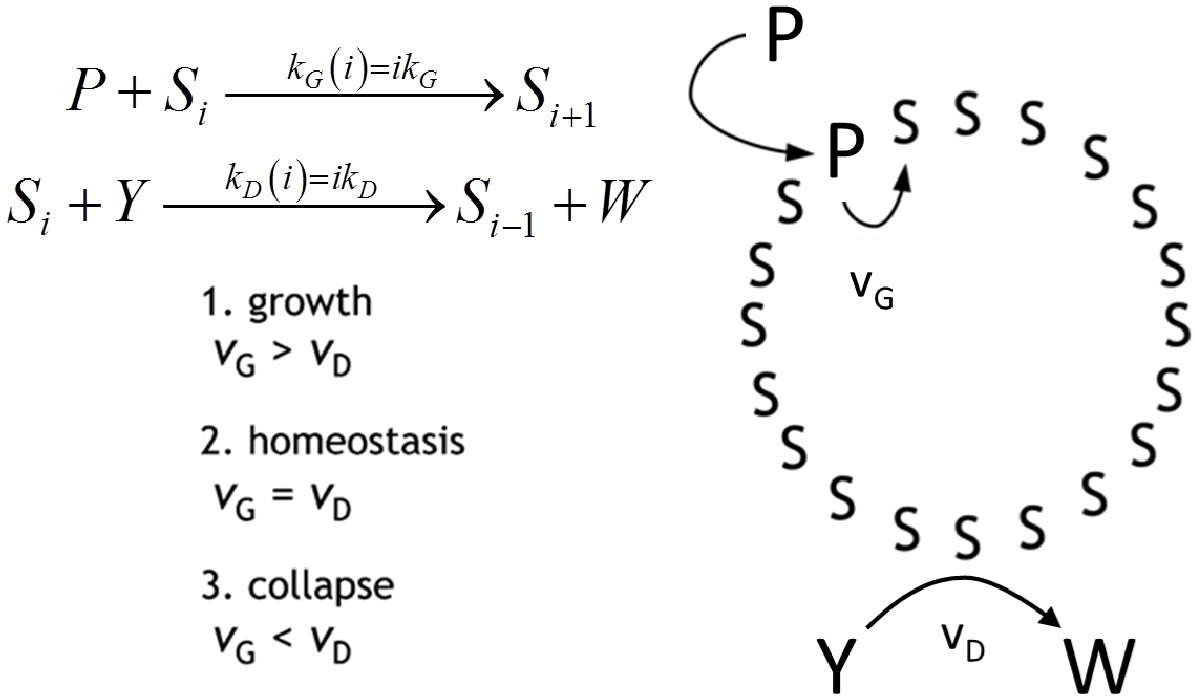
Autopoiesis, as developed by Maturana and Varela in the seventies [7], is a theoretical description of the ‘blue print’ of cellular life. It poses as a main feature the self-maintenance of the cell, as due to a process of components’ self-generation from within the cellular boundary—a boundary which is itself one of the products. From the chemical point of view, the fertility of autopoiesis theory allowed the design and the experimental achievement of some autopoietic chemical systems all based on surfactant self-assembling structures, such as micelles [10], reverse micelles [9] and vesicles [11]. In Figure 5, the schematic representation of an autopoietic vesicle is shown, along with the kinetic conditions for different regimes in the time course of total surfactant concentration. The occurrence of these regimes depends on the rates of amphiphile production vG and decay vD, respectively. Zepik et al. [12] have reported experimental work that confirms the expected behaviour. In particular, the chemical system consists of a solution of oleic acid/oleate vesicles (Si, i being the aggregation number), buffered at pH 8.8, fed with a surfactant precursor and with a reactant capable of destroying oleic acid. The surfactant precursor (P) is oleic anhydride, a hydrophobic substrate rapidly taken up by oleate vesicles at their membranous interface. Owing to the high pH value, P is converted to oleate by alkaline hydrolysis that takes place on the membrane of vesicles. Oleate vesicles also undergo a decay process due to the simultaneous transformation of oleate molecules into 9,10-dihydroxystearate (W) by osmium tetroxide/potassium ferrocyanide oxidation (Y). The dihydroxylated compound W does not form vesicles; therefore, the consequence of the latter conversion is a stepwise vesicle collapse (death). Due to the two competitive reactions, the overall oleate concentration increases, remains approximately constant, or decreases, depending on the magnitude of the P and Y flux rates [12]. In order to reproduce the experimental observed behaviour we proposed the simple mechanism reported on the right side of Figure 5 and we were able to obtain the time course of the overall oleic acid concentration [35]:
This Equation accounts for the three regimes by explicitly expressing the overall rates of amphiphile production vG∝kG[P]0 and decay vD∝kD[Y]0 as proportional to the aqueous concentration of the anhydride [P]0 and of the oxidant [Y]0, respectively, kept constant by the external fluxes. Stochastic simulations performed in homeostatic conditions (kG[P]0 = kD[Y]0) have been done in order to elucidate the evolution of the vesicle size distribution.
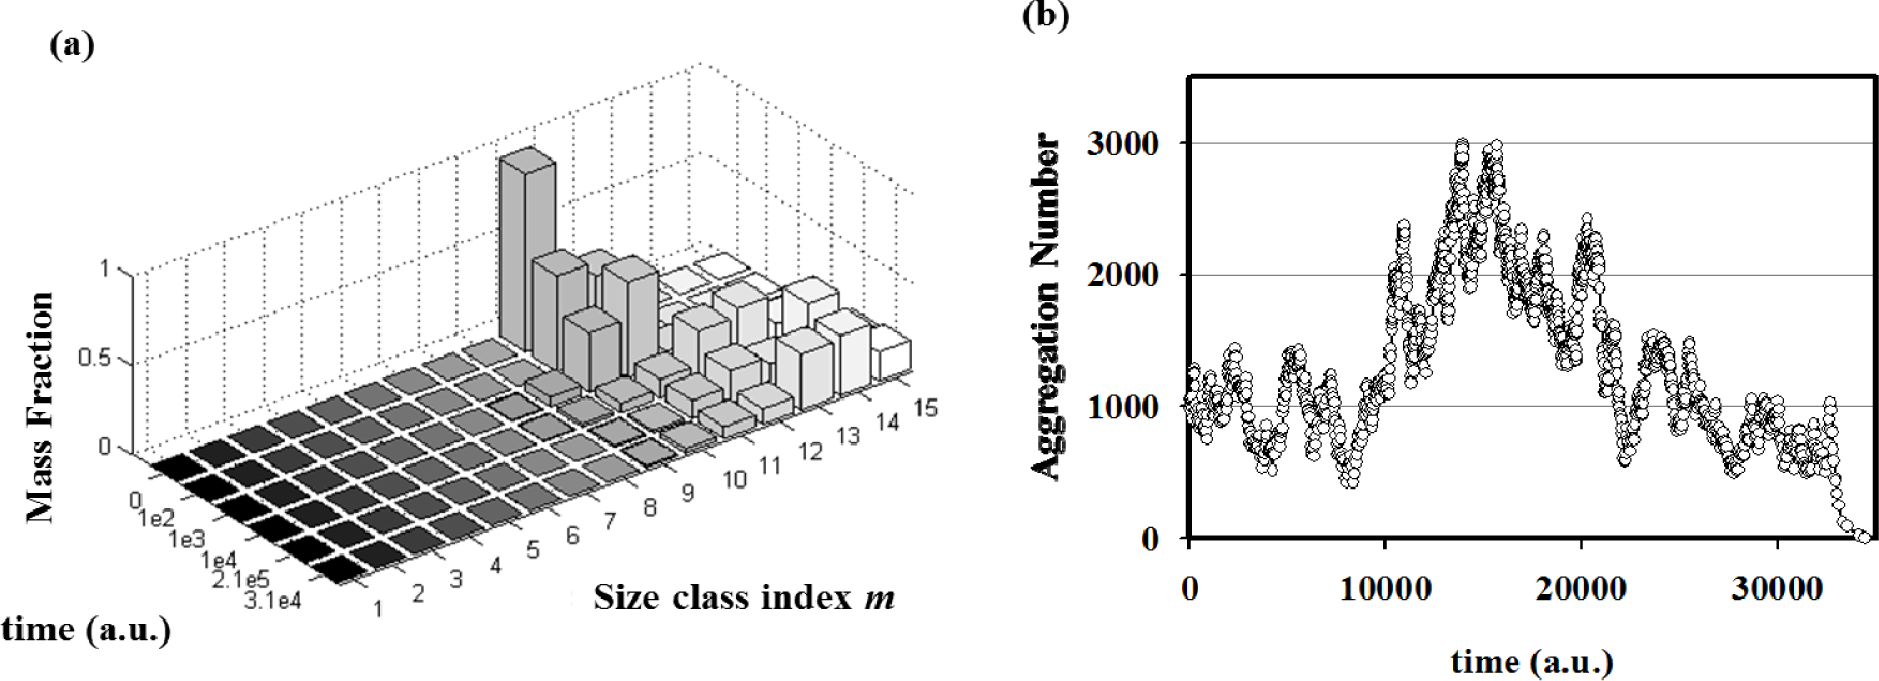
By performing simulations of autopoietic vesicle populations (each characterized by a specific vesicle size), it has been demonstrated that stochasticity selects vesicles with aggregation numbers in the range 103–104 (Figure 6a). This effect can be ascribed to the presence of random fluctuations in the growth and decay specific rates. In real (chemical) reacting systems these fluctuations are due to the intrinsic stochasticity of reacting events, but they can also be enlarged by natural changes of physical parameters such as temperature, molecular fluxes, etc. In fact, stochastic simulations starting from a single aggregate have shown how random fluctuations at the steady state can drive the evolution of the aggregate towards growing or a decreasing in size (Figure 6b). Therefore, when autopoietic vesicles of different sizes are present in a system in stationary conditions, fluctuations can act as a selection rule that leads to the perpetuation of those aggregates large enough to overcome large deviations In conclusion, stochastic simulations have shown that, in this landscape, random and driven fluctuations can represent the driving force for aggregates evolution, growth or decay, and at the same time they can act as a selection rule for the fittest, i.e. the most robust, aggregates in a prebiotic environment.
3.2. Protocell Stationary Self-Reproduction
In a recent work, we derived a phenomenological law that predicts when a stationary self-reproduction takes place for minimal autopoietic vesicles. By “stationary self-reproduction” we mean a dynamic regime where the conditions for division are reached repeatedly after a constant, characteristic period of time, giving as a result two vesicles or protocells with the same (initial) size, lifetime and metabolite concentration profile as the progenitor.
In terms of the growth control coefficient it is easy to prove that the steady condition takes place when γ = 1. Then, two general expressions for the temporal behaviour of the protocell surface and the protocell core volume have been independently derived [31] and an explicit relationship among different molecular and kinetic parameters (e.g., reaction rates vρ, permeability coefficients ℘i, metabolite concentrations [X]i) have been analytically derived for the protocell stationary reproduction:
where vL is the rate of lipid production, CC is the total internal concentration and Δmρ is total variation of the number of molecules due to the ρ-th reaction:
Equation (13) shows the deterministic condition for a stationary reproduction regime that results from the osmotic synchronization between membrane and core volume growth, i.e.: A spontaneous “self-regulation” driven by the osmotic balance across the protocell lipid bilayer. Equation (13) links metabolic kinetic constants and membrane permeabilities with the external and internal concentrations of the system constituents. Therefore, it represents a constraint for the possible sizes and division periods of stationary self-reproducing protocells. We have applied the general Equation (13) to the simplest case of a self-producing enzymatic vesicle (SPEV) represented in Figure 7. SPEV is a hypothetical protocell model where the production of lipid S takes place through the chemical transformation of a precursor molecule P, assumed to occur only in the presence of an additional compound E (i.e. an enzyme) encapsulated in the core volume. The S production generates also the waste W so that Δm = 1 and the osmotic synchronization can in principle takes place. Moreover, W is accumulated in the core volume since it is assumed not to be transported across the membrane, i.e. ℘W = 0. It is worthwhile to note that this model is very close to some experimental approaches based on giant vesicles that produce internally (with the help of a synthetic catalyst) the main membrane component and eventually undergo growth and division [37].
SPEV is not a full-fledged autopoietic vesicle since the catalytic specie E is not synthesized by the internal metabolism. Therefore after each vesicle division the number of E molecules will decrease until just one copy of this molecule is present in the internal core. As a consequence, whenever a division occurs only one of the two daughter vesicles will be able to encapsulate the catalyst molecule and, therefore, will keep the potential to continue growing, producing S and, eventually, dividing in two. The vesicle that contains that single molecule E, by default, will be taken as the mother vesicle, whereas the daughter (and all possible granddaughters) will be “sterile” vesicles. Thus, by using Equation (13) it was possible to predict [31] for the mother SPEV, i.e. the vesicle that keeps the only E molecule, its stationary radius R∞:
and the division time Δt∞:
where CC is the overall internal osmolite concentration, [P]Ex and ℘X are the external concentration and the membrane permeability of the lipid precursor respectively, while k is the kinetic constant of the lipid production: vL = k[E][P] = k[P]/(NAVC).
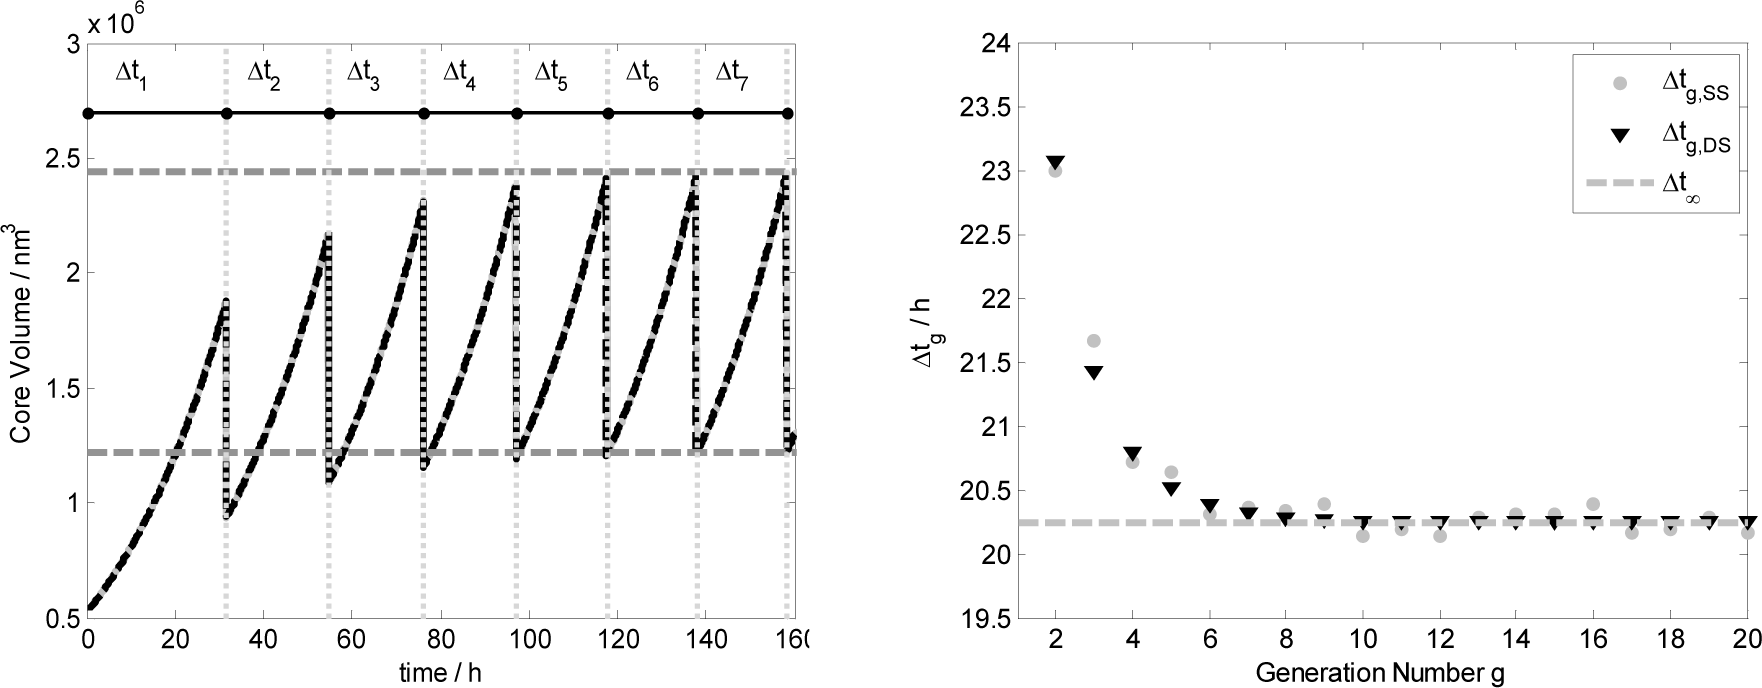
Figure 8 shows in the left plot the core volume time trend for the first seven generations, i.e. vesicle divisions, obtained both by ODE set integration (black line) and by stochastic simulations (gray lines). Vertical gray dotted lines represent the time of division that takes place when the reduced surface satisfied the splitting conditions: . Generation by generation the mother protocell tends to the stationary growth and division as illustrated by the left plot where the values of the vesicle volume before 2V∞ and after the division have been calculated with Equation (15). In the right plot it is reported the division time Δtg against the generation number, showing that generation by generation it tends to Δt∞ as predicted theoretically.
An important aspect to remark is that Equation (13), strictly speaking, only captures the condition for stationary reproduction in the sense of a global synchronization process between membrane and volume growth. In other words, it does not guarantee that when a vesicle reaches the division threshold the number of each internal constituent gets effectively doubled (with regard to its initial state in the protocell cycle). This becomes manifest in the case of SPEV, where the single enzyme/catalyst present in the mother is not doubled and, therefore cannot be transferred but to one of the offspring vesicles (i.e.: The only one that will remain fertile). Therefore, Equation (13) states a necessary but not sufficient condition for reliable reproduction of proto-cellular systems. In a more complex scenario, which will be introduced in the next section, the metabolic reaction network includes also the synthesis of the enzymatic/catalytic compound and the full reproduction of the entire protocell can be achieved. But the synchronization among lipid production, enzyme duplication and membrane division only emerges if the metabolic pathway(s) led to effective internal chemical synthesis (i.e. Δm>0), since the mechanism that drives the synchronization is the osmotic balance across the lipid bilayer. Moreover in this complex scenario stochastic fluctuations also affect the time behaviour of each single protocell significantly more, since they can strongly influence the distribution of enzymatic species between the two daughter vesicles.
3.3. A Minimal Cell Model: The Ribocell
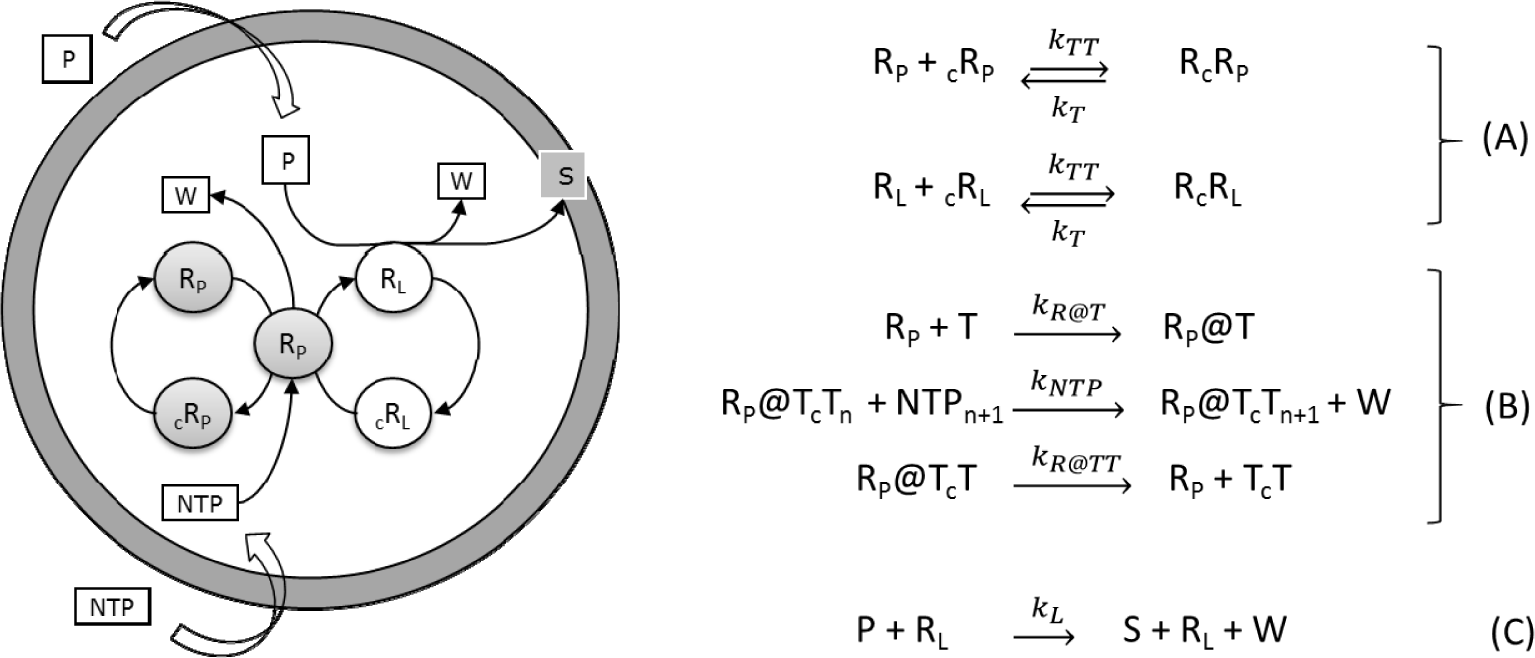
The so-called ribocell (RNA-based cell) is a theoretical minimal cell model based on a self-replicating minimum RNA genome coupled with a self-reproducing lipid vesicle compartment that has been recently hypothesized [36]. This model supposes the existence of two ribozymes, one (the lipid synthase RL) able to catalyse the conversion of molecular precursors (P) into lipids (S) and the second (the polymerase RP) able to replicate RNA strands by a template driven elongation. Therefore, in an environment rich in both lipid precursors (P) and activated nucleotides (NTPs), the ribocell can grow and self-reproduce if both processes, i.e. genome self-replication and membrane production are somehow synchronized, leading to a sustainable and recursive growth and division dynamics. Recently we have explored the feasibility of this hypothetical minimal cell [33] by determining the best external conditions to observe synchronization between genome self-replication and vesicle membrane reproduction, making use of a deterministic kinetic analysis, while the ribocell robustness to random fluctuations has been tested by stochastic simulations. The proposed metabolic mechanism is reported in Figure 9. Both pairs of RNA strands reversibly associate (A). The association is shifted towards the dimer formation and is strongly dependent on temperature. The replication of every RNA strand is catalysed by the polymerase RP according to the steps in bracket (B). This process is described as a catalytic template-directed addition of mononucleotides with high fidelity and processivity. It starts with RP binding any of the monomeric templates T (T=RP, cRP, RL and cRL) to form the complex R@T. This complex will then initiate the polymerization of the conjugate strand cT, by iteratively binding NTPs by means of specific Watson-Crick interactions, joining the nucleotides together to form the novel RNA strand cT, and releasing the by-product W. When the strand cT has been completely formed, the polymerase ribozyme releases the new dimer. Finally, the ribozyme RL catalyses the conversion of the precursor P into the lipid S (C). All the kinetic constants have been estimated by experimental values reported in literature and are listed in Table 1 along with references [38–43].
Thanks to a deterministic analysis [44,45], we showed that if the kinetic constant for lipid formation kL is in the range: 1.7·103 s−1M−1 ≤ kL ≤ 1.7·105 s−1M−1 then synchronization between vesicle reproduction and genome replication can spontaneously emerge under the model assumptions and kinetic parameters reported in Table 1. Deterministic calculations were performed for two ribozymes 20 bases long and showed that the ribocell reaches a stationary growth and division regime (γ = 1), where the cell size remains constant after each division along with the amount of genetic material. Although the observed cell life time stabilizes after the first 10 generations, it remains very high (about 80 days for all the kL values in the synchronization range), making the ribocell very hard to implement and study experimentally. Therefore, we investigated the robustness of the stationary growth and division regime of the ribocell in terms of the external substrate concentrations, vesicle size and initial ribozyme amount in order to define optimal external conditions for ribocell self-reproduction [33]. The influence of ribozyme length was also explored in the optimal external conditions by varying strand size from 20 to 200 bases in length and keeping all the other kinetic parameters constant. An RNA length of 20 bases is in fact the minimum length required to observe a folded RNA structures, i.e. a structure that can reasonably exhibit catalytic action. On the other hand, entities of about 200 nucleotides have been suggested as plausible ancient proto-ribosomes [46] even though, more recently, smaller subunits of 60 nucleotides have also been considered as plausible candidates [47]. Therefore, setting the RNA length of both ribozyme pairs to 100 bases, the deterministic analysis shows that starting from external concentrations [NTP]Ex = [P]Ex = 10−2M at the stationary regime the ribocell radius is 113.0 nm and the division time reduces to 68.2 days. The total number of RNA strands is 258 and the genome composition is quite uniform 25.2% (RL), 25.2% (cRL) 25.6% (RP), 24.0% (cRP). The stationary division regime can be reached starting from initial genome composition ranging from 1 to 100 dimers of RcRL and RcRP. In Figure 10, the deterministic time behaviour of the ribocell in optimal external conditions is reported.
Finally, the dependence of Δt25 (division time after 25 generations) on the kinetic constants for RNA dimer formation kTT and dissociation kT has been also studied. It turns out that the ribocell life cycle at stationary regimes does not depend explicitly on the absolute values of kinetic constants kSS and kS but on their ratio: kSS/kS, i.e., on the thermodynamic constant of RNA dimerization. The more thermodynamically stable the RNA dimers, the longer it takes to observe ribocell self-reproduction. For instance, if kSS/kS is decreased by two orders of magnitude, the ribocell life time reduces from 68.2 days to 6.4–11.8 days.
Stochastic simulations have also been performed in order to test the robustness of ribocells based on 100-base length ribozymes in optimal external conditions, with the aim of elucidating the role of intrinsic and extrinsic stochasticity on the time behaviour of a ribocells population. Simulations were executed by means of the parallel version of ENVIRONMENT [26], running 32 statistically equivalent simulations of a 10-ribocell solution on different CPUs. Therefore, the outcomes were obtained as averages from a population of 320 vesicles. Kinetic parameters used for simulations are those reported in Table 1. At each cell division, only one of the two offspring was kept while the other was discarded in order to reduce computation time, thus keeping the number of monitored vesicles constant. This is in agreement with the assumption that the external concentrations of all substrates are fixed due to an incoming flux of material, i.e. the substrates can never be exhausted. The simulation outcomes are reported on the left of Figure 11 where the composition of the ribocell population is reported against time. In fact, during simulations at each division the genetic material is randomly distributed between the daughters. If the amount of genetic material is very low, then this can result in a separation of RP from the other RNA strands. In fact, the ribocell must contain a minimum genetic kit of three RNA filaments in order to be capable of self-replicating its entire genome: one RP that catalyzes the RNA base pair transcription, one (RL or cRL) and one (RP or cRP) that work as templates for the transcription. Moreover, since RL is necessary to catalyze lipid precursor conversion, the optimal minimal 3-ribozyme “kit” must be made up of 2RP and one RL. This minimum kit should be at least doubled before cell division, in order to have a chance that both daughters continue to be active. Therefore, if a random distribution of RNA filaments takes place after vesicle division, ribozyme segregation between the two daughters might occur. Different scenarios can be envisaged: death by segregation is reached if vesicles are produced without any ribozymes (empty vesicles), or are produced containing one lone RP, or many filaments of cRP and/or cRL (inert vesicles). Vesicles that encapsulate RL strands are self-producing as defined in his work: they are able to synthesize lipids and then can grow and divide producing in turn self-producing and/or empty vesicles. On the other hand, vesicles containing more than one molecule of RP or both RP and cRP filaments are able to self-replicate this reduced genome (self-replicating genome vesicles) but they cannot self-reproduce the membrane. So their fate is an osmotic burst due to an unbalanced increase in waste concentration. Finally, a reduced version of the Ribocell consists in a lipid aggregate that contains one RP filament and RL/cRL strands. As a consequence of this, reduced ribocells are able to replicate the RL/cRL genetic material, and at the same time are able to synthesize lipids. Therefore, they can grow and divide, producing in turn at least one reduced ribocell and/or self-producing, inert and empty vesicle.
On the right of Figure 11 a schematic drawing of the different types of protocells is reported. At the end of the simulation, the composition of the protocell population consist of low percentages of still fully functioning ribocells (6.7%) while the most populated fractions are those of empty (40.0%) self-producing (33.3%) and broken (20.0%) vesicles, respectively. Reduced ribocells are only present in the first generations since they very soon decay into self-producing and empty vesicles. Inert vesicles, i.e. vesicles entrapping free chains of cRP and/or cRL or a single RP, are not formed and this can be ascribed to the high stability of RNA dimers and complexes (i.e. the chance of finding free RNA monomers at the time of vesicle division is extremely improbable). Indeed, the stochastic time trend presents a very irregular time behaviour compared to the deterministic one that describes a highly synchronized oscillating regime of growth and division. In contrast, stochastic simulations highlight the alternation of dormant phases, where the reduced surface remains practically constant (both the core volume and the membrane surface being constant, data not shown), to very active steps where ribocell growth takes place very fast, leading to a division event. The fast growth and division step corresponds to the presence of a free RL chain in the vesicle core while, in the dormant phase, ribozymes are all coupled in the form of dimers or complexes. As a consequence, self-producing vesicles with a genome made up only of RL monomers can reproduce very efficiently since no dormant phase can occur, given that the formation of RcRL dimers is impossible. These protocells can then self-produce very efficiently, with a Δt less than one day.
In conclusion, the simulation outcomes show that ribocells are not robust enough to survive to random fluctuations. In fact only about the 5%–7% of the initial population survive as full ribocells after 15–25 generations and on a longer time frame they too are destined for extinction. Furthermore, the time course of each single protocell is also greatly influenced by intrinsic stochasticity in particular by the time fluctuations of the RNA dimer dissociation. In fact, when all the RNA strands are associated in dimers, protocells remain in a dormant phase, whereas free RL monomers induce fast growth and division steps and free RP filaments cause the fast RNA replication without changing the vesicle size appreciably. Therefore these two processes are synchronized only by chance and this also represents a reason of weakness of this model protocell. To improve this behaviour, one possibility could be to increase the working temperature in order to facilitate the dimers dissociation and increase the concentration of the free catalysers RL and RP. For further details the reader is addressed to [33,44–45].
4. Conclusions
In this short review we have presented and discussed some aspects of theoretical modelling in micro-compartmentalized systems, in particular by discussing our recent research on self-reproducing protocells. The occurrence of compartmentalized synthetic reactions coupled with the membrane dynamics (in terms of growth and division) plays a major role in determining the evolution of these kinds of chemically reacting systems.
We started by comparing the deterministic and stochastic approaches for modelling such systems, and reviewed how these methodologies can be applied to describe: (1) homeostatic autopoietic systems, (2) the stationary conditions for protocell self-reproduction, and (3) the more complex case of the “ribocell”. In all the studied cases we have shown how the deterministic and the stochastic approaches can be used together for better understanding the system dynamics: the first gives information on the average time behaviour of the protocells population whereas the second elucidates the role of randomness.
In the case of homeostatic autopoietic vesicles, stochastic simulations have elucidated the role of random fluctuations that mainly affect the size distribution of aggregates in homeostatic conditions by selecting vesicles over an aggregation number threshold, since these vesicles are the most robust with respect to randomness of the surfactant degradation events. On the other hand, in the second case studied a deterministic general formula, the osmotic synchronization law, has been introduced in order to predict the occurrence of a protocell stationary self-production regime. It should be clear that this formula is strictly valid only for the assumptions inherent in our modelling approach and as such, this formula will be applicable to real-world vesicle systems only when the assumptions of our model are satisfied.
The more complex case of ribocells was then described. The ribocell is a hypothetical model of a true MAC since in principle it could exhibit the traits of Darwinian evolution. Here the attention focused on the capability of self-reproduction, i.e. the possibility of synchronization between membrane self-production and the genome self-replication. Deterministic analysis leads to the definition of optimal conditions for observing the occurrence of a stationary self-reproduction regime. Stochastic simulations performed in optimal conditions showed that the expected synchronization between the genome and membrane dynamics is highly affected by random fluctuations. As a consequence of this, the expected synchronization occurs only by chance and the behaviour of a Ribocells population is very far from that predicted deterministically, so that, generation by generation, a plethora of protocells—each one differing in the genetic material inherited from the mother—can be generated, and the initial ribocell population eventually dies through ribozymes segregation.
Are these models realistic? That is, do they have experimental counterparts? The first example (homeostatic autopoietic vesicles) was indeed realized in the laboratory by using simple chemical reactions to produce and degrade the vesicle constituents, which were fatty acids [12]. The second study is instead purely theoretical and awaits possible experimental verification. The third model, which was in turn based on a hypothesis [36], also misses an in vitro model for a direct investigation of the time behaviour emerging from our simulations.
From these considerations comes the question on how to progress in vitro, towards (bio)chemical MAC models of increasing complexity. Several groups are currently involved in these pioneering attempts, following modern synthetic biology approaches for designing and assembling synthetic compartments. Previous work shows that the technology is already quite mature [8], also for the biochemical synthesis of lipids [48]. The recent introduction of the so-called “droplet transfer” method is quite promising in this respect [49] (Carrara et al. manuscript in preparation), as well as its combination with microfluidic technologies [50]. This method allows a facile encapsulation of several macromolecules inside a single compartment—a phenomenon that is generally hindered by the adverse statistics of co-encapsulation [51,52]. Anchoring enzymes to a scaffold polymer [53] might also help the co-encapsulation of all required molecules to reconstitute biochemical paths (possibly taking advantage of enzyme proximity). Clearly, when more complex networks are reconstituted inside autopoietic or non-autopoietic vesicles, more sophisticated, and possibly stochastic biochemical models are required [54].
In conclusion, we would like to emphasize the common aspects of analysis and modelling of these (and other) systems, namely the need for a systemic approach that integrates (and couples) the internal reactions, the membrane dynamics, and the environment. This is perhaps the most important scientific message that emerges from numerical simulations of these complex systems. Since numerical modelling is carried out using true physical constants for all elementary molecular steps, it follows that simulation outcomes could provide quantitative data to guide experimentalists in the design and the construction of protocells or artificial cells for nano-technological applications. Finally, as demonstrated in this review, the use of stochastic modelling in conjunction with deterministic approaches can uniquely reveal intriguing dynamics in micro-compartmentalized complex multi-molecular systems and greatly helps to evaluate and understand basic mechanisms at the roots of biological behaviour.
Acknowledgments
We are very grateful to Kepa Ruiz-Mirazo for his collaboration in the past years and to MIUR that granted this research (PRIN 2010/11 2010BJ23MN_003).
PACS Codes: 87.16.A, 87.16.D, 87.16.dj
Author Contributions
Mavelli is the lead author of this line of research who has collaborated with Stano and Cassidei for specific topics, while Altamura is a young Ph.D. student who joined the group recently. All these authors have participated equally in writing the paper.
Conflicts of Interest
The authors declare no conflict of interest.
References
- Walde, P. Prebiotic Chemistry from Simple Amphiphiles to Model Protocells. Topics in Current Chemistry; Springer: Berlin, Germany, 2005. [Google Scholar]
- Chen, I.; Walde, P. From Self-Assembled Vesicles to Protocells. Cold Spring Harb. Perspect. Biol 2010, 2, a002170. [Google Scholar]
- Luisi, P.L.; Ferri, F.; Stano, P. Approaches to semi-synthetic minimal cells a review. Naturwissenschaften 2006, 93, 1–13. [Google Scholar]
- Luisi, P.L.; Stano, P. The Minimal Cell: The Biophysics of Cell Compartment and the Origin of Cell Functionality; Springer: Berlin, Germany, 2011. [Google Scholar]
- Noireaux, V.; Maeda, Y.T.; Libchaber, A. Development of an artificial cell, from self-organization to computation and self-reproduction. Proc. Natl. Acad. Sci. USA 2011, 108, 3473–3480. [Google Scholar]
- Solé, R.V.; Munteanu, A.; Rodriguez-Caso, C.; Macía, J. Synthetic protocell biology from reproduction to computation. Phil. Trans. R. Soc. B 2007, 362, 1727–1739. [Google Scholar]
- Varela, F.J.; Maturana, H.R.; Uribe, R. Autopoiesis: The organization of living systems, its characterization and a model. Biosystems 1974, 5, 187–196. [Google Scholar]
- Stano, P.; Carrara, P.; Kuruma, Y.; Souza, T.; Luisi, P.L. Compartmentalized reactions as a case of soft-matter biotechnology: Synthesis of proteins and nucleic acids inside lipid vesicles. J. Mat. Chem 2011, 21, 18887–18902. [Google Scholar]
- Bachmann, P.A.; Walde, P.; Luisi, P.L.; Lang, J. Self-replicating reverse micelles and chemical autopoiesis. J. Am. Chem. Soc 1990, 112, 8200–8201. [Google Scholar]
- Bachmann, P.A.; Luisi, P.L.; Lang, J. Autocatalytic self-replicating micelles as models for prebiotic structures. Nature 1992, 357, 57–59. [Google Scholar]
- Walde, P.; Wick, R.; Fresta, M.; Mangone, A.; Luisi, P.L. Autopoietic self-reproduction of fatty-acid vesicles. J. Am.Chem. Soc 1994, 116, 11649–11654. [Google Scholar]
- Zepik, H.H.; Blöchliger, E.; Luisi, P.L. A chemical model of homeostasis. Angew. Chem. Int. Ed. Engl 2001, 40, 199–202. [Google Scholar]
- Ruiz-Mirazo, K. Protocell. In Encyclopedia of Astrobiology; Gargaud, M., Amils, R., Quintanilla, J.C., Cleaves, H.J., II, Irvine, W.M., Pinti, D.L., Viso, M., Eds.; Springer: Heidelberg, Germany, 2011; Volume 3, pp. 1353–1354. [Google Scholar]
- Albertsen, A.N.; Monnard, P.A. Lipid Protocells. In Encyclopedia of Biophysics; Roberts, G.C.K., Ed.; Springer: Berlin, Germany, 2013; pp. 1280–1286. [Google Scholar]
- Rasmussen, S., Bedau, M.A., Chen, L., Deamer, D., Krakauer, D.C., Packard, N.H., Stadler, P.F., Eds.; Protocells, Bridging Nonliving and Living Matter; MIT Press: Cambridge, MA, USA, 2009.
- Coveney, P.V.; Wattis, J.A.D. Becker–Döring model of self-reproducing vesicles. J. Chem. Soc. Faraday Trans 1998, 94, 233–246. [Google Scholar]
- Bolton, C.D.; Wattis, J.A.D. The size-templating matrix effect in vesicle formation I: A microscopic model and analysis. J. Phys. Chem. B 2003, 107, 7126–7134. [Google Scholar]
- Bolton, C.D.; Wattis, J.A.D. The size-templating matrix effect in vesicle formation II: A macroscopic models and analysis. J. Phys. Chem. B 2003, 107, 14306–14318. [Google Scholar]
- Bozic, B.; Svetina, S. A relationship between membrane properties forms the basis of a selectivity mechanism for vesicle self-reproduction. Eur. Biophys. J 2004, 33, 565–571. [Google Scholar]
- Bozic, B.; Svetina, S. Vesicle self-reproduction: The involvement of membrane hydraulic and solute permeabilities. Eur. Phys. J. E 2007, 24, 79–90. [Google Scholar]
- Fanelli, D.; McKane, A. Thermodynamics of vesicle growth and instability. Phys. Rev. E 2008, 78, 051406. [Google Scholar]
- Surovtsev, I.V.; Morgan, J.J.; Lindahl, P.A. Whole-cell modeling framework in which biochemical dynamics impact aspects of cellular geometry. J. Theor. Biol 2007, 244, 154–166. [Google Scholar]
- Surovtsev, I.V.; Zhang, Z.; Lindahl, P.A.; Morgan, J.J. Mathematical modeling of a minimal protocell with coordinated growth and division. J. Theor. Biol 2009, 260, 422–429. [Google Scholar]
- Macıa, J.; Solé, R.V. Synthetic Turing protocells: self-reproducing vesicles through symmetry-breaking instabilities. Philos. Trans. R. Soc. B 2007, 362, 1821–1829. [Google Scholar]
- Macıa, J.; Solé, R.V. Protocell self-reproduction in a spatially explicit metabolism-vesicle system. J. Theor. Biol 2007, 245, 400–410. [Google Scholar]
- Mavelli, F.; Ruiz-Mirazo, K. ENVIRONMENT: a computational platform to stochastically simulate reacting and self-reproducing lipid compartments. Phys. Biol 2011, 7, 036002. [Google Scholar]
- Mavelli, F.; Piotto, S. Stochastic simulations of homogeneous chemically reacting systems. J. Mol. Struct 2006, 771, 55–64. [Google Scholar]
- Mavelli, F.; Ruiz-Mirazo, K. Stochastic simulations of minimal self-reproducing cellular systems. Phil. Trans. R. Soc. B 2007, 362, 1789–802. [Google Scholar]
- Mavelli, F.; Ruiz-Mirazo, K. Stochastic simulations of fatty-acid proto-cell models. In Noise and Fluctuations in Biological, Biophysical, and Biomedical Systems; Bezrukov, S.M., Ed.; SPIE: Washington, DC, USA, 2007; Volume 6602, pp. 1B1–1B10. [Google Scholar]
- Stano, P.; Wehrli, E.; Luisi, P.L. Insights into the self-reproduction of oleate vesicles. J. Phys Condens. Matter 2006, 18, 2231–2238. [Google Scholar]
- Mavelli, F.; Ruiz-Mirazo, K. Theoretical conditions for the stationary reproduction of model protocells. Int. Biol 2013, 5, 324–341. [Google Scholar]
- Gillespie, D.T. Stochastic simulation of chemical kinetics. Annu. Rev. Phys. Chem 2007, 58, 35–55. [Google Scholar]
- Mavelli, F. Stochastic simulations of minimal cells: the Ribocell model. BMC Bioinformat 2012, 13, S10. [Google Scholar]
- Ruiz-Mirazo, K.; Mavelli, F. On the way towards ‘basic autonomous agents’ stochastic simulations of minimal lipid-peptide cells. BioSystems 2008, 91, 374–387. [Google Scholar]
- Mavelli, F.; Stano, P. Kinetic models for autopoietic chemical systems role of fluctuations in homeostatic regime. Phys. Biol 2010, 7, 016010. [Google Scholar]
- Szostak, J.W.; Bartel, D.P.; Luisi, P.L. Synthesizing life. Nature 2001, 409, 387–390. [Google Scholar]
- Takakura, K.; Toyota, T.; Sugawara, T. A Novel System of Self-Reproducing Giant Vesicles. J. Am. Chem. Soc 2003, 125, 8134–8140. [Google Scholar]
- Christensen, U. Thermodynamic and kinetic characterization of duplex formation between 2′-O, 4′-C-Methylene-modified oligoribonucleotides, DNA and RNA. Biosci. Rep 2007, 27, 327–333. [Google Scholar]
- Tsoi, P.Y.; Yang, M. Kinetic study of various binding modes between human DNA polymerase β and different DNA substrates by surface-plasmon-resonance biosensor. Biochem. J 2002, 361, 317–325. [Google Scholar]
- Stage-Zimmermann, T.K.; Uhlenbeck, O.C. Hammerhead ribozyme kinetics. RNA 1998, 4, 875–889. [Google Scholar]
- De, Frenza. A. Stochastic Simulations of Non-enzymatic Template-Directed RNA Synthesis Inside Model Protocells; Internal Technical Report; Chemistry Department, University of Bari: Bari, Italy, 2009. [Google Scholar]
- Mansy, S.S.; Schrum, J.P.; Krishnamurthy, M.; Tobé, S.; Treco, D.A.; Szostak, J.W. Template-directed synthesis of a genetic polymer in a model protocell. Nature 2008, 454, 122–U10. [Google Scholar]
- Sacerdote, M.G.; Szostak, J.W. Semipermeable lipid bilayers exhibit diastereoselectivity favoring ribose. Proc. Natl. Acad. Sci. USA 2005, 102, 6004–6008. [Google Scholar]
- Mavelli, F.; Della Gatta, P.; Cassidei, G.; Luisi, P.L. Could the Ribocell be a Feasible Proto-cell Model? Orig. Life. Evol. Biosph 2010, 40, 459–464. [Google Scholar]
- Mavelli, F. Theoretical Approaches to Ribocell Modeling. In Minimal Cell; Luisi, P.L., Stano, P., Eds.; Springer: Dordrecht, Germany, 2011; pp. 255–273. [Google Scholar]
- Smith, T.F.; Lee, J.C.; Gutell, R.R.; Hartman, H. The origin and evolution of the ribosome. Biol. Direct 2008, 3, 16–24. [Google Scholar]
- Agmon, I. The Dimeric Proto-Ribosome: Structural Details and Possible Implications on the Origin of Life. Int. J. Mol. Sci 2009, 10, 2921–2934. [Google Scholar]
- Kuruma, Y.; Stano, P.; Ueda, T.; Luisi, P.L. A synthetic biology approach to the construction of membrane proteins in semi-synthetic minimal cells. Biochim. Biophys. Acta 2009, 1788, 567–574. [Google Scholar]
- Pautot, S.; Frisken, B.J.; Weitz, D.A. Engineering asymmetric vesicles. Proc. Natl. Acad. Sci. USA 2003, 100, 10718–10721. [Google Scholar]
- Matosevic, S. Synthesizing artificial cells from giant unilamellar vesicles: State-of the art in the development of microfluidic technology. Bioessays 2012, 34, 992–1001. [Google Scholar]
- Souza, T.; Stano, P.; Luisi, P.L. The minimal size of liposome-based model cells brings about a remarkably enhanced entrapment and protein synthesis. ChemBioChem 2009, 10, 1056–1063. [Google Scholar]
- Luisi, P.L.; Allegretti, M.; Souza, T.; Steineger, F.; Fahr, A.; Stano, P. Spontaneous protein crowding in liposomes: A new vista for the origin of cellular metabolism. ChemBioChem 2010, 11, 1989–1992. [Google Scholar]
- Grotzky, A.; Altamura, E.; Adamcik, J.; Carrara, P.; Stano, P.; Mavelli, F.; Nauser, T.; Mezzenga, R.; Schlüter, A.D.; Walde, P. Structure and enzymatic properties of molecular dendronized polymer-enzyme conjugates and their entrapment inside giant vesicles. Langmuir 2013, 29, 10831–10840. [Google Scholar]
- Calviello, L.; Stano, P.; Mavelli, F.; Luisi, P.L.; Marangoni, R. Quasi-cellular systems: Stochastic simulation analysis at nanoscale range. BMC Bioinformat 2013, 14, S7. [Google Scholar]


| Kinetic Parameters | Values | Ref. |
|---|---|---|
| KTT[s−1M−1] | 8.8 × 10⁶ | [38] |
| KT[s−1] | 2.2 × 10⁻⁶ | [38] |
| kR@T[s−1M−1] | 5.32 × 10⁵ | [39] |
| kR@TT[s−1] | 9.9 × 10⁻³ | [39] |
| kNTP[s−1M−1] | 0.113 | [41,42] |
| kL [s−1M−1] | 1.7 × 10³ | [40] |
| kin [dm2s−1] | 7.6 × 10¹⁹ | [26] |
| kout [dm2s−1] | 7.6 × 10⁻² | [26] |
| ℘P [cm·s−1] | 4.2 × 10⁻⁹ | |
| ℘NTP [cm·s−1] | 1.9 × 10⁻¹¹ | [41,42] |
| ℘W=℘T | 0.0 | |
| ℘aq[cm·s−1] | 1.0 × 10⁻³ | [43] |
* kL is 105 times larger than the value of the splicing reaction, catalyzed by the hammerhead ribozyme.
© 2014 by the authors; licensee MDPI, Basel, Switzerland This article is an open access article distributed under the terms and conditions of the Creative Commons Attribution license (http://creativecommons.org/licenses/by/3.0/).
Share and Cite
Mavelli, F.; Altamura, E.; Cassidei, L.; Stano, P. Recent Theoretical Approaches to Minimal Artificial Cells. Entropy 2014, 16, 2488-2511. https://doi.org/10.3390/e16052488
Mavelli F, Altamura E, Cassidei L, Stano P. Recent Theoretical Approaches to Minimal Artificial Cells. Entropy. 2014; 16(5):2488-2511. https://doi.org/10.3390/e16052488
Chicago/Turabian StyleMavelli, Fabio, Emiliano Altamura, Luigi Cassidei, and Pasquale Stano. 2014. "Recent Theoretical Approaches to Minimal Artificial Cells" Entropy 16, no. 5: 2488-2511. https://doi.org/10.3390/e16052488