
Multiscale Entropy Analysis on Human Operating Behavior

1
Key Laboratory of Image Processing & Intelligent Control of Education Ministry, Wuhan 430074, China
2
School of Automation, Huazhong University of Science and Technology, Wuhan 430074, China
3
School of Computer and Information Science, Hubei Engineering University, Xiaogan 432100, China
4
School of Physics, Huazhong University of Science and Technology, Wuhan 430074, China
*
Author to whom correspondence should be addressed.
Entropy 2016, 18(1), 3; https://doi.org/10.3390/e18010003
Submission received: 20 September 2015
/
Revised: 29 November 2015
/
Accepted: 7 December 2015
/
Published: 22 December 2015
(This article belongs to the Special Issue Multiscale Entropy and Its Applications in Medicine and Biology)
Abstract
:By exploiting the statistical analysis method, human dynamics provides new insights to the research of human behavior. In this paper, we analyze the characteristics of the computer operating behavior through a modified multiscale entropy algorithm with both the interval time series and the number series of individuals’ operating behavior been investigated. We also discuss the activity of individuals’ behavior from the three groups denoted as the retiree group, the student group and the worker group based on the nature of their jobs. We find that the operating behavior of the retiree group exhibits more complex dynamics than the other two groups and further present a reasonable explanation for this phenomenon. Our findings offer new insights for the further understanding of individual behavior at different time scales.
1. Introduction
The concept of human dynamics [1,2] has attracted increasing research interest since it was first proposed in 2005. Distinct from research about human behavior, human dynamics extracts statistical regularities by analyzing a large number of behavioral data and establishing behavior dynamic model on the basis of the statistical results [3,4]. The heavy-tail interval time distribution is the most ubiquitous characteristic observed in various human behaviors, including E-mail communication [1,3,5], mobile communication [6], and online activities [7,8,9]. Several candidate dynamical mechanisms of temporal bursts in human behavior have been proposed, which provide a good comprehension of the behavior patterns. Deeper understanding of human behavior may offer great benefits to the interpretation of complex socio-economic phenomena.
Multiscale Entropy (MSE), proposed by Costa [10], has been used successfully in analyzing the complexity of various signals, such as EEG signals [11,12], ECG signals [13], laser Doppler flowmetry time series [14] and human behavior time series [8,9]. The MSE algorithm is composed of two procedures, namely (1) a coarse-gained procedure of dividing the original time series into non-overlapping subsequences on the basis of different time scales; and (2) a computation procedure of calculating the sample entropy for each coarse-grained time series. However, the coarse-gained procedure results in a short time series which lead to imprecise estimation of sample entropy or even undefined entropy values [15,16]. To overcome this drawback, Wu et al. [17] proposed the modified MSE (MMSE) algorithm in which a moving-averaged procedure replace the coarse-gained procedure and a time delay is introduced to acquire a more accurate estimation of sample entropy. The MMSE has been applied successfully in measuring the complexity of short-term bearing fault time series. Moreover, features extracted by the MMSE algorithm can improve the accuracy of bearing fault detection.
In this paper, we investigate the statistical characteristics of the computer operating behavior of individuals from three user groups by MMSE analysis and activity analysis. Individuals of the three groups denoted as the retiree group, the student group and the worker group, are selected randomly from the original dataset based on the nature of their jobs. With both the interval time series and the operation-number series of the individuals taken into account, we apply the MMSE analysis to quantify the dynamical complexity of individual behavior for the three groups. The activity analysis was also conducted to further study the dynamic properties of the operating behavior.
2. Methods and Data Description
The MMES algorithm consists of the following two steps:
- A moving-averaging procedure, also known as the coarse-gained procedure, denoted as:where is the original time series, and represents the moving-averaged time series at time scale .
- The computation of sample entropy for the moving-averaged time series at time scale :
The sample entropy algorithm used here is the revised version developed by Govindan [18] with the introduced time delay factor enabling the better characterization of the complexity of the system than the original definition put forth in [19]. In our numerical experiment, the parameters are chosen as m = 2 and r = 0.15 of the time series’ standard deviations.
The dataset used in this paper is obtained from China Internet Data Platform [20]. It consists of four-week computer operating logs collected from 1000 users. The operating window denoted by the focus window is sampled every two seconds. A log, including the timestamp, name, process number and content of the focus window will be produced if the focus window changes. The total 23,137 TXT files in the dataset keep track of all 1000 users’ computer operations during the four weeks, with each TXT file corresponding to a single user’s operations from a boot to shutdown in a given day. The demographic information of all users is also recorded in a CSV file.
We classify the whole set of 1000 users with ages ranging from 11 to 73 into three categories based on the nature of their jobs, as the retirees, the workers and the students. The individuals for analysis are chosen randomly from each category with a sample ratio near 10%. In particular, all of the retirees are included as the retiree group because it contains only 1.1% of the whole population. In addition, only undergraduate and graduate students are selected from the student category as the student group based consideration of the continuity and stability of operating behavior, while individuals from three types of jobs within the worker category, that is, government institution staff, professional technicians and enterprise staff are selected to form the worker group. Therefore, the data applied in our numerical experiment consist of 2376 TXT files collected from 92 individuals, which include: (a) 11 individuals in the retiree group: 10 men and one woman, aged 63.2 3.97 years (mean SD), range 60–73 years; (b) 59 individuals in the worker group: 47 men and 12 women, aged 32.5 7.47 years (mean SD), range 22–57 years; and (c) 22 individuals in the student group, 12 men and 10 women, aged 24.5 2.52 years (mean SD), range 20–31 years. The worker group consists of three kinds of users, which are the government institution staff (15 individuals, aged 34.5 7.03 years (mean SD), range 27–57 years), the professional technicians (15 individuals, aged 35.2 8.96 years (mean SD), range 22–50 years) and the enterprise staff (29 individuals, aged 30.1 6.26 years (mean SD), range 22–48 years).
In this paper, we focus on the individual behavior during the whole four-week sampling period. Two kinds of time series of operating behavior, the interval time series and the operation-number time series, are contained in our experimental analysis. The interval time refers to the time between two consecutive behaviors, while the operation-number is the total number of operating behaviors per unit time. The daily interval time series can be extracted by applying the first order difference to the original timestamp series of operating recorded in TXT file. In order to obtain the operation-number series, we first span the original timestamps of operation behaviors to the full day timeline, i.e., a total of 86,400 s. Considering the sampling interval (2 s) and the sparsity of operations in a full day, we establish the daily operation-number series by counting the number of operations in every 30 s. In contrast to the interval time series, the daily operation-number time series from all the users have the same size.
3. Results and Anlysis
3.1. MMSE Analysis on the Three Groups
Figure 1 shows the daily interval time series and the operation-number series of a user randomly chosen from the worker group during a week. We note that the lengths of the daily interval time series vary over a long range, from 199 to 2027.
Here we should mention that although the MMSE algorithm is less affected by the sequence length than the MSE algorithm, it still provides an inaccurate estimation when the length of time series is less than 500. Thus, to overcome this issue, we only analyze the daily interval time series with lengths larger than 500. Also, only the operation-number series corresponding to those long interval time series are taken into account. We first calculate the MMSE values of the daily interval time series and the operation-number series of each individual during the four-week sample period and then combine the MMSE values of each individual belonging to the same group. The MMSE analysis of the daily interval time series and the operation-number series are plotted in Figure 2 and Figure 3, respectively. The error bar and symbol at each scale represent the SD and the mean value of the MMSE values calculated from all individuals in each group.
We note that the MMSE values of the daily interval time series are obviously higher than that of the daily operation-number series. This is due to the long period of zero values in the beginning and the end of the daily operation-number series. Also, the mean values of all three groups’ MMSE values in Figure 2 and Figure 3 gradually increase with the growth of the time scale. We think this is caused by the coarse-grained procedure, which progressively eliminates a lot of zero-values in the daily operation-number series and the same values in the daily interval time series such that the MMSE values increase versus the time scale. For all time scales the MMSE values of the daily interval time series from the retiree group are significantly higher than that from the student group (p < 0.05, Mann-Whitney-Wilcoxon test (MWW test)) and the worker group (p < 0.05, MWW test) as shown in Figure 2. However, the MMSE values of the daily operation-number series of the retiree group are significantly higher than that of the student group (p < 0.05, MWW test) only for time scale less than 4 and the worker group (p < 0.05, MWW test) for time scale less than 12, as implied in Figure 3. These findings imply that the operating behavior of the retirees is the most complex compared with the other two groups on small time scales.
Figure 1.
(a) Daily interval time series of operating behavior from an individual chosen randomly from the worker group during a week; (b) Daily operation-number series from the same individual during the same week.
Figure 1.
(a) Daily interval time series of operating behavior from an individual chosen randomly from the worker group during a week; (b) Daily operation-number series from the same individual during the same week.

Figure 2.
MMSE analysis of daily interval time series from the three groups.

Figure 3.
MMSE analysis of daily operation-number series from the three groups.

In addition, we find no significant difference in the MMSE values of the daily operation-number series between the worker group and the student group (p > 0.05, MWW test). Only for time scale between 17 and 38, the MMSE values of the daily interval time series from the worker group are significant higher than those from the student group (p < 0.05, MWW test). It is noted that the burstiness of human behavior, characterized by active behaviors concentrated on a short period followed by a long period of inactivity, brings about a few very long time intervals (see Figure 1a) which may dramatically affect the MMSE values as illustrated in [13]. Thus it is hard to claim that there exists distinction of complex dynamic of operating behaviors from those two groups based on the above results.
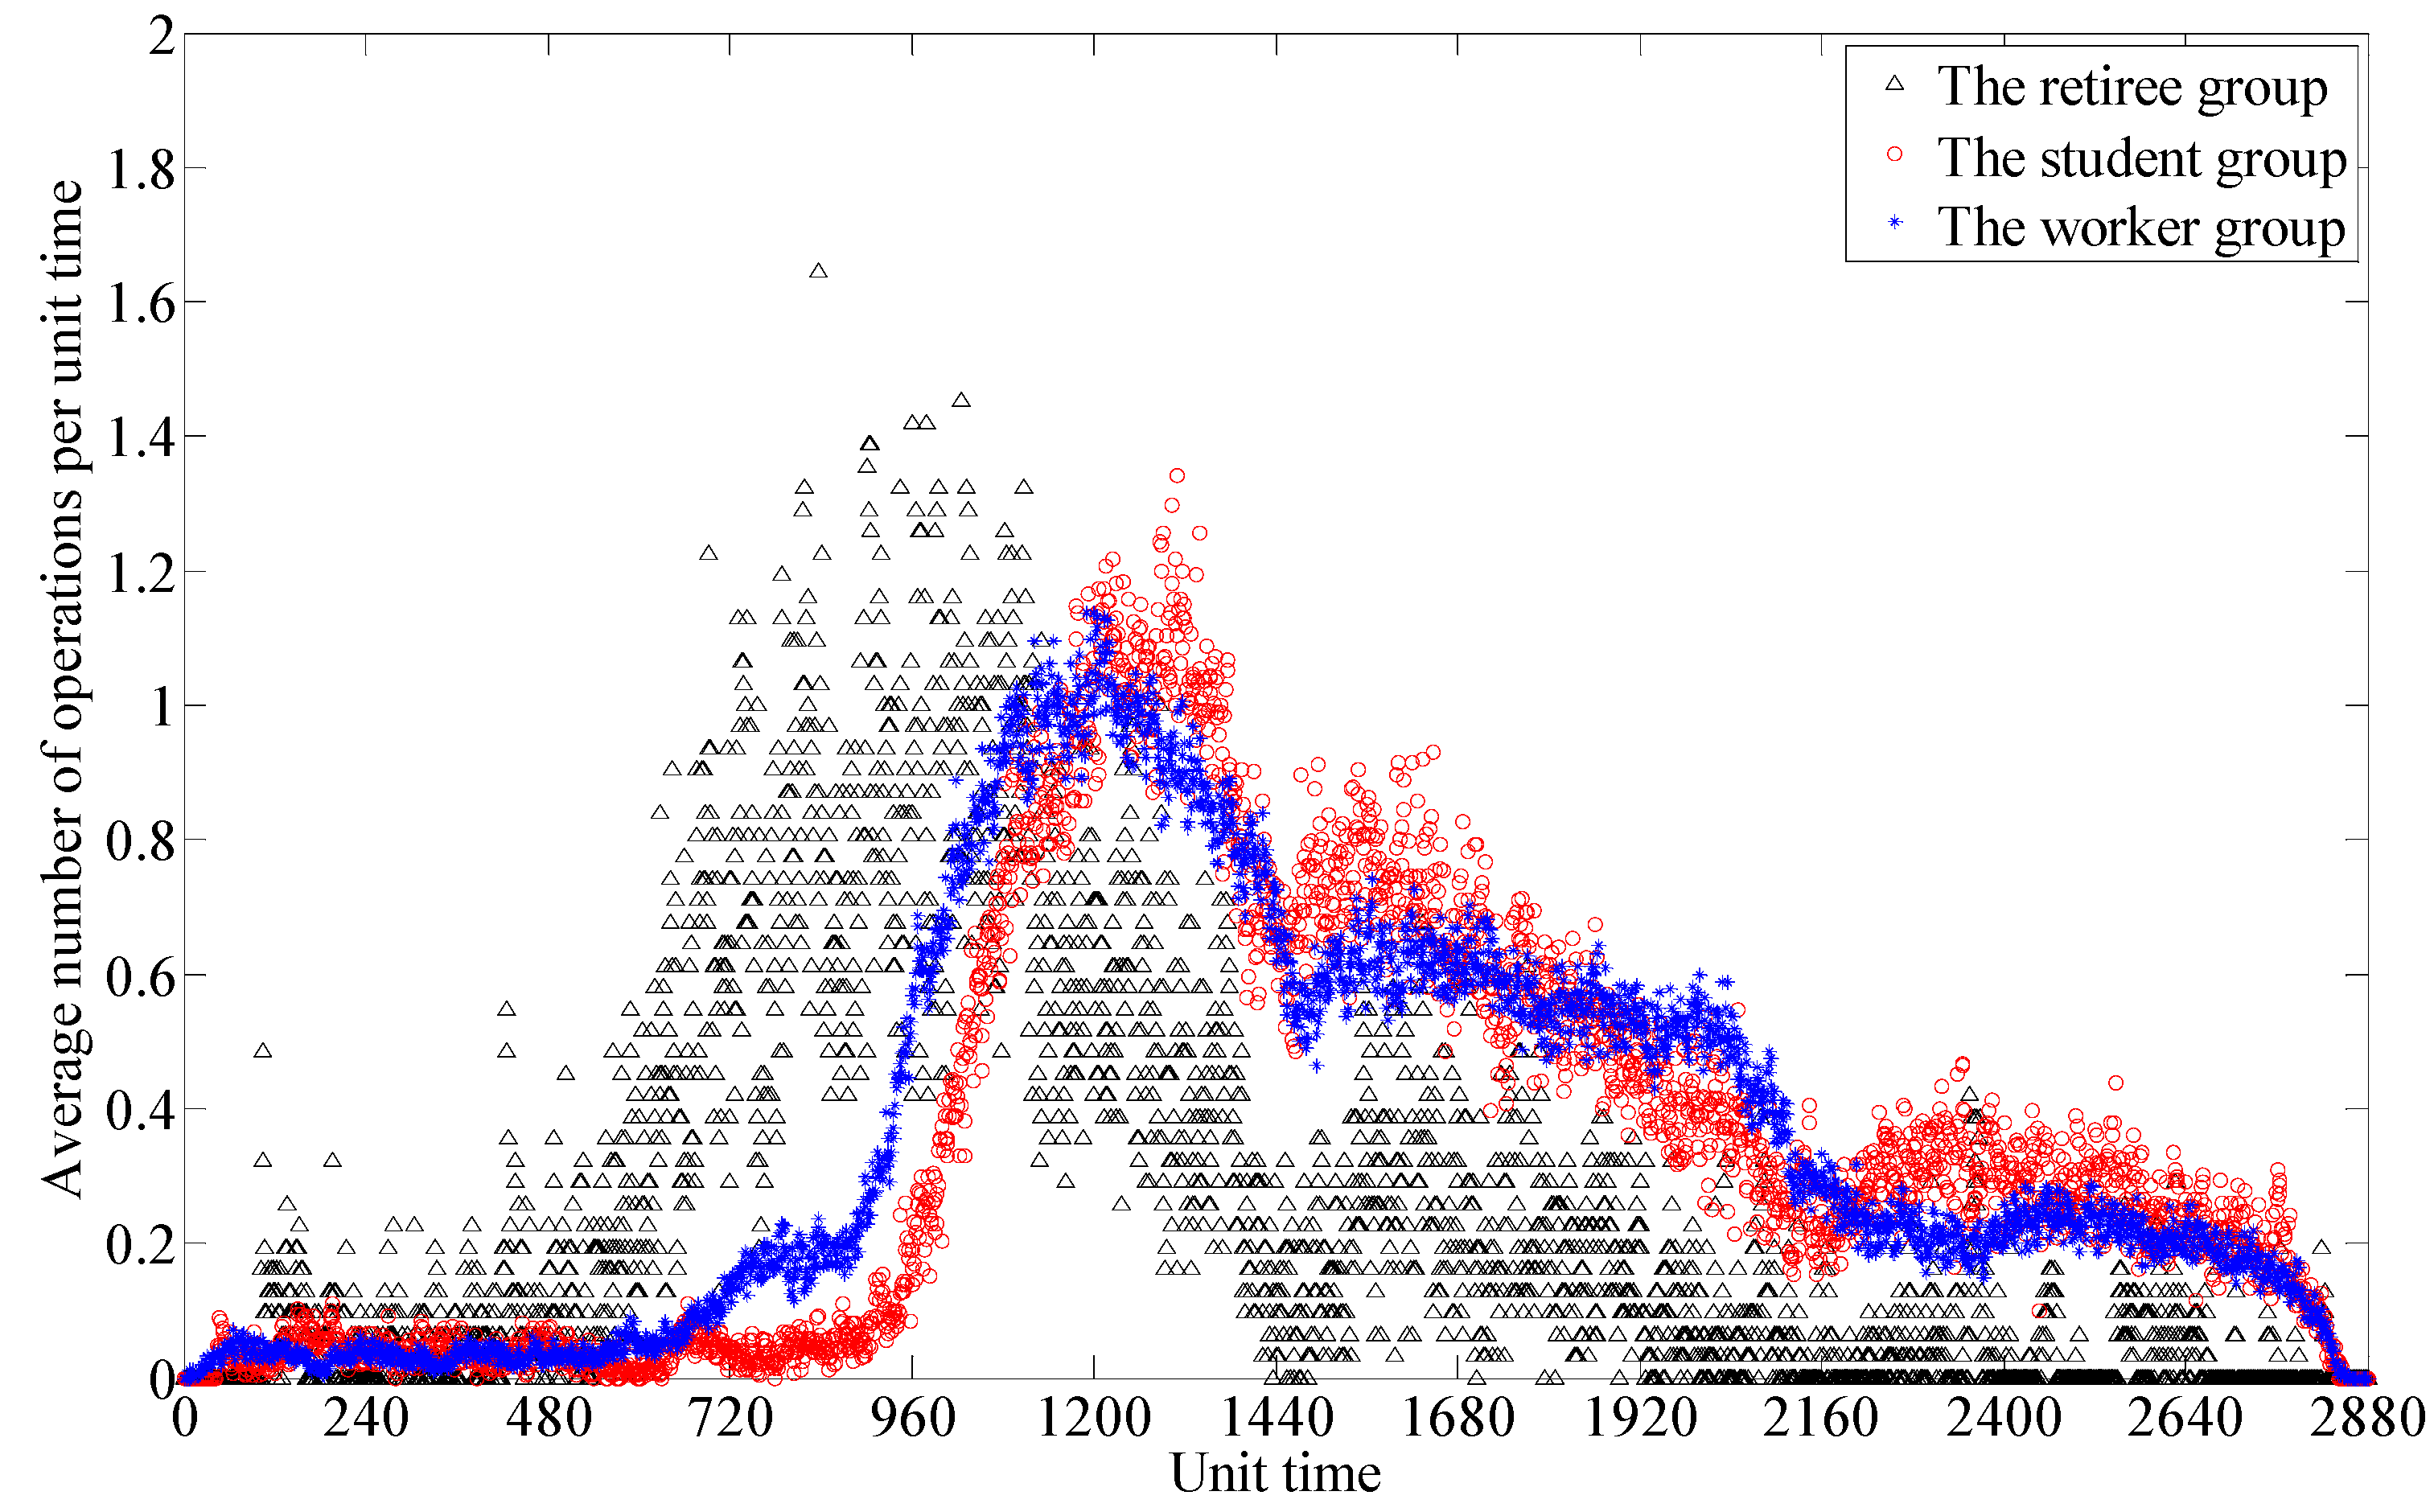
To further study the dynamic complexity, we then plot the average operation-number series of each group in Figure 4. Each point corresponds to the average number of operations for a group in a unit time of 30 s. From Figure 4, the difference between the black curve and the remaining red and blue curves can be noticed, that is, the average operation-number series of the retiree group represented by the black curve takes a significantly larger width than those of the others. This issue can be explained by the relative larger fluctuation of amplitude of the neighboring unit times. Such fluctuations result in rich structural information which maintain the MMSE values on a relative higher lever on time scale 1. However, with the growth of the time scale, the coarse-gained series gradually eliminate those structures such that the differences of the MMSE values with the other two groups disappear.
The circadian rhythms of each group are also reflected by those curves. Older people are accustomed to early hours such that their operations occur earlier around 720 (6:00 AM), while the workers start their operations near 960 (8:00 AM), coinciding with office hours. In addition, a local minimal also appears in both curves around 1440 (12:00 AM), which corresponds exactly to lunchtime.
Figure 4.
Average number of operations per unit time from the three groups. The unit time corresponds to 30 s.
Figure 4.
Average number of operations per unit time from the three groups. The unit time corresponds to 30 s.

3.2. The Activity Analysis on the Three Groups
As illustrated by Radicchi in [7] the number of operations performed by a user plays an important role in determining her/his activity patterns, so we then studied the activities of the individuals’ operating behavior from each group. The activity is defined as
where n is the total number of the operations of an individual, correspond to the occurrence times of the operatings and is the whole interval time in which the total operations have performed. Figure 5 shows the activities of individuals from the three groups during the four weeks. Each row is associated with an individual in a single day. The activity is represented by the color scale. The color map of the activities for the retiree group appears to be more dusky than the other two groups, which suggests that the retirees are less active than the others. Actually, the activies of the retiree group (0.016 0.013 (mean SD)) are significantly less than those of the student group (0.034 0.027 (mean SD), p < 0.05, MWW test) and the worker group (0.042 ± 0.032 (mean SD), p < 0.05, MWW test). In addition, the worker group is significantly more active than the student group (p < 0.05, MWW test). Since the activity reflects the number of operating behaviors per unit time, the above findings indicate that the retirees operate the computer more slowly than the individuals from the others two groups.
The behavior frequencies of the workers and the students during the active periods are generally higher than the inverse of the sampling interval (2 s) partially due to their proficiency in operating computers. Such high-frequency patterns are smoothed by the sampling process. Therefore, the sampled time series exhibits more regularity than the original ones, leading to the comparative low values of the MMSE analysis. In contrast, the slow rhythm of the operating behavior for the retirees may arise from their unfamiliarity with computer operation and physiological reasons, which enlarge the interval time and enrich the structure of the operation-number series such that the MMSE values of both kinds of time series for the retiree group maintain on a relatively high level. With the increase of the time scale, the coarse-grained procedure aggregates the operations in larger intervals such that the distinctions of the structure in daily operation-number series between the retiree group and the other two groups caused by the different behaivor rynthm are gradually mitigated. This might be the reason why the differences between the MMSEs of the daily operation-number series from the retiree group and the other two groups are significant only on small time scales.
Figure 5.
Activities of individuals from the three groups during four weeks. Each row corresponds to the activity of each individual in a single day represented by the color scale. We number these activities in a random order.
Figure 5.
Activities of individuals from the three groups during four weeks. Each row corresponds to the activity of each individual in a single day represented by the color scale. We number these activities in a random order.

4. Conclusions
In summary, we have investigated the dynamic properties of individuals’ computer operating behavior by the MMSE algorithm and activity analysis. Individuals selected randomly from the original dataset have been classified into three groups based on the nature of their jobs. Both the interval time series and the operation-number series of individuals from each group have been studied. The results suggested that the operating behaviors of retirees have larger complexity and lower activity than the others. Our findings may offer insights for the further understanding of individuals’ behavior at different time scales and are expected to be applicable in abnormal behavior detection in future works.
Acknowledgments
This work was supported in part by the National Natural Science Foundation of China under Grants No. 60773192, No. 61370092, No. 11104096 and No. 11374117, National High-Tech Research and Development Program of China (863) under Grant No. 2006AA01Z426, Knowledge Innovation Program for Basic Research Project of Shenzhen under Grant No. JCYJ20150616144425386.
Author Contributions
Junshan Pan designed and completed the experiments. Junshan Pan and Hanping Hu wrote the paper. Xiang Liu assisted Junshan Pan to extract the data from the original dataset. Yong Hu revised the manuscript. All authors have read and approved the final manuscript.
Conflicts of Interest
The authors declare no conflict of interest.
References
- Barabasi, A.L. The origin of bursts and heavy tails in human dynamics. Nature 2005, 435, 207–211. [Google Scholar] [CrossRef] [PubMed]
- Oliveira, J.G.; Barabási, A.L. Human dynamics: Darwin and Einstein correspondence patterns. Nature 2005, 437, 1251. [Google Scholar] [CrossRef] [PubMed]
- Vázquez, A.; Oliveira, J.G.; Dezsö, Z.; Goh, K.-I.; Kondor, I.; Barabási, A.-L. Modeling bursts and heavy tails in human dynamics. Phys. Rev. E 2006, 73, 036127. [Google Scholar] [CrossRef] [PubMed]
- Ratkiewicz, J.; Fortunato, S.; Flammini, A.; Flammini, A.; Vespignani, A. Characterizing and modeling the dynamics of online popularity. Phys. Rev. Lett. 2010, 105, 158701. [Google Scholar] [CrossRef] [PubMed]
- Karsai, M.; Kaski, K.; Barabási, A.L.; Kertész, J. Universal features of correlated bursty behaviour. Sci. Rep. 2012, 2. [Google Scholar] [CrossRef] [PubMed]
- Jiang, Z.Q.; Xie, W.J.; Li, M.X.; Podobnik, B.; Zhou, W.X.; Stanley, H.E. Calling patterns in human communication dynamics. Proc. Natl. Acad. Sci. USA 2013, 110, 1600–1605. [Google Scholar] [CrossRef] [PubMed]
- Radicchi, F. Human activity in the web. Phys. Rev. E 2009, 80, 026118. [Google Scholar] [CrossRef] [PubMed]
- Zhao, Z.D.; Cai, S.M.; Huang, J.; Fu, Y.; Zhou, T. Scaling behavior of online human activity. EPL Europhys. Lett. 2012, 100, 48004. [Google Scholar] [CrossRef]
- Pan, J.; Hu, H.; Liu, Y. Human behavior during Flash Crowd in web surfing. Physica A 2014, 413, 212–219. [Google Scholar] [CrossRef]
- Costa, M.; Goldberger, A.L.; Peng, C.K. Multiscale entropy analysis of complex physiologic time series. Phys. Rev. Lett. 2002, 89, 068102. [Google Scholar] [CrossRef] [PubMed]
- McIntosh, A.R.; Kovacevic, N.; Itier, R.J. Increased brain signal variability accompanies lower behavioral variability in development. PLoS Comput. Biol. 2008, 4, e1000106. [Google Scholar] [CrossRef] [PubMed]
- Liu, Q.; Wei, Q.; Fan, S.Z.; Lu, C.W.; Lin, T.Y.; Abbod, M.F.; Shieh, J.S. Adaptive computation of multiscale entropy and its application in EEG signals for monitoring depth of anesthesia during surgery. Entropy 2012, 14, 978–992. [Google Scholar] [CrossRef]
- Costa, M.; Goldberger, A.L.; Peng, C.K. Multiscale entropy analysis of biological signals. Phys. Rev. E 2005, 71, 021906. [Google Scholar] [CrossRef] [PubMed]
- Humeau, A.; Mahé, G.; Chapeau-Blondeau, F.; Rousseau, D.; Abraham, P. Multiscale analysis of microvascular blood flow: A multiscale entropy study of laser Doppler flowmetry time series. IEEE Trans. Biomed. Eng. 2011, 58, 2970–2973. [Google Scholar] [CrossRef] [PubMed] [Green Version]
- Wu, S.D.; Wu, C.W.; Lin, S.G.; Wang, C.C.; Lee, K.Y. Time series analysis using composite multiscale entropy. Entropy 2013, 15, 1069–1084. [Google Scholar] [CrossRef]
- Humeau-Heurtier, A. The Multiscale Entropy Algorithm and Its Variants: A Review. Entropy 2015, 17, 3110–3123. [Google Scholar] [CrossRef] [Green Version]
- Wu, S.D.; Wu, C.W.; Lee, K.Y.; Lin, S.G. Modified multiscale entropy for short-term time series analysis. Phys. A 2013, 392, 5865–5873. [Google Scholar] [CrossRef]
- Govindan, R.B.; Wilson, J.D.; Eswaran, H.; Lowery, C.L.; Preißl, H. Revisiting sample entropy analysis. Physica A 2007, 376, 158–164. [Google Scholar] [CrossRef]
- Richman, J.S.; Moorman, J.R. Physiological time-series analysis using approximate entropy and sample entropy. Am. J. Physiol. Heart Circ. Physiol. 2000, 278, H2039–H2049. [Google Scholar] [PubMed]
- China Internet Data Platform, 2012. Available online: http://www.datatang.com/data/43910 (accessed on 9 December 2015).
© 2015 by the authors; licensee MDPI, Basel, Switzerland. This article is an open access article distributed under the terms and conditions of the Creative Commons by Attribution (CC-BY) license (http://creativecommons.org/licenses/by/4.0/).
Share and Cite
MDPI and ACS Style
Pan, J.; Hu, H.; Liu, X.; Hu, Y. Multiscale Entropy Analysis on Human Operating Behavior. Entropy 2016, 18, 3. https://doi.org/10.3390/e18010003
AMA Style
Pan J, Hu H, Liu X, Hu Y. Multiscale Entropy Analysis on Human Operating Behavior. Entropy. 2016; 18(1):3. https://doi.org/10.3390/e18010003
Chicago/Turabian StylePan, Junshan, Hanping Hu, Xiang Liu, and Yong Hu. 2016. "Multiscale Entropy Analysis on Human Operating Behavior" Entropy 18, no. 1: 3. https://doi.org/10.3390/e18010003
Note that from the first issue of 2016, this journal uses article numbers instead of page numbers. See further details here.