
Energy Efficiency Improvement in a Modified Ethanol Process from Acetic Acid


Department of Chemical Engineering, Dong-A University, Busan 604-714, Korea
Entropy 2016, 18(12), 422; https://doi.org/10.3390/e18120422
Submission received: 16 September 2016
/
Revised: 21 November 2016
/
Accepted: 21 November 2016
/
Published: 24 November 2016
(This article belongs to the Special Issue Advances in Applied Thermodynamics II)
Abstract
:For the high utilization of abundant lignocellulose, which is difficult to directly convert into ethanol, an energy-efficient ethanol production process using acetic acid was examined, and its energy saving performance, economics, and thermodynamic efficiency were compared with the conventional process. The raw ethanol synthesized from acetic acid and hydrogen was fed to the proposed ethanol concentration process. The proposed process utilized an extended divided wall column (DWC), for which the performance was investigated with the HYSYS simulation. The performance improvement of the proposed process includes a 27% saving in heating duty and a 41% reduction in cooling duty. The economics shows a 16% saving in investment cost and a 24% decrease in utility cost over the conventional ethanol concentration process. The exergy analysis shows a 9.6% improvement in thermodynamic efficiency for the proposed process.
1. Introduction
While ethanol is used in various chemical processes as a raw material, a large demand (e.g., automobile fuel) calls for a new production resource in a large scale and ecofriendly way, and bioethanol fits these requirements. As the bioethanol production from grains increased, the feed price became too high to raise the production, and lignocellulose has attracted attention as an alternative resource. However, the ethanol production from the lignocellulose has two drawbacks [1]. The conversion of the lignocellulose into ethanol is low, because, among many intermediate products of the pretreated lignocellulose, only hexoses convert into the ethanol. The other problem is carbon dioxide emission during the ethanol fermentation. Various feedstock and new energy-efficient processes were explained in recent studies of bioethanol production [2,3,4].
The ethanol production from acetic acid is a niche technique that solves the low conversion of lignocellulose. The nonconverted intermediates in the lignocellulose fermentation are used in the acetic acid fermentation [1]. On top of the lignocellulose utilization, acetic acid is easily yielded from methanol carbonylation, initially synthesized from syngas [5,6]. Moreover, the acetic acid has an overcapacity of more than 40% [7].
The ethanol synthesis from acetic acid has a typical process of chemical production: reaction and separation by distillation. The catalytic conversion of acetic acid has been investigated by many studies [8,9,10,11], but energy saving in the distillation process was not examined yet. The distillation process consumes a large amount of energy, and the energy consumption needs to be reduced when the environmentally friendly bioethanol is produced. Recently, an extractive distillation has been applied to ethanol concentration [12,13,14]. The energy efficiency in high-energy consuming processes was examined through exergy analysis [15,16,17], which can be used in the distillation.
The hydrogenation of acetic acid is a typical exothermic reaction, and a couple of side reactions produce acetaldehyde and ethyl acetate in a noticeable amount. The hydrogen and water control the acetic acid conversion and ethanol selectivity. The hydrogenation product contains five major components—ethanol, acetic acid, water, acetaldehyde and ethyl acetate—which are separated in a series of binary distillation columns, conventionally three columns [18]. The three distillation columns can be combined into an extended divided wall column (DWC) to raise the thermodynamic efficiency for energy saving, as used in many practical applications [19,20], when the column operating pressures of the three distillation columns are not significantly different [21,22,23].
In this study, the improved process of ethanol production from acetic acid is presented with simulation results, in which three distillation columns used for the conventional method of ethanol concentration are replaced with an energy-efficient extended DWC. In the improved process of ethanol concentration, the performances of energy saving, cost reduction, and thermodynamic efficiency improvement are examined.
2. Process Overview
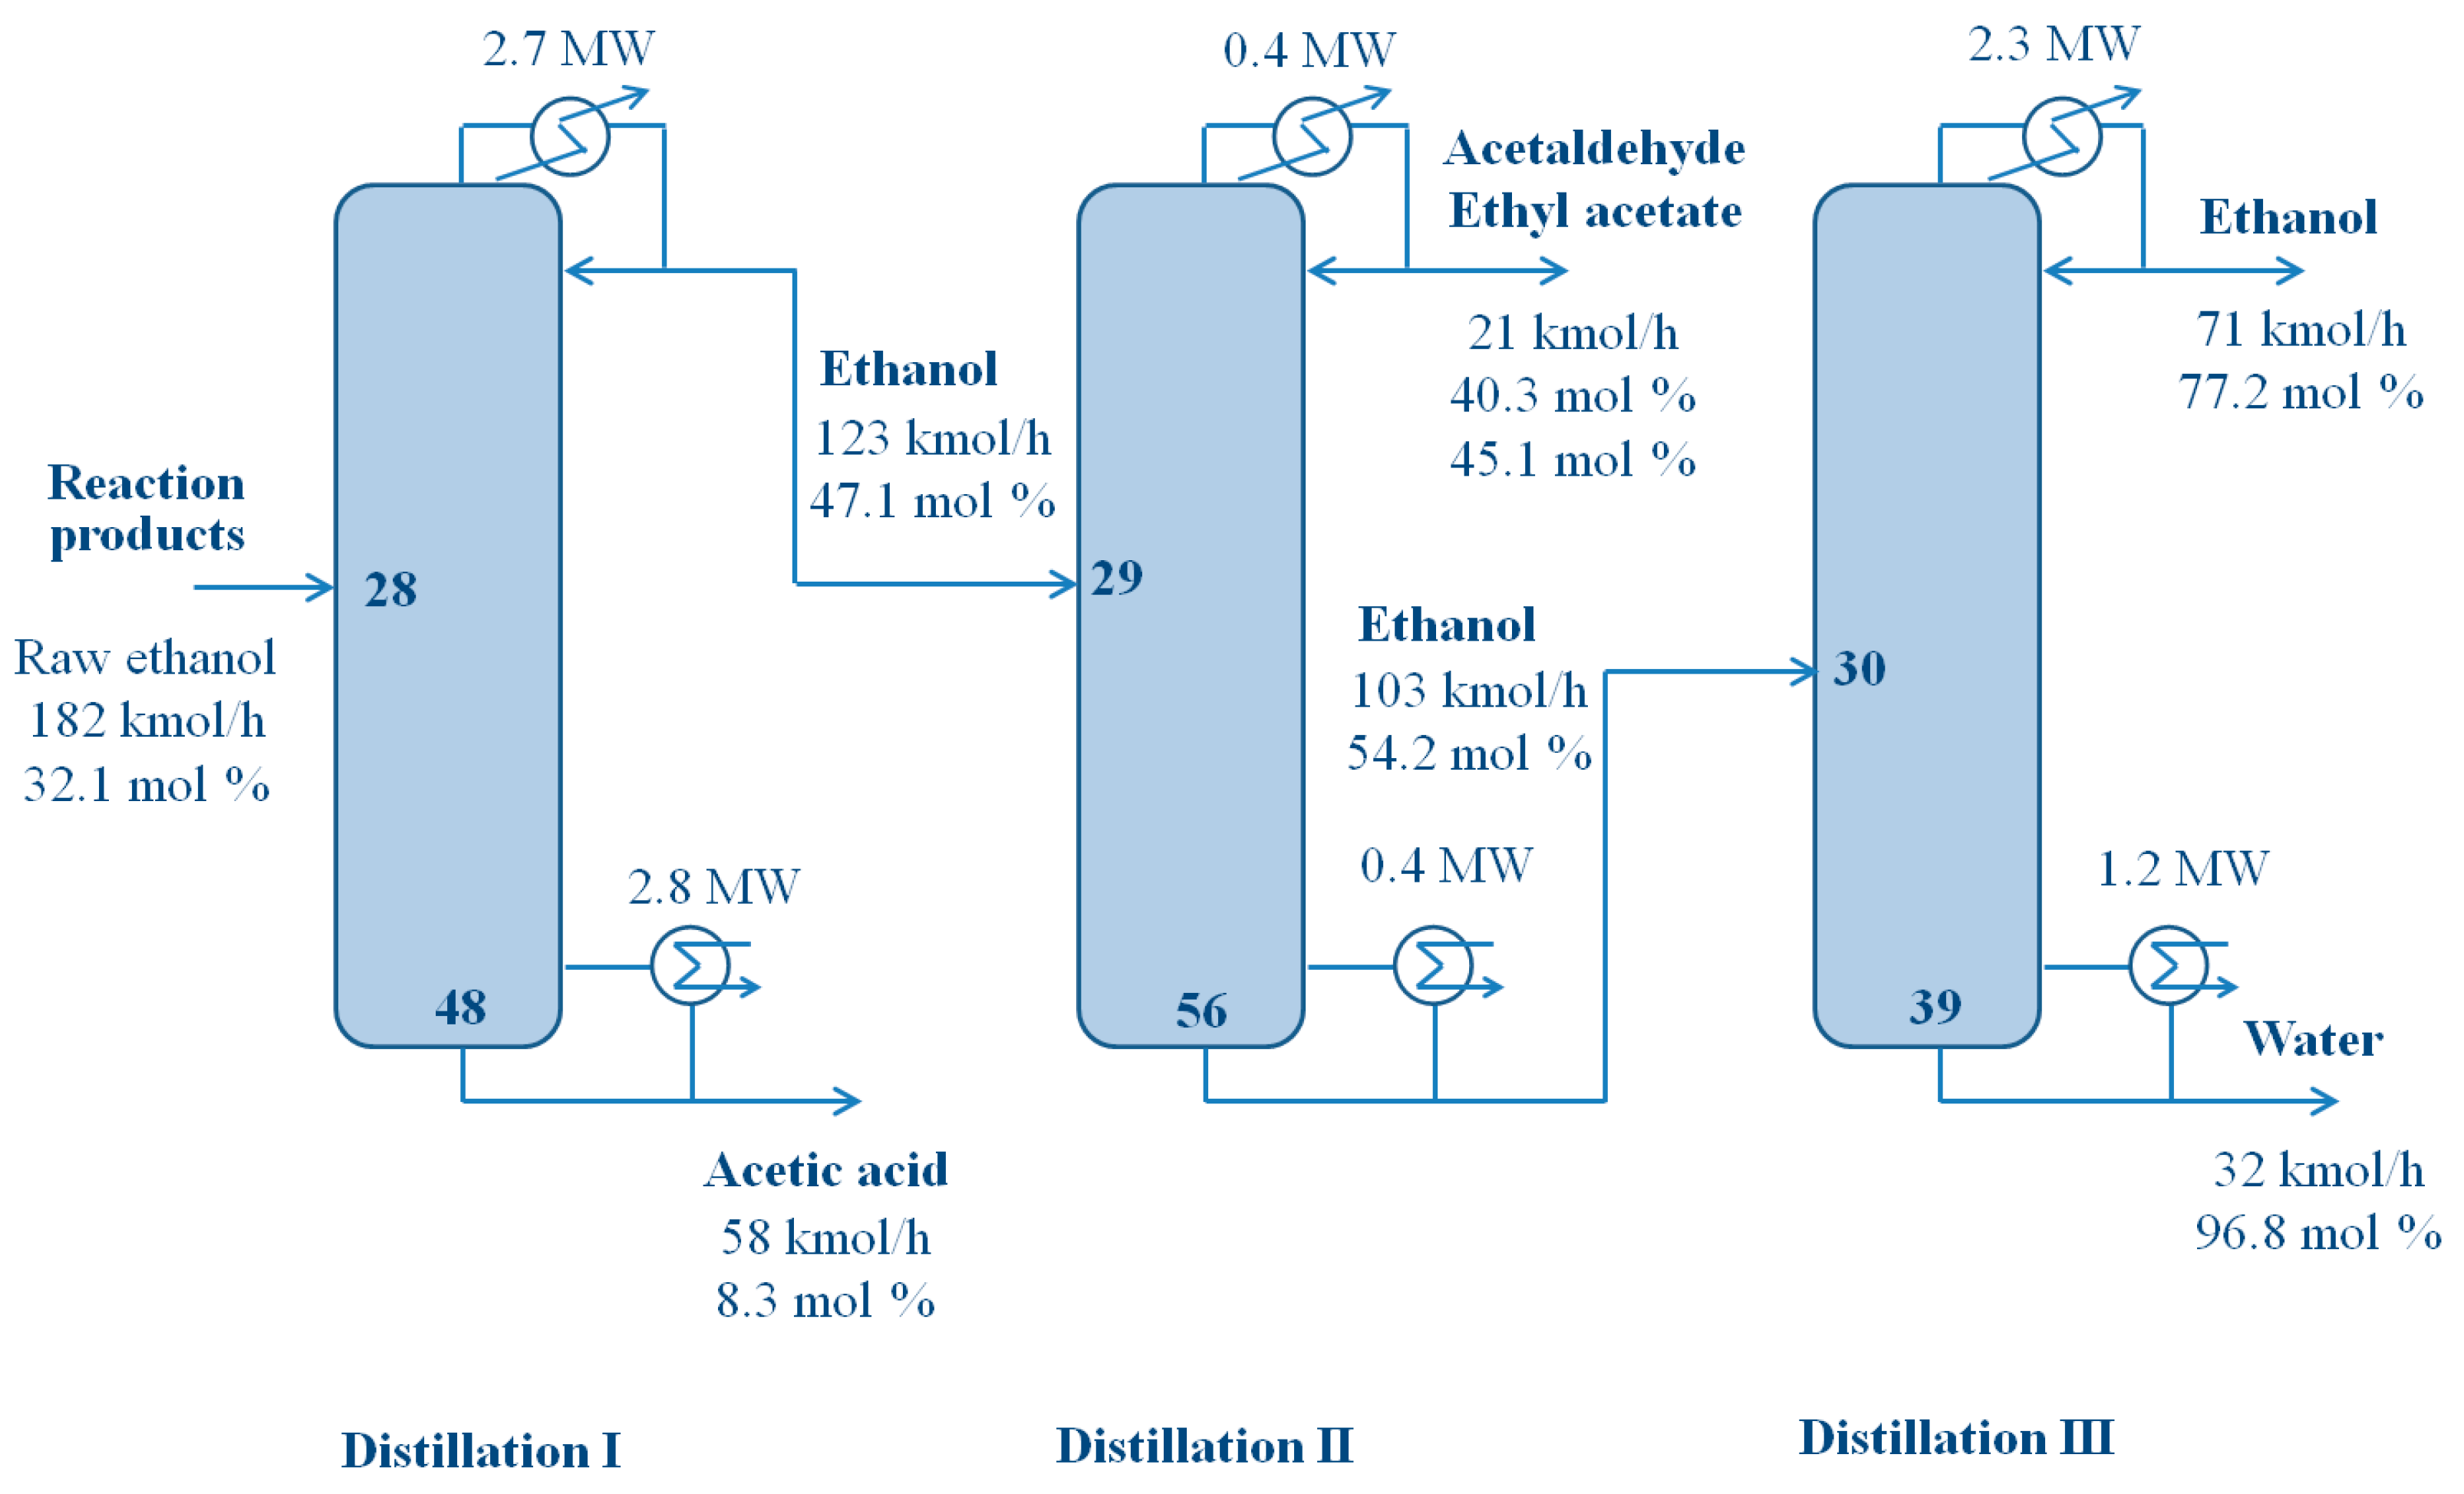
According to [18], three distillation columns were implemented for the ethanol concentration as the conventional process, and Figure 1 demonstrates the sequence of the distillation columns and stream flows. Table 1 lists the components and flow rate of feed to the columns. The commercial process of ethanol production from acetic acid, with a capacity of 20,000 tons per year, was developed by Celanese [24]. The explanation of this process is given in the patent [18], which was used in this study as basis. The feed composition is given in the reference [18] close to an industrial process, and its flow rate is one-tenth of the process. The structural information and operating conditions are listed in Table 2. The first column separates acetic acid in water at the highest boiling temperature. The second column produces the mixture of acetaldehyde and ethyl acetate at the lowest boiling temperature. The last column separates the concentrated ethanol and water. The composition and amounts of the products are also given in Figure 1. Due to the azeotrope of ethanol and water, the conventional distillation does not provide highly pure ethanol product. Additional concentration of ethanol, such as azeotropic distillation and adsorption, is necessary.
The proposed process of ethanol concentration has an energy-efficient divided wall column (DWC) replacing the conventional distillation columns for the improved energy efficiency. Because the three-column process produces four products, an extended DWC is utilized for the integrated distillation, and its energy efficiency is examined here.
3. Process Design
The design of the conventional ethanol process followed the information given in [18]. Though the specific design information is not addressed in the reference, the specifications of feed and products used in the design of the conventional process are within the limits presented in the reference. In the design, the commercial design software HYSYS was used.
As demonstrated in Figure 1, three distillation columns were utilized for the ethanol concentration, as suggested in [18]. The operating pressure was determined by considering the composition and boiling points of feed components, and the number of trays in each distillation column was adjusted at the minimum reflux flow for given product specification. The column operating pressure was close to the atmospheric pressure. The tray number and reflux flow rate of the distillation column were iteratively computed for the given specifications using the HYSYS. The thermodynamic equilibrium equation used in the simulation was the UNIQUAC activity model [25,26], and all of the binary parameters of the UNIQUAC model are given in the HYSYS. The optimized design results of the distillation columns in the conventional system are summarized in Table 2. The optimized structure of the distillation columns was found by applying various numbers of trays for the specifications of products and comparing the annual cost of investment and utilities. The assumed payback time of the investment was 5 years.
The proposed distillation column of this study utilized an energy-efficient distillation column, an extended divided wall column (DWC). The design of the extended DWC began with the distribution of tray number in the main column and two auxiliary columns. The distribution of tray number among the main column and two auxiliary columns was arranged for the minimum reflux flow rate. The reflux flow rate and liquid and vapor flows to the auxiliary columns were iteratively determined until the desired products’ specification was obtained from the HYSYS simulation. The optimal design results of the column structure and operating conditions for the proposed system are included in Table 2. As an example, Table 3 lists the variation of total annual cost for the increased total number of trays in the proposed DWC.
The design of the distillation column for azeotropic mixtures is difficult due to separate distillation zones, in which the distillation lines do not cross the distillation boundary separating the zones. This limitation is more apparent in the design of a complex distillation column such as DWC, where all the products are drawn from a single column. In this study, the complex distillation column was proposed to save energy consumption in the azeotropic mixture separation.
4. Results and Discussion
The design results of the proposed ethanol process are presented, and its performance is compared with that of the conventional process. The comparison shows the energy saving, investment and operating costs reduction, and thermodynamic efficiency improvement.
4.1. Design Results
The ethanol process is a typical chemical process system composed of reaction process, acetic acid hydrogenation, separation process, and distillation. A variety of operating conditions of the acetic acid hydrogenation are listed in [18]. The raw ethanol contains 32 mol % ethanol and 52 mol % water with a 2.7 mol % of unreacted acetic acid and two byproducts. The design results of the distillation columns used in the conventional process are summarized in Table 2. Figure 1 also demonstrates the design results of the distillation process. The number of trays in distillation columns were determined at the minimum total annual cost. The tray numbers are ideal, and the practical number of trays increases by the tray efficiency of commonly 75%. The column diameter is calculated by Equation (A2) with the vapor flow rate in Table 2, and column height is the number of trays times 60 cm.
Because the feed components in the distillation have a large amount of water and ethanol and their boiling points are adequate to common cooling, the column operating pressure was set around the atmospheric pressure. However, the ethyl acetate contained in the feed formulates an azeotropic mixture with ethanol, water, and acetic acid, and their nonideal vapor–liquid equilibria causes a problem during the distillation simulation. The operating conditions of a distillation column handling an ethanol–water–ethyl acetate mixture are limited due to the separate distillation regions of azeotropic mixtures. While an ideal mixture has unlimited distillation curves anywhere in the residue diagram, the feed and products of an azeotropic mixture share one of the separated regions in the residue diagram. The same problem applies to the azeotrope of ethanol and water. Figure 2 shows two ternary systems having separate distillation boundaries, and the compositions of feed and products locate in a region without crossing the boundaries [27]. In other words, by distillation, a high-composition ethanol product is not achievable from a low-composition ethanol feed as demonstrated in Figure 2a, in which a thick line separates two distinct right and left distillation regions. The compositions of feed and products are not in the same region. The distillation lines indicating the profile of tray liquid composition in a distillation column cannot cross the distillation boundary.
The distillation feed has a high content of water and ethanol with a small amount of ethyl acetate. In the first distillation column, the feed composition is located in the right-handed region of the ternary plot in Figure 2b, and the compositions of overhead and bottom products are in the same region. The feed and products compositions make a straight line—the overall material balance line—which is separated with the amounts of products using the lever rule [27]. When the feed composition listed in Table 1 is applied to the material balance line and the volatility distribution of the feed is considered, the overhead and bottom products are expected to have an increased ethanol composition and a high water composition, respectively. Because the acetaldehyde and ethyl acetate have low boiling points and the acetic acid has a high boiling point, when they are mixed with ethanol (intermediate boiling point), they cannot be simultaneously separated in a single column. Thus, the first distillation column separates the acetic acid only. In the second distillation column, the low-boiling-point mixture of acetaldehyde and ethyl acetate is separated, and then the ethanol is concentrated in the third distillation column. However, the distillation lines of the three columns appear in the right-handed region of the ternary diagram, as demonstrated in Figure 2b. It can be observed that the simulation of the three distillation columns is not simple due to the limited space of available distillation region. In the practical computation of the column simulation, changing the operating variables is limited, and highly concentrated product is not available.
For the improved efficiency of distillation separation, the conventional, three-column distillation system was replaced with an extended divided wall column (DWC), as illustrated in Figure 3. The DWC design was adopted from the design of the conventional distillation system with the same operating pressure. The operating conditions, vapor, and liquid flow rates were iteratively adjusted for the desired product specification. The complexity of vapor–liquid equilibrium in the ethanol–water–ethyl acetate system, as shown in Figure 2b, caused a convergence problem in the HYSYS simulation, which limited the variation of operation conditions in the computation of product specification. Table 2 summarizes the design results on the structural and operational information of the proposed DWC system. Among four products from the DWC, two products contain most of water and acetic acid. If necessary, a single distillation column can concentrate the acetic acid for the recycled feed to the reactor by supplying the two products from the DWC at the different trays having tray–liquid compositions close to that of the products. Because of the complexity of the vapor–liquid equilibrium and the extended DWC structure, changing the operating conditions in the DWC simulation was more difficult than the conventional-system simulation.
While the total number of trays in the conventional and DWC systems are similar, the DWC consumes 27% less heating energy and 41% less cooling duty. The heating duty saving is less than those applications in other practical distillation processes [19,20,28]. The complexity of the nonideal equilibrium of the products incurred a high reflux ratio in the ethanol concentration that consumed more energy to deteriorate its energy-saving performance.
4.2. Economic Evaluation
The economics of the conventional and extended DWC systems were compared in terms of the investment and utility costs. The results of the economic evaluation are summarized in Table 4. The investment cost comprises the costs of column, trays, and heat exchangers calculated from the cost equations given in the Appendix. The comparison indicates that investment cost of the proposed DWC is 16% less than that of the conventional system. The column cost of the DWC is higher than the conventional system, but the heat-exchanger cost is much lower, owing to the heating duty reduction in the DWC. The utility cost is composed of the coolant and steam costs, computed from the cost equations given in the Appendix. Because the processed materials have mild boiling points, at the operating temperature of condensers no high-cost coolant was necessary, leading to negligible coolant cost. However, the heating duty reduction in the proposed system results in the 24% reduction of the total utility cost.
4.3. Exergy Loss and Thermodynamic Efficiency
The thermodynamic efficiencies of the conventional distillation process and extended DWC process are calculated from the exergy loss and the minimum required work for products. The maximum available work in a thermodynamic process is represented as exergy, computed by the difference of the enthalpy and entropy between a specific state and the ambient state. Departing from the standard state results in work or heat exchange, and it causes the exergy variation. The exergy is defined, as in [29], as:
where the subscript o indicates the ambient state. In a tray of distillation columns, the rate of exergy loss is calculated from exergy flows and the rate of equipment energy transfer.
The thermal exergy of an energy equipment, is given as:
In a whole distillation column, however, the evaluation of the exergy flows between adjacent trays is difficult, because the calculation of the enthalpy and entropy of internal streams is not simple. Instead, a diagram of the Carnot factor (calculated below) and enthalpy flows of the tray input and output streams was used in the exergy calculation for the whole distillation column [29,30]. The Carnot factor is computed as:
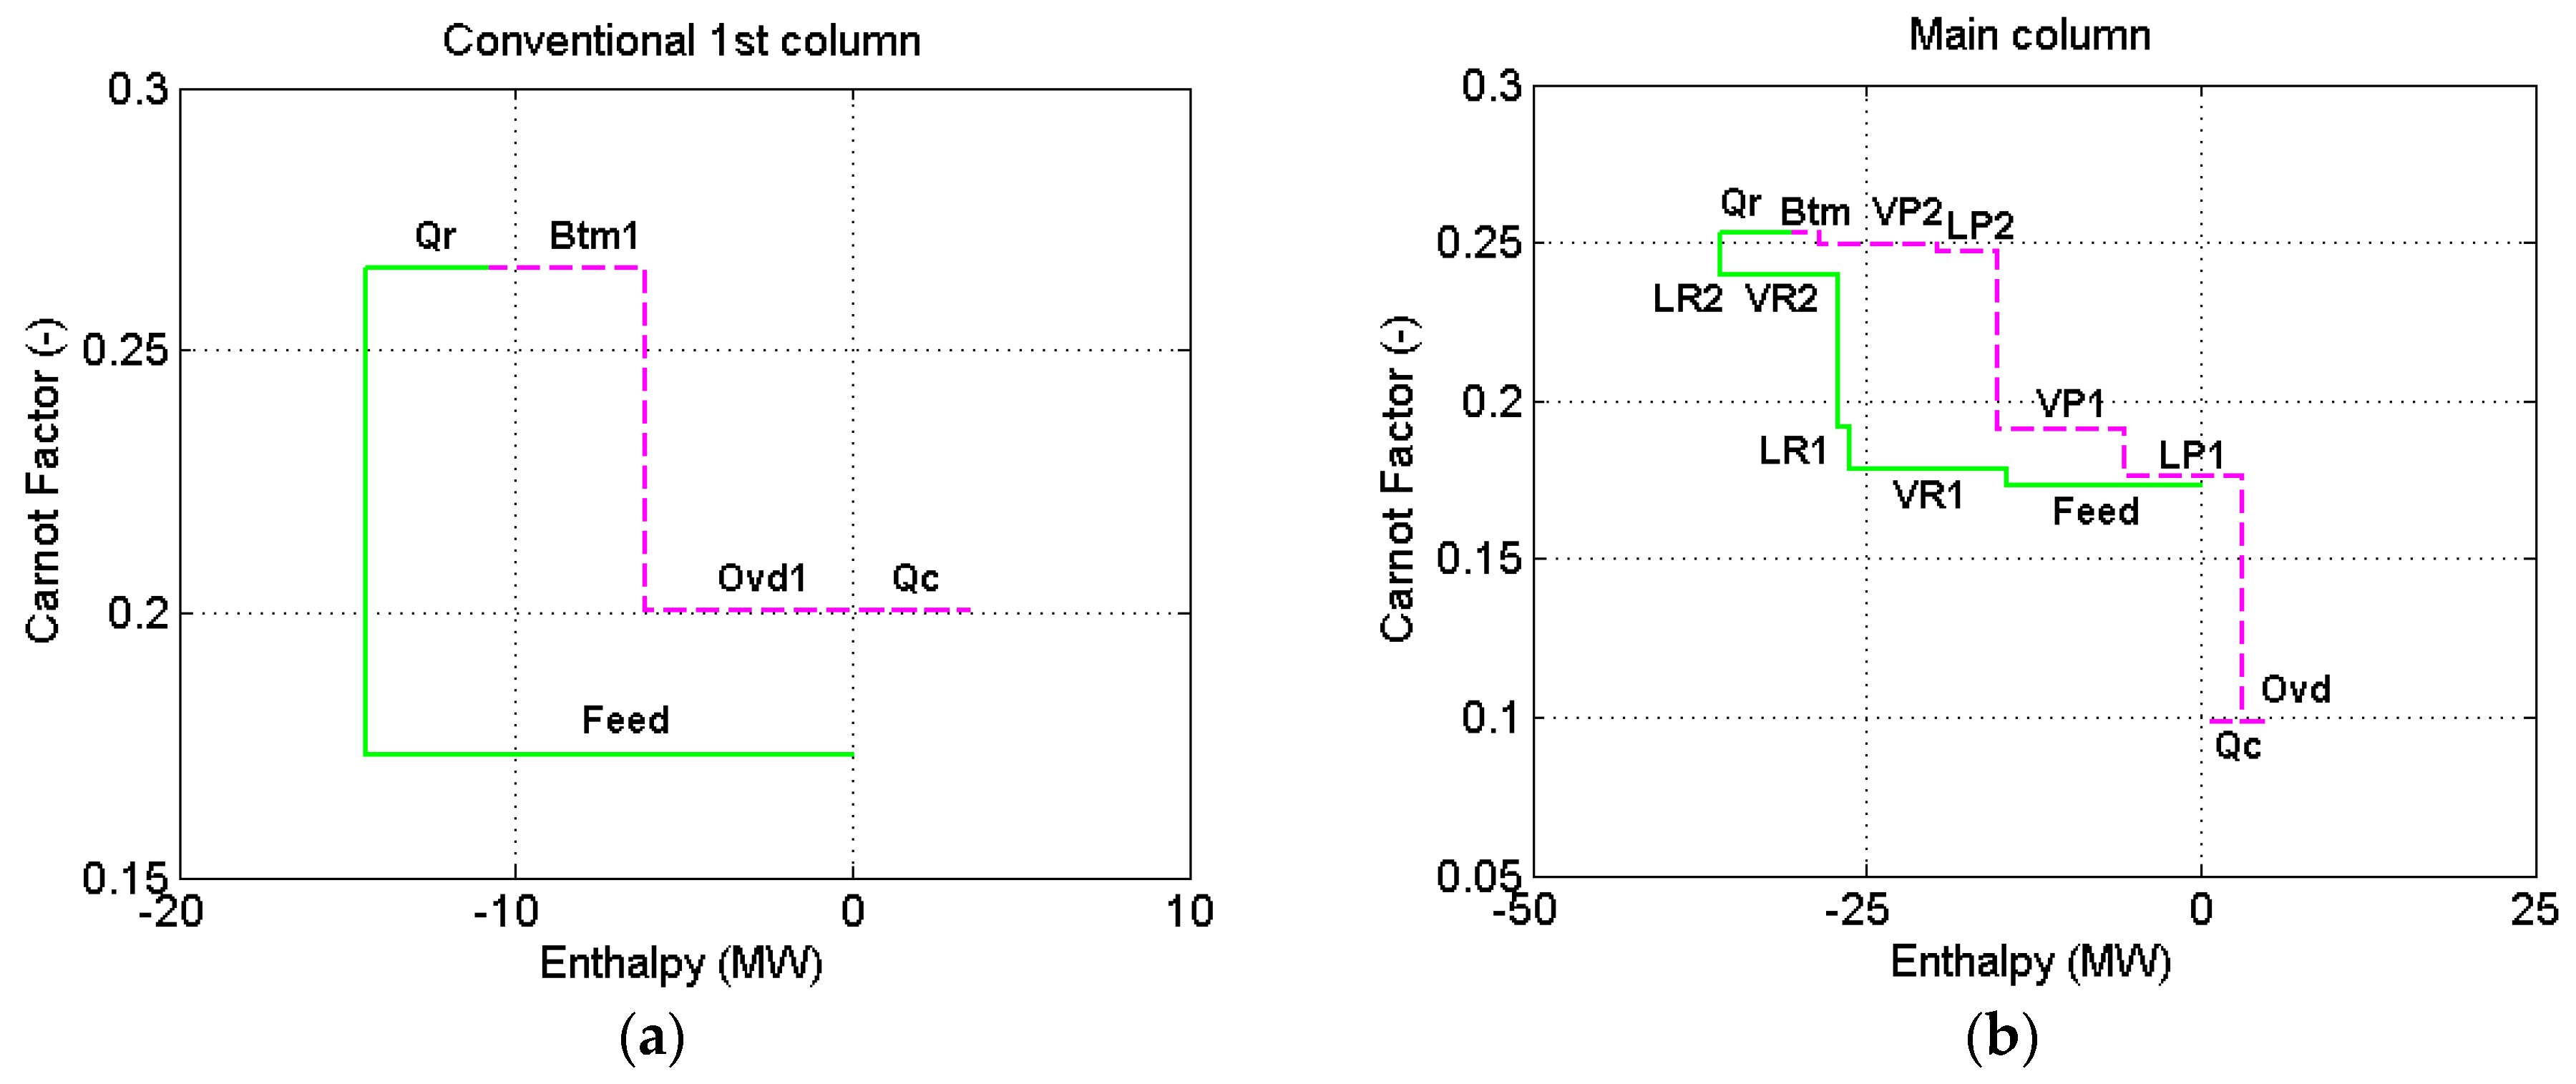
The exergy flow rate in a thermal system is the multiplication of the Carnot factor and enthalpy flow as represented in Equation (3). Therefore, the exergy loss in the distillation column is the area between the outlet and inlet streams in the diagram of the Carnot factor and enthalpy flows, as illustrated in Figure 4. The first column of the conventional system is shown in Figure 4a, and the main column of the proposed system is in Figure 4b.
The thermodynamic efficiency in a separation process is defined as [31,32]:
where the minimum work is obtained from [33].
The exergy losses in the conventional columns and extended DWC are summarized in Table 5. The negative values of exergy loss indicate that there is exergy recovery at the auxiliary columns in the extended DWC. The extended DWC has 10% less exergy loss than that in the conventional process. The exergy of column feed and products was calculated by the embedded formula in the HYSYS simulation. The thermodynamic efficiency of the DWC is slightly higher than the conventional system, and the small value of minimum work is responsible to the low thermodynamic efficiency.
5. Conclusions
A new separation process for the ethanol production from acetic acid was proposed, and its energy saving, economics, and thermodynamic efficiency were evaluated and compared with the conventional separation process. A reactor system synthesizing raw ethanol from acetic acid and hydrogen was utilized to yield the ethanol that was the feed to the separation process. The proposed process utilizes an extended divided wall column (DWC) for the concentration of the raw ethanol, and the details of the process design of the DWC and the role of nonideal equilibrium of the constituent compounds were explained. The computed results indicate that the proposed DWC saved 27% of heating duty over the conventional process and the cooling duty saving was 41%. The economic analysis shows that a 16% reduction of investment cost and a 24% saving of utility cost were yielded from the proposed process. The results of exergy analysis indicate a 9.6% improvement of thermodynamic efficiency from the process modification.
Acknowledgments
Financial support from the Basic Research Program (2015-01056627) through the National Research Foundation of Korea is gratefully acknowledged.
Conflicts of Interest
The author declares no conflict of interest.
Appendix A
The following cost equations can be found in [34,35]. The costs of column shell is given as
where the M & S is the Marshall and Swift index and the value of the fourth quarter of 2011 of 1536.5 is used. The coefficient Cf is 3919.32 taken from [35], and the pressure-related correction factor Cp is from [36]. The column diameter Dc is found from the maximum vapor flow rate at the column.
where V is the rate of vapor in kg·mol/h. The column height Hc is determined from the minimum of 2-feet tray spacing for maintenance and the tray number.
The column internal cost is calculated from the equation:
where the fabrication cost factor Fc is given in [35]. The cost equation of the heat exchanger is adopted from [35].
where Ac is the heat transfer area of the condenser in m2. Similarly, the reboiler cost is given as:
where AR is the heat transfer area of the reboiler. The process operation is assumed to be 330 days per year and 24 h per day.
For the steam cost, the cost factor at different temperatures was found from [36], and the fitted steam cost equation was obtained using the factor and the base steam cost [37].
where Csteam is in dollars per ton of steam, and t is the temperature in centigrade. The cost for 1 GJ is recalculated using the steam enthalpy calculated from the fitted equation.
where is in GJ/ton.
References
- Saka, S.; Minami, E.; Rabemanolontsoa, H.; Kawamoto, H. Advanced biotethanol production process with acetic acid fermentation from lignocellulosics. In Proceedings of the 2014 Grand Renewable Energy International Conference, Tokyo, Japan, 27 July–1 August 2014.
- Kang, Q.; Baeyens, J.; Tan, T.W.; Dewil, R. A novel sintered metal fiber microfiltration of bio-ethanol fermentation broth. Korean J. Chem. Eng. 2015, 32, 1625–1633. [Google Scholar] [CrossRef]
- Baeyens, J.; Kang, Q.; Appels, L.; Dewil, R.; Lv, Y.Q.; Tan, T.W. Challenges and opportunities in improving the production of bio-ethanol. Prog. Energy Combust. Sci. 2015, 47, 60–88. [Google Scholar] [CrossRef]
- Gupta, A.; Verma, J.P. Sustainable bio-ethanol production from agro-residues: A review. Renew. Sustain. Energy Rev. 2015, 41, 550–567. [Google Scholar] [CrossRef]
- Howard, M.J.; Jones, M.D.; Roberts, M.S.; Taylor, S.A. C1 to Acetyls—Catalysis and Process. Catal. Today 1993, 18, 325–354. [Google Scholar] [CrossRef]
- Sunley, G.J.; Watson, D.J. High productivity methanol carbonylation catalysis using iridium—The Cativa (TM) process for the manufacture of acetic acid. Catal. Today 2000, 58, 293–307. [Google Scholar] [CrossRef]
- Global Data. Acetic Acid: World Supply Outweighs Demand; Global Data: London, UK, 2011. [Google Scholar]
- Zhang, S.; Duan, X.; Ye, L.; Lin, H.; Xie, Z.; Yuan, Y. Production of ethanol by gas phase hydrogenation of acetic acid over carbon nanotube-supported Pt-Sn nanoparticles. Catal. Today 2013, 215, 260–266. [Google Scholar] [CrossRef]
- Ito, Y.; Kawamoto, H.; Saka, S. Efficient and selective hydrogenation of aqueous acetic acid on Ru-Sn/TiO2 for bioethanol production from lignocellulosics. Fuel 2016, 178, 118–123. [Google Scholar] [CrossRef]
- Zhou, M.; Zhang, H.; Ma, H.; Ying, W. The catalytic properties of K modified PtSn/Al2O3 catalyst for acetic acid hydrogenation to ethanol. Fuel Process. Technol. 2016, 144, 115–123. [Google Scholar] [CrossRef]
- Goicoechea, S.; Kraleva, E.; Sokolov, S.; Schneider, M.; Pohl, M.-M.; Kockmann, N.; Ehrich, H. Support effect on structure and performance of Co and Ni catalysts for steam reforming of acetic acid. Appl. Catal. A Gen. 2016, 514, 182–191. [Google Scholar] [CrossRef]
- Loy, Y.Y.; Lee, X.L.; Rangaiah, G.P. Bioethanol recovery and purification using extractive dividing-wall column and pressure swing adsorption: An economic comparison after heat integration and optimization. Sep. Purif. Technol. 2015, 149, 413–427. [Google Scholar] [CrossRef]
- Li, J.; You, C.J.; Lyu, Z.X.; Zhang, C.; Chen, L.F.; Qi, Z.W. Fuel-based ethanol dehydration process directly extracted by gasoline additive. Sep. Purif. Technol. 2015, 149, 9–15. [Google Scholar] [CrossRef]
- Aniya, V.; Singh, A.; De, D.; Satyavathi, B. An energy efficient route for the dehydration of 2-Methylpropan-2-ol: Experimental investigation, modeling and process optimization. Sep. Purif. Technol. 2015, 156, 738–753. [Google Scholar] [CrossRef]
- Marty, P.; Hetet, J.F.; Chalet, D.; Corrignan, P. Exergy analysis of complex ship energy systems. Entropy 2016, 18, 127. [Google Scholar] [CrossRef]
- Mistry, K.H.; Lienhard, J.H. Generalized least energy of separation for desalination and other chemical separation processes. Entropy 2013, 15, 2046–2080. [Google Scholar] [CrossRef]
- Mistry, K.H.; McGovern, R.K.; Thiel, G.P.; Summers, E.K.; Zubair, S.M.; Lienhard, J.H. Entropy generation analysis of desalination technologies. Entropy 2011, 13, 1829–1864. [Google Scholar] [CrossRef] [Green Version]
- Warner, R.J.; Amleh, W.; Grusendorf, G.; Horton, T.; Jevtie, R.; Johnston, V.J.; Olsson, F.R.; Powell, N.K.; Salado, M.; Sarager, L. Process for Producing Ethanol Using an Extractive Distillation Column. U.S. Patent 8,304,587 B2, 6 November 2012. [Google Scholar]
- Kim, Y.H. Energy saving of benzene separation process for environmentally friendly gasoline using an extended DWC. Energy 2016, 100, 58–65. [Google Scholar] [CrossRef]
- Kim, Y.H. Energy saving in benzene-toluene-xylene separation process using extended divided wall column. Chem. Eng. Technol. 2016, 39. [Google Scholar] [CrossRef]
- Kiss, A.A.; Suszwalak, D.J.P.C. Enhanced bioethanol dehydration by extractive and azeotropic distillation in dividing-wall columns. Sep. Purif. Technol. 2012, 86, 70–78. [Google Scholar] [CrossRef]
- Kiss, A.A.; Suszwalak, D.J.P.C. Innovative dimethyl ether synthesis in a reactive dividing-wall column. Comput. Chem. Eng. 2012, 38, 74–81. [Google Scholar] [CrossRef]
- Kim, Y.H. Side-rectifier divided wall column for offshore LNG plant. Sep. Purif. Technol. 2015, 139, 25–35. [Google Scholar] [CrossRef]
- Naqvi, S.N. Ethanol Production by Celanese Acetyl Technolgy; Process Economics Program; SRI Consulting: Menlo Park, CA, USA, 2011. [Google Scholar]
- Abrams, D.; Prausnitz, J. Statistical thermodynamics of liquid mixtures: A new expression for the excess Gibbs energy of partly or completely miscible systems. AIChE J. 1975, 21, 116–128. [Google Scholar] [CrossRef]
- Binous, H. Liquid-liquid equilibrium and extraction using mathematica. Comput. Educ. J. 2006, 16, 78–81. [Google Scholar]
- Widagdo, S.; Seider, W.D. Azeotropic distillation. AIChE J. 1996, 42, 96–130. [Google Scholar] [CrossRef]
- Kim, Y.H. Design and control of energy-efficient distillation columns. Korean J. Chem. Eng. 2016, 33, 2513–2521. [Google Scholar] [CrossRef]
- Goff, P.; Cachot, T.; Rivero, R. Exergy analysis of distillation processes. Chem. Eng. Technol. 1996, 19, 478–485. [Google Scholar] [CrossRef]
- Suphanit, B.; Bischert, A.; Narataruksa, P. Exergy loss analysis of heat transfer across the wall of the dividing-wall distillation column. Energy 2007, 32, 2121–2134. [Google Scholar] [CrossRef]
- De Koeijer, G.; Rivero, R. Entropy production and exergy loss in experimental distillation columns. Chem. Eng. Sci. 2003, 58, 1587–1597. [Google Scholar] [CrossRef]
- Anozie, A.N.; Osuolale, F.N.; Osunleke, A.S. Exergy analysis of binary plate distillation column operations. Int. J. Exergy 2009, 6, 715–728. [Google Scholar] [CrossRef]
- King, C.J. Separation Processes; McGraw-Hill: New York, NY, USA, 1971; pp. 625–633. [Google Scholar]
- Kim, Y.H. Application of partially diabatic divided wall column to floating liquefied natural gas plant. Energy 2014, 70, 435–443. [Google Scholar] [CrossRef]
- Olujic, Z.; Sun, L.; de Rijke, A.; Jansens, P.J. Conceptual design of an internally heat integrated propylene-propane splitter. Energy 2006, 31, 3083–3096. [Google Scholar] [CrossRef]
- Douglas, J.M. Conceptual Design of Chemical Processes; McGraw-Hill: New York, NY, USA, 1988. [Google Scholar]
- Turton, R.; Baille, R.C.; Whiting, W.B.; Shaeiwitz, J.A. Analysis, Synthesis, and Design of Chemical Processes, 2nd ed.; Prentice Hall: Upper Saddle River, NJ, USA, 2003; pp. 196–210. [Google Scholar]
Figure 1.
Schematic diagram of distillation columns in the conventional process for the ethanol concentration. The numbers in the columns indicate tray numbers, counted from the top.
Figure 1.
Schematic diagram of distillation columns in the conventional process for the ethanol concentration. The numbers in the columns indicate tray numbers, counted from the top.

Figure 2.
Ternary plots of distillation lines: (a) water (100 °C)–ethanol (78 °C)–acetaldehyde (21 °C) system; (b) water (100 °C)–ethanol (78 °C)–ethyl acetate (77 °C) system.
Figure 2.
Ternary plots of distillation lines: (a) water (100 °C)–ethanol (78 °C)–acetaldehyde (21 °C) system; (b) water (100 °C)–ethanol (78 °C)–ethyl acetate (77 °C) system.
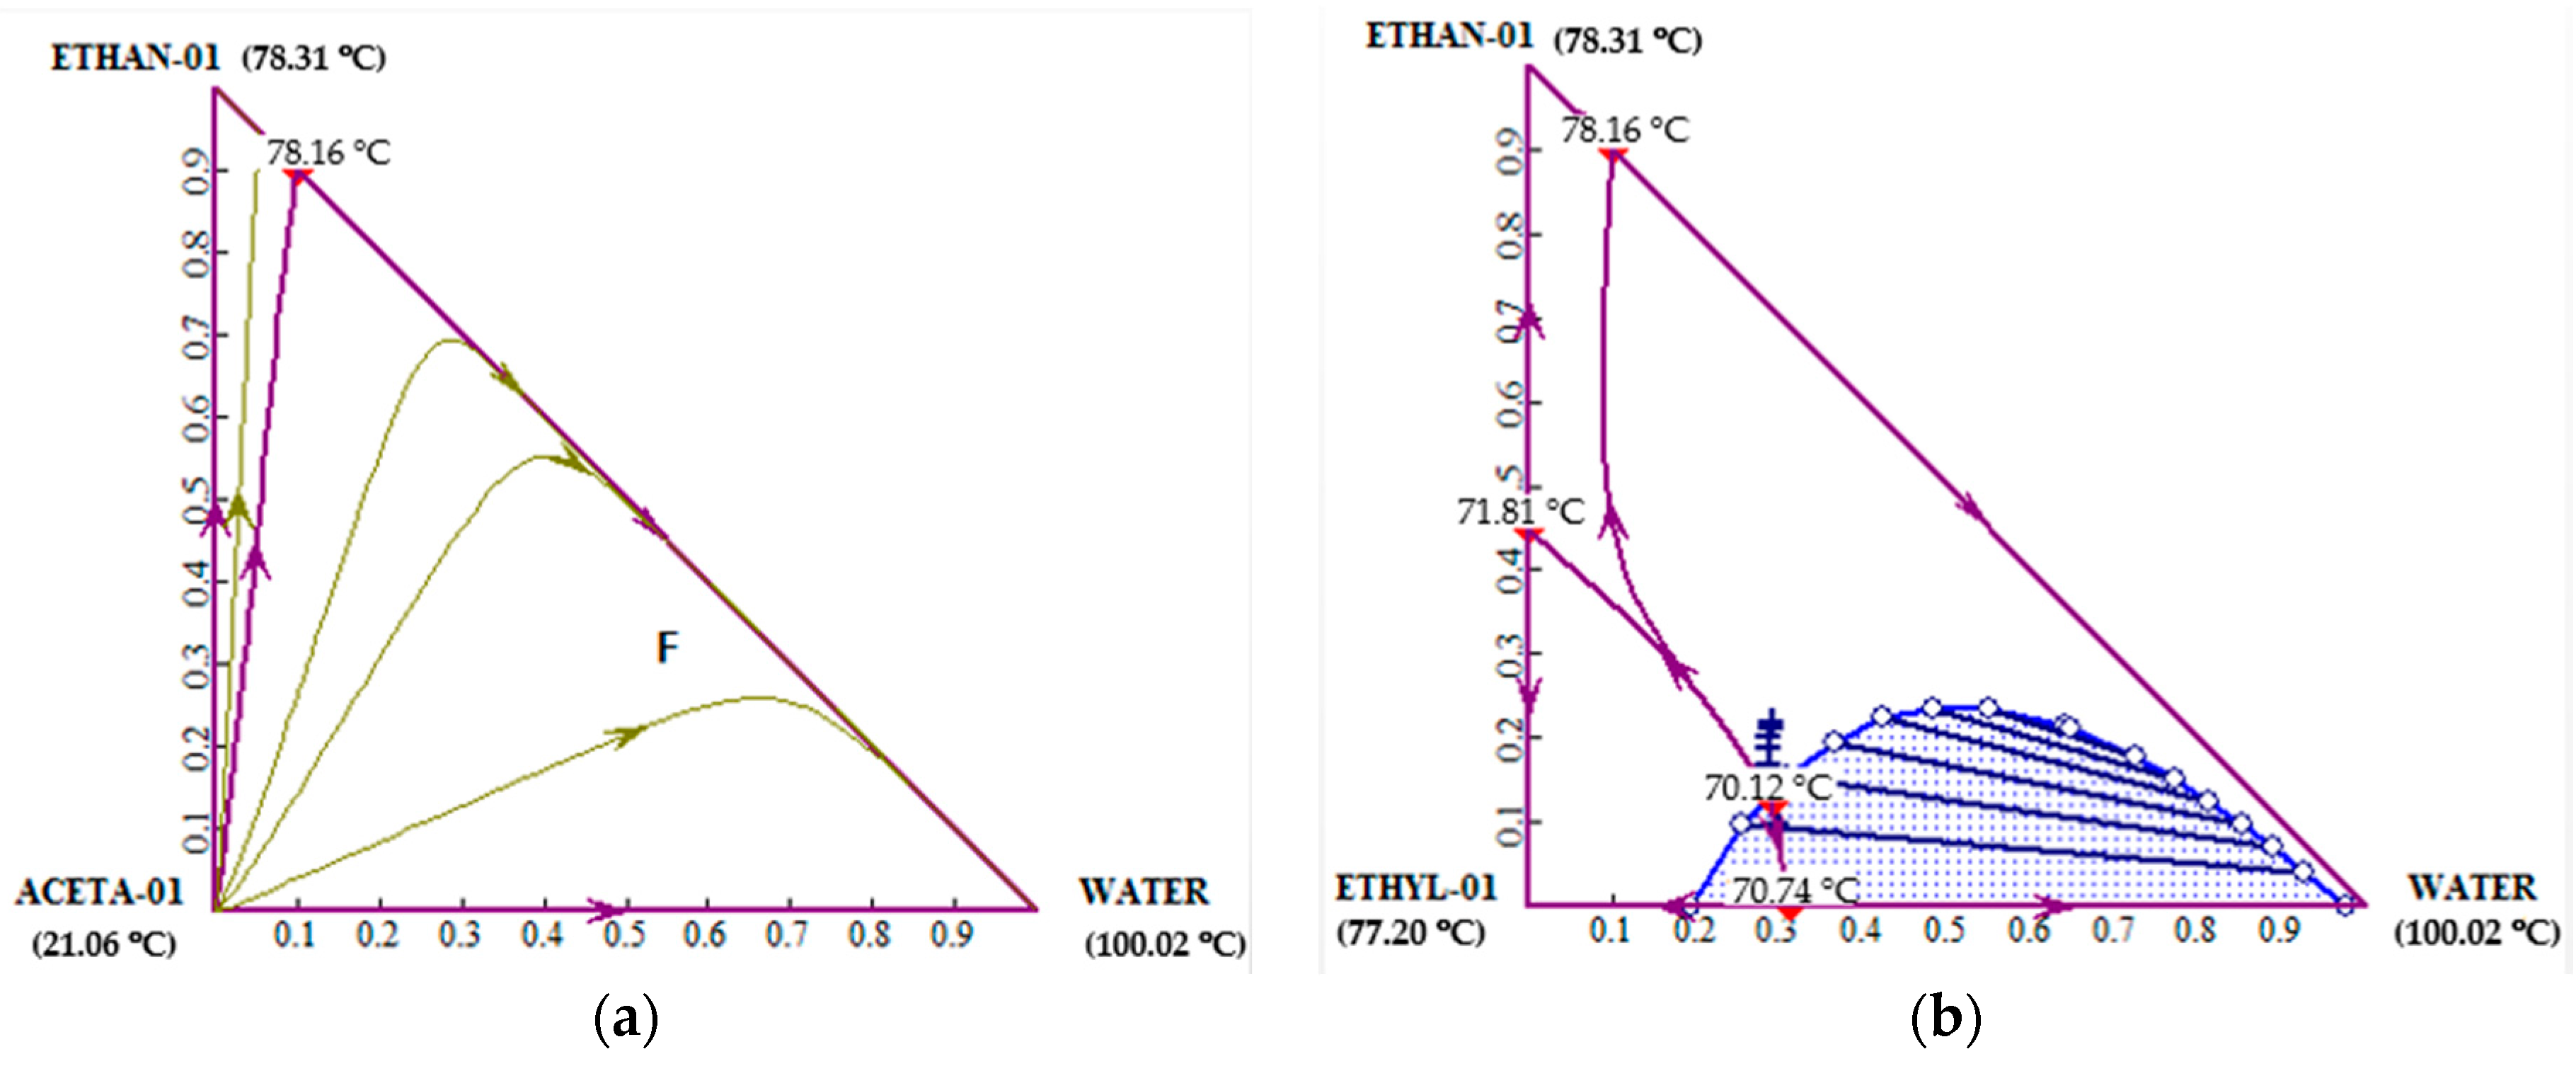
Figure 3.
Schematic diagram of the extended divided wall column for the ethanol concentration. The numbers in the column indicate the tray number from the top.
Figure 3.
Schematic diagram of the extended divided wall column for the ethanol concentration. The numbers in the column indicate the tray number from the top.
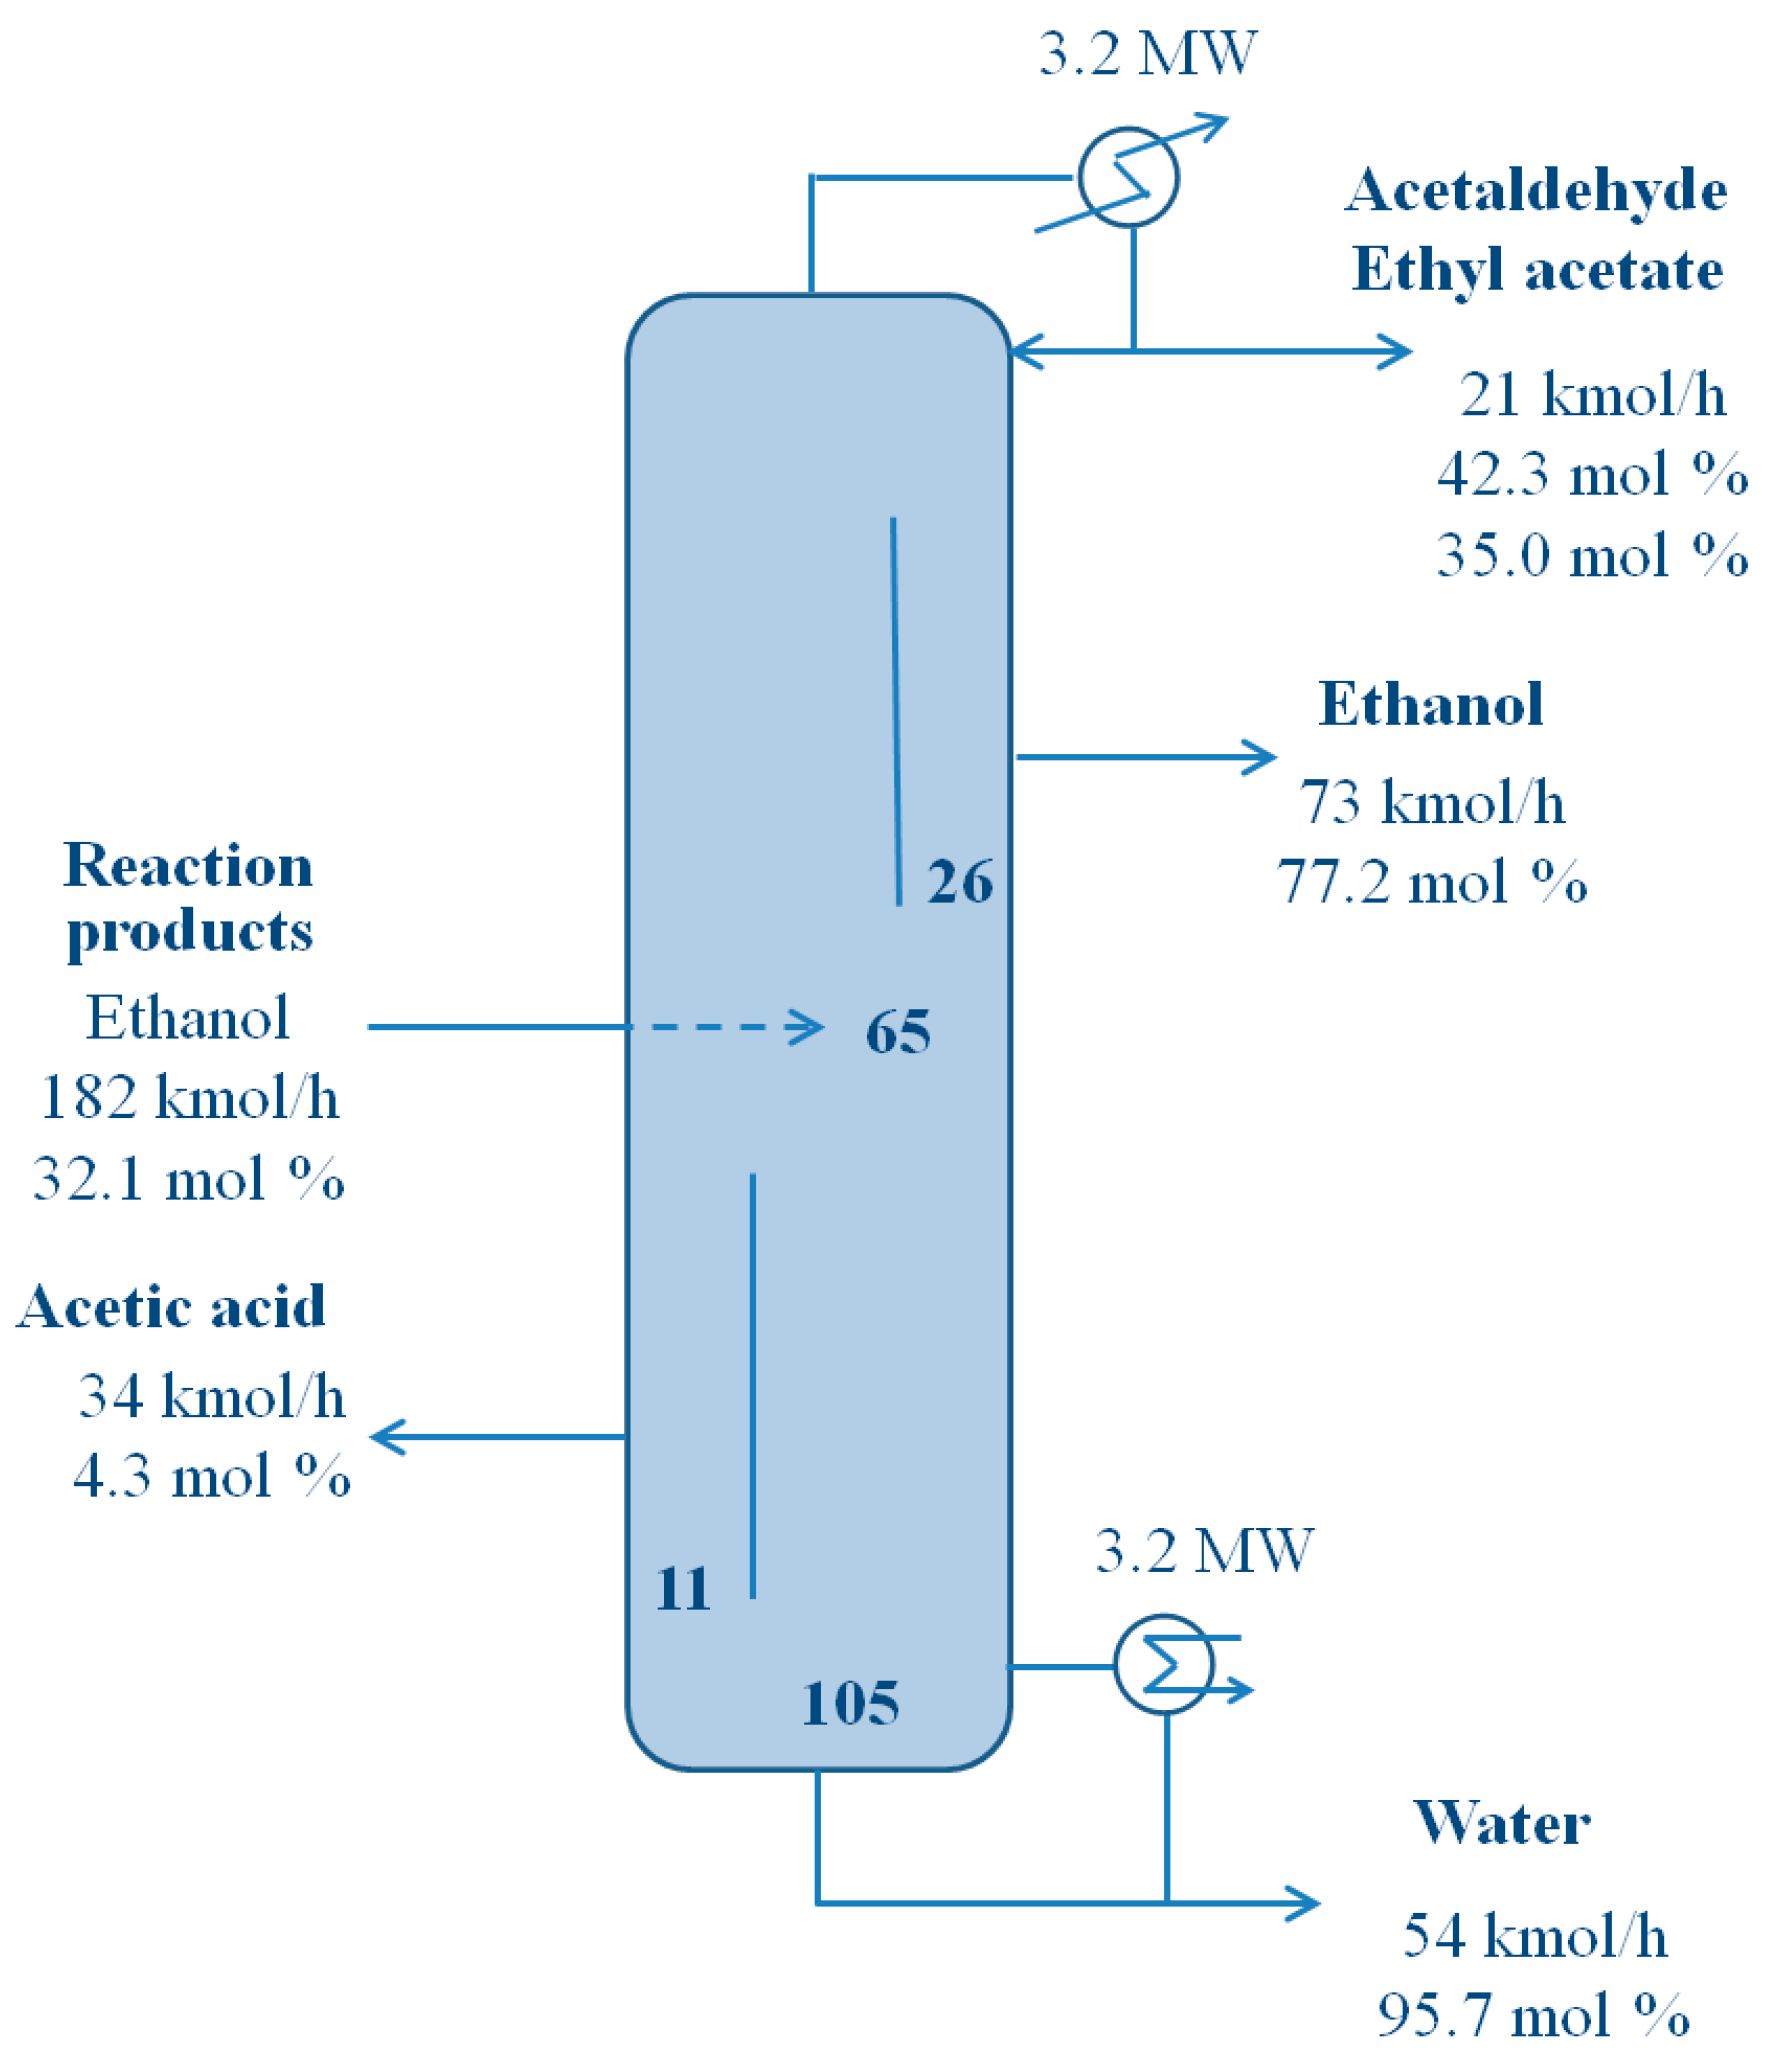
Figure 4.
Enthalpy–Carnot factor diagrams: (a) first column in the conventional system; (b) main column in the extended DWC.
Figure 4.
Enthalpy–Carnot factor diagrams: (a) first column in the conventional system; (b) main column in the extended DWC.


| Components | Molar Rate |
|---|---|
| Acetaldehyde | 12.583 |
| Ethyl acetate | 10.712 |
| Ethanol | 58.198 |
| Water | 95.105 |
| Acetic acid | 4.897 |
| Total | 181.5 |
Table 2.
Structural information and operating conditions in the conventional and proposed distillation processes. Tray numbers are counted from the top.
| Variable | Conventional Distillation Columns | Extended DWC (Divided Wall Column) | ||||
|---|---|---|---|---|---|---|
| I | II | III | Main | Auxil. I | Auxil. II | |
| Structural | ||||||
| Tray No. | 48 | 56 | 39 | 105 | 26 | 11 |
| Feed/Side | 28 | 29 | 30 | 65 | 13 | 9 |
| Interlinking | 18/42 | 71/85 | ||||
| Operating | ||||||
| Pressure (MPa)—top | 1.5 | 1.2 | 1.1 | 1.2 | 1.25 | 1.3 |
| Temperature (°C) | ||||||
| Overhead | 100 | 50 | 79 | 66 | 78 | 94 |
| Bottom | 120 | 96 | 90 | 113 | 83 | 105 |
| Feed (kmol/h) | 182 | 124 | 103 | 182 | ||
| Product (kmol/h) | ||||||
| Overhead | 124 | 21 | 71 | 21 | ||
| Bottom | 58 | 103 | 32 | 54 | ||
| Side | 73 | 34 | ||||
| Reflux (kmol/h) | 136 | 24 | 148 | 321 | 95 | 74 |
| Vap. boilup(kmol/h) | 264 | 39 | 104 | 294 | 140 | 105 |
| Cooling duty (MW) | 2.7 | 0.4 | 2.3 | 3.2 | ||
| Reboiler duty (MW) | 2.8 | 0.4 | 1.2 | 3.2 | ||
| Comp. (mol frac.) Feed | ||||||
| Ethanol | 0.321 | 0.471 | 0.542 | 0.321 | ||
| Product | Ovhd. | Bott | Ovhd. | Ovhd. | Side | Side |
| Ethanol | 0.471 | 0.542 | 0.772 | 0.05 | 0.772 | 0.02 |
Table 3.
List of total annual costs with different numbers of total trays in the proposed distillation process. Units are in million U.S. dollars, and the utility cost is per annum.
| Name | Extended DWC | |||
|---|---|---|---|---|
| Total number of trays | 138 | 142 | 146 | 150 |
| Investment | 1.949 | 1.976 | 2.009 | 2.043 |
| Utility | 0.231 | 0.224 | 0.221 | 0.219 |
| Total annual cost | 0.6208 | 0.6192 | 0.6228 | 0.6276 |
Table 4.
Economic evaluation of the conventional and proposed systems of the ethanol production. Units are in million U.S. dollars, and the utility cost is per annum.
| Variable | Conventional Distillation Columns | Extended DWC | ||||
|---|---|---|---|---|---|---|
| I | II | III | Main | Auxil. I | Auxil. II | |
| Investment | ||||||
| Column | 0.445 | 0.182 | 0.229 | 0.956 | 0.197 | 0.084 |
| Tray | 0.035 | 0.009 | 0.014 | 0.093 | 0.012 | 0.004 |
| Heat exchanger | 0.388 | 0.591 | 0.471 | 0.630 | ||
| Total | 2.364 | 1.976 | ||||
| Utility | ||||||
| Coolant | - | 0.008 | - | 0.014 | - | - |
| Steam | 0.210 | 0.024 | 0.073 | 0.224 | - | - |
| Total | 0.315 | 0.238 | ||||
Table 5.
Exergy loss and thermodynamic efficiency in the conventional and proposed systems of the ethanol process. Units are in MW.
| Name | Conventional Distillation Columns | Extended DWC | ||||
|---|---|---|---|---|---|---|
| I | II | III | Main | Auxil. I | Auxil. II | |
| Cooling | 0.245 | |||||
| Trays | 0.602 | 0.297 | 0.057 | 1.026 | −0.031 | −0.106 |
| Heating | 0.332 | 0.010 | 0.008 | 0.045 | ||
| Total | 1.306 | 1.179 | ||||
| Feed exergy | −0.244 | |||||
| Product exergy | 0.006 | −0.01 | −0.095 | |||
| Min. work | 0.145 | 0.145 | ||||
| Thermodynamic efficiency (%) | 9.99 | 10.95 | ||||
© 2016 by the author; licensee MDPI, Basel, Switzerland. This article is an open access article distributed under the terms and conditions of the Creative Commons Attribution (CC-BY) license (http://creativecommons.org/licenses/by/4.0/).
Share and Cite
MDPI and ACS Style
Kim, Y.H. Energy Efficiency Improvement in a Modified Ethanol Process from Acetic Acid. Entropy 2016, 18, 422. https://doi.org/10.3390/e18120422
AMA Style
Kim YH. Energy Efficiency Improvement in a Modified Ethanol Process from Acetic Acid. Entropy. 2016; 18(12):422. https://doi.org/10.3390/e18120422
Chicago/Turabian StyleKim, Young Han. 2016. "Energy Efficiency Improvement in a Modified Ethanol Process from Acetic Acid" Entropy 18, no. 12: 422. https://doi.org/10.3390/e18120422
Note that from the first issue of 2016, this journal uses article numbers instead of page numbers. See further details here.