
Design of Light-Weight High-Entropy Alloys


Abstract
:1. Introduction
2. Materials and Methods
3. Phase-Formation Rules of HEAs
4. Results
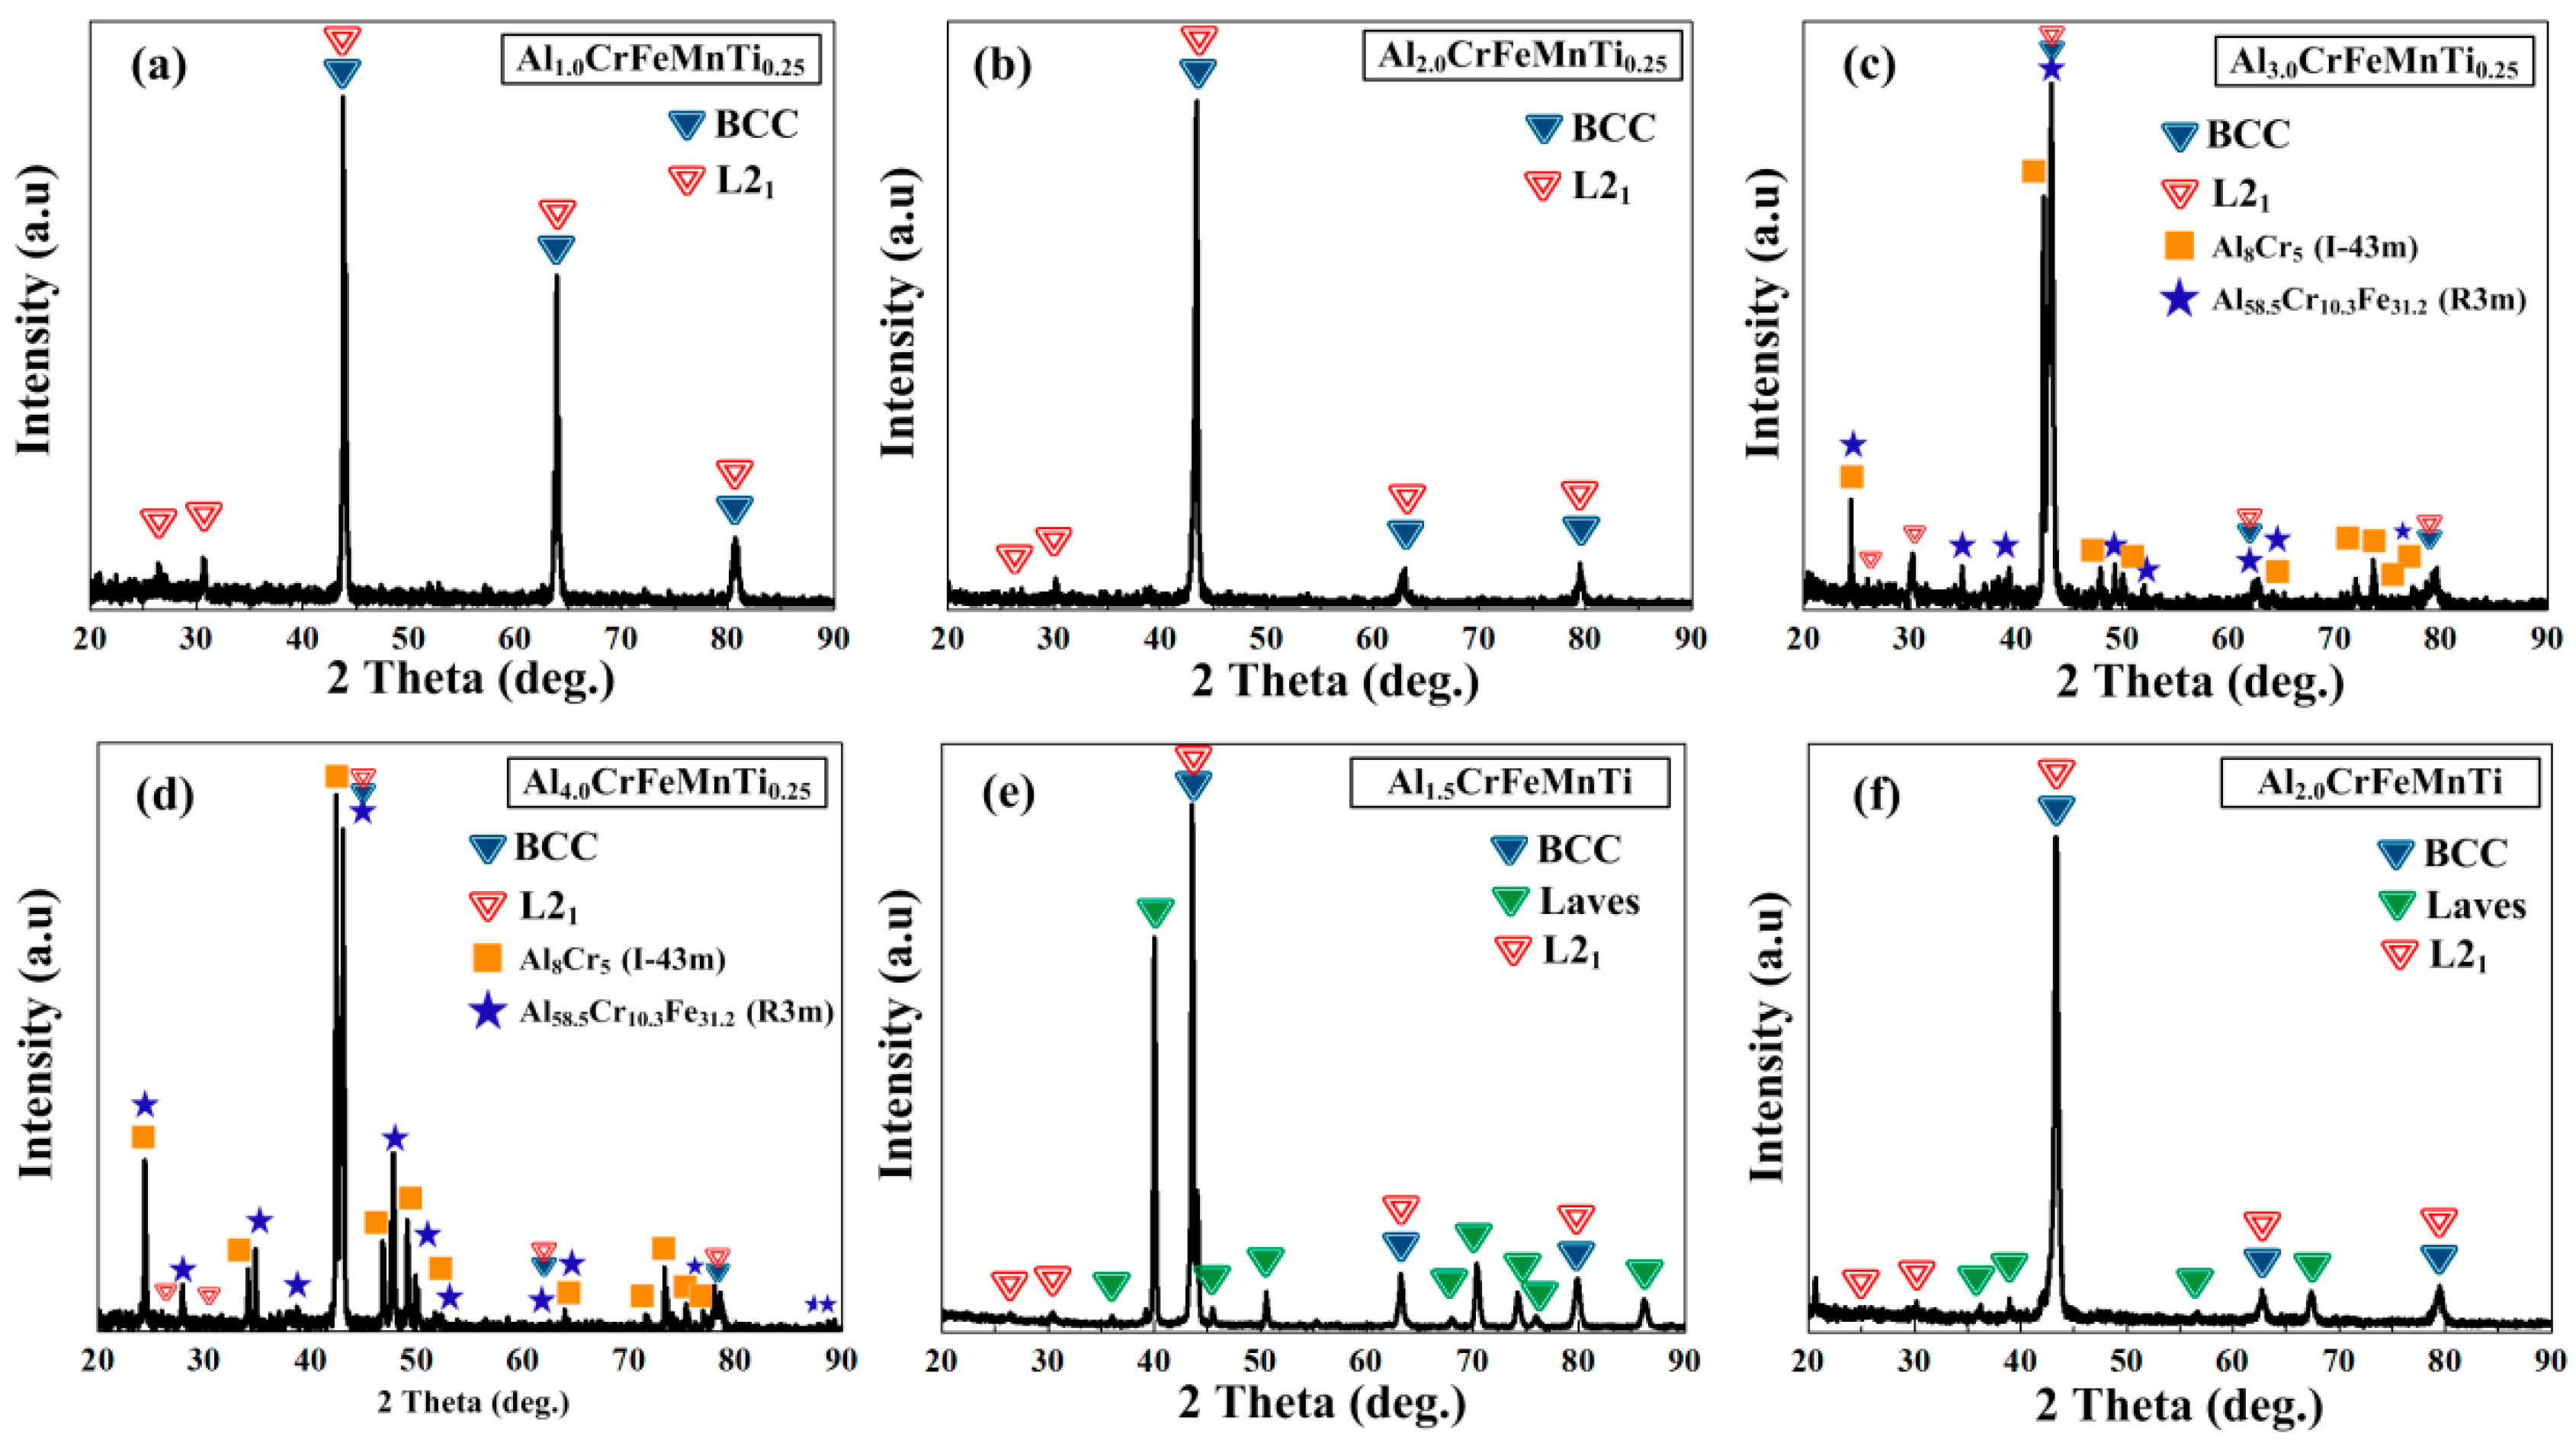
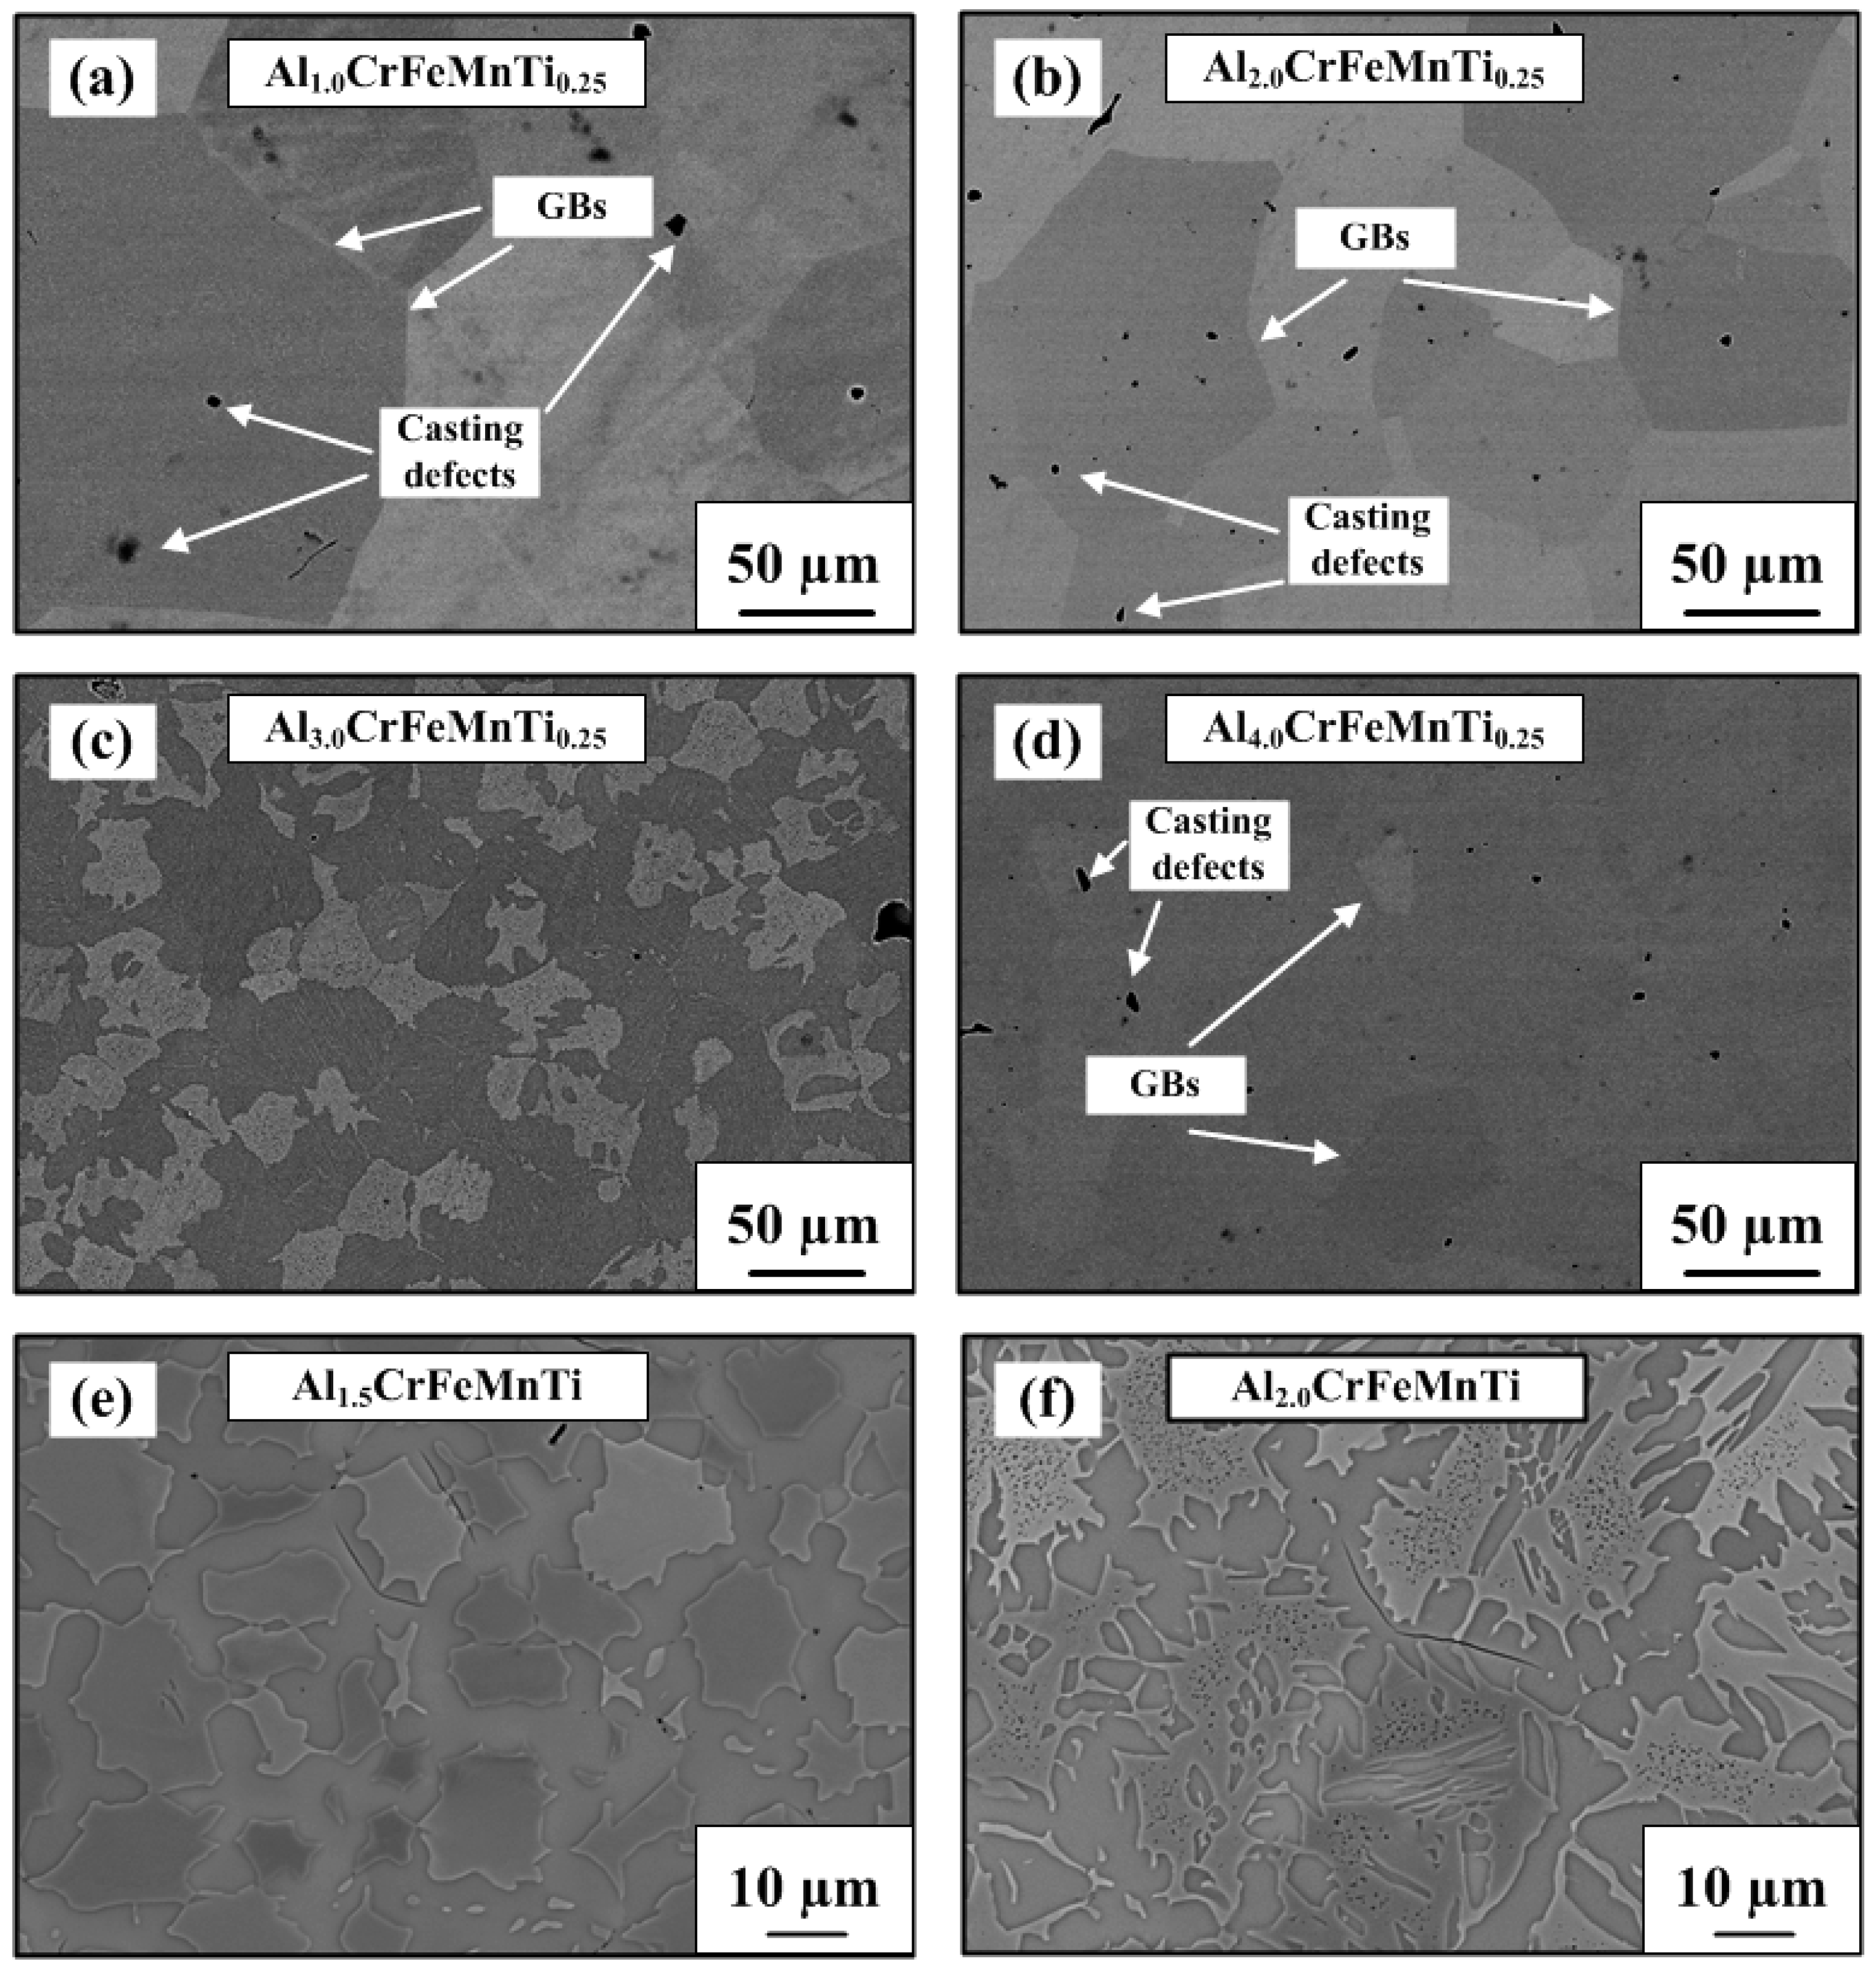
4.1. Newly-Designed Light-Weight HEAs
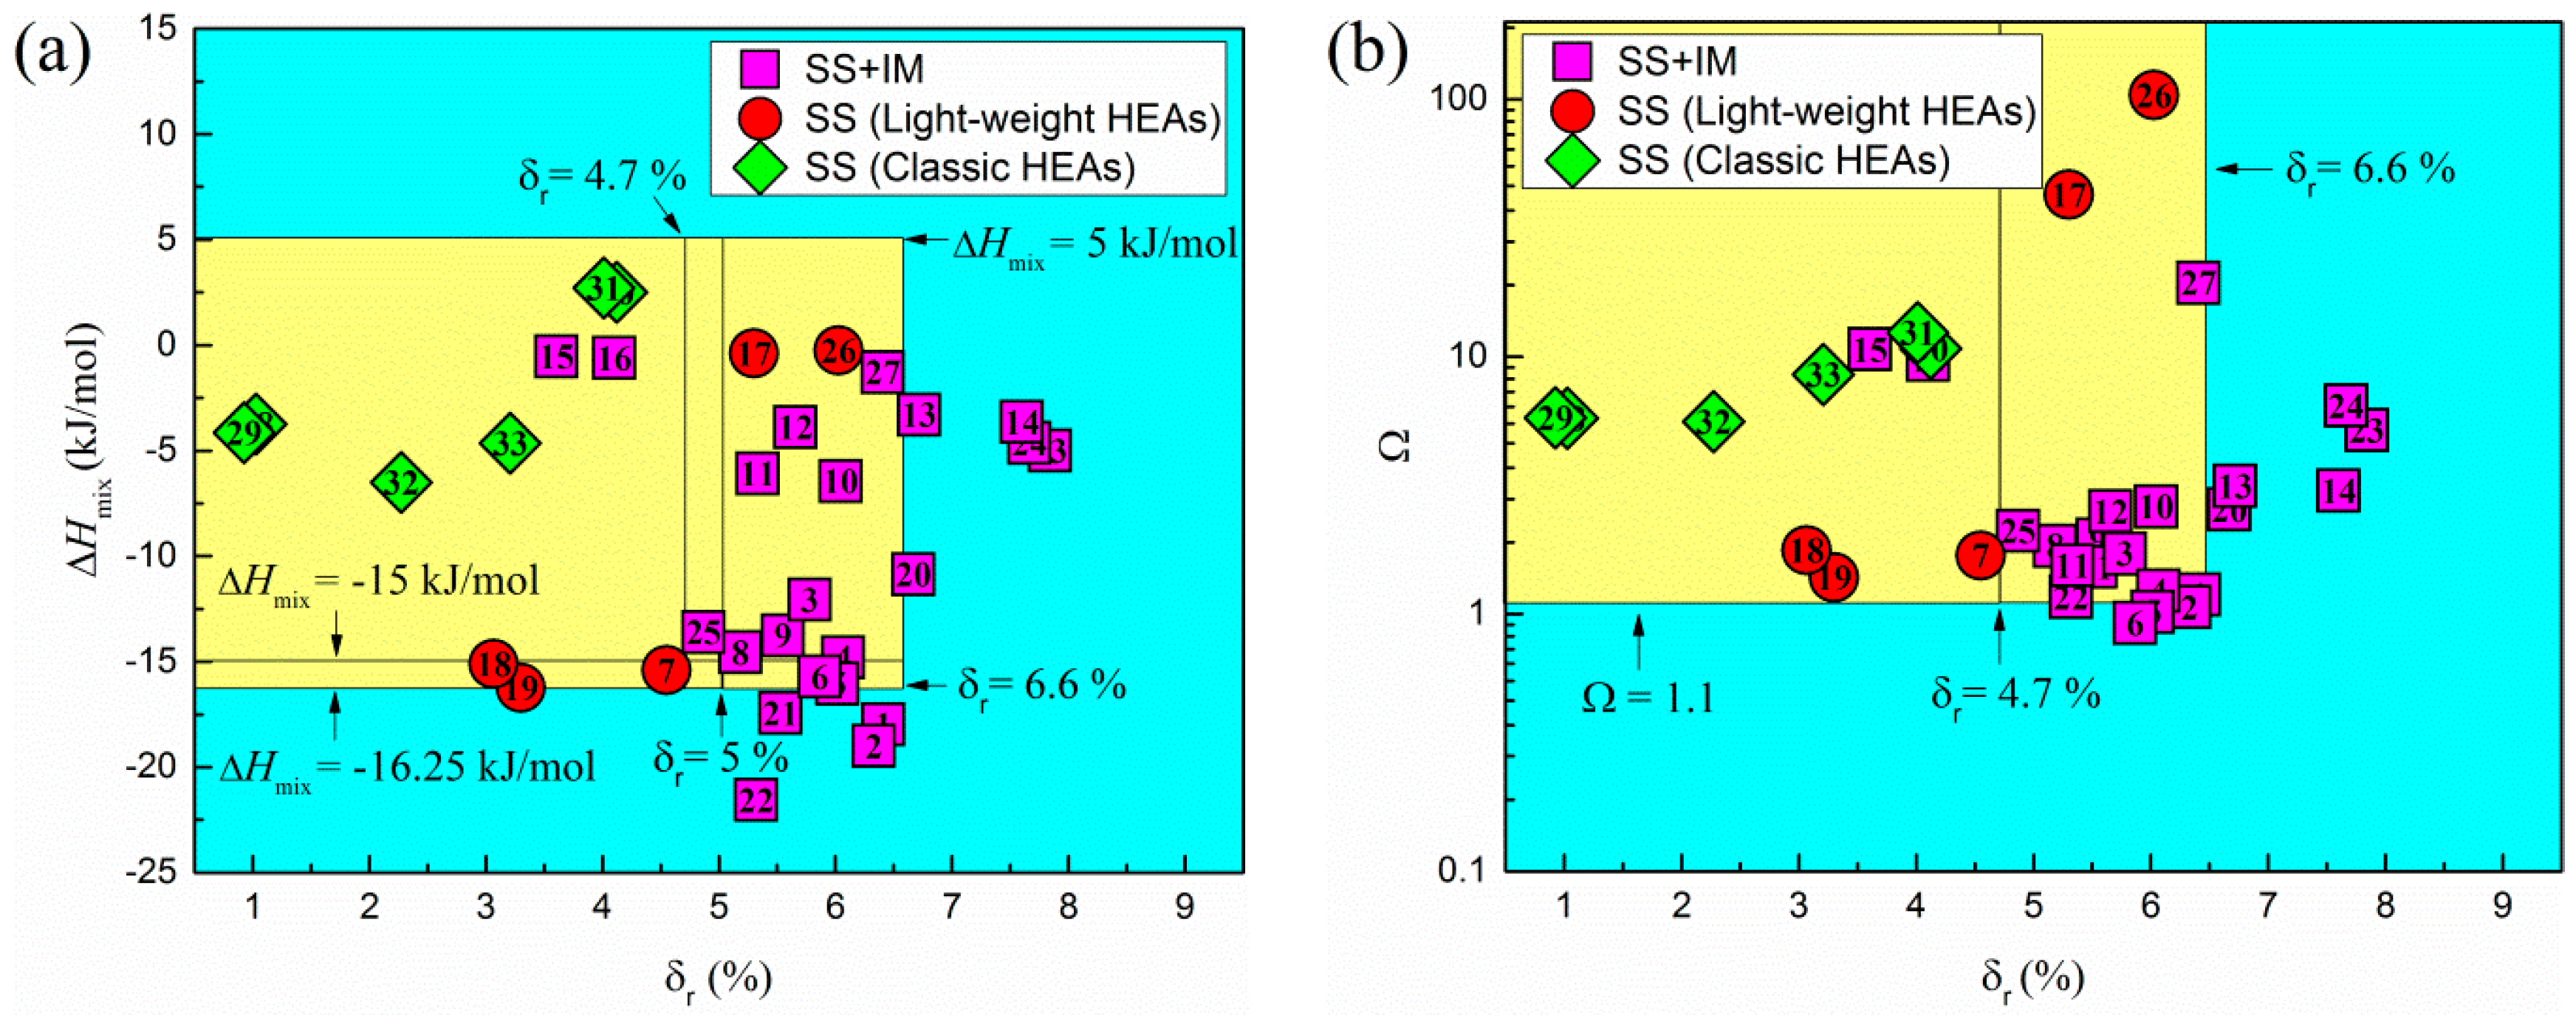
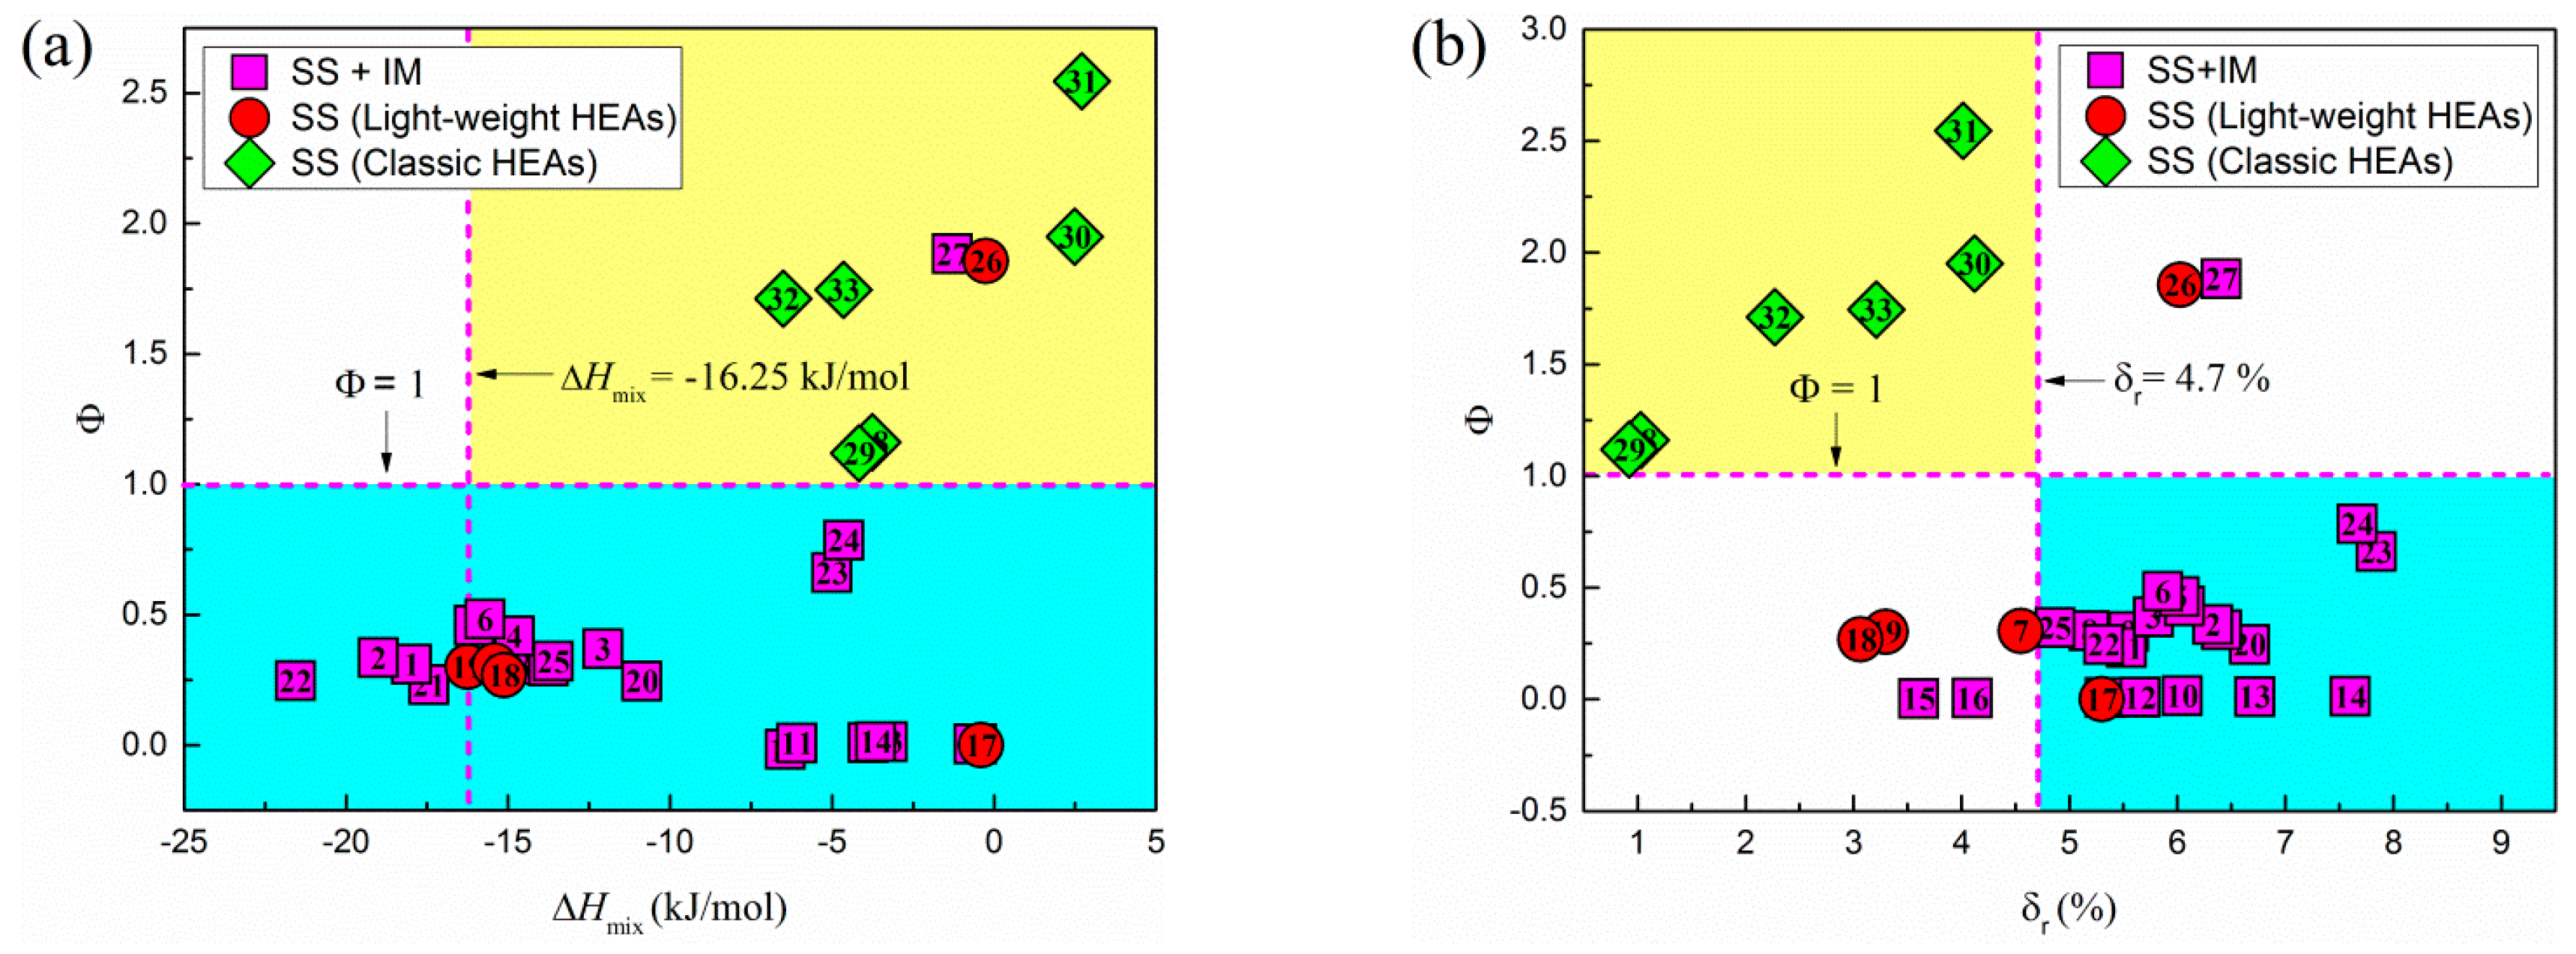
4.2. Criteria Based on , , and
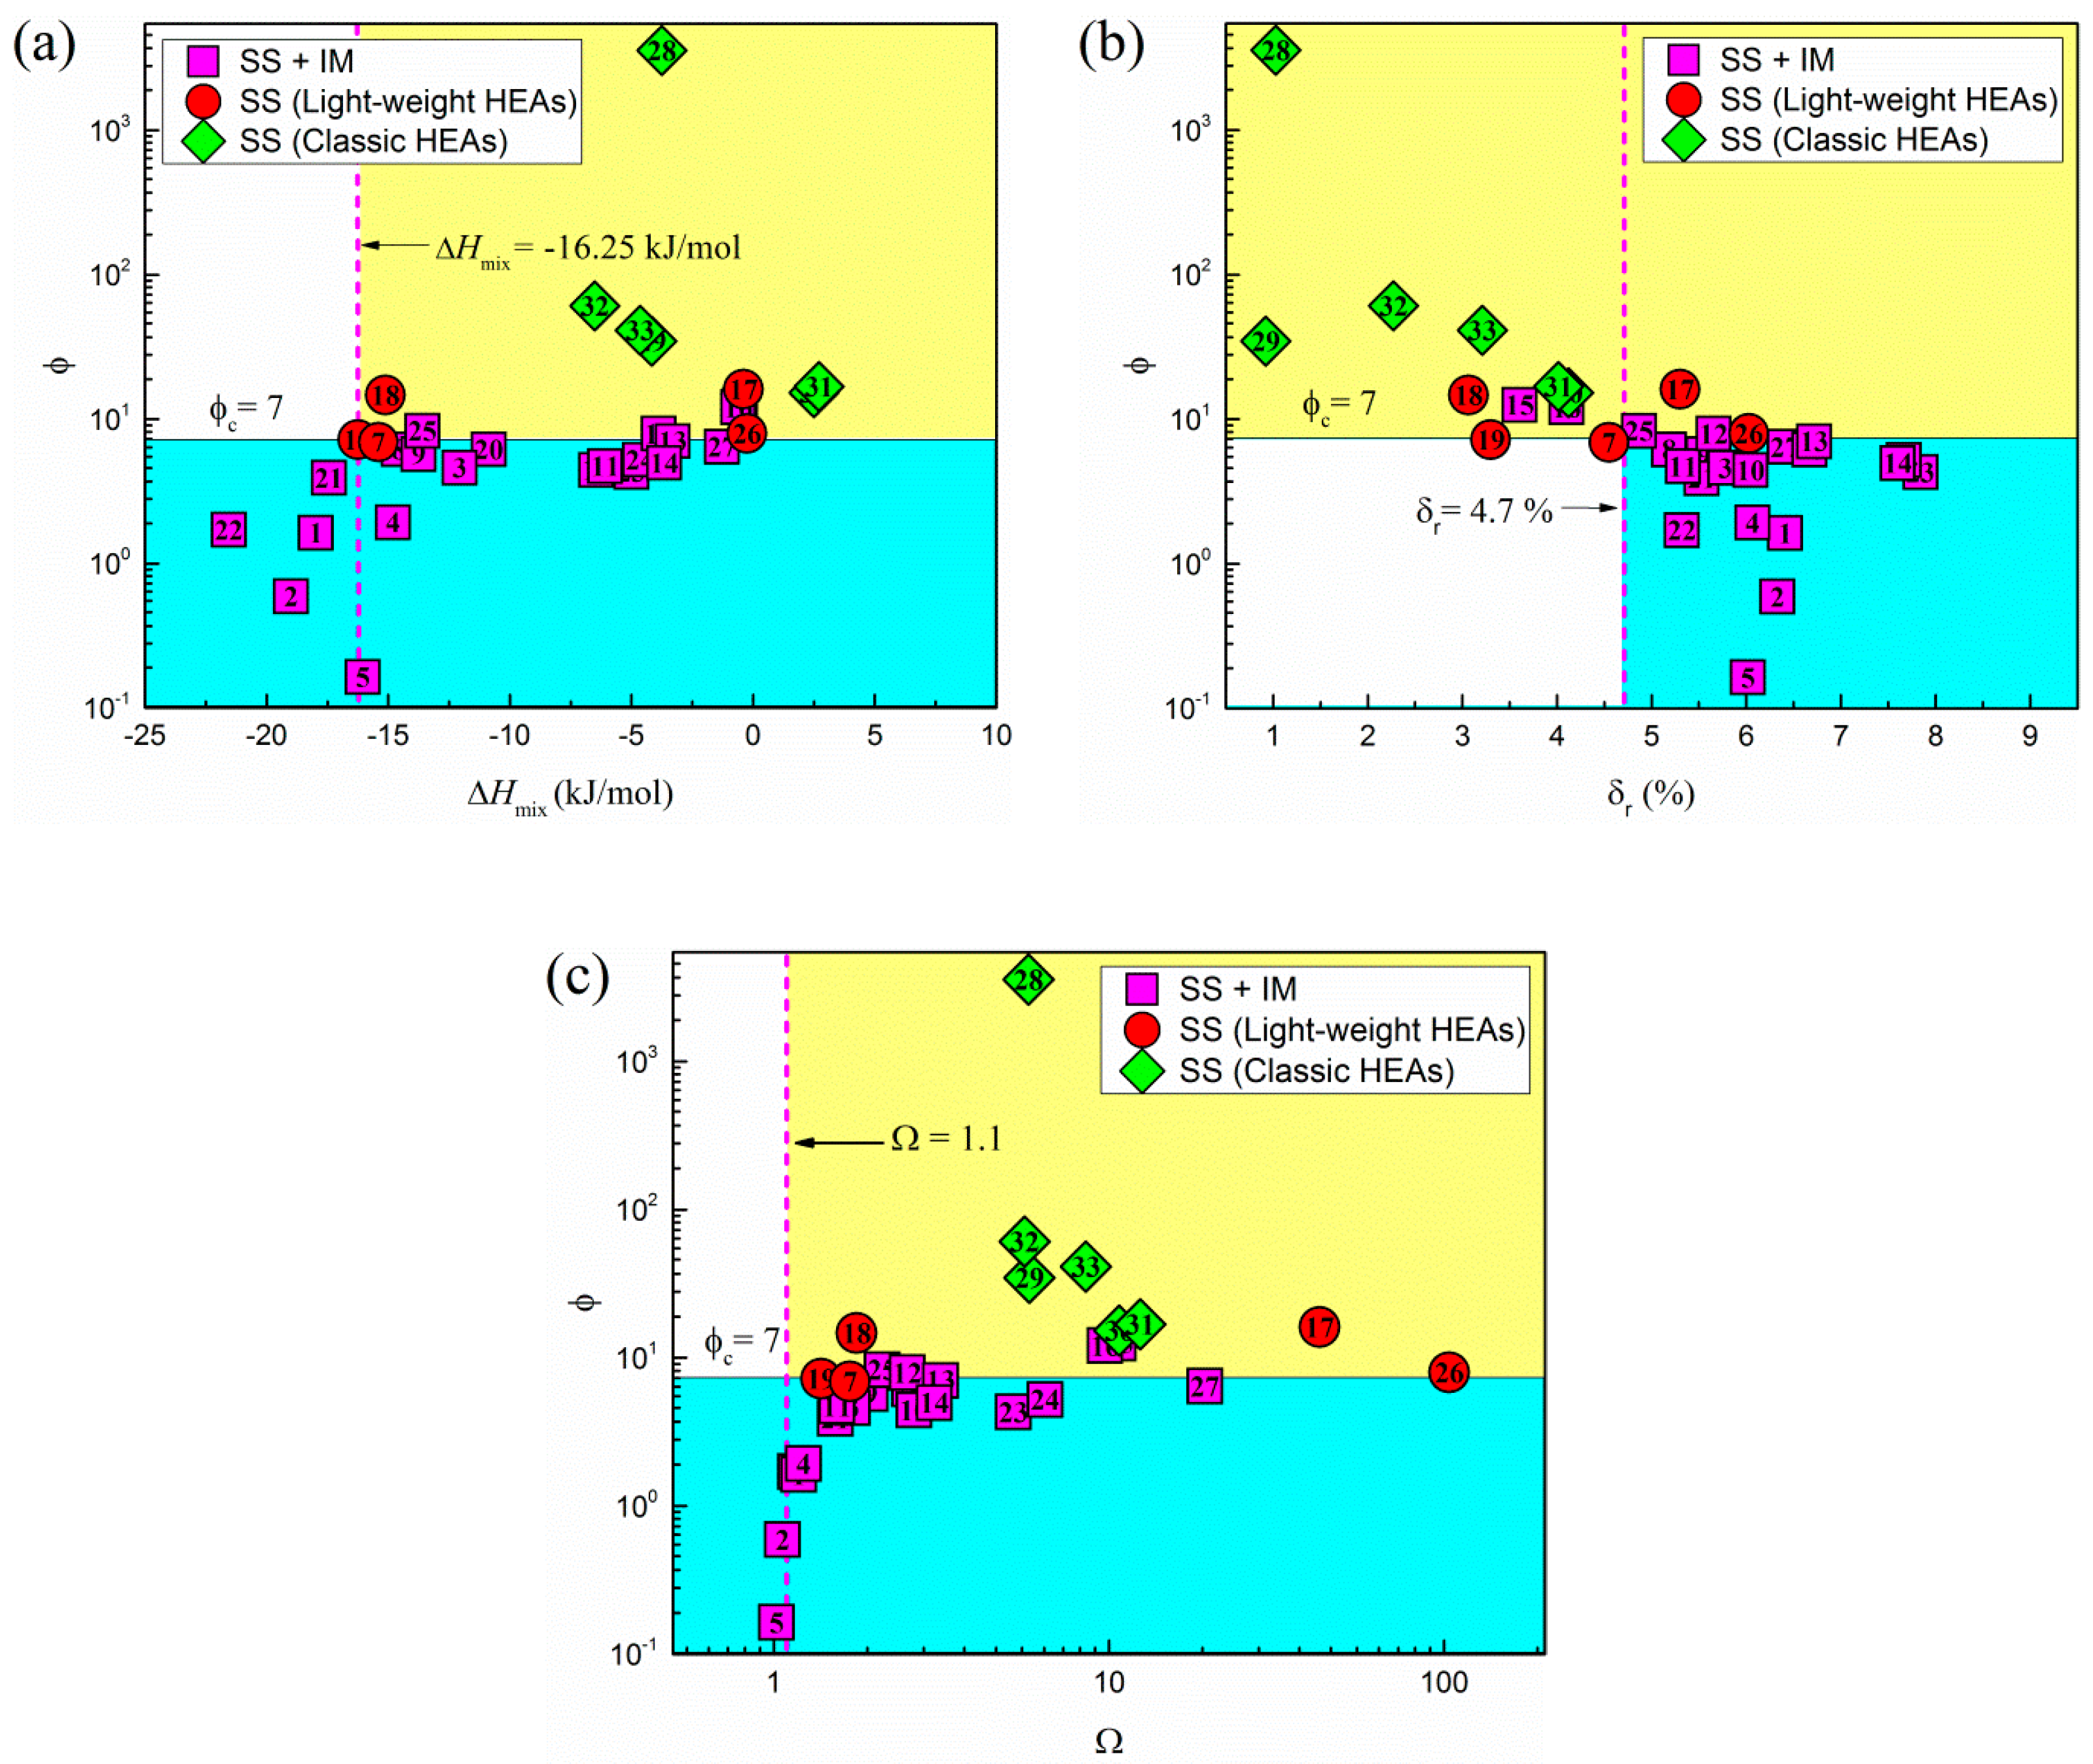
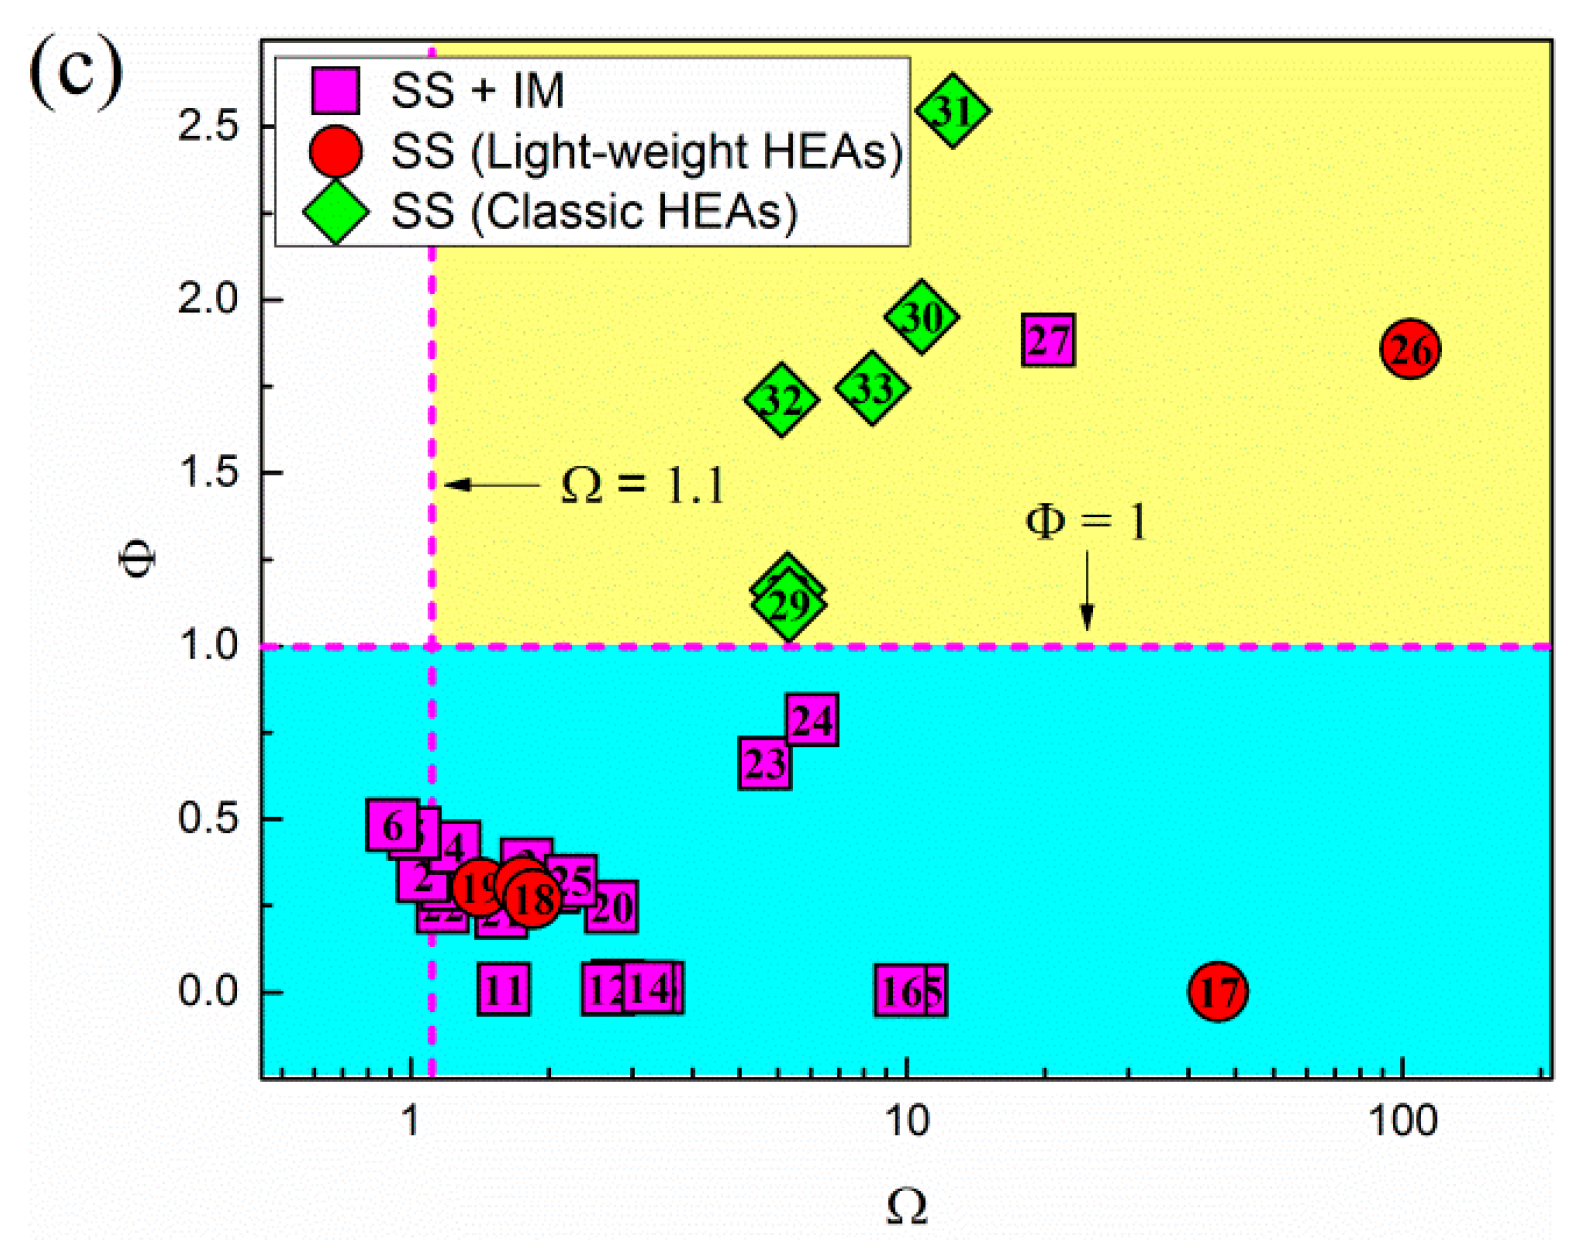
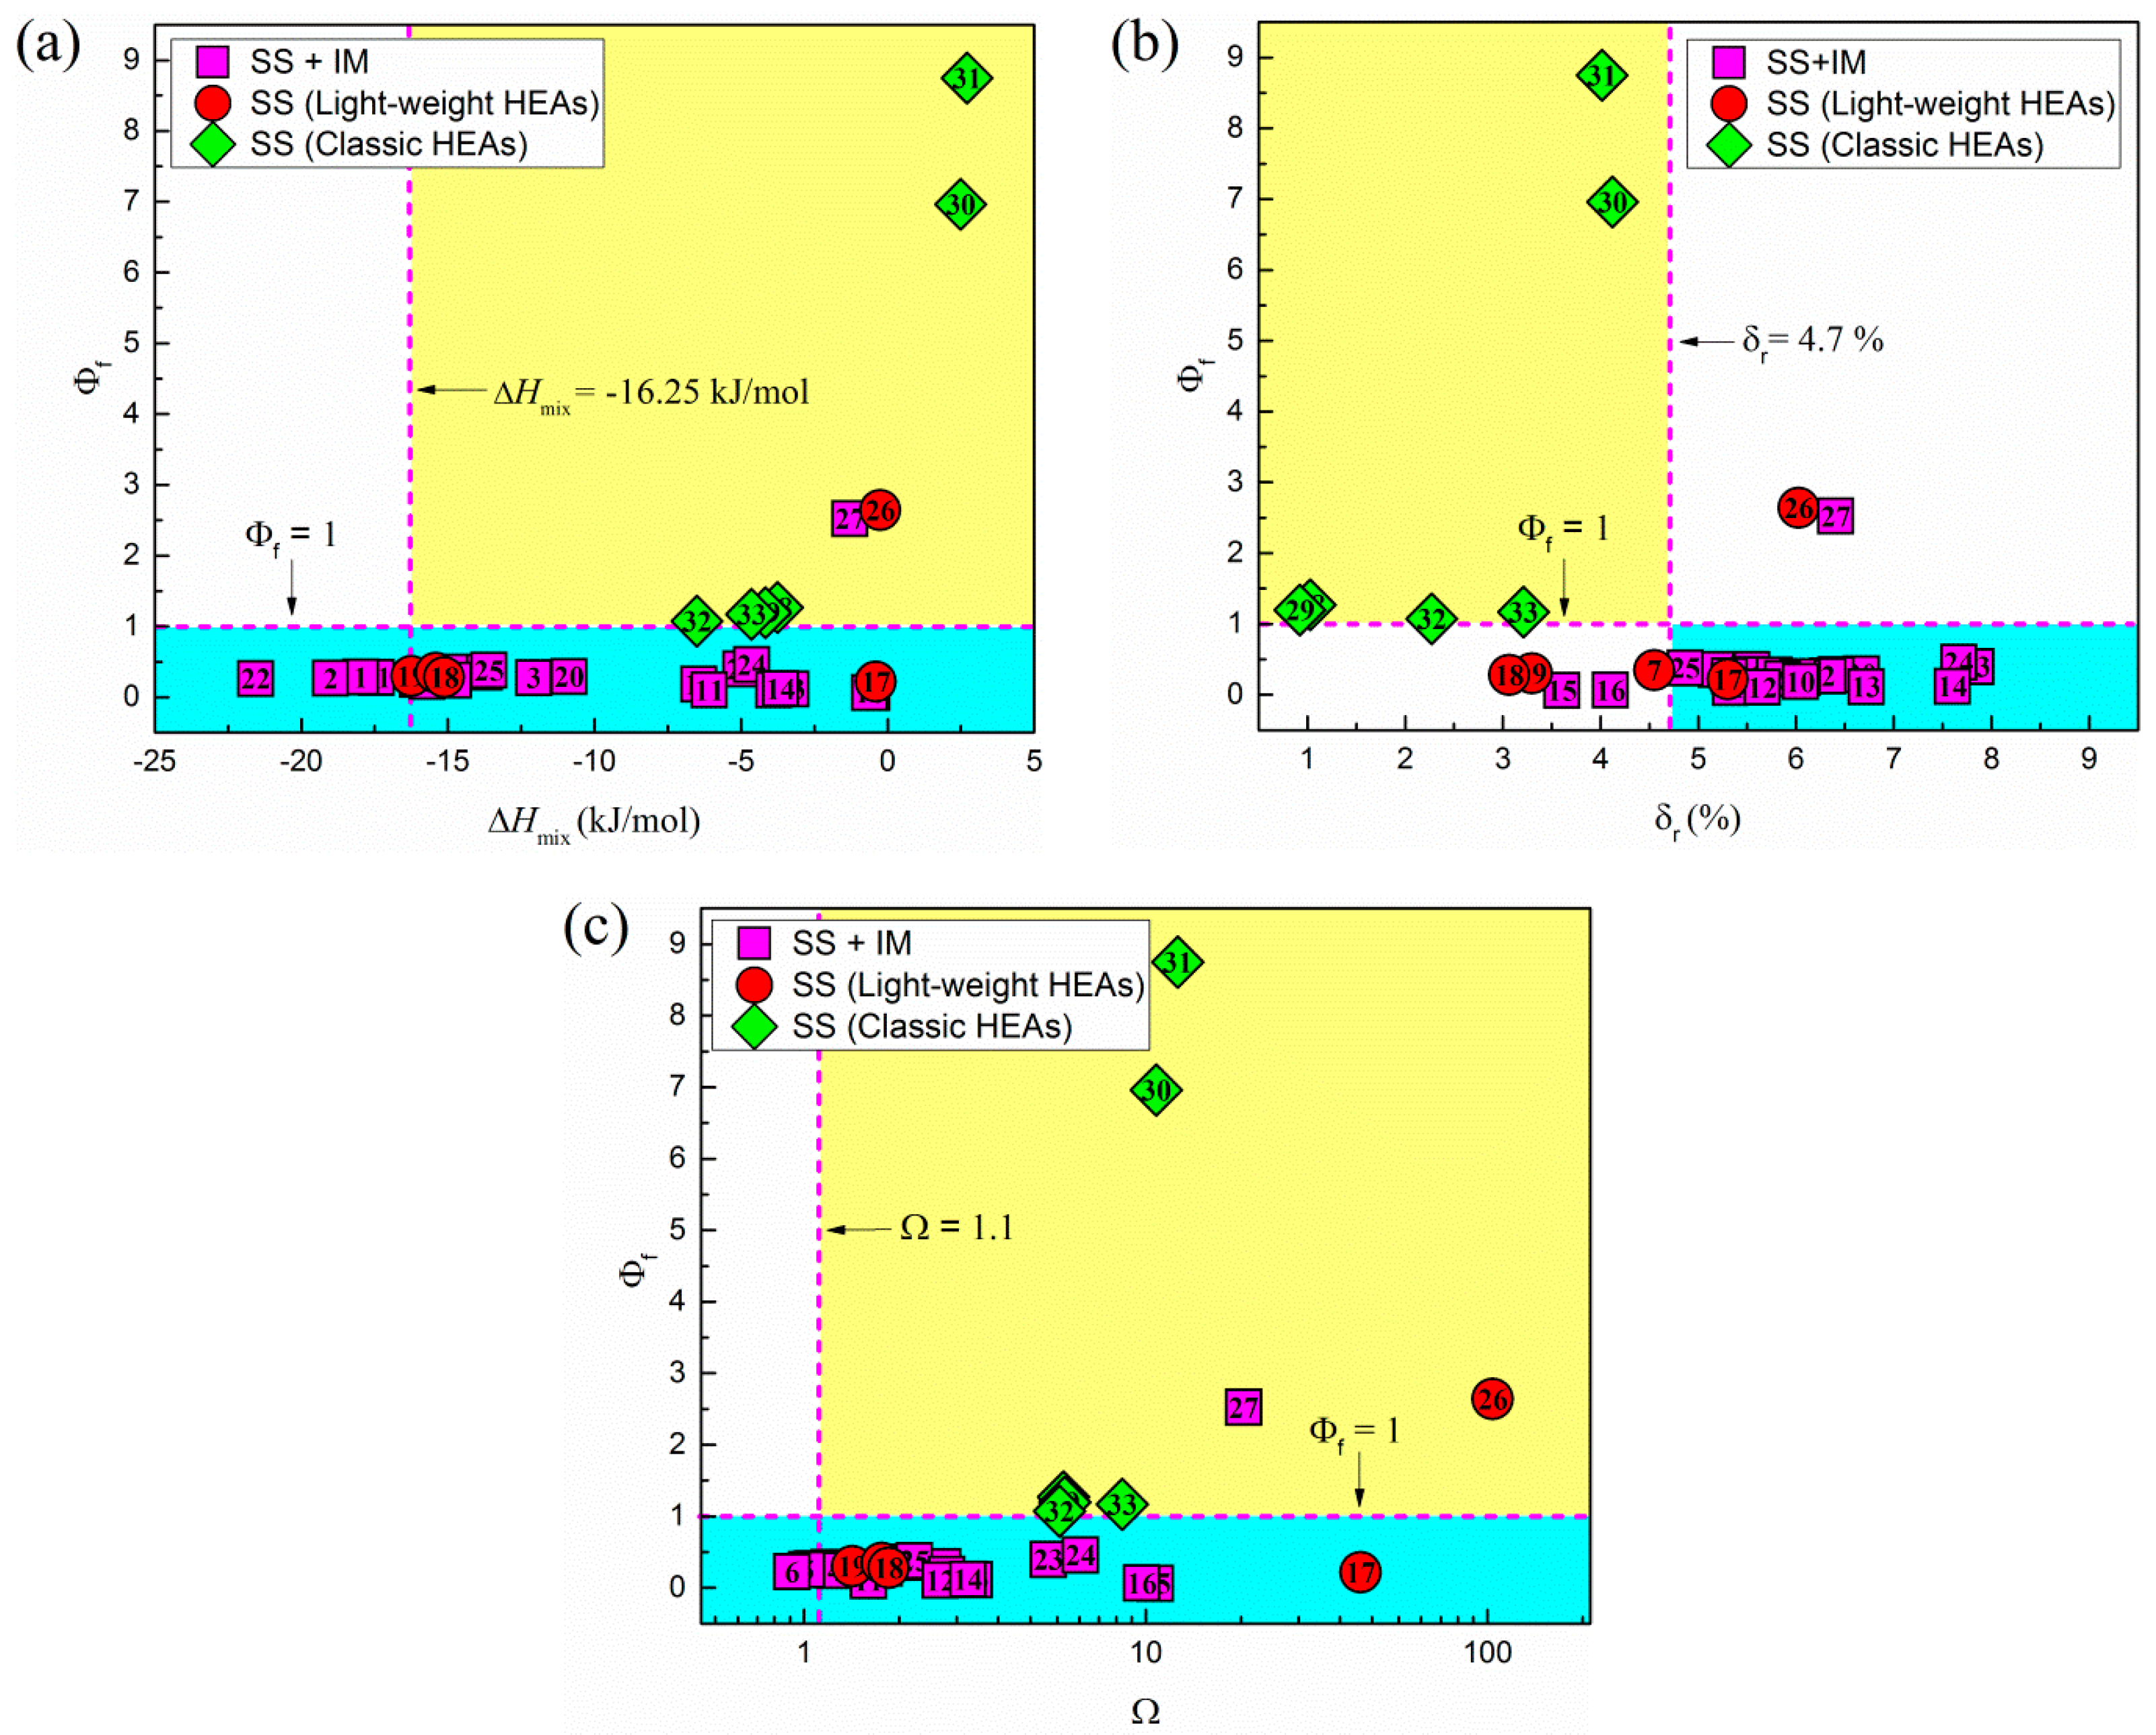
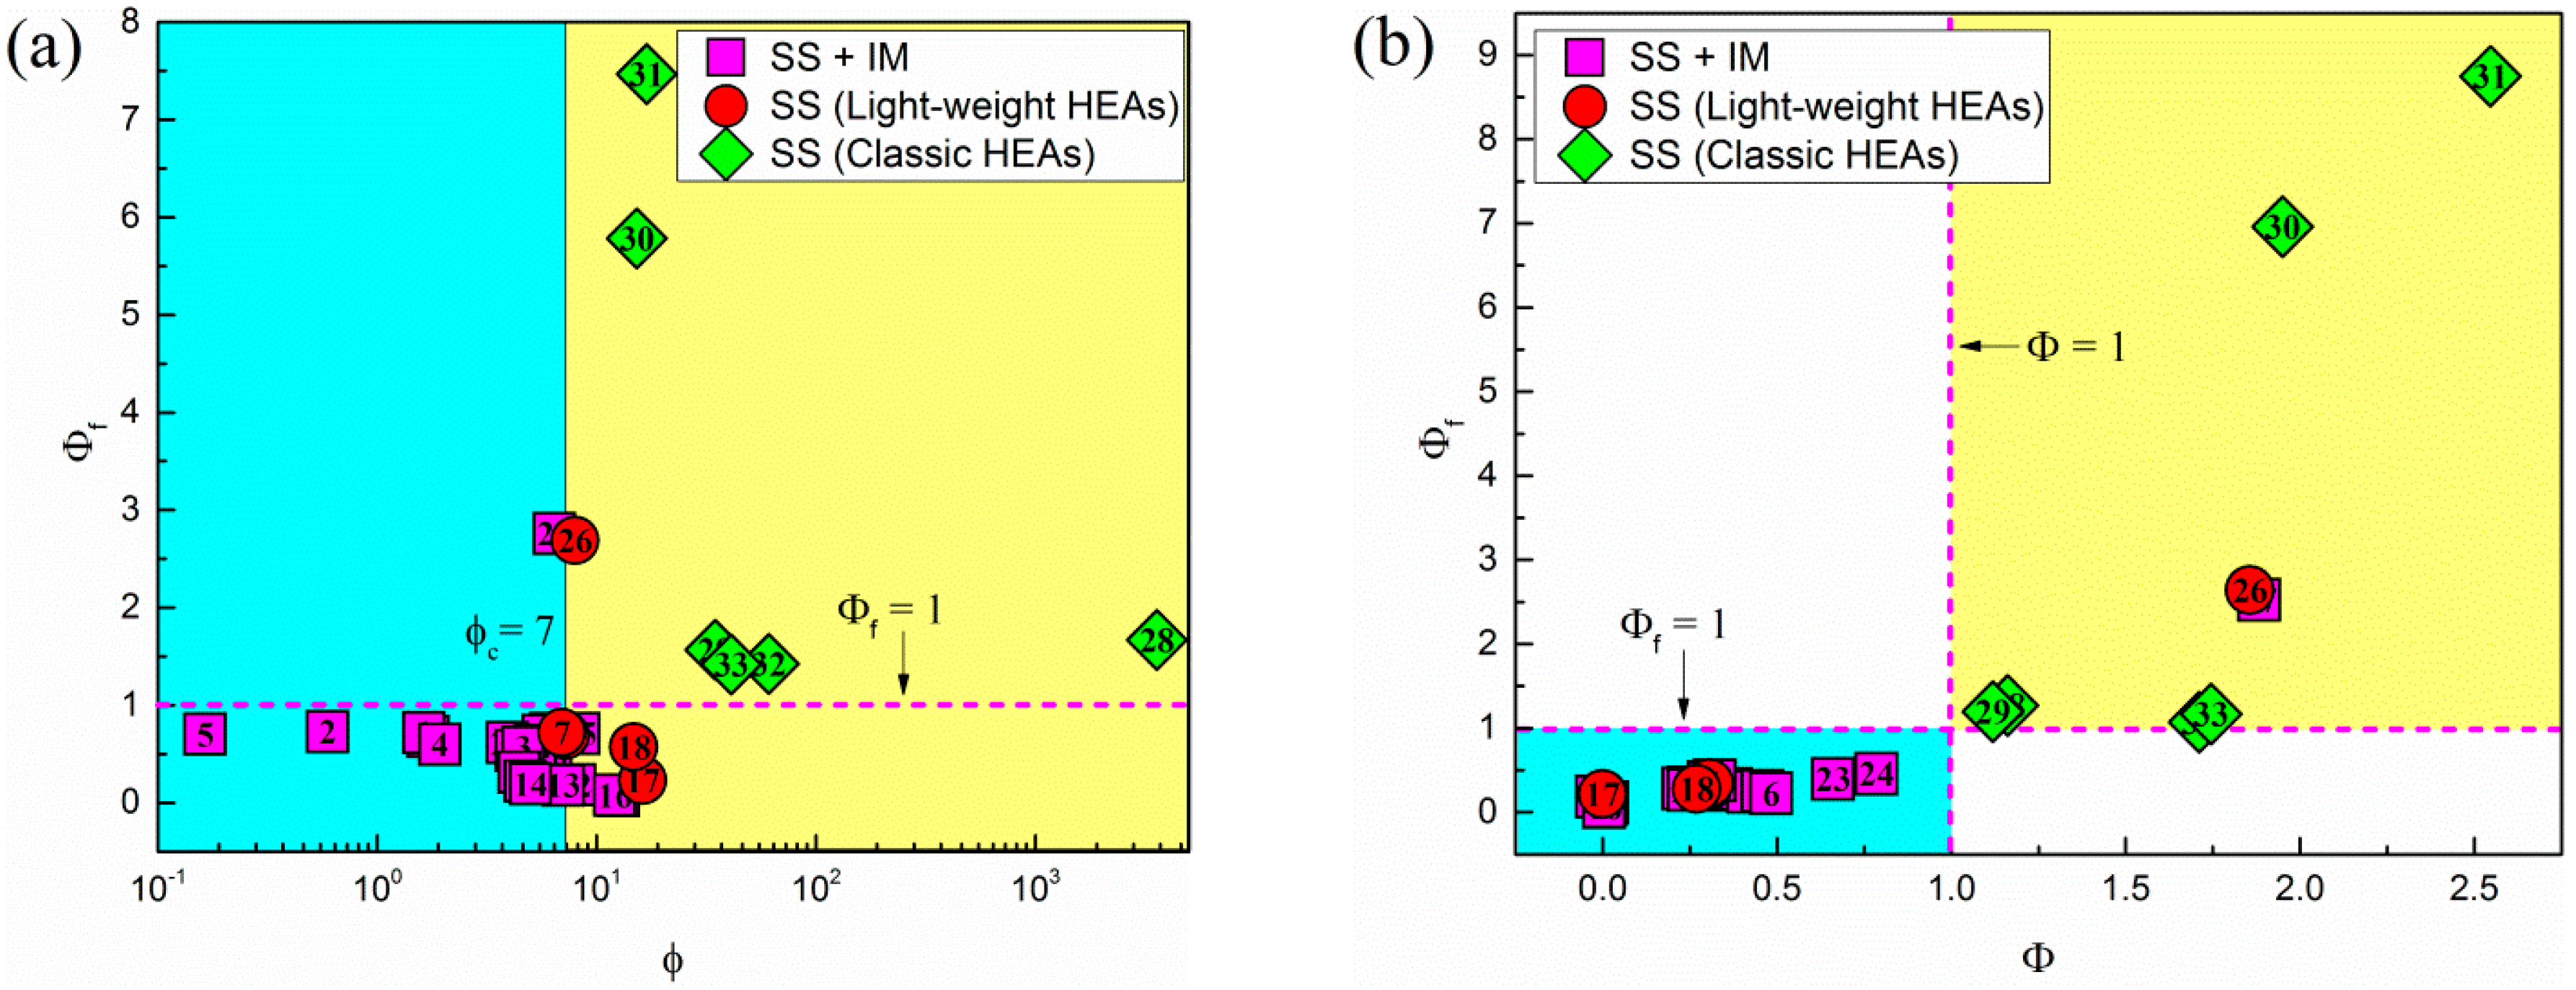
4.3. Criteria Based on , , and
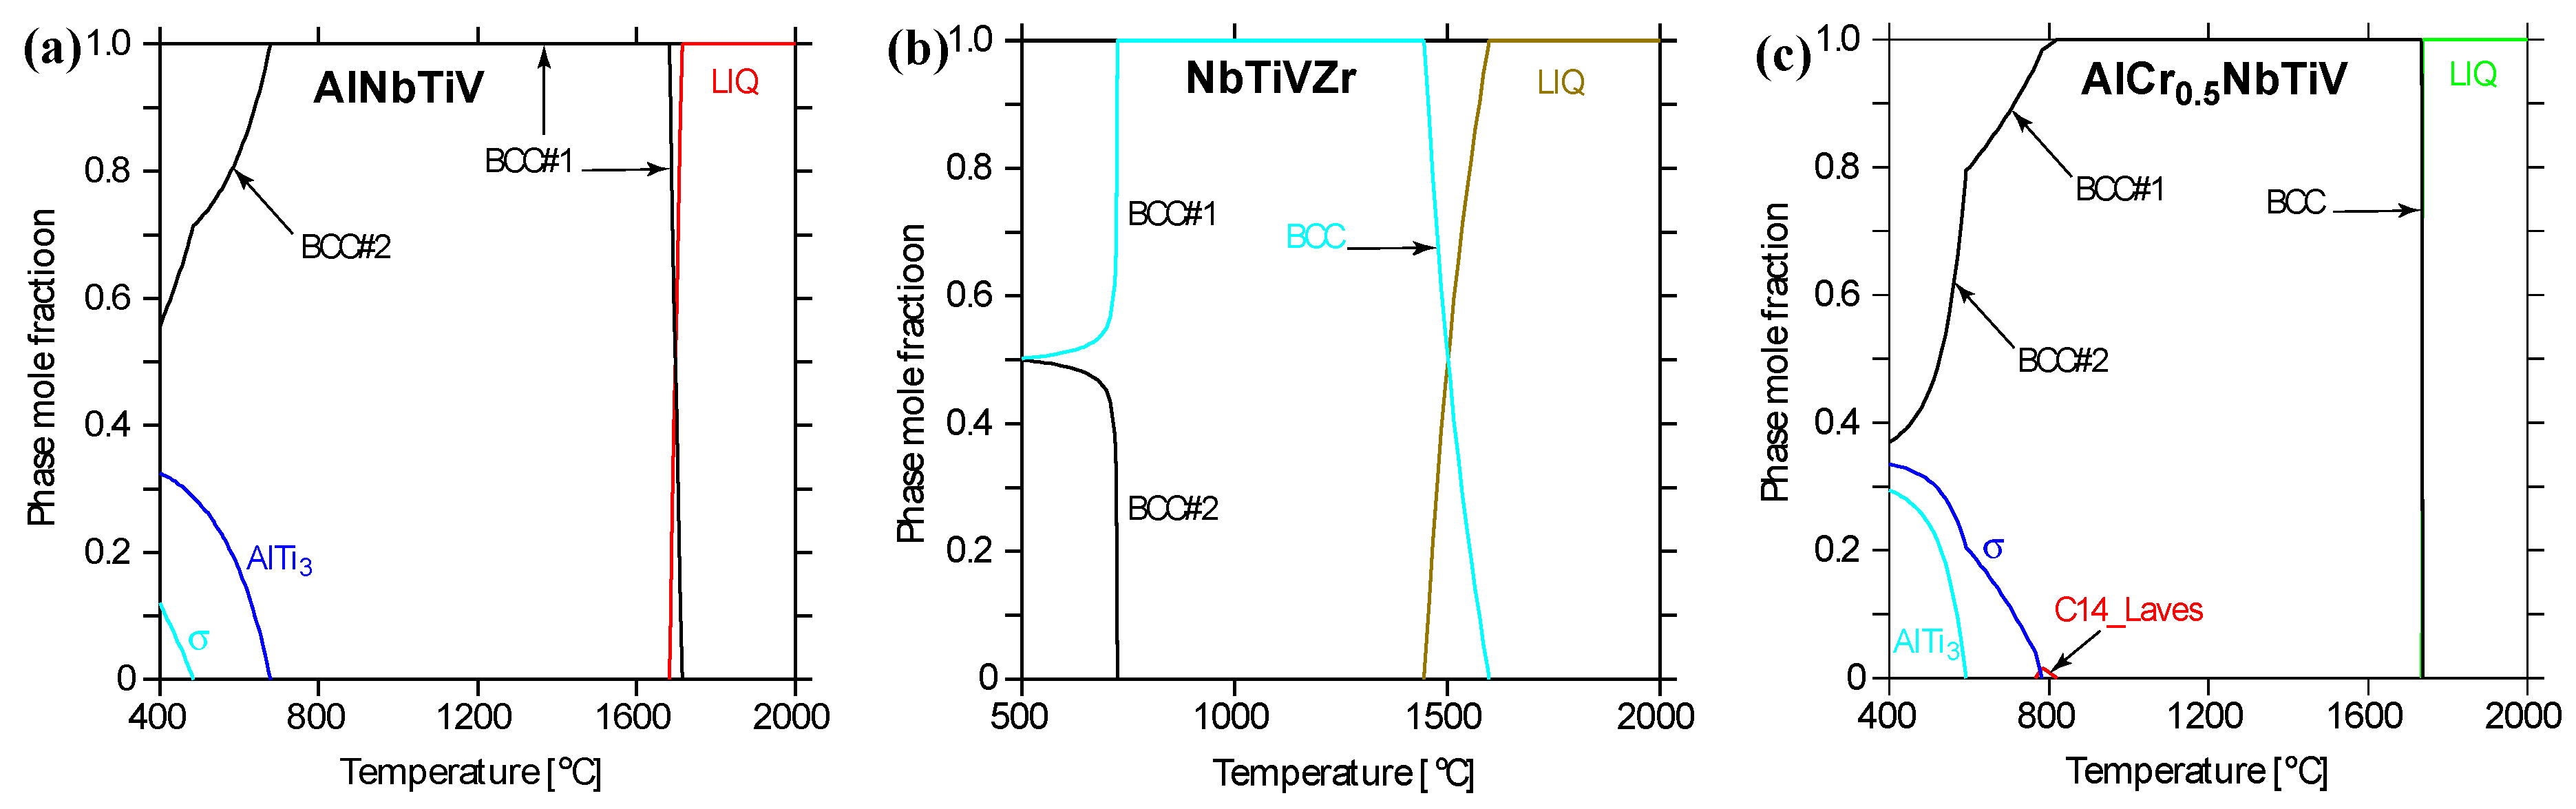
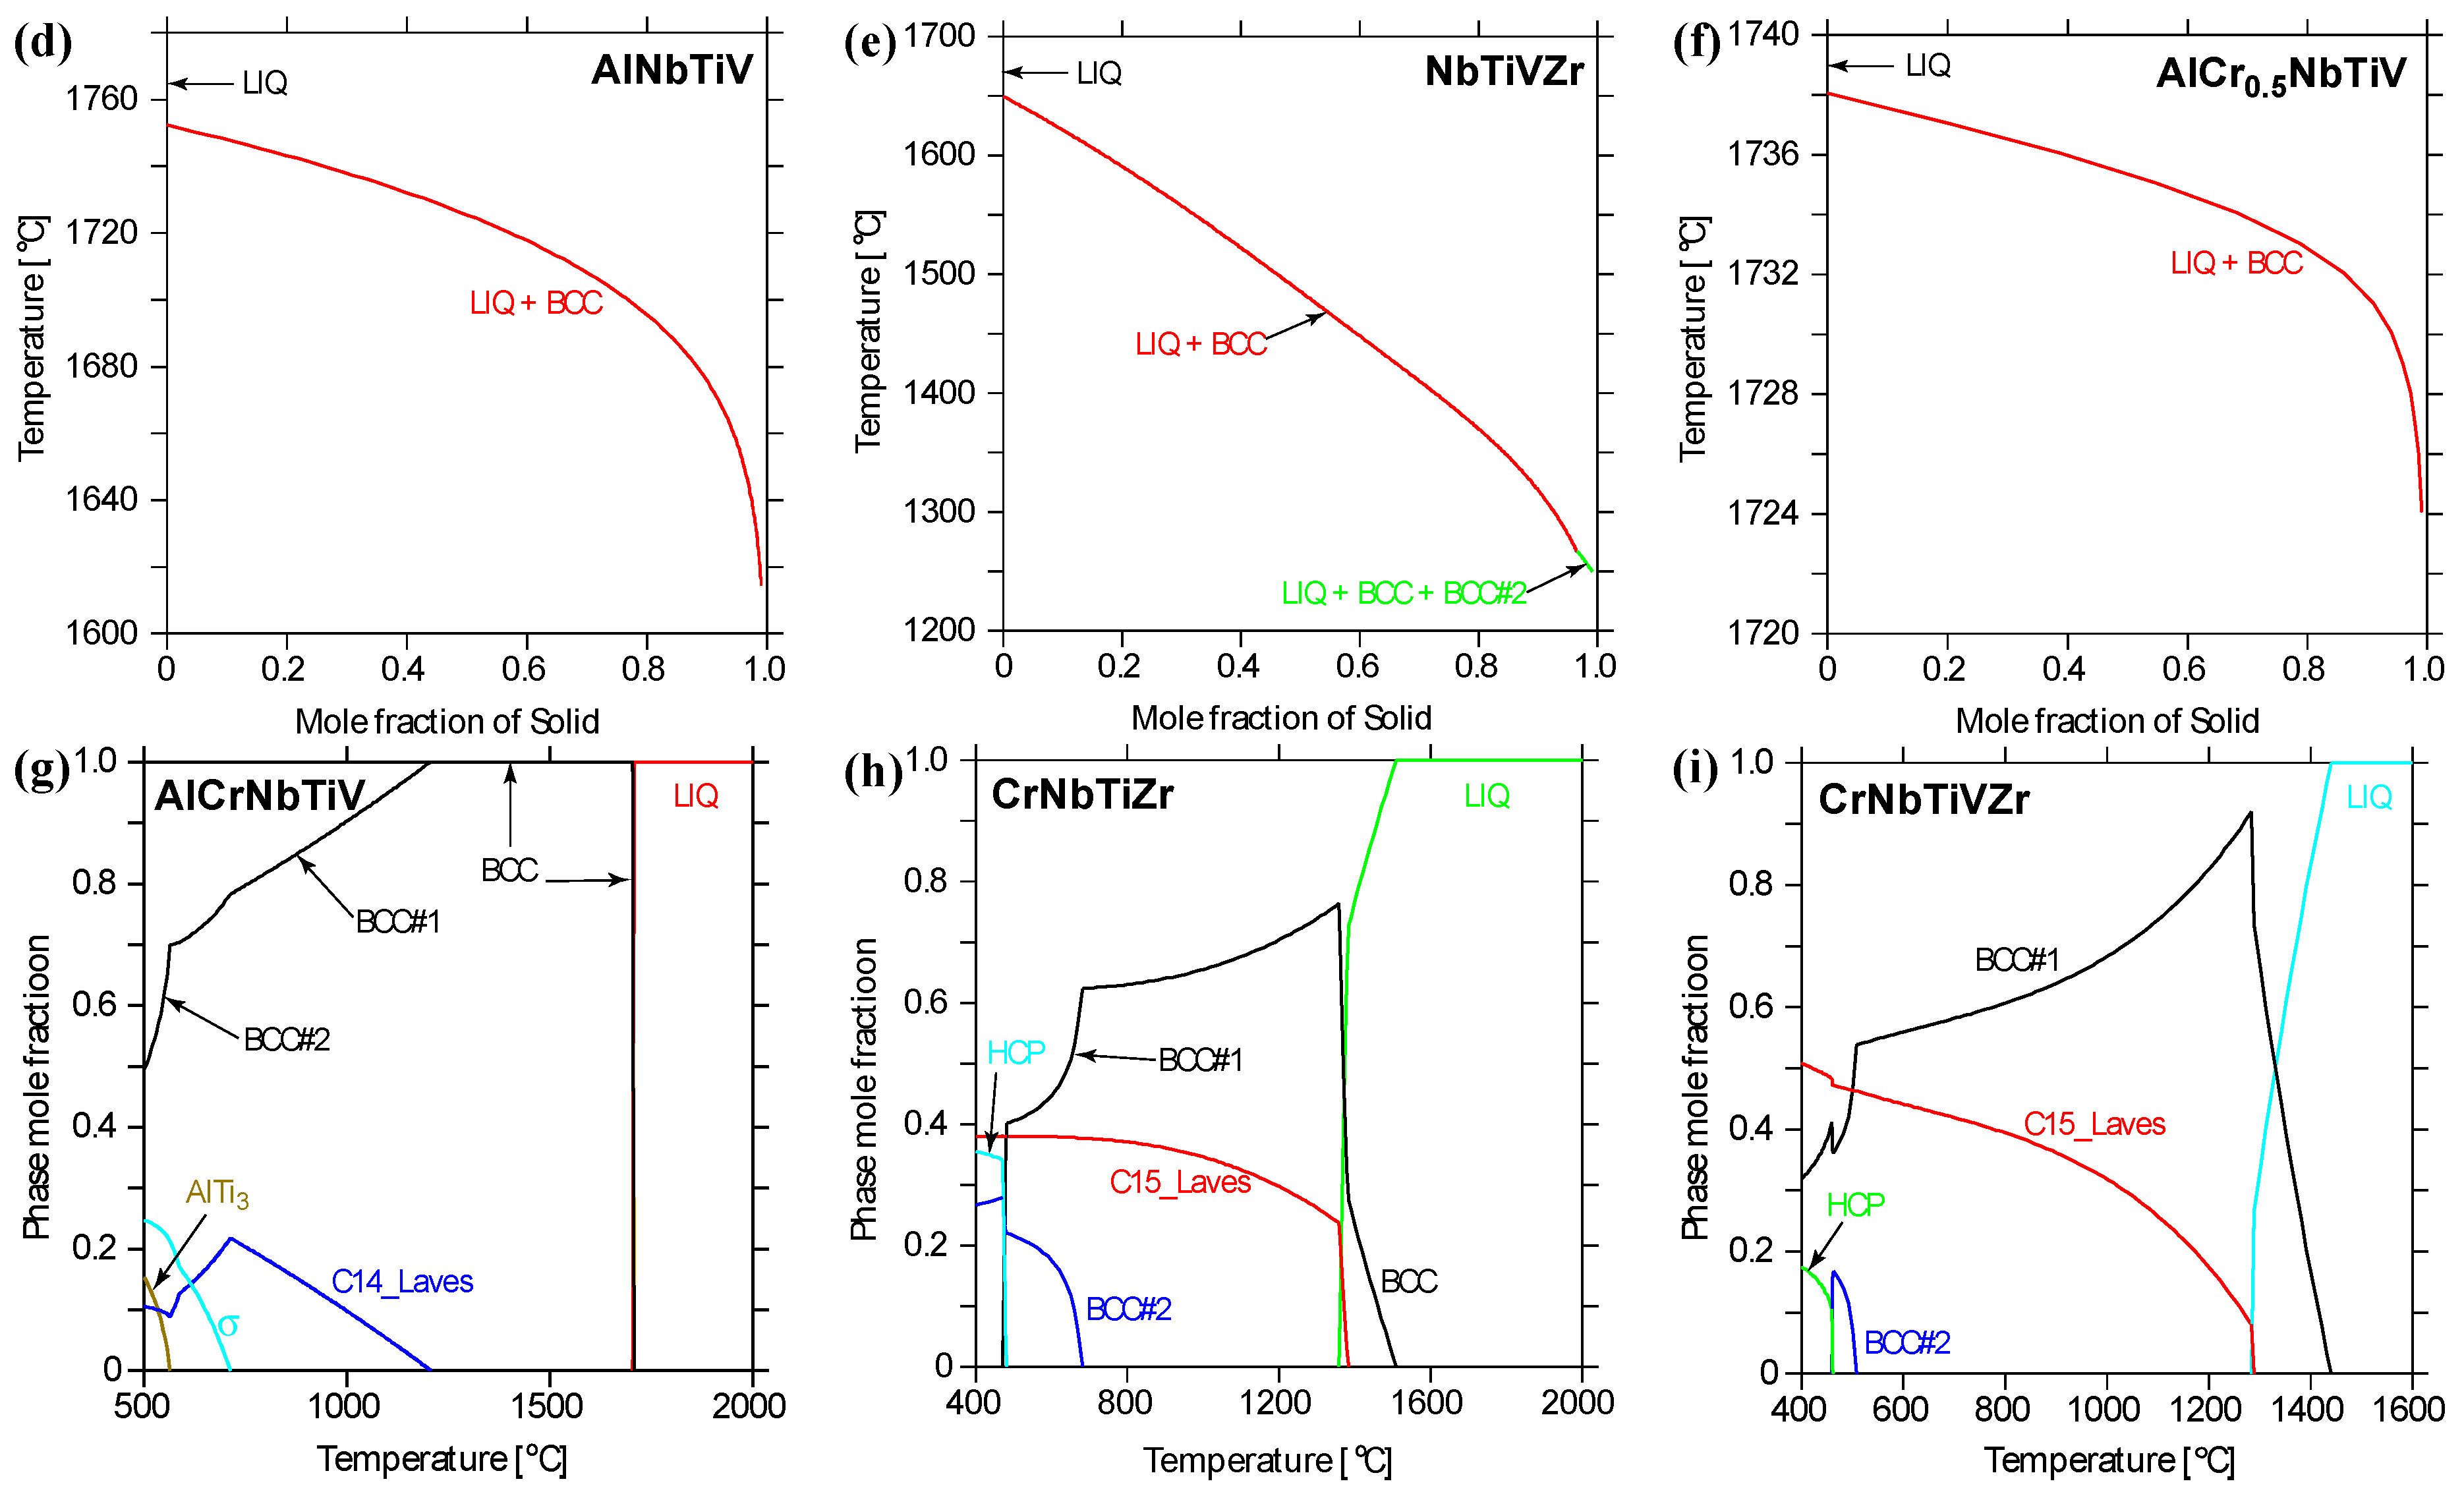
4.4. CALPHAD Modeling
5. Discussions
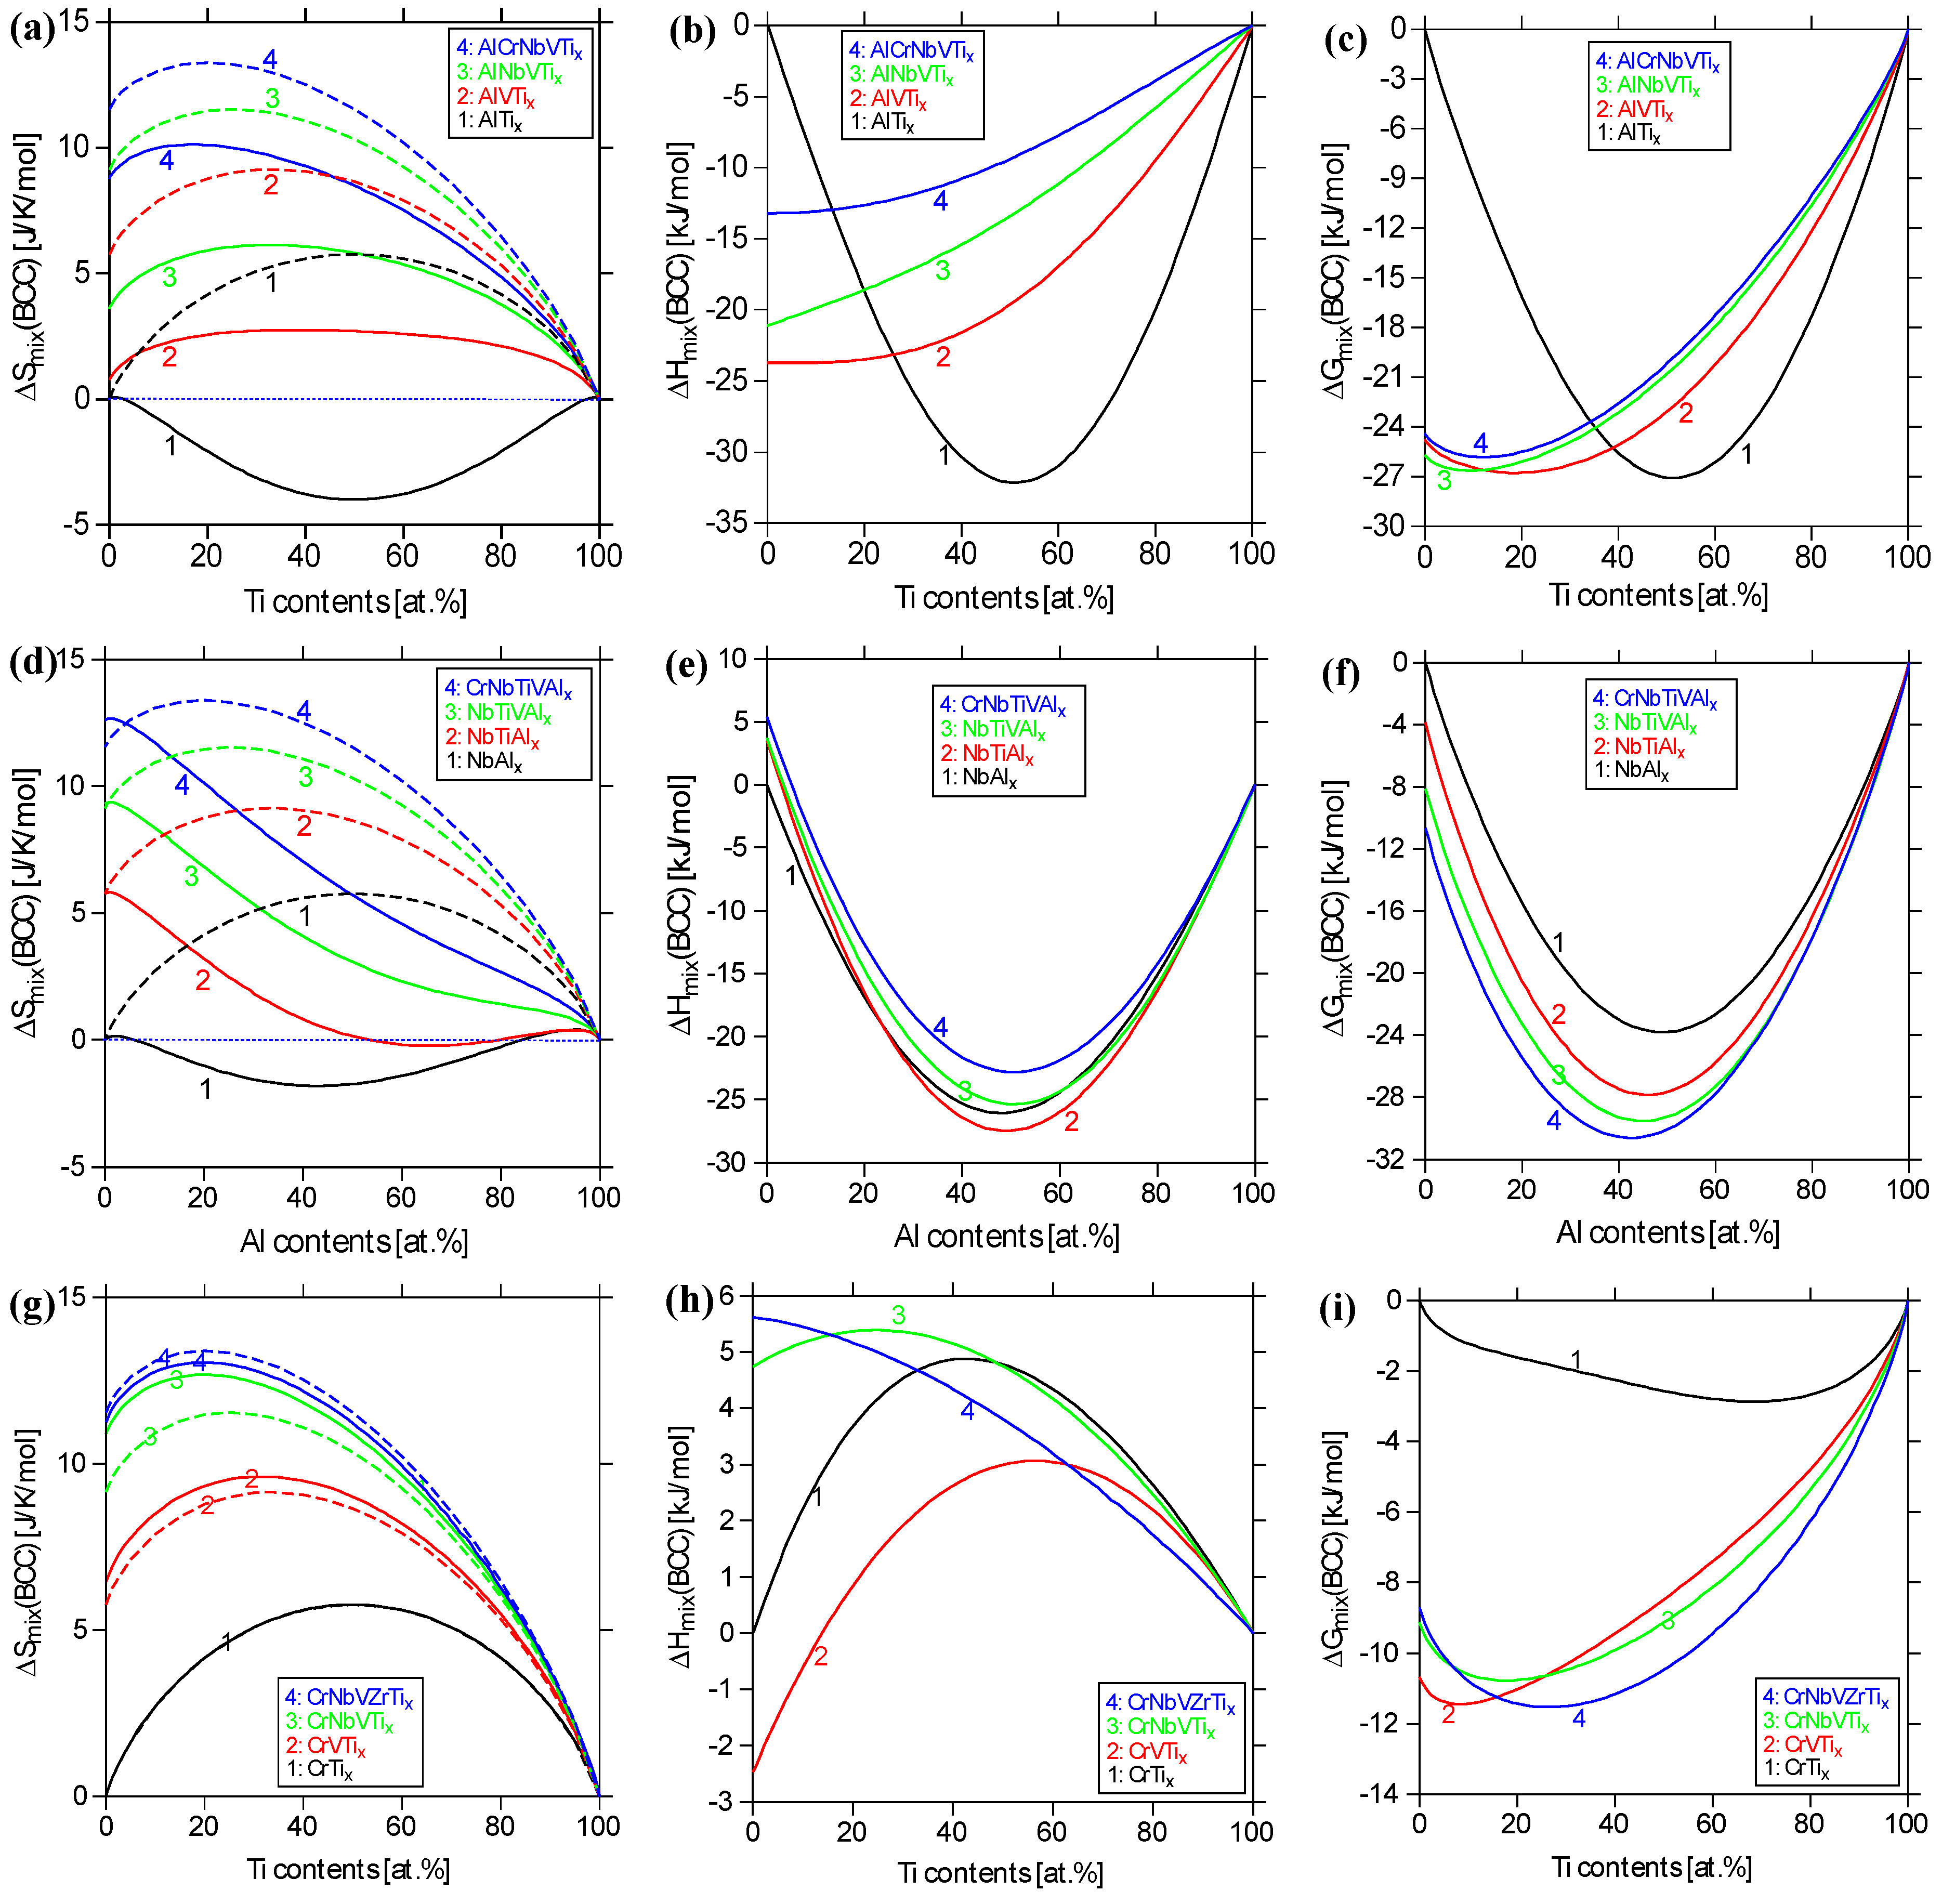
5.1. Thermodynamic Mixing Properties of Al-Cr-Nb-Ti-V and Cr-Nb-Ti-V-Zr Systems
5.2. Common Issues of Empirical Rules
5.3. Perspectives of Future Design of Light-Weight HEAs
- (1)
- Identify the main alloying elements in addition to the dominant principal element (such as Ti, Al, or Mg), based on the target-properties requirement.
- (2)
- Use the high-entropy concept to adjust the bulk composition so as to maximize the solubility of key strengthening (or ductilizing, anti-oxidation, etc.) alloying elements.
- (3)
- Predict phase stability using the CALPHAD method, DFT modeling, and/or empirical criteria, and design processing and heat-treatment routes to optimize the microstructure.
- (4)
- Fabricate the down-selected alloys and characterize their microstructures and mechanical (and other) properties.
- (5)
- Refine alloy design by repeating the above procedures.
6. Conclusions
- (1)
- Empirical rules are not conclusive in predicting solid-solution formation, and they are susceptible to the alloy systems and compositions that are assessed. As new experimental data emerge, these rules are subject to reevaluation. Consequently, the proposed threshold values pertaining to those empirical rules are sensitive to alloy systems and compositions, and can fluctuate within a range of values. For light-weight HEAs, the following criteria have been identified: , , and .
- (2)
- The combination of with appears to be more effective criteria than with or to differentiate SS from SS + IM.
- (3)
- For certain HEAs with strong interatomic interactions among constituent elements, such as Al-containing HEAs, empirical rules may severely underestimate the free energies of the solid-solution phases by ignoring the enthalpy contribution of the solid-solution phase.
- (4)
- The present CALPHAD modeling using the TCNI8 database successfully predicts the single BCC phase in AlNbTiV, Al0.5NbTiV, and NbTiVZr, while most empirical rules fail to do so.
- (5)
- The calculated entropies of mixing () for the BCC phase at 1000 °C are −4, −2, +2, +3, +6, and +10 J/(mol·K) for AlTi, AlNb, AlNbTi, AlTiV, AlNbTiV, and AlCrNbTiV, respectively; they are well below the corresponding ideal configurational entropy, especially for the binary and ternary alloys. Therefore, these systems exhibit noticeable negative excess entropy with the BCC structure.
- (6)
- The present CALPHAD modeling predicts that the enthalpies of mixing () for the BCC phase at 1000 °C are −32, −26, −24, −22, −18, and −12 kJ/mol for AlTi, AlNb, AlNbTi, AlTiV, AlNbTiV, and AlCrNbTiV, respectively.
- (7)
- Forming Al-containing equimolar light-weight HEAs with a density less than 5.5 g/cm3 is very challenging due to very attractive interatomic interactions between Al and TMs. As such, future efforts could be shifted towards Al-rich (or Ti-rich, or Mg-rich) alloys that contain large amounts of desirable solute elements, which may dissolve in solution and/or promote the formation of beneficial precipitates, taking advantage of the high-entropy concept.
Acknowledgments
Author Contributions
Conflicts of Interest
References
- Cantor, B.; Chang, I.; Knight, P.; Vincent, A. Microstructural development in equiatomic multicomponent alloys. Mater. Sci. Eng. A 2004, 375–377. [Google Scholar] [CrossRef]
- Yeh, J.W.; Chen, S.K.; Lin, S.J.; Gan, J.Y.; Chin, T.S.; Shun, T.T.; Tsau, C.H.; Chang, S.Y. Nanostructured high-entropy alloys with multiple principal elements: Novel alloy design concepts and outcomes. Adv. Eng. Mater. 2004, 6, 299–303. [Google Scholar] [CrossRef]
- Zhang, Y.; Zuo, T.T.; Tang, Z.; Gao, M.C.; Dahmen, K.A.; Liaw, P.K.; Lu, Z.P. Microstructures and properties of high-entropy alloys. Prog. Mater. Sci. 2014, 61. [Google Scholar] [CrossRef]
- Zhang, Y.; Zhou, Y.J.; Lin, J.P.; Chen, G.L.; Liaw, P.K. Solid-solution phase formation rules for multi-component alloys. Adv. Eng. Mater. 2008, 10, 534–538. [Google Scholar] [CrossRef]
- Santodonato, L.J.; Zhang, Y.; Feygenson, M.; Parish, C.M.; Gao, M.C.; Weber, R.J.; Neuefeind, J.C.; Tang, Z.; Liaw, P.K. Deviation from high-entropy configurations in the atomic distributions of a multi-principal-element alloy. Nat. Commun. 2015, 6, 5964. [Google Scholar] [CrossRef] [PubMed]
- Gao, M.C.; Yeh, J.W.; Liaw, P.K.; Zhang, Y. High-Entropy Alloys: Fundamentals and Applications; Springer: Cham, Switzerland, 2016. [Google Scholar]
- Youssef, K.M.; Zaddach, A.J.; Niu, C.; Irving, D.L.; Koch, C.C. A novel low-density, high-hardness, high-entropy alloy with close-packed single-phase nanocrystalline structures. Mater. Res. Lett. 2015, 3, 95–99. [Google Scholar] [CrossRef]
- Liu, S.; Gao, M.C.; Liaw, P.K.; Zhang, Y. Microstructures and mechanical properties of AlxCrFeNiTi0.25 alloys. J. Alloy. Compd. 2015, 619, 610–615. [Google Scholar] [CrossRef]
- Stepanov, N.; Shaysultanov, D.; Salishchev, G.; Tikhonovsky, M. Structure and mechanical properties of a light-weight AlNbTiV high entropy alloy. Mater. Lett. 2015, 142, 153–155. [Google Scholar] [CrossRef]
- Stepanov, N.; Yurchenko, N.Y.; Shaysultanov, D.; Salishchev, G.; Tikhonovsky, M. Effect of Al on structure and mechanical properties of AlxNbTiVZr (x = 0, 0.5, 1, 1.5) high entropy alloys. Mater. Sci. Technol. 2015, 31, 1184–1193. [Google Scholar] [CrossRef]
- Stepanov, N.; Yurchenko, N.Y.; Skibin, D.; Tikhonovsky, M.; Salishchev, G. Structure and mechanical properties of the AlCrxNbTiV (x = 0, 0.5, 1, 1.5) high entropy alloys. J. Alloy. Compd. 2015, 652, 266–280. [Google Scholar] [CrossRef]
- Senkov, O.N.; Senkova, S.V.; Miracle, D.B.; Woodward, C.F. Mechanical properties of low-density, refractory multi-principal element alloys of the Cr–Nb–Ti–V–Zr system. Mater. Sci. Eng. A 2013, 565, 51–62. [Google Scholar] [CrossRef]
- Senkov, O.N.; Senkova, S.V.; Woodward, C.F.; Miracle, D.B. Low-density, refractory multi-principal element alloys of the Cr–Nb–Ti–V–Zr system: Microstructure and phase analysis. Acta Mater. 2013, 61, 1545–1557. [Google Scholar] [CrossRef]
- Chen, H.; Kauffmann, A.; Gorr, B.; Schliephake, D.; Seemüller, C.; Wagner, J.; Christ, H.J.; Heilmaier, M. Microstructure and mechanical properties at elevated temperatures of a new Al-containing refractory high-entropy alloy Nb-Mo-Cr-Ti-Al. J. Alloy. Compd. 2016, 661, 206–215. [Google Scholar] [CrossRef]
- Senkov, O.N.; Woodward, C.F.; Miracle, D.B. Microstructure and properties of aluminum-containing refractory high-entropy alloys. JOM 2014, 66, 2030–2042. [Google Scholar] [CrossRef]
- Yang, X.; Zhang, Y. Prediction of high-entropy stabilized solid-solution in multi-component alloys. Mater. Chem. Phys. 2012, 132, 233–238. [Google Scholar] [CrossRef]
- Guo, S.; Ng, C.; Lu, J.; Liu, C.T. Effect of valence electron concentration on stability of fcc or bcc phase in high entropy alloys. J. Appl. Phys. 2011, 109, 103505. [Google Scholar] [CrossRef]
- Troparevsky, M.C.; Morris, J.R.; Kent, P.R.; Lupini, A.R.; Stocks, G.M. Criteria for predicting the formation of single-phase high-entropy alloys. Phys. Rev. X 2015, 5, 011041. [Google Scholar] [CrossRef]
- Ye, Y.F.; Wang, Q.; Lu, J.; Liu, C.T.; Yang, Y. Design of high entropy alloys: A single-parameter thermodynamic rule. Scr. Mater. 2015, 104, 53–55. [Google Scholar] [CrossRef]
- King, D.J.M.; Middleburgh, S.C.; McGregor, A.G.; Cortie, M.B. Predicting the formation and stability of single phase high-entropy alloys. Acta Mater. 2016, 104, 172–179. [Google Scholar] [CrossRef]
- Poletti, M.G.; Battezzati, L. Electronic and thermodynamic criteria for the occurrence of high entropy alloys in metallic systems. Acta Mater. 2014, 75, 297–306. [Google Scholar] [CrossRef]
- Gao, M.C.; Alman, D.E. Searching for next single-phase high-entropy alloy compositions. Entropy 2013, 15, 4504–4519. [Google Scholar] [CrossRef]
- Ye, Y.F.; Wang, Q.; Lu, J.; Liu, C.T.; Yang, Y. The generalized thermodynamic rule for phase selection in multicomponent alloys. Intermetallics 2015, 59, 75–80. [Google Scholar] [CrossRef]
- Wang, Z.J.; Qiu, W.F.; Yang, Y.; Liu, C.T. Atomic-size and lattice-distortion effects in newly developed high-entropy alloys with multiple principal elements. Intermetallics 2015, 64, 63–69. [Google Scholar] [CrossRef]
- Wang, Z.J.; Huang, Y.H.; Yang, Y.; Wang, J.; Liu, C.T. Atomic-size effect and solid solubility of multicomponent alloys. Scr. Mater. 2015, 94, 28–31. [Google Scholar] [CrossRef]
- Gao, M.C. Design of high-entropy alloys. In High-Entropy Alloys: Fundamentals and Applications; Gao, M.C., Yeh, J.W., Liaw, P.K., Zhang, Y., Eds.; Springer: Cham, Switzerland, 2016; pp. 369–398. [Google Scholar]
- Gao, M.C.; Carney, C.S.; Doğan, Ö.N.; Jablonksi, P.D.; Hawk, J.A.; Alman, D.E. Design of refractory high-entropy alloys. JOM 2015, 67, 2653–2669. [Google Scholar] [CrossRef]
- Gao, M.C.; Zhang, B.; Guo, S.M.; Qiao, J.W.; Hawk, J.A. High-entropy alloys in hexagonal close packed structure. Metall. Mater. Trans. A 2016, 47, 3322–3332. [Google Scholar] [CrossRef]
- Zhang, Y.; Lu, Z.P.; Ma, S.G.; Liaw, P.K.; Tang, Z.; Cheng, Y.Q.; Gao, M.C. Guidelines in predicting phase formation of high-entropy alloys. MRS Commun. 2014, 4, 57–62. [Google Scholar] [CrossRef]
- Hammond, V.H.; Atwater, M.A.; Darling, K.A.; Nguyen, H.Q.; Kecskes, L.J. Equal-channel angular extrusion of a low-density high-entropy alloy produced by high-energy cryogenic mechanical alloying. JOM 2014, 66, 2021–2029. [Google Scholar] [CrossRef]
- Yang, X.; Chen, S.Y.; Cotton, J.D.; Zhang, Y. Phase stability of low-density, multiprincipal component alloys containing aluminum, magnesium, and lithium. JOM 2014, 66, 2009–2020. [Google Scholar] [CrossRef]
- Li, R.; Gao, J.C.; Fan, K. Microstructure and mechanical properties of MgMnAlZnCu high entropy alloy cooling in three conditions. Mater. Sci. Forum 2011, 686, 235–241. [Google Scholar] [CrossRef]
- Senkov, O.N.; Miracle, D.B. A new thermodynamic parameter to predict formation of solid solution or intermetallic phases in high entropy alloys. J. Alloy. Compd. 2016, 658, 603–607. [Google Scholar] [CrossRef]
- Widom, M.; Huhn, W.P.; Maiti, S.; Steurer, W. Hybrid Monte Carlo/molecular dynamics simulation of a refractory metal high entropy alloy. Metall. Mater. Trans. A 2014, 45, 196–200. [Google Scholar] [CrossRef]
- Widom, M. Prediction of structure and phase transformations. In High-Entropy Alloys: Fundamentals and Applications; Gao, M.C., Yeh, J.W., Liaw, P.K., Zhang, Y., Eds.; Springer: Cham, Switzerland,, 2016; pp. 267–298. [Google Scholar]
- Gao, M.C.; Niu, C.; Jiang, C.; Irving, D.L. Applications of special quasi-random structures to high-entropy alloys. In High-Entropy Alloys: Fundamentals and Applications; Gao, M.C., Yeh, J.W., Liaw, P.K., Zhang, Y., Eds.; Springer: Cham, Switzerland, 2016; pp. 333–368. [Google Scholar]
- De Boer, F.R. Cohesiodn in Metals: Transition Metal Alloys; North-Holland: Amsterdam, NY, USA, 1988; p. 785. [Google Scholar]
- King, D.J.M.; McGregor, A.G. Alloy Search and Predict. Available online: www.alloyASAP.com (accessed on 6 September 2016).
- Senkov, O.N.; Wilks, G.B.; Miracle, D.B.; Chuang, C.; Liaw, P.K. Refractory high-entropy alloys. Intermetallics 2010, 18, 1758–1765. [Google Scholar] [CrossRef]
- Takeuchi, A.; Amiya, K.; Wada, T.; Yubuta, K.; Zhang, W. High-entropy alloys with a hexagonal close-packed structure designed by equi-atomic alloy strategy and binary phase diagrams. JOM 2014, 66, 1984–1992. [Google Scholar] [CrossRef]
- Zhao, Y.J.; Qiao, J.W.; Ma, S.G.; Gao, M.C.; Yang, H.J.; Chen, M.W.; Zhang, Y. A hexagonal close-packed high-rntropy alloy: The effect of entropy. Mater. Des. 2016, 96, 10–15. [Google Scholar]
- Feuerbacher, M.; Heidelmann, M.; Thomas, C. Hexagonal high-entropy alloys. Mater. Res. Lett. 2015, 3, 1–6. [Google Scholar] [CrossRef]
- Kao, Y.F.; Chen, T.J.; Chen, S.K.; Yeh, J.W. Microstructure and mechanical property of as-cast, -homogenized, and -deformed AlxCoCrFeNi (0 ≤ x ≤ 2) high-entropy alloys. J. Alloy. Compd. 2009, 488, 57–64. [Google Scholar] [CrossRef]
- Wu, Y.D.; Cai, Y.H.; Wang, T.; Si, J.J.; Zhu, J.; Wang, Y.D.; Hui, X.D. A refractory Hf25Nb25Ti25Zr25 high-entropy alloy with excellent structural stability and tensile properties. Mater. Lett. 2014, 130, 277–280. [Google Scholar] [CrossRef]
- Senkov, O.; Scott, J.; Senkova, S.; Meisenkothen, F.; Miracle, D.; Woodward, C. Microstructure and elevated temperature properties of a refractory TaNbHfZrTi alloy. J. Mater. Sci. 2012, 47, 4062–4074. [Google Scholar] [CrossRef]
- Sundman, B.; Jansson, B.; Andersson, J.O. The thermo-calc databank system. Calphad 1985, 9, 153–190. [Google Scholar] [CrossRef]
- Zhang, B.; Gao, M.C.; Zhang, Y.; Yang, S.; Guo, S.M. Senary refractory high-entropy alloy MoNbTaTiVW. Mater. Sci. Technol. 2015, 31, 1207–1213. [Google Scholar] [CrossRef]
- Zhang, B.; Gao, M.C.; Zhang, Y.; Guo, S.M. Senary refractory high-entropy alloy CrxMoNbTaVW. Calphad 2015, 51, 193–201. [Google Scholar] [CrossRef]
- Gao, M.C.; Zhang, B.; Yang, S.; Guo, S.M. Senary refractory high-entropy alloy HfNbTaTiVZr. Metall. Mater. Trans. A 2016, 47, 3333–3345. [Google Scholar] [CrossRef]
- Zhang, C.; Gao, M.C. CALPHAD modeling of high-entropy alloys. In High-Entropy Alloys: Fundamentals and Applications; Gao, M.C., Yeh, J.W., Liaw, P.K., Zhang, Y., Eds.; Springer: Cham, Switzerland, 2016; pp. 399–444. [Google Scholar]
- Yao, H.W.; Qiao, J.W.; Gao, M.C.; Hawk, J.A.; Ma, S.G.; Zhou, H.F.; Zhang, Y. NbTaV-(Ti, W) refractory high entropy alloys. Mater. Sci. Eng. A 2016. submitted for publication. [Google Scholar] [CrossRef]
- Zhang, C.; Zhang, F.; Chen, S.L.; Cao, W.S. Computational thermodynamics aided high-entropy alloy design. JOM 2012, 64, 839–845. [Google Scholar] [CrossRef]
- Zhang, F.; Zhang, C.; Chen, S.L.; Zhu, J.; Cao, W.S.; Kattner, U. An understanding of high entropy alloys from phase diagram calculations. Calphad 2014, 45. [Google Scholar] [CrossRef]
- Zhang, C.; Zhang, F.; Diao, H.; Gao, M.C.; Tang, Z.; Liaw, P.K. Understanding phase stability of Al-Co-Cr-Fe-Ni high entropy alloys. Mater. Des. 2016, 109, 425–433. [Google Scholar] [CrossRef]
- Gulliver, G.H. The quantitative effect of rapid cooling upon the constitution of binary alloys. J. Inst. Met. 1913, 9, 120–157. [Google Scholar]
- Scheil, E. Comments on the layer crystal formation. Z. Metallkd. 1942, 34, 70–72. [Google Scholar]
- Tian, F.; Wang, Y.; Irving, D.L.; Vitos, L. Applications of coherent potential approximation to HEAs. In High-Entropy Alloys: Fundamentals and Applications; Gao, M.C., Yeh, J.W., Liaw, P.K., Zhang, Y., Eds.; Springer: Cham, Switzerland, 2016; pp. 299–332. [Google Scholar]


| Alloy | Al | Cr | Fe | Mn | Ti | (g·cm−3) |
|---|---|---|---|---|---|---|
| Al1.5CrFeMnTi | 27.28 | 18.18 | 18.18 | 18.18 | 18.18 | 5.31 |
| Al2CrFeMnTi | 33.32 | 16.67 | 16.67 | 16.67 | 16.67 | 5.06 |
| AlCrFeMnTi0.25 | 23.53 | 23.53 | 23.53 | 23.53 | 5.88 | 5.87 |
| Al2CrFeMnTi0.25 | 38.10 | 19.05 | 19.05 | 19.05 | 4.75 | 5.16 |
| Al3CrFeMnTi0.25 | 48.00 | 16.00 | 16.00 | 16.00 | 4.00 | 4.71 |
| Al4CrFeMnTi0.25 | 55.17 | 13.79 | 13.79 | 13.79 | 3.46 | 4.40 |
| Number | Alloys | Density * (g·cm−3) | Structure | Reference | ||||||||
|---|---|---|---|---|---|---|---|---|---|---|---|---|
| 1 | Al1.5CrFeMnTi | 5.31 | BCC + L21 + Laves | 6.41 | −17.98 | 13.25 | 1336.31 | 1.19 | 1.63 | 0.31 | 0.28 | Current work |
| 2 | Al2CrFeMnTi | 5.06 | BCC + L21 + Laves | 6.33 | −19.00 | 12.98 | 1279.99 | 1.06 | 0.59 | 0.34 | 0.27 | Current work |
| 3 | AlCrFeMnTi0.25 | 5.87 | BCC + L21 | 5.78 | −12.07 | 12.71 | 1357.29 | 1.72 | 4.61 | 0.37 | 0.28 | Current work |
| 4 | Al2CrFeMnTi0.25 | 5.16 | BCC + L21 | 6.07 | −14.80 | 12.14 | 1224.56 | 1.23 | 1.93 | 0.42 | 0.24 | Current work |
| 5 | Al3CrFeMnTi0.25 | 4.71 | BCC + L21 + Laves | 6.02 | −16.04 | 11.53 | 1142.71 | 1.02 | 0.16 | 0.46 | 0.25 | Current work |
| 6 | Al4CrFeMnTi0.25 | 4.40 | BCC + L21 + Laves | 5.86 | −15.71 | 10.73 | 1077.10 | 0.92 | −0.92 | 0.48 | 0.22 | Current work |
| 7 | AlCr0.5NbTiV | 5.71 | BCC | 4.55 | −15.41 | 13.15 | 1704.22 | 1.69 | 6.94 | 0.31 | 0.35 | [11] |
| 8 | AlCrNbTiV | 5.82 | BCC + Laves | 5.19 | −14.56 | 13.38 | 1724.49 | 1.84 | 6.18 | 0.31 | 0.36 | [11] |
| 9 | AlCr1.5NbTiV | 5.90 | BCC + Laves | 5.55 | −13.75 | 13.25 | 1741.09 | 1.94 | 5.72 | 0.30 | 0.36 | [11] |
| 10 | AlFeMgTiZn | 4.34 | BCC + IM | 6.04 | −6.44 | 13.38 | 987.23 | 2.62 | 4.44 | 1.66 × 10⁻² | 0.18 | [30] |
| 11 | AlLiMgZnSn | 4.23 | FCC + IM | 5.33 | −6.08 | 13.38 | 428.58 | 1.54 | 4.72 | 8.39 × 10⁻³ | 0.10 | [31] |
| 12 | AlLi0.5MgZn0.5Sn0.2 | 3.22 | FCC+ IM | 5.66 | −3.89 | 12.31 | 517.83 | 2.50 | 7.93 | 8.73 × 10⁻³ | 0.11 | [31] |
| 13 | AlLi0.5MgZn0.5Cu0.2 | 3.73 | FCC + IM | 6.72 | −3.30 | 12.31 | 571.13 | 3.15 | 7.04 | 1.25 × 10⁻² | 0.11 | [31] |
| 14 | AlLi0.5MgCu0.5Sn0.2 | 3.69 | FCC + IM | 7.60 | −3.65 | 12.31 | 621.76 | 3.02 | 4.99 | 1.29 × 10⁻² | 0.12 | [31] |
| 15 | Al80Li5Mg5Zn5Sn5 | 3.05 | FCC + IM | 3.61 | −0.53 | 6.47 | 602.50 | 10.68 | 12.58 | 4.66 × 10⁻³ | 0.06 | [31] |
| 16 | Al80Li5Mg5Zn5Cu5 | 3.08 | FCC + IM | 4.10 | −0.61 | 6.47 | 645.13 | 9.73 | 12.07 | 4.92 × 10⁻³ | 0.07 | [31] |
| 17 | Al20Li20Mg10Sc20Ti30 | 2.67 | FCC | 5.30 | −0.40 | 12.95 | 1041.83 | 42.56 | 16.17 | 6.27 × 10⁻⁴ | 0.22 | [7] |
| 18 | AlNb1.5Ta0.5Ti1.5Zr0.5 | 6.88 | BCC | 3.07 | −15.12 | 12.51 | 1862.79 | 1.77 | 14.71 | 0.27 | 0.28 | [15] |
| 19 | AlNbTiV | 5.59 | BCC | 3.30 | −16.25 | 11.53 | 1678.87 | 1.38 | 7.22 | 0.30 | 0.30 | [9] |
| 20 | Al0.5NbTiVZr | 6.04 | BCC + Laves + Zr2Al | 6.67 | −10.86 | 13.15 | 1831.16 | 2.55 | 6.18 | 0.25 | 0.29 | [10] |
| 21 | AlNbTiVZr | 5.79 | BCC + Laves + Zr2Al | 5.53 | −17.44 | 13.38 | 1714.09 | 1.52 | 3.91 | 0.23 | 0.28 | [10] |
| 22 | Al1.5NbTiVZr | 5.55 | BCC + Laves + Zr2Al | 5.32 | −21.55 | 13.25 | 1618.31 | 1.16 | 1.71 | 0.25 | 0.27 | [10] |
| 23 | CrNbTiZr | 6.67 | BCC + Laves | 7.84 | −5.00 | 11.53 | 1976.75 | 5.19 | 4.31 | 0.66 | 0.40 | [13] |
| 24 | CrNbTiVZr | 6.57 | BCC + Laves | 7.67 | −4.64 | 13.38 | 1963.40 | 6.45 | 5.24 | 0.79 | 0.46 | [13] |
| 25 | NbMoCrTiAl | 6.57 | BCC + IM | 4.87 | −13.60 | 13.38 | 1867.09 | 2.11 | 8.32 | 0.32 | 0.38 | [14] |
| 26 | NbTiVZr | 6.52 | BCC | 6.03 | −0.25 | 11.53 | 1977.50 | 103.76 | 7.97 | 1.86 | 2.64 | [13] |
| 27 | NbTiV2Zr | 6.34 | 3 BCCs | 6.41 | −1.28 | 11.08 | 1964.00 | 19.36 | 6.43 | 1.88 | 2.52 | [13] |
| 28 | CoCrFeNi ** | 8.19 | FCC | 1.03 | −3.75 | 11.53 | 1598.75 | 5.75 | 3583.31 | 1.16 | 1.27 | [43] |
| 29 | CoCrFeMnNi ** | 8.04 | FCC | 0.92 | −4.16 | 13.38 | 1528.20 | 5.79 | 34.68 | 1.12 | 1.19 | [1] |
| 30 | HfNbTiZr ** | 8.38 | BCC | 4.12 | 2.50 | 11.53 | 2058.25 | 10.75 | 15.26 | 1.95 | 6.96 | [44] |
| 31 | HfNbTaTiZr ** | 9.94 | BCC | 4.01 | 2.72 | 13.38 | 2250.00 | 12.41 | 16.90 | 2.55 | 8.75 | [45] |
| 32 | MoNbTaW ** | 13.80 | BCC | 2.27 | −6.50 | 11.53 | 2884.75 | 5.60 | 60.98 | 1.71 | 1.08 | [39] |
| 33 | MoNbTaVW ** | 13.63 | BCC | 3.21 | −4.64 | 13.38 | 2689.80 | 8.54 | 41.17 | 1.75 | 1.17 | [39] |
| Alloys | Structure | vs. | vs. | |||
|---|---|---|---|---|---|---|
| Al1.5CrFeMnTi | BCC + L21 + Laves | √ | × | √ | √ | √ |
| Al2CrFeMnTi | BCC + L21 + Laves | √ | √ | √ | √ | √ |
| AlCrFeMnTi0.25 | BCC + L21 | √ | × | √ | √ | √ |
| Al2CrFeMnTi0.25 | BCC + L21 | √ | × | √ | √ | √ |
| Al3CrFeMnTi0.25 | BCC + L21 + Laves | √ | √ | √ | √ | √ |
| Al4CrFeMnTi0.25 | BCC + L21 + Laves | √ | √ | √ | √ | √ |
| AlCr0.5NbTiV | BCC | × | √ | √ | × | × |
| AlCrNbTiV | BCC + Laves | √ | × | √ | √ | √ |
| AlCr1.5NbTiV | BCC + Laves | √ | × | √ | √ | √ |
| AlFeMgTiZn | BCC + IM | √ | × | √ | √ | √ |
| AlLiMgZnSn | FCC + IM | √ | × | √ | √ | √ |
| AlLi0.5MgZn0.5Sn0.2 | FCC + IM | √ | × | × | √ | √ |
| AlLi0.5MgZn0.5Cu0.2 | FCC + IM | √ | √ | × | √ | √ |
| AlLi0.5MgCu0.5Sn0.2 | FCC + IM | √ | √ | √ | √ | √ |
| Al80Li5Mg5Zn5Sn5 | FCC + IM | × | × | × | √ | √ |
| Al80Li5Mg5Zn5Cu5 | FCC + IM | × | × | × | √ | √ |
| Al20Li20Mg10Sc20Ti30 | FCC | × | √ | √ | × | × |
| AlNb0.5Ta0.5Ti1.5Zr0.5 | BCC | × | √ | √ | × | × |
| AlNbTiV | BCC | × | √ | √ | × | × |
| Al0.5NbTiVZr | BCC + Laves + Zr2Al | √ | √ | √ | √ | √ |
| AlNbTiVZr | BCC + Laves + Zr2Al | √ | × | √ | √ | √ |
| Al1.5NbTiVZr | BCC + Laves + Zr2Al | √ | × | √ | √ | √ |
| CrNbTiZr | BCC + Laves | √ | √ | √ | √ | √ |
| CrNbTiVZr | BCC + Laves | √ | √ | √ | √ | √ |
| NbMoCrTiAl | BCC + IM | × | × | × | √ | √ |
| NbTiVZr | BCC | × | √ | √ | √ | √ |
| NbTiV2Zr | 3 BCCs | √ | × | √ | × | × |
© 2016 by the authors; licensee MDPI, Basel, Switzerland. This article is an open access article distributed under the terms and conditions of the Creative Commons Attribution (CC-BY) license (http://creativecommons.org/licenses/by/4.0/).
Share and Cite
Feng, R.; Gao, M.C.; Lee, C.; Mathes, M.; Zuo, T.; Chen, S.; Hawk, J.A.; Zhang, Y.; Liaw, P.K. Design of Light-Weight High-Entropy Alloys. Entropy 2016, 18, 333. https://doi.org/10.3390/e18090333
Feng R, Gao MC, Lee C, Mathes M, Zuo T, Chen S, Hawk JA, Zhang Y, Liaw PK. Design of Light-Weight High-Entropy Alloys. Entropy. 2016; 18(9):333. https://doi.org/10.3390/e18090333
Chicago/Turabian StyleFeng, Rui, Michael C. Gao, Chanho Lee, Michael Mathes, Tingting Zuo, Shuying Chen, Jeffrey A. Hawk, Yong Zhang, and Peter K. Liaw. 2016. "Design of Light-Weight High-Entropy Alloys" Entropy 18, no. 9: 333. https://doi.org/10.3390/e18090333
APA StyleFeng, R., Gao, M. C., Lee, C., Mathes, M., Zuo, T., Chen, S., Hawk, J. A., Zhang, Y., & Liaw, P. K. (2016). Design of Light-Weight High-Entropy Alloys. Entropy, 18(9), 333. https://doi.org/10.3390/e18090333