
Ion Hopping and Constrained Li Diffusion Pathways in the Superionic State of Antifluorite Li2O

Department of Nuclear Engineering, North Carolina State University, Raleigh, NC 27695, USA
*
Author to whom correspondence should be addressed.
Entropy 2017, 19(5), 227; https://doi.org/10.3390/e19050227
Submission received: 21 March 2017
/
Revised: 25 April 2017
/
Accepted: 15 May 2017
/
Published: 18 May 2017
(This article belongs to the Special Issue Understanding Molecular Dynamics via Stochastic Processes)
Abstract
:Li2O belongs to the family of antifluorites that show superionic behavior at high temperatures. While some of the superionic characteristics of Li2O are well-known, the mechanistic details of ionic conduction processes are somewhat nebulous. In this work, we first establish an onset of superionic conduction that is emblematic of a gradual disordering process among the Li ions at a characteristic temperature Tα (~1000 K) using reported neutron diffraction data and atomistic simulations. In the superionic state, the Li ions are observed to portray dynamic disorder by hopping between the tetrahedral lattice sites. We then show that string-like ionic diffusion pathways are established among the Li ions in the superionic state. The diffusivity of these dynamical string-like structures, which have a finite lifetime, shows a remarkable correlation to the bulk diffusivity of the system.
Keywords:
Li2O; atomistic simulations; antifluorites; superionics; string-like; ionic conduction; diffusion1. Introduction
Lithium oxide (Li2O) has long been of interest because of its potential application as a tritium-breeding material in fusion reactors [1]. Li2O is also a superionic (or fast-ion) conductor, attaining liquid-like ionic conductivities within the solid state [2]. It is one of the simplest Li-based superionic conductors having just two species [3,4,5,6,7]. The structural and dynamic characteristics of Li2O thus have implications for important technologies ranging from future fusion reactors to solid state batteries [8]. The focus of this paper is to study the collective dynamics of Li ions in the highly conducting superionic state of Li2O using atomistic simulations and statistical mechanics.
Li2O has an antifluorite structure (space group: Fm3m) with oxygen ions positioned on a face-centered cubic (FCC) lattice and the lithium ions occupying all the eight tetrahedral sites of the FCC lattice [9,10]. The crystal structure can be viewed alternatively as cations (Li) arranged on a simple cubic lattice, with anions occupying alternate cube centers. Both depictions are illustrated in Figure 1, with cations and anions represented by smaller and larger spheres, respectively. The empty cube centers are the octahedral sites of the FCC lattice and are possible locations for interstitials. The lithium ions diffuse at temperatures lower than the melting point of the material; this leads to the superionic character of Li2O with the lithium ions contributing to the bulk of the ionic conductivity, while the less mobile oxygen ions play the important role of maintaining the crystalline structure. A transposition of cations to the FCC lattice and anions to the tetragonal sites gives rise to a popular variant—the fluorite structure. In Figure 1, the anion and cation positions in antifluorites can simply be interchanged to obtain this structure. Fluorite materials such as PbF2, SrCl2, and CaF2 are also superionic conductors with anions making a dominant contribution to the ionic conductivity [9,11,12].
Superionic conductors can be categorized into two types depending on the nature of their transition to the conducting state: Type I materials typically show an abrupt transition, at a particular temperature, to the conducting state through a solid-solid phase transition, while Type II superionics portray a more gradual transition over a wide range of temperatures [9]. The superionic state of Type II materials is also characterized by a quasi-second-order thermodynamic transition at a characteristic temperature Tλ, below the melting point, where the specific heat (cp) shows an anomalous peak [15]. Several fluorites that fall in the Type II category portray this anomalous behavior [16]. Other thermodynamic and mechanical properties also exhibit a change in behavior near Tλ: for example, a significant decrease in the value of elastic constant C11 is observed near Tλ for fluorites [17,18]. Although Li2O is known to be a Type II conductor with a gradual increase in the ionic conductivity [2], the divergent-like behavior of cp has not yet been observed experimentally. Instead, Tλ for Li2O has been estimated approximately from neutron diffraction [10], diffusivity measurements [19], and variations in properties such as lattice parameter [10] or elastic constants [20]. While these measurements do not agree on the numerical value, it is commonly accepted that λ transition takes place in the vicinity of 1200 K [10,19].
Recently, we have shown that many fluorites exhibit an onset of disorder or an onset of superionicity at a characteristic temperature (denoted as Tα) that can be obtained from neutron diffraction, ionic conductivity, and specific heat data [16], which is distinct from Tλ. Atomistic simulations have further helped in elucidating the structural and dynamical changes observed across Tα [13,21,22,23], as well as across the λ transition. We thus regard a Type II ionic conductor to be in the superionic state at temperatures above Tα. In this work, we first apply our theoretical and experimental data analysis methodologies to the antifluorite Li2O to show that the onset of superionic conduction occurs at Tα ≈ 1000 K. We then show that Li ions form string-like dynamical structures with a finite lifetime, and the string diffusivity, which is based on peak participation of Li ions in strings, depicts a remarkable correlation to the bulk diffusivity of the system.
2. Simulation Methods
Atomistic simulations are widely used today to predict the properties of materials. They are also immensely useful to uncover atomistic mechanisms, which are difficult to establish solely with experimental techniques. In this work, we use classical atomistic simulations to investigate the spatiotemporal dynamics of Li ions in the superionic state of Li2O. We select a rigid-ion, two-body Buckingham-type potential developed by Asahi et al. [24] from first principles electronic structure simulations. The potential takes the following form:
The indices α and β label the ionic species, r denotes the distance between the ions, and z is the effective charge. The first term in Equation (1) represents the Coulombic interaction between the charged ions, while the second and third terms represent the repulsive interaction due to the overlap of the electron clouds and the attractive van der Waals or dispersion interaction, respectively.
In the parametrization used by Asahi et al. [24], the dispersion forces are excluded for all ion-pairs, while the short-range repulsive interaction is attributed to Li-O pair only. It is interesting to note that the training set for developing the potential is mainly driven by the melting point for Li2O (Tm = 1711 K). While other potentials have been developed in the past [20,25,26,27,28,29] for studying the superionic behavior of Li2O, the potential developed more recently by Asahi et al. [24] reproduces the experimentally measured density of Li2O in the entire solid phase and more importantly forecasts the λ transition, based on thermal expansivity, to occur at ~1200 K [24], which is close to what is deduced from neutron diffraction experiments. Remarkably, the Asahi et al. potential also predicts the onset of disorder at a lower temperature (Tα in our terminology), which is nearly identical to the temperature at which a change of slope is detected in the ionic conductivity [2]. Thus with a minimal training set and parameters (see Table A1 in Appendix A), the potential developed by Asahi et al. [24] predicts the transitions that are most critical to explaining the atomistic mechanisms that underpin the superionic state of Li2O. A comparison of different transition temperatures in Li2O is shown in Table 1.
An 8 × 8 × 8 antifluorite system containing 6144 ions is used for performing the atomistic simulations. The Newton equations of motion are integrated using Velocity-Verlet algorithm under periodic boundary conditions. A time step of 1 fs is observed to maintain long-time energy conservation. The system is first equilibrated in a NPT ensemble (constant number of ions, pressure and temperature) under zero pressure. The dynamical quantities of interest are then evaluated in the energy conserving micro-canonical ensemble. The Coulomb interactions are evaluated using the Wolf-summation method [30], which we have benchmarked to the standard Ewald method (see Appendix B). In the Wolf method, both the Coulomb energies and forces are evaluated by applying a spherical truncation at a finite cut-off radius with charge compensation on the surface of the truncation sphere [30]. It is computationally more efficient than the widely used Ewald or fast-multipole methods, with comparable accuracy for bulk and nanostructures. A cut-off radius of 10 Å is applied in the evaluation of both the short-range and electrostatic interactions. All the simulations are performed using the atomistic code—qBox that has been developed in-house.
3. Results
3.1. Onset of Disorder from Reported Experimental Data
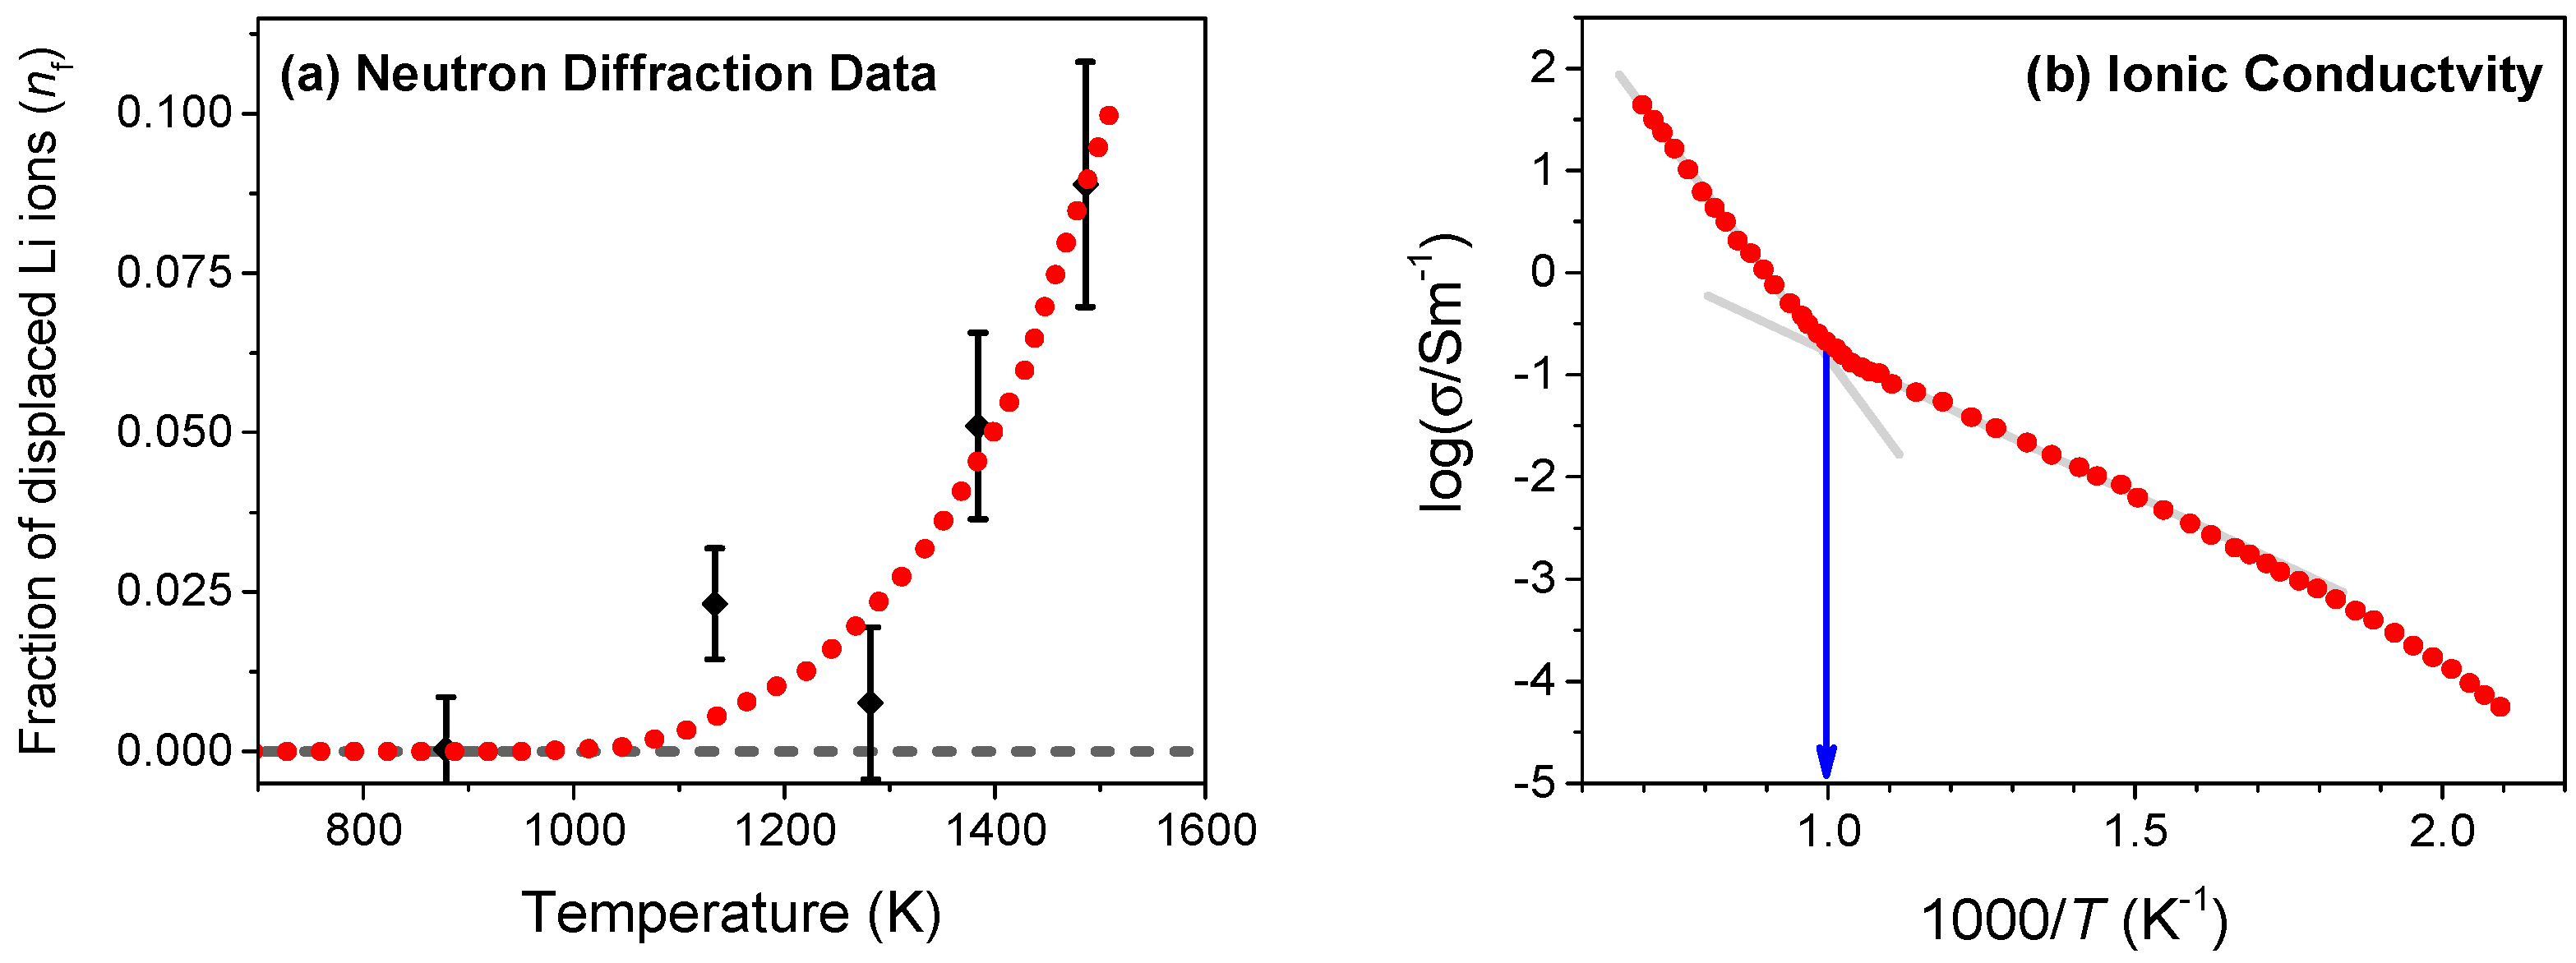
We begin by estimating the crossover temperature (Tα) in Li2O that corresponds to the onset of disorder from experimental data. For this purpose, we utilize the reported data on neutron diffraction [10] and ionic conductivity of Li ions using the nuclear magnetic resonance (NMR) method [2]. The neutron diffraction measurements give quantitative information on disorder by measuring the fraction of Li ions that are displaced from their native lattice sites at different temperatures, as shown in Figure 2a. Using the best fit to the diffraction data (shown by the dotted line), the onset of disorder can be estimated to occur at Tα ≈ 1000 K. In our earlier study, we had established that fluorite conductors such as PbF2, SrCl2, and CaF2 show a rapid rise in the ionic conductivity at Tα though with a higher activation energy [16,21]. As shown in Figure 2b, the ionic conductivity of Li2O broadly falls into two Arrhenius segments with a noticeable change in slope at Tα ≈ 1000 K. Both neutron scattering and ionic conductivity measurements, therefore, establish that the onset of Li disorder takes place at the characteristic temperature Tα ≈ 1000 K.
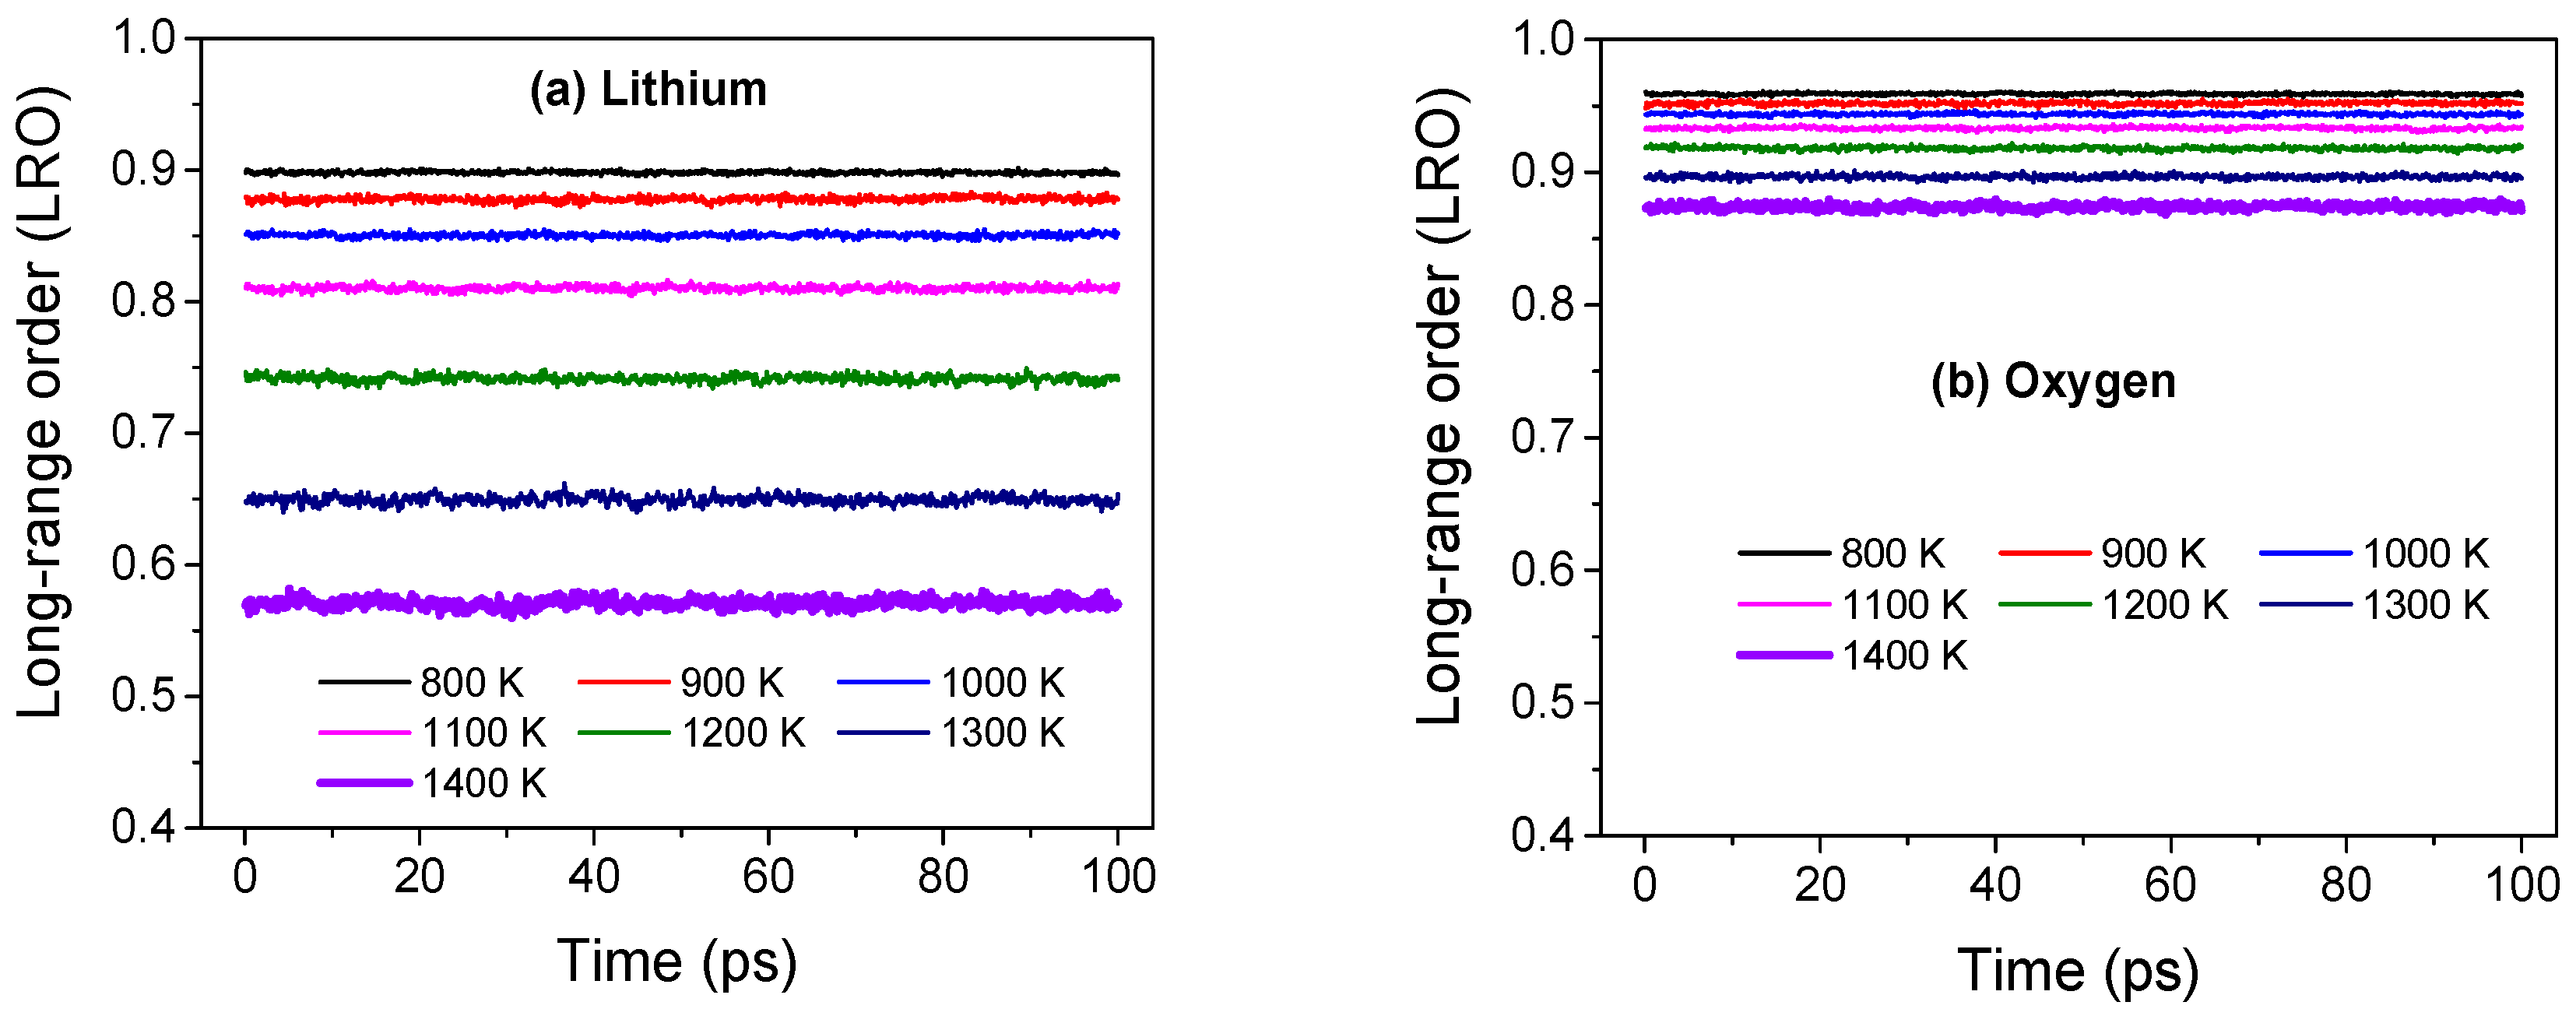
We will now use atomistic simulations to determine the structural disorder among the Li cations in Li2O. Similar to our earlier investigation on UO2, we calculate the long-range order (LRO) parameter [13,31] for the Li sub-lattice. The LRO, measured through the Fourier transform of the local density given by where q is the wave vector, is a simple metric to assess quasi-static disorder at different scales. For crystalline solids, the magnitude of LRO remains steady with time and approaches unity with decreasing temperature while for liquids it quickly decays to zero indicating the absence of any long-range order. As shown in Figure 3, the magnitude of LRO for Li ions remains constant in time for all temperatures till melting indicating an underlying crystalline structure. However, the decrease in magnitude with temperature suggests perceptible disorder among Li ions while preserving a crystalline sub-lattice, which is somewhat counter-intuitive. One possible way to accommodate disorder among Li ions within the Li sub-lattice is through dynamic hopping of Li ions between lattice sites, a mechanism that has been observed in prior atomistic simulations of Li2O [26,27], and ubiquitous among the anions of fluorite superionic conductors in the superionic state [13,21,23]. We will demonstrate later that such cation hopping between native sites indeed takes place and Li ions diffuse through string-like dynamical structures. In contrast, the oxygen anions show limited variation in the LRO magnitude with temperature indicating a rigid anion sub-lattice.
Figure 4a shows the time-averaged LRO magnitude against temperature (scaled to Tλ = 1200 K). The growth of disorder on the Li sub-lattice accelerates at ~1000 K, which is the characteristic temperature at which the neutron diffraction data shows a discernible increase in the disorder. Interestingly, at temperatures below Tα (1000 K), and above Tλ (1200 K), the LRO shows a near-linear variation for the range of temperatures considered in this study. As expected, the LRO magnitude hovers near unity and does not change significantly for the oxygen anions.
We have calculated a metric for Li-ion disorder as the difference (modulus) between the magnitude of LRO and its ideal value (unity) and shifted it to give a null value at Tα. In Figure 4b, we have compared this disorder metric from simulations to the fraction of Li ions leaving the native sites evaluated from neutron scattering data, both scaled to their respective magnitudes at Tλ. Interestingly, the disorder metric from atomistic simulation is able to capture the variation of the neutron diffraction data at temperatures ranging from 1000 to ~1300 K (shown by the shaded region); at higher temperatures, LRO predicts a larger disorder eventually leading to melting at 1715 K, which is close to the experimental melting point (1711 K).
3.2. Hopping and Cooperativity among LI Ions
A number of atomistic simulations on fluorites and antifluorites have shown that the mobile anions hop from one native lattice site to another at temperatures close to Tλ [13,26,27,32,33]. We have observed similar hopping of Li ions, as shown in Figure 5. The Li ions mostly vibrate about their lattice sites, punctuated by sporadic hopping to a neighboring site. Occasionally, concerted ionic hopping can also be noticed, in addition to a few large amplitude displacements. The characteristic motion of all Li ions, on average, can be extracted using Gs(r,t), the self-part of the van Hove space-time correlation function. Gs(r,t) gives the conditional probability of finding an ion in an infinitesimal volume dr around r at time t, given that it has occupied the origin at time t = 0. Figure 5b shows Gs(r,t) for the Li ions for a correlation time of 30 ps at 1200 K. The self-correlation decays rapidly with r, but the multiple peaks show the proclivity of the Li ions to settle at these positions simultaneously. To identify the peak locations, the radial distribution function (RDF) of the Li ions at 1200 K is also shown in Figure 5b. Interestingly, the peak positions of Gs(r,t) show excellent agreement with the nearest neighbor distances obtained from RDF, indicating that Li ions engage in discrete hops from one native lattice site to another.
The ionic jumps are thermally driven and do not depend on having permanent vacancies/defects in the system. In our recent work on fluorites, we have established that such concerted ionic hops can persist for hundreds of picoseconds and are instrumental in forming quasi-one-dimensional string-like structures [23]. Not surprisingly, a similar mechanism is seen to be operational among the Li ions above the characteristic order-disorder transition temperature Tα. In a departure from the conventional interpretation of defects, we will now show that disorder among the Li ions is manifested through dynamic string-like structures, which have a finite lifetime.
3.3. String-Like Dynamic Structures
The hopping of Li ions mostly occurs cooperatively between two or more neighbors. We observe from our simulations that the mobile Li ions tend to follow each other in quasi-one-dimensional or string-like trajectories. We identify a string as an ordered set of ions in which an ion replaces the next one over a certain time interval; a string thus contains at least two ions. This criterion is similar to the one used in the study of supercooled liquids to analyze string-like cooperative motion in the arrested state [34,35]. If P(L) is the probability of detecting a string of length L over a time interval δt, the mean string length (Δ) is computed as . We have varied the time interval of observation (δt) from 0.1 ps to several hundred ps; these time intervals are generally sufficient to establish the kinetics of string formation and annihilation. For computational efficiency, we have limited our analysis to the top 5% mobile Li ions. As observed in our previous work on fluorites [23], the string characteristics are dynamically similar among different mobile groups.
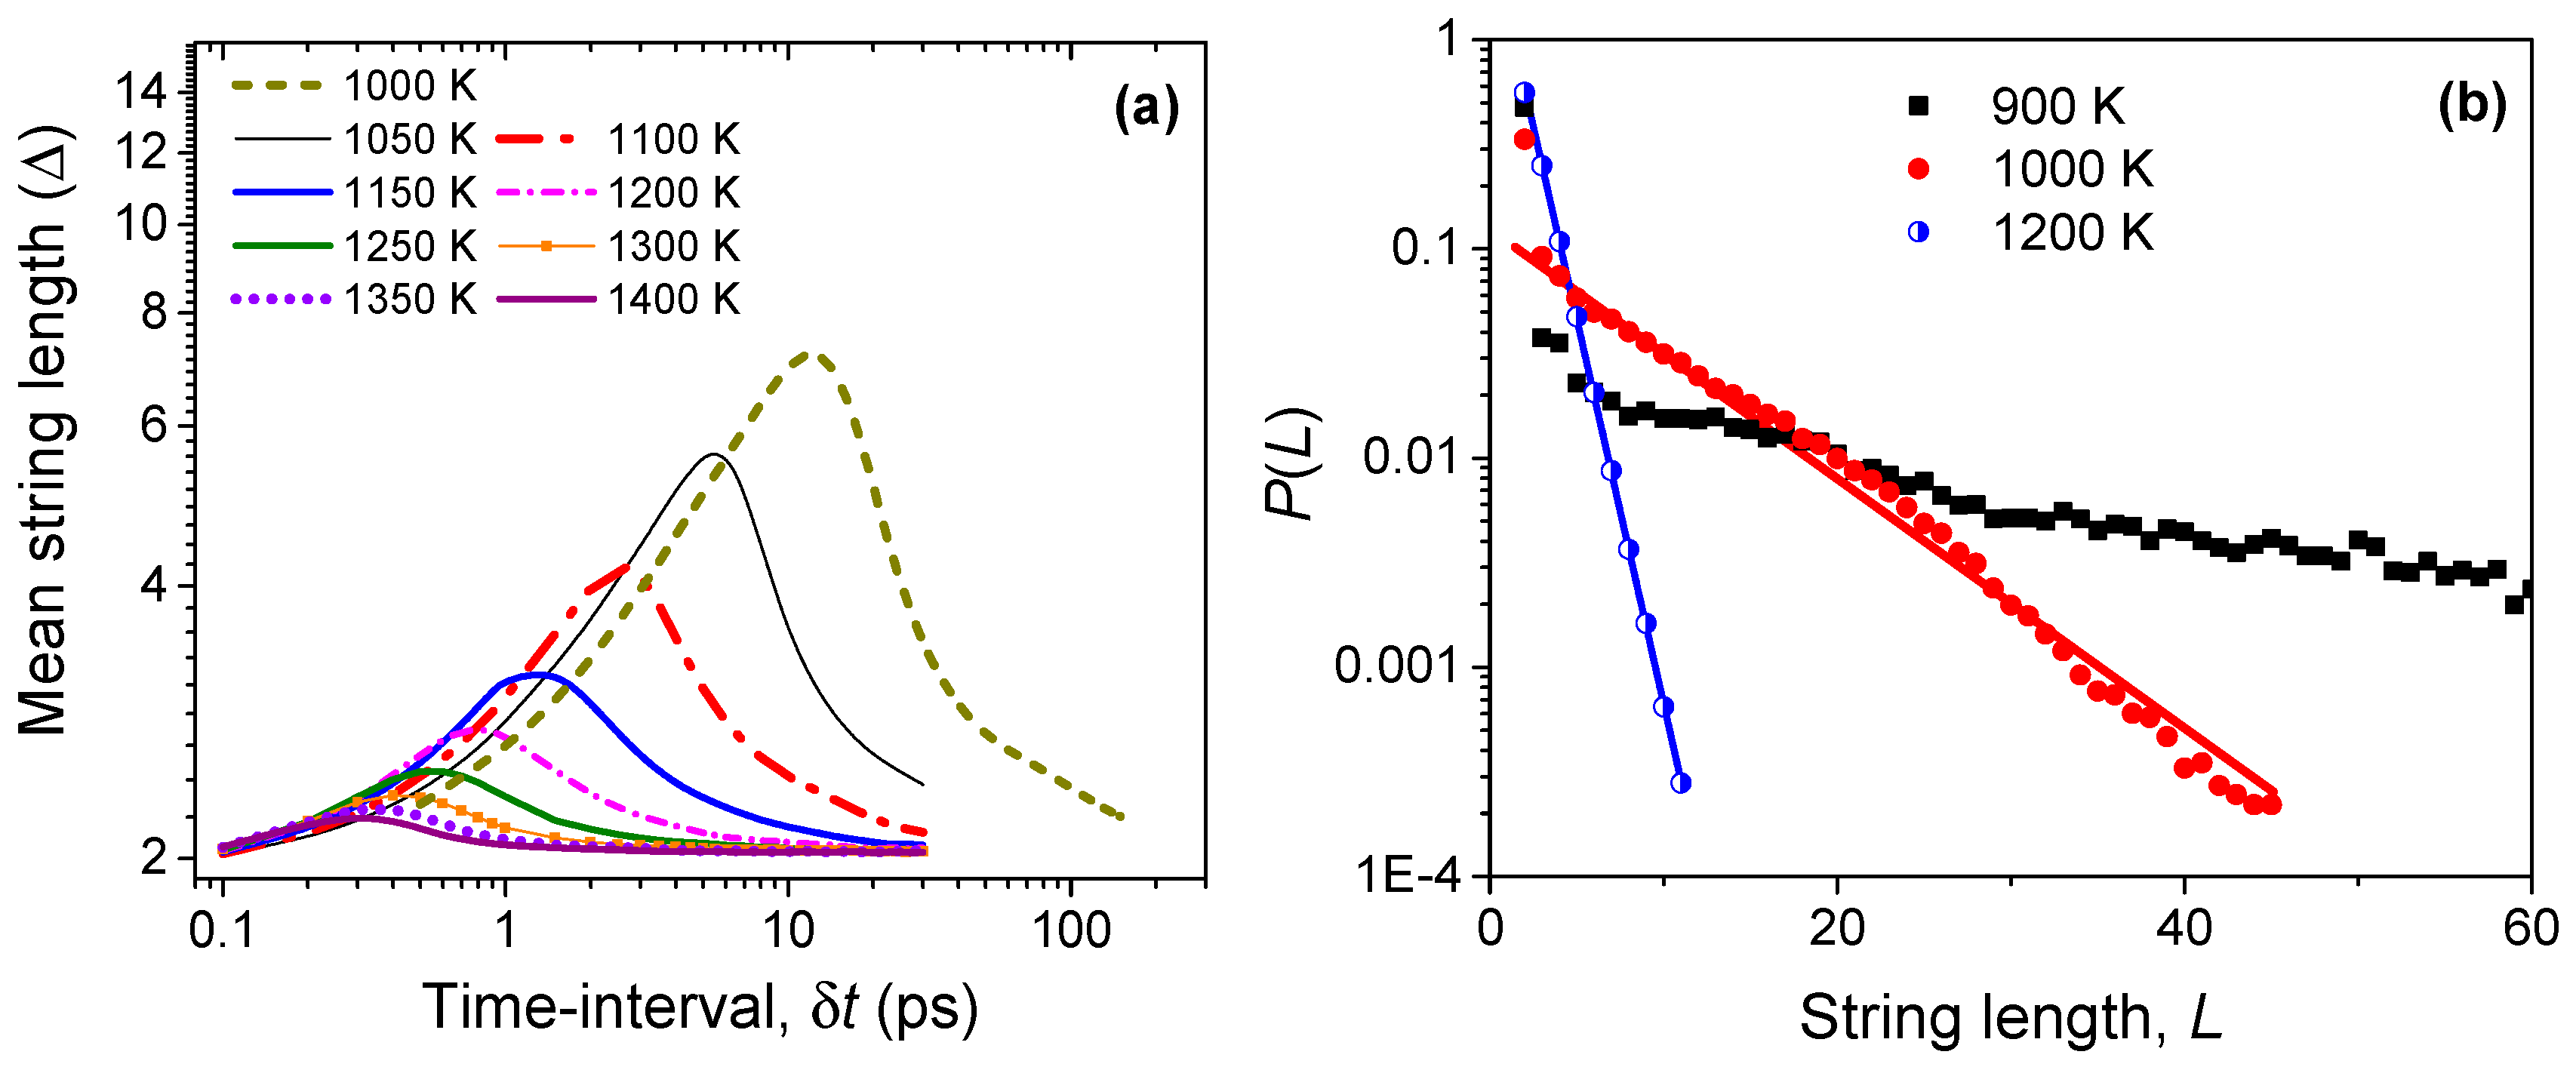
Figure 6a shows the variation of the mean string length (Δ) with time, for temperatures ranging from 1000 to 1400 K. The strings have a lifetime with the time needed for establishing the longest string, denoted as τ*(T), decreasing with increasing temperature. For any temperature, with increasing time, the strings latch on to new ions to grow in length until the peak time τ*. Clearly, this dynamic process is favorable at lower temperatures rather than at higher temperatures. Thus, strings of different lengths can be formed at all temperatures, but longer ones are more probable at lower temperatures. It is interesting to note that the peak length of the strings approaches two at the highest temperatures, which indicates that the string motion at these temperatures mostly involves a set of two Li ions where one replaces the other. Since the formation of strings is a random process, coherent and well-defined string formation follows an exponential distribution—a feature that is also observed in supercooled liquids and jammed systems [34,36]. As noted in Figure 6b, the probability of string formation follows an exponential distribution above the order-disorder transition temperature Tα (~1000 K). At lower temperatures, the distribution is uneven, which suggests a lack of spatio-temporal coherence among the Li ions in forming a string-like structure. A similar behavior is also observed in fluorites, wherein well-characterized strings are identified only above the characteristic temperature Tα [23].
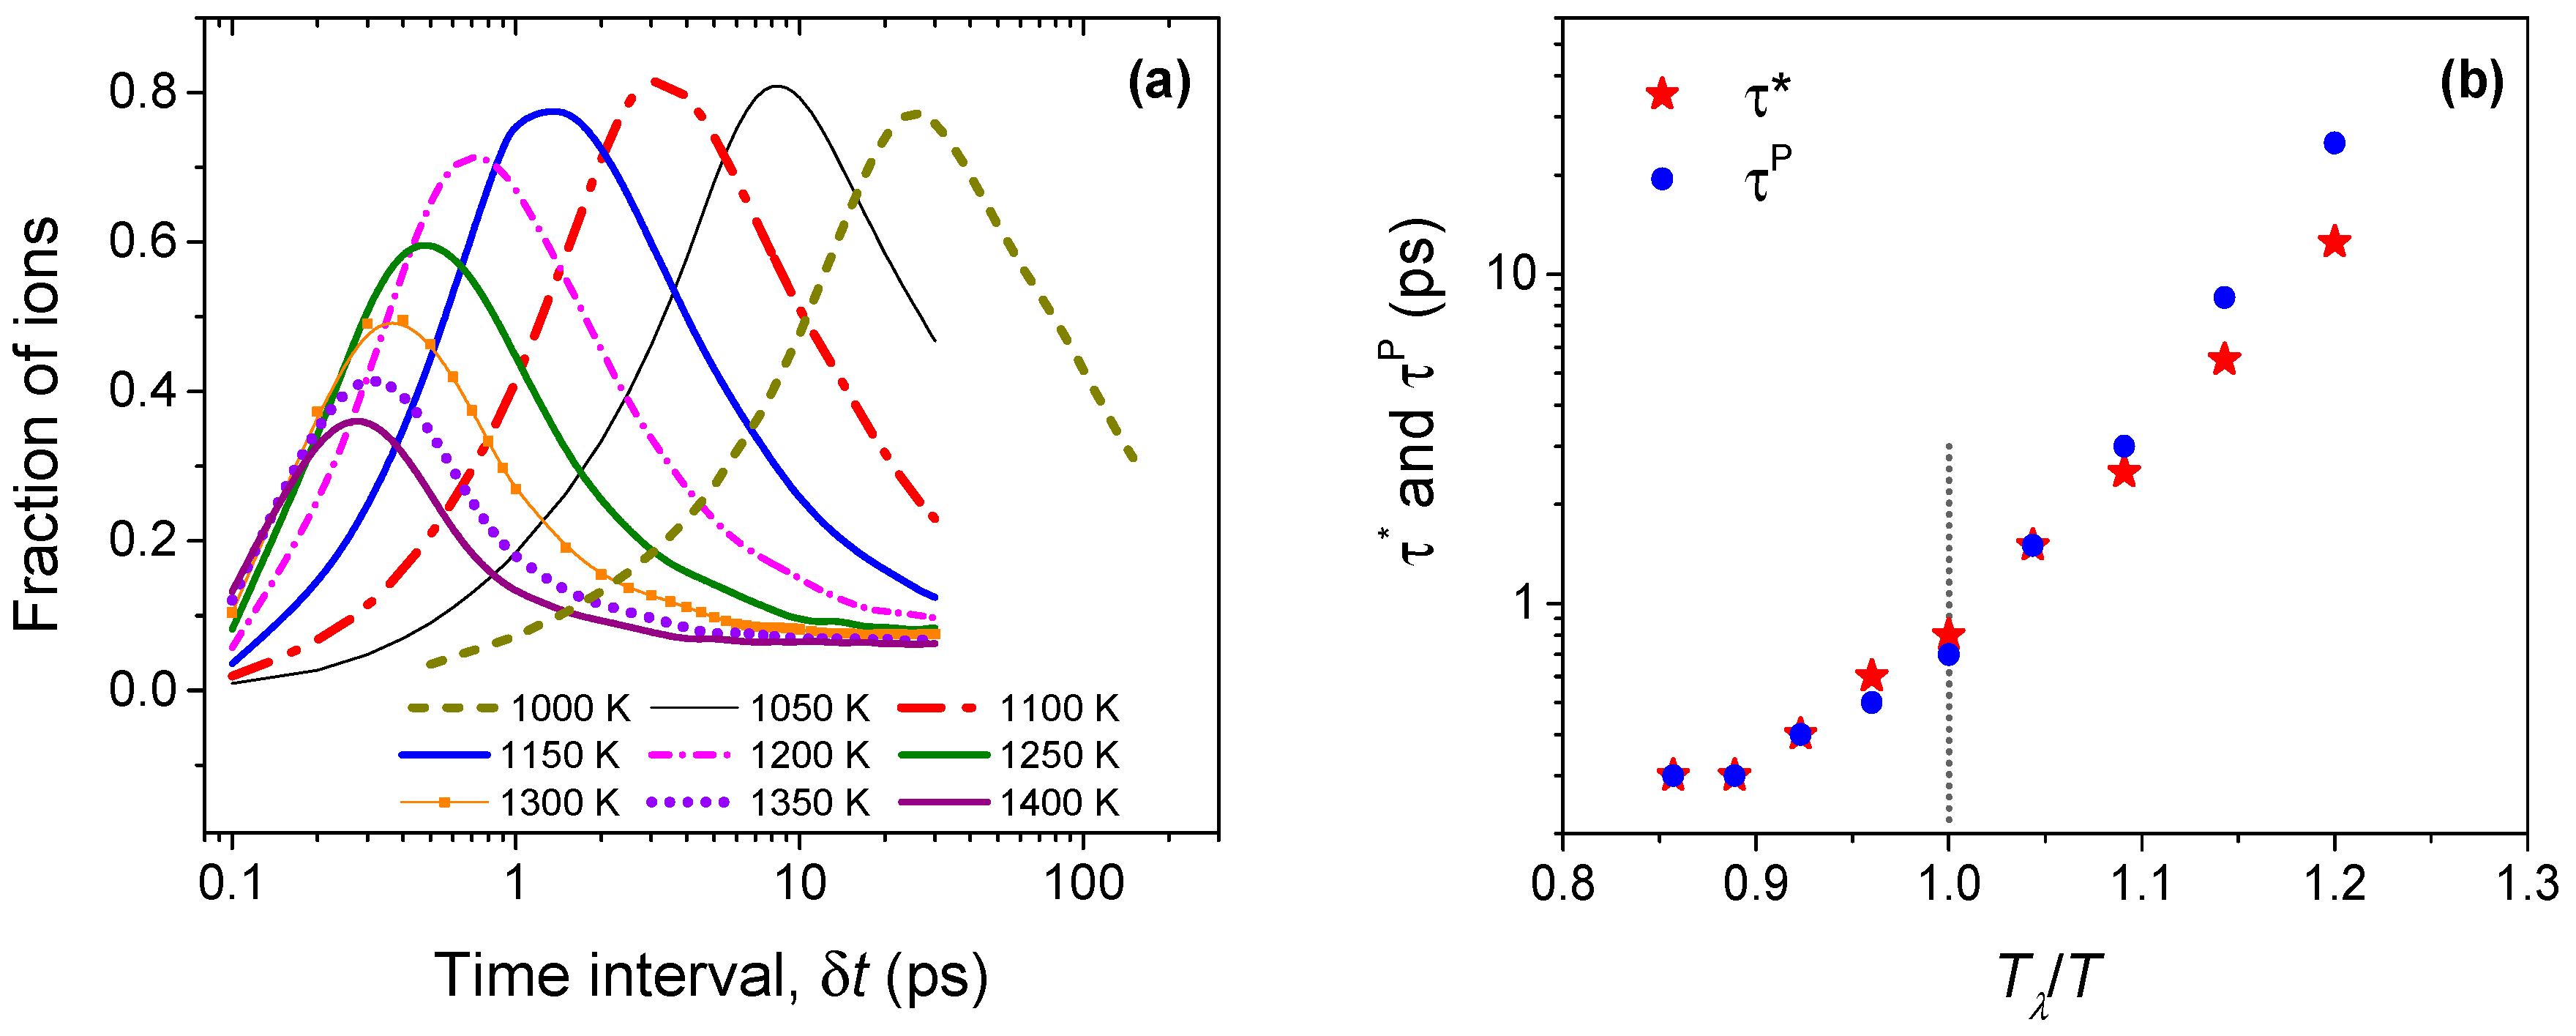
The population of lithium ions that are involved in strings throws more light on the string kinetics. Figure 7a shows the mean population of ions that are participating in the string process. Strikingly, near Tα (1000 K), close to 80% of the Li ions (among the top 5%) participate in the formation of strings. At temperatures above Tλ (1200 K), as the peak string length decreases, the peak participation also drops significantly. Interestingly, the peak participation lifetime (τP), which we define as the time when most ions participate, is somewhat larger than the peak string length lifetime τ* as shown in Figure 7b for temperatures below Tλ. While in typical supercooled liquids, these lifetimes are nearly identical [23,34], our earlier work on fluorites (CaF2 and UO2) also shows τP to be larger than τ* at temperatures below Tλ [23]. However, at a temperature of Tλ and above, both timescales are almost coincident, a behavior that is identical in CaF2 and UO2. It is instructive to note that the lifetime timescales are O(1) ps at Tλ, which is a signature for liquid-like diffusivity. Summarizing, two distinct timescales can be recognized in antifluorites (and fluorites [23]): the time corresponding to the peak string length (τ*), and the time when most ions participate in strings (τP). Whereas τ* is associated with individual strings, τP dictates the collective relaxation of the strings. We therefore anticipate that τP (and not τ*) will control the diffusive relaxation of the system: in fluorites, we have shown that this is indeed the case [23].
We will now attempt to evaluate an effective string diffusivity. As strings are transient structures, diffusivity cannot be computed as the longtime (t) limit of the slope of the mean square displacement (Δr2) [31]. Instead, we will assume that the string diffusivity is controlled by the peak string participation lifetime τP [23]. Since strings experience a characteristic displacement of δP in time τP, we will regard the string diffusivity to be proportional to (δP)2/τP, analogous to the slope of the mean square displacement. In Figure 8, we delineate the (scaled) bulk diffusivity of the lithium ions evaluated as and compare it against the (scaled) string diffusivity, as a function of temperature. The correlation between the scaled string and bulk diffusivities is quite striking. As shown in the inset of Figure 8, the average string displacement δP at τP is only slightly more than the closest cation-cation separation distance, and they differ little across the temperatures. Thus the string diffusivity is dominated by the peak string participation lifetime τP. The close correspondence between the bulk and string diffusivities emphasizes the influence of low-dimensional string-like structures in the superionic diffusion processes.
4. Discussion and Conclusions
Early neutron diffraction investigations have focused on determining the most probable defect positions for the disordered state in fluorites [11,37] and antifluorites [10]. While several quasi-static defect cluster models have been proposed before [38], none of them has the ability to identify realistic ionic conduction or diffusive pathways. The goal of this paper has been to investigate the dynamics of Li ions in the superionic state using atomistic simulations and propose a mechanism that can potentially pinpoint the origin of enhanced diffusivity of Li ions in Li2O. Our first endeavor has been to define the extent of the superionic state of Li2O. Using the reported neutron diffraction [10] and ionic conductivity [2] data, we have established that the disorder among Li ions is first manifested at a characteristic temperature Tα (~1000 K), which is below the λ transition temperature Tλ (1200 K). The disorder estimated from the atomistic simulations shows excellent agreement with the neutron diffraction data and has provided an additional confirmation for the order-disorder transition or the onset of superionicity at Tα.
The hopping of Li ions across the native tetrahedral sites has been reported before, as well as in this investigation. We have examined the kinetics of hopping over longer timescales and have determined that Li ions form string-like dynamical structures with a finite lifetime. We have then shown that the string diffusivity, which is based on peak participation of Li ions in strings, depicts a remarkable correlation to the bulk diffusivity of the system. Thus, a plausible atomistic mechanism is proposed that accounts for both the disorder, which is inherently dynamic, and the enhanced ionic diffusion in the superionic state of Li2O.
Acknowledgments
The authors acknowledge funding from the US Department of Energy (DOE) through the Nuclear Energy University Program (NEUP). Insightful observations from Professors Juan Garrahan and Srikanth Sastry are gratefully acknowledged.
Author Contributions
Ajay Annamareddy conceived the project, performed the simulations, and analyzed the data. Ajay Annamareddy and Jacob Eapen jointly wrote the paper. Both authors have read and approved the final manuscript.
Conflicts of Interest
The authors declare no conflict of interest.
Appendix A
The parameters for the inter-ionic potential are shown in Table A1.

Table A1.
Inter-ionic potential parameters [24].
Table A1.
Inter-ionic potential parameters [24].
| z+ (|e|) | z− (|e|) | A++ (eV) | A−− (eV) | A+− (eV) | ρ+− (Å) |
|---|---|---|---|---|---|
| 0.790909 | −1.581818 | 0.0 | 0.0 | 1425.4833 | 0.236303 |
C++ = C−− = C+− = 0.
Appendix B. Comparison of Wolf and Ewald Summation Methods for Coulombic Interactions
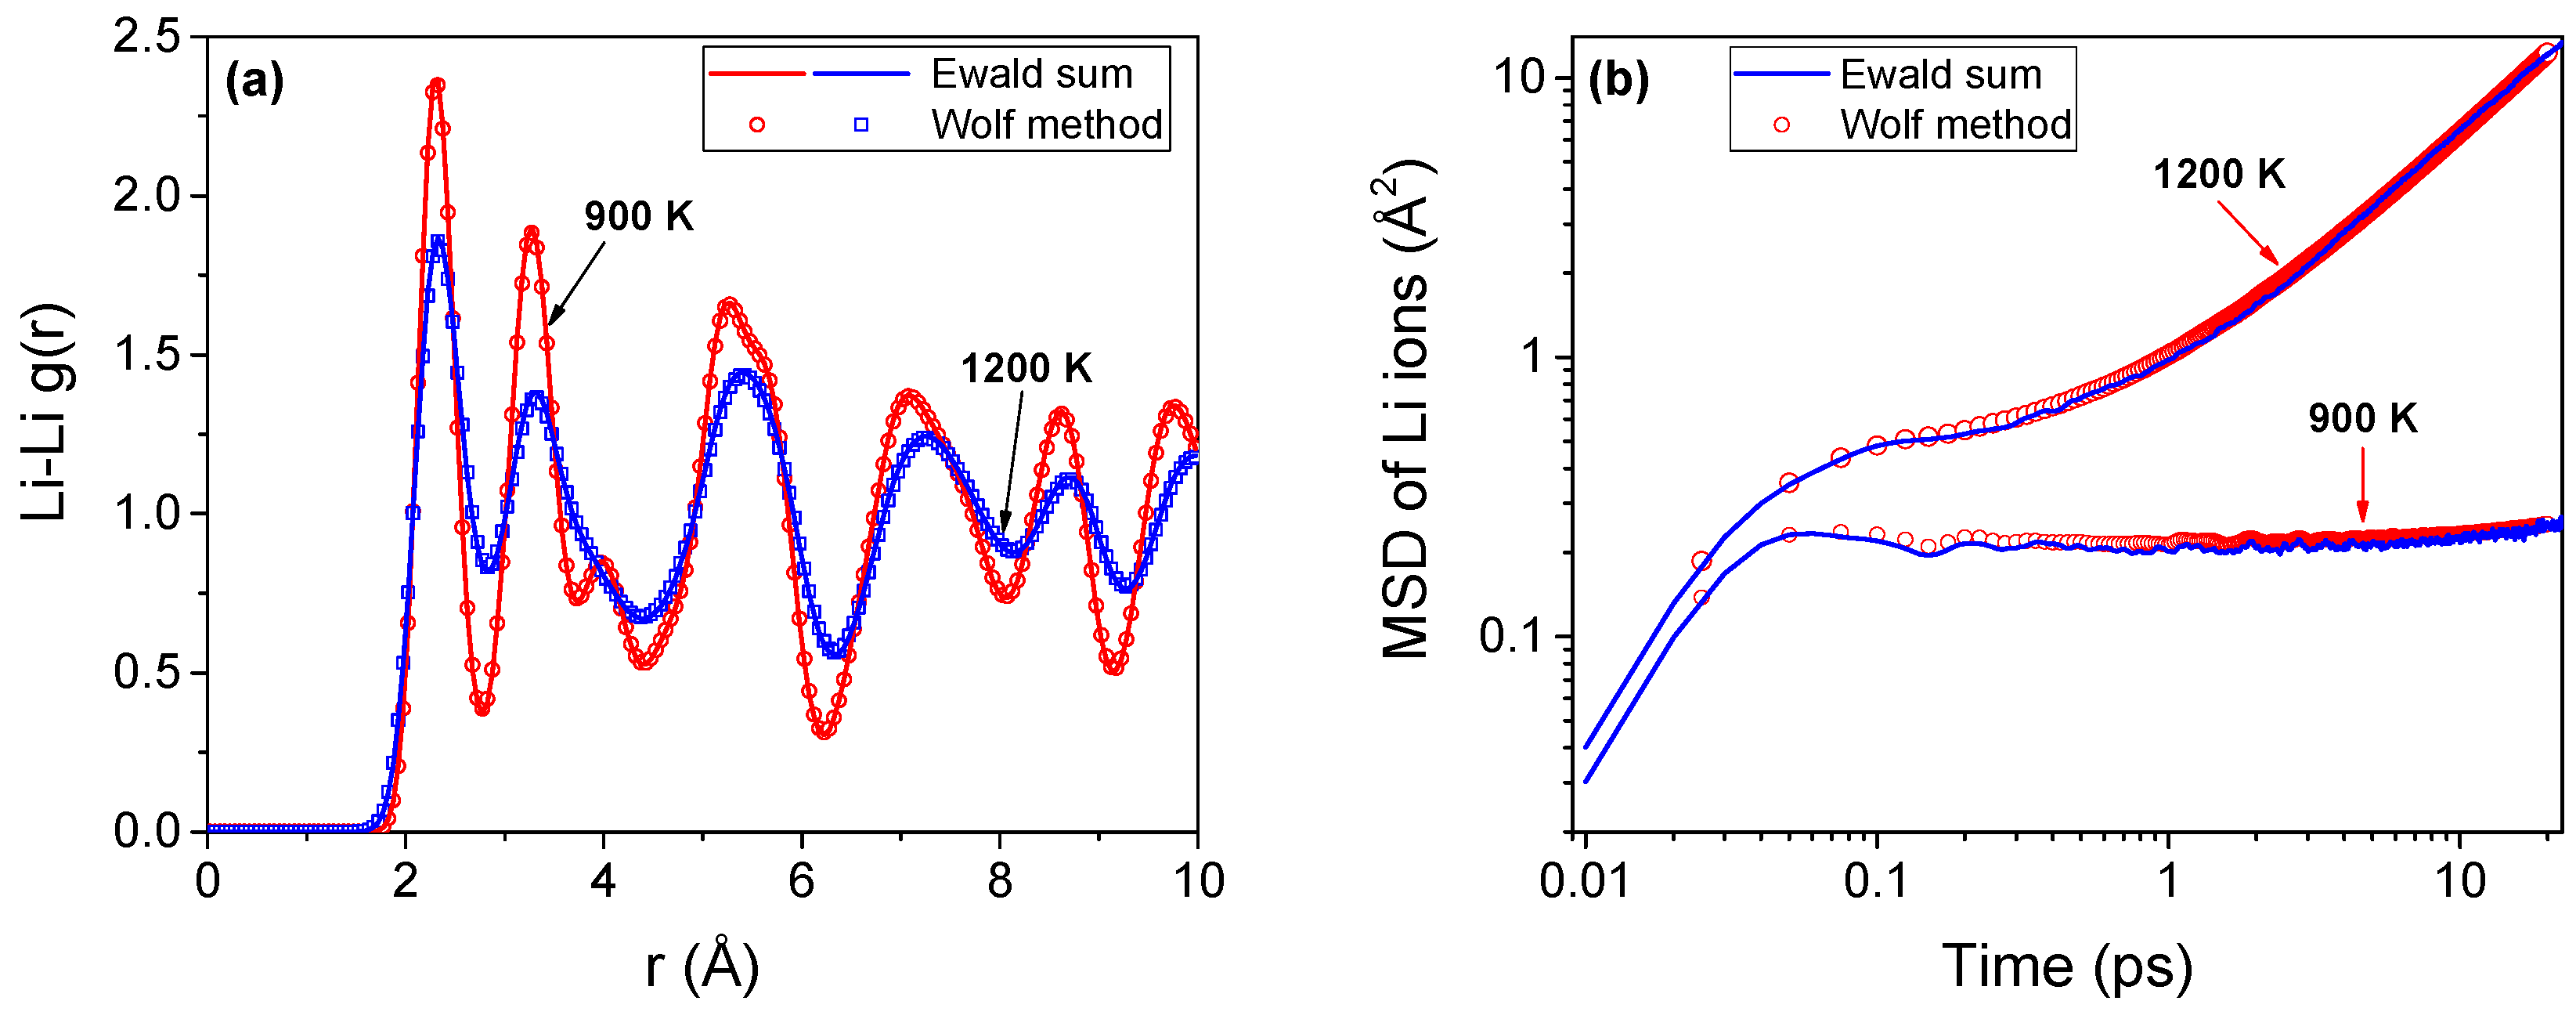
The short range Wolf method [30] is an attractive choice for the evaluation of electrostatic interactions in ionic systems. We have verified that the accuracy of the Wolf method is comparable to that of the Ewald sum method, which is typically used in ionic molecular simulations. The Ewald sum simulations are performed using LAMMPS [39] while the Wolf method is implemented using our in-house code—qbox. As delineated in Figure A1, both methods predict nearly identical structure (radial distribution function) and dynamics (mean square displacement). The methods are tested on identical systems with 6144 ions with periodic boundary conditions applied along all three orthogonal directions. A timestep of 1 fs is employed for all the simulations. For the Ewald sum calculations, a relative error of 10−7 is assigned (for forces), while for the Wolf method, the damping parameter (α) is chosen as 0.3. Our earlier simulations [13,21,22,23] on superionic UO2 and CaF2 also showed excellent agreement between these methods.
Figure A1.
Structure and dynamics of lithium ions in Li2O using Ewald sum and Wolf methods. (a) Radial distribution function, g(r) of lithium ions at temperatures on either side of the superionic-onset temperature (Tα ~1000 K); (b) Mean square displacement of the lithium ions for the same temperature range.

References
- Stacey, W.M. Fusion: An Introduction to the Physics and Technology of Magnetic Confinement Fusion, 2nd ed.; Wiley-VCH: Weinheim, Germany, 2010. [Google Scholar]
- Strange, J.H.; Rageb, S.M.; Chadwick, A.V.; Flack, K.W.; Harding, J.H. Conductivity and NMR study of ionic mobility in lithium oxide. Faraday Trans. 1990, 86, 1239–1241. [Google Scholar] [CrossRef]
- Kumar, B.; Kumar, J.; Leese, R.; Fellner, J.P.; Rodrigues, S.J.; Abraham, K.M. A solid-state, rechargeable, long cycle life lithium-air battery. J. Electrochem. Soc. 2010, 157, A50–A54. [Google Scholar] [CrossRef]
- Xu, M.; Ding, J.; Ma, E. One-dimensional stringlike cooperative migration of lithium ions in an ultrafast ionic conductor. Appl. Phys. Lett. 2012, 101, 031901. [Google Scholar] [CrossRef]
- Mo, Y.; Ong, S.P.; Ceder, G. First principles study of the Li10GeP2S12 lithium super ionic conductor material. Chem. Mater. 2012, 24, 15–17. [Google Scholar] [CrossRef]
- Salanne, M.; Marrocchelli, D.; Watson, G.W. Cooperative mechanism for the diffusion of Li+ ions in LiMgSO4F. J. Phys. Chem. C 2012, 116, 18618–18625. [Google Scholar] [CrossRef]
- Wang, Y.; Richards, W.D.; Ong, S.P.; Miara, L.J.; Kim, J.C.; Mo, Y.; Ceder, G. Design principles for solid-state lithium superionic conductors. Nat. Mater. 2015, 14, 1026–1031. [Google Scholar] [CrossRef] [PubMed]
- Ranganath, S.B.; Hassan, A.S.; Ramachandran, B.R.; Wick, C.D. Role of metal-lithium oxide interfaces in the extra lithium capacity of metal oxide lithium-ion battery anode materials. J. Electrochem. Soc. 2016, 163, A2172–A2178. [Google Scholar] [CrossRef]
- Hull, S. Superionics: Crystal structures and conduction processes. Rep. Prog. Phys. 2004, 67, 1233–1314. [Google Scholar] [CrossRef]
- Farley, T.W.D.; Hayes, W.; Hull, S.; Hutchings, M.T.; Vrtis, M. Investigation of thermally induced Li+ ion disorder in Li2O using neutron diffraction. J. Phys. Condens. Matter 1991, 3, 4761–4781. [Google Scholar] [CrossRef]
- Hutchings, M.T.; Clausen, K.; Dickens, M.H.; Hayes, W.; Kjems, J.K.; Schnabel, P.G.; Smith, C. Investigation of thermally induced anion disorder in fluorites using neutron scattering techniques. J. Phys. C Solid State Phys. 1984, 17, 3903–3940. [Google Scholar] [CrossRef]
- Voronin, B.M.; Volkov, S.V. Ionic conductivity of fluorite type crystals CaF2, SrF2, BaF2, and SrCl2 at high temperatures. J. Phys. Chem. Solids 2001, 62, 1349–1358. [Google Scholar] [CrossRef]
- Annamareddy, A.; Eapen, J. Disordering and dynamic self-organization in stoichiometric UO2 at high temperatures. J. Nucl. Mater. 2017, 483, 132–141. [Google Scholar] [CrossRef]
- Hull, S.; Norberg, S.T.; Ahmed, I.; Eriksson, S.G.; Mohn, C.E. High temperature crystal structures and superionic properties of SrCl2, SrBr2, BaCl2 and BaBr2. J. Solid State Chem. 2011, 184, 2925–2935. [Google Scholar] [CrossRef]
- Dworkin, A.S.; Bredig, M.A. Diffuse transition and melting in fluorite and anti-fluorite type of compounds: Heat content of potassium sulfide from 298 to 1260° K. J. Phys. Chem. 1968, 72, 1277–1281. [Google Scholar] [CrossRef]
- Eapen, J.; Annamareddy, A. Entropic crossovers in superionic fluorites from specific heat. Ionics 2017, 23, 1043–1047. [Google Scholar] [CrossRef]
- Catlow, C.R.A.; Comins, J.D.; Germano, F.A.; Harley, R.T.; Hayes, W. Brillouin scattering and theoretical studies of high-temperature disorder in fluorite crystals. J. Phys. C Solid State Phys. 1978, 11, 3197–3212. [Google Scholar] [CrossRef]
- Kleppmann, W.G. High-temperature disorder and the elastic constants in fluorite crystals. J. Phys. C Solid State Phys. 1978, 11, L91–L95. [Google Scholar] [CrossRef]
- Oishi, Y.; Kamei, Y.; Akiyama, M.; Yanagi, T. Self-diffusion coefficient of lithium in lithium oxide. J. Nucl. Mater. 1979, 87, 341–344. [Google Scholar] [CrossRef]
- Wilson, M.; Jahn, S.; Madden, P.A. The construction and application of a fully flexible computer simulation model for lithium oxide. J. Phys. Condens. Matter 2004, 16, S2795–S2810. [Google Scholar] [CrossRef]
- Annamareddy, V.A.; Nandi, P.K.; Mei, X.; Eapen, J. Waxing and waning of dynamical heterogeneity in the superionic state. Phys. Rev. E 2014, 89, 010301(R). [Google Scholar] [CrossRef] [PubMed]
- Annamareddy, A.; Eapen, J. Mobility propagation and dynamic facilitation in superionic conductors. J. Chem. Phys. 2015, 143, 194502. [Google Scholar] [CrossRef] [PubMed]
- Annamareddy, A.; Eapen, J. Low dimensional string-like relaxation underpins superionic conduction in fluorites and related structures. Sci. Rep. 2017, 7, 44149. [Google Scholar] [CrossRef] [PubMed]
- Asahi, R.; Freeman, C.M.; Saxe, P.; Wimmer, E. Thermal expansion, diffusion and melting of Li2O using a compact forcefield derived from ab initio molecular dynamics. Model. Simul. Mater. Sci. Eng. 2014, 22, 075009. [Google Scholar] [CrossRef]
- Goel, P.; Choudhury, N.; Chaplot, S.L. Fast ion diffusion, superionic conductivity and phase transitions of the nuclear materials UO2 and Li2O. J. Phys. Condens. Matter 2007, 19, 386239. [Google Scholar] [CrossRef]
- Goel, P.; Choudhury, N.; Chaplot, S.L. Superionic behavior of lithium oxide Li2O: A lattice dynamics and molecular dynamics study. Phys. Rev. B 2004, 70, 174307. [Google Scholar] [CrossRef]
- Mulliner, A.D.; Aeberhard, P.C.; Battle, P.D.; David, W.I.F.; Refson, K. Diffusion in Li2O studied by non-equilibrium molecular dynamics for 873 < T/K < 1603. Phys. Chem. Chem. Phys. 2015, 17, 21470–21475. [Google Scholar] [PubMed]
- Rodeja, J.G.; Meyer, M.; Hayoun, M. Derivation and validation of model potentials for Li2O from density-functional theory. Model. Simul. Mater. Sci. Eng. 2001, 9, 81–96. [Google Scholar] [CrossRef]
- Oda, T.; Oya, Y.; Tanaka, S.; Weber, W.J. Validation of potential models for Li2O in classical molecular dynamics simulation. J. Nucl. Mater. 2007, 367, 263–268. [Google Scholar] [CrossRef]
- Wolf, D.; Keblinski, P.; Phillpot, S.R.; Eggebrecht, J. Exact method for the simulation of Coulombic systems by spherically truncated, pairwise r−1 summation. J. Chem. Phys. 1999, 110, 8254–8282. [Google Scholar] [CrossRef]
- Rapaport, D.C. The Art of Molecular Dynamics Simulation, 2nd ed.; Cambridge University Press: Cambridge, UK, 2004. [Google Scholar]
- Hochrein, O.; Zahn, D. Atomic mechanisms of superionic conductivity in fluorite. Solid State Ionics 2009, 180, 116–119. [Google Scholar] [CrossRef]
- Lunev, A.V.; Tarasov, B.A. A classical molecular dynamics study of the correlation between the Bredig transition and thermal conductivity of stoichiometric uranium dioxide. J. Nucl. Mater. 2011, 415, 217–221. [Google Scholar] [CrossRef]
- Gebremichael, Y.; Vogel, M.; Glotzer, S.C. Particle dynamics and the development of string-like motion in a simulated monoatomic supercooled liquid. J. Chem. Phys. 2004, 120, 4415–4427. [Google Scholar] [CrossRef] [PubMed]
- Donati, C.; Douglas, J.F.; Kob, W.; Plimpton, S.J.; Poole, P.H.; Glotzer, S.C. Stringlike cooperative motion in a supercooled liquid. Phys. Rev. Lett. 1998, 80, 2338. [Google Scholar] [CrossRef]
- Keys, A.S.; Abate, A.R.; Glotzer, S.C.; Durian, D.J. Measurement of growing dynamical length scales and prediction of the jamming transition in a granular material. Nat. Phys. 2007, 3, 260–264. [Google Scholar] [CrossRef]
- Clausen, K.; Hayes, W.; Macdonald, J.E.; Osborn, R.; Hutchings, M.T. Observation of oxygen Frenkel disorder in uranium dioxide above 2000 K by use of neutron-scattering techniques. Phys. Rev. Lett. 1984, 52, 1238–1241. [Google Scholar] [CrossRef]
- Allnatt, A.R.; Chadwick, A.V.; Jacobs, P.W.M. A model for the onset of fast-ion conduction in fluorites. Proc. R. Soc. Lond. Ser. A 1987, 410, 385–408. [Google Scholar] [CrossRef]
- Plimpton, S. Fast parallel algorithms for short-range molecular dynamics. J. Comput. Phys. 1995, 117, 1–19, (Version 9 December 2014). [Google Scholar] [CrossRef]
Figure 1.
(Left) Lattice structure of an antifluorite crystal. The larger spheres (shown in red) depict anions that form an FCC structure while the smaller spheres (in green) represent cations occupying all the available tetrahedral sites of the FCC lattice; (Right) In an alternate illustration, the cations form a simple cubic lattice while the anions occupy alternative cube centers. A fluorite structure is realized when the cations and anions are interchanged. Neutron scattering/diffraction experiments and atomistic simulations indicate that the empty cube centers or the octahedral sites of the FCC lattice, which are the interstitial locations, are increasingly avoided in the superionic state for fluorites and antifluorites [9,11,13,14].
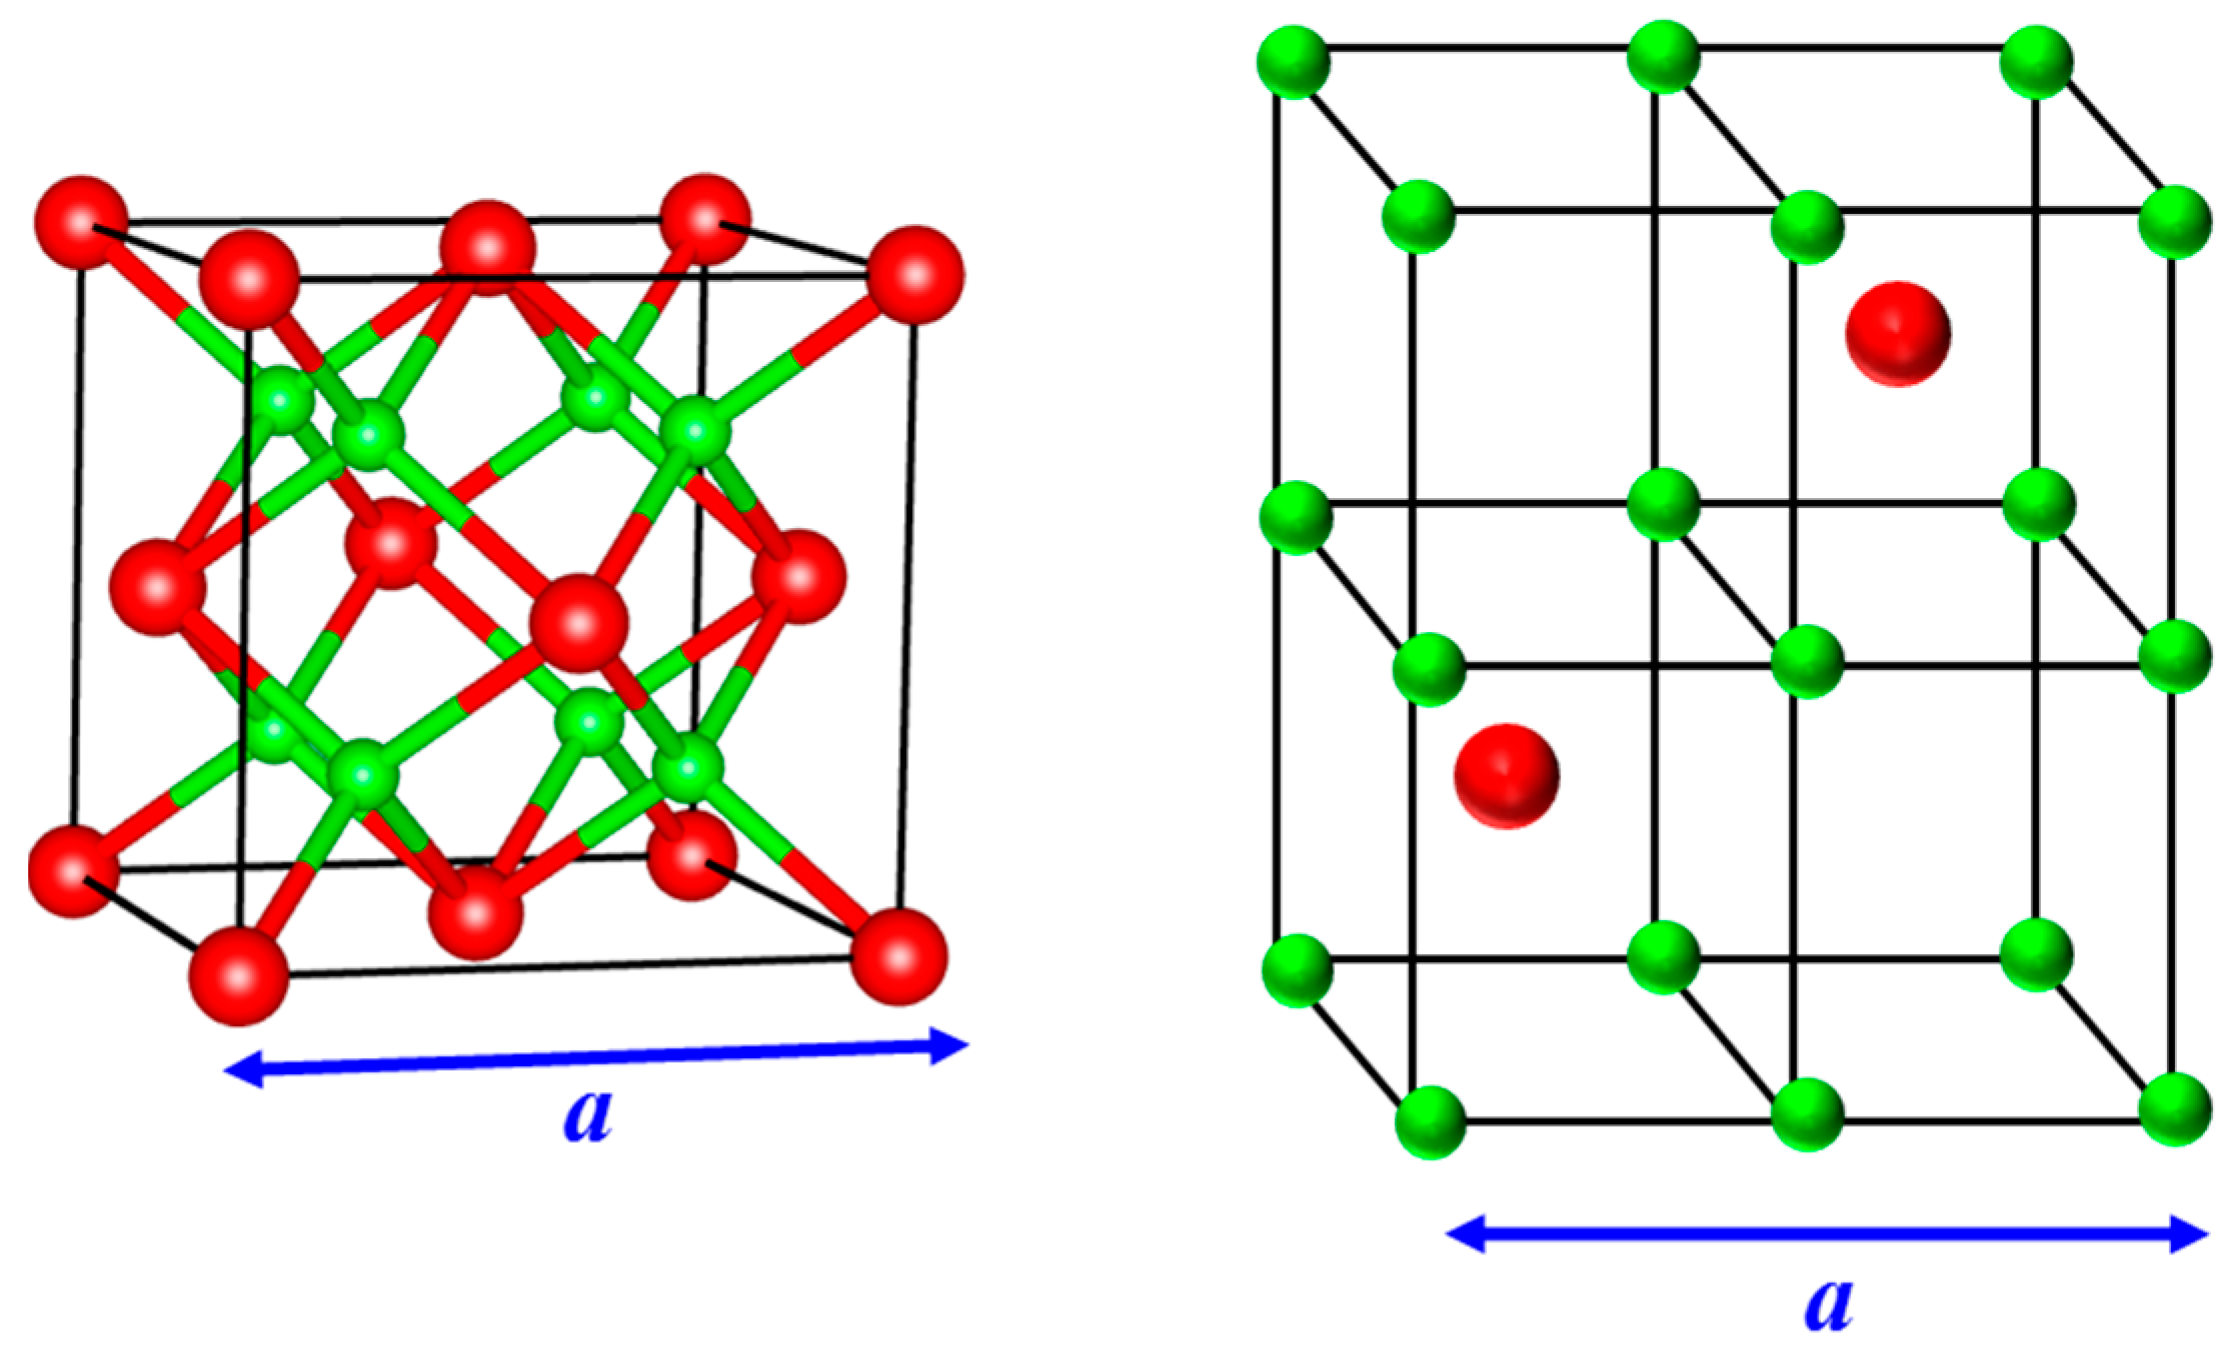
Figure 2.
(a) Fraction of lithium ions (nf) that are displaced from regular sites, obtained from neutron diffraction measurements in Li2O [10]. The onset of disorder estimated from the best-fit to the diffraction data occurs at Tα ≈ 1000 K; (b) Variation of ionic conductivity with temperature in Li2O measured using nuclear magnetic resonance (NMR) [2]. As evident, the ionic conductivity also shows a noticeable change in slope at Tα ≈ 1000 K. A quantitative correlation between the onset of disorder and the change in the slope of ionic conductivity is observed in several fluorite conductors such as SrCl2, PbF2 and CaF2 [16].

Figure 3.
Magnitude of long-range order (LRO) parameter for (a) lithium and (b) oxygen ions across several temperatures in Li2O. The reciprocal lattice vector q is chosen along [1 0 0] and [1 −1 1] directions for the lithium and oxygen sub-lattices, respectively, and the magnitude of q corresponds to the longest wavelength in the system.

Figure 4.
(a) Variation of the time-averaged long-range order (LRO) for lithium and oxygen ions from 800 to 1400 K; (b) Comparison of the (scaled) neutron diffraction data with the (shifted/scaled) disorder metric evaluated from the LRO of Li ions. The statistical error for LRO is less than 1%.
Figure 4.
(a) Variation of the time-averaged long-range order (LRO) for lithium and oxygen ions from 800 to 1400 K; (b) Comparison of the (scaled) neutron diffraction data with the (shifted/scaled) disorder metric evaluated from the LRO of Li ions. The statistical error for LRO is less than 1%.
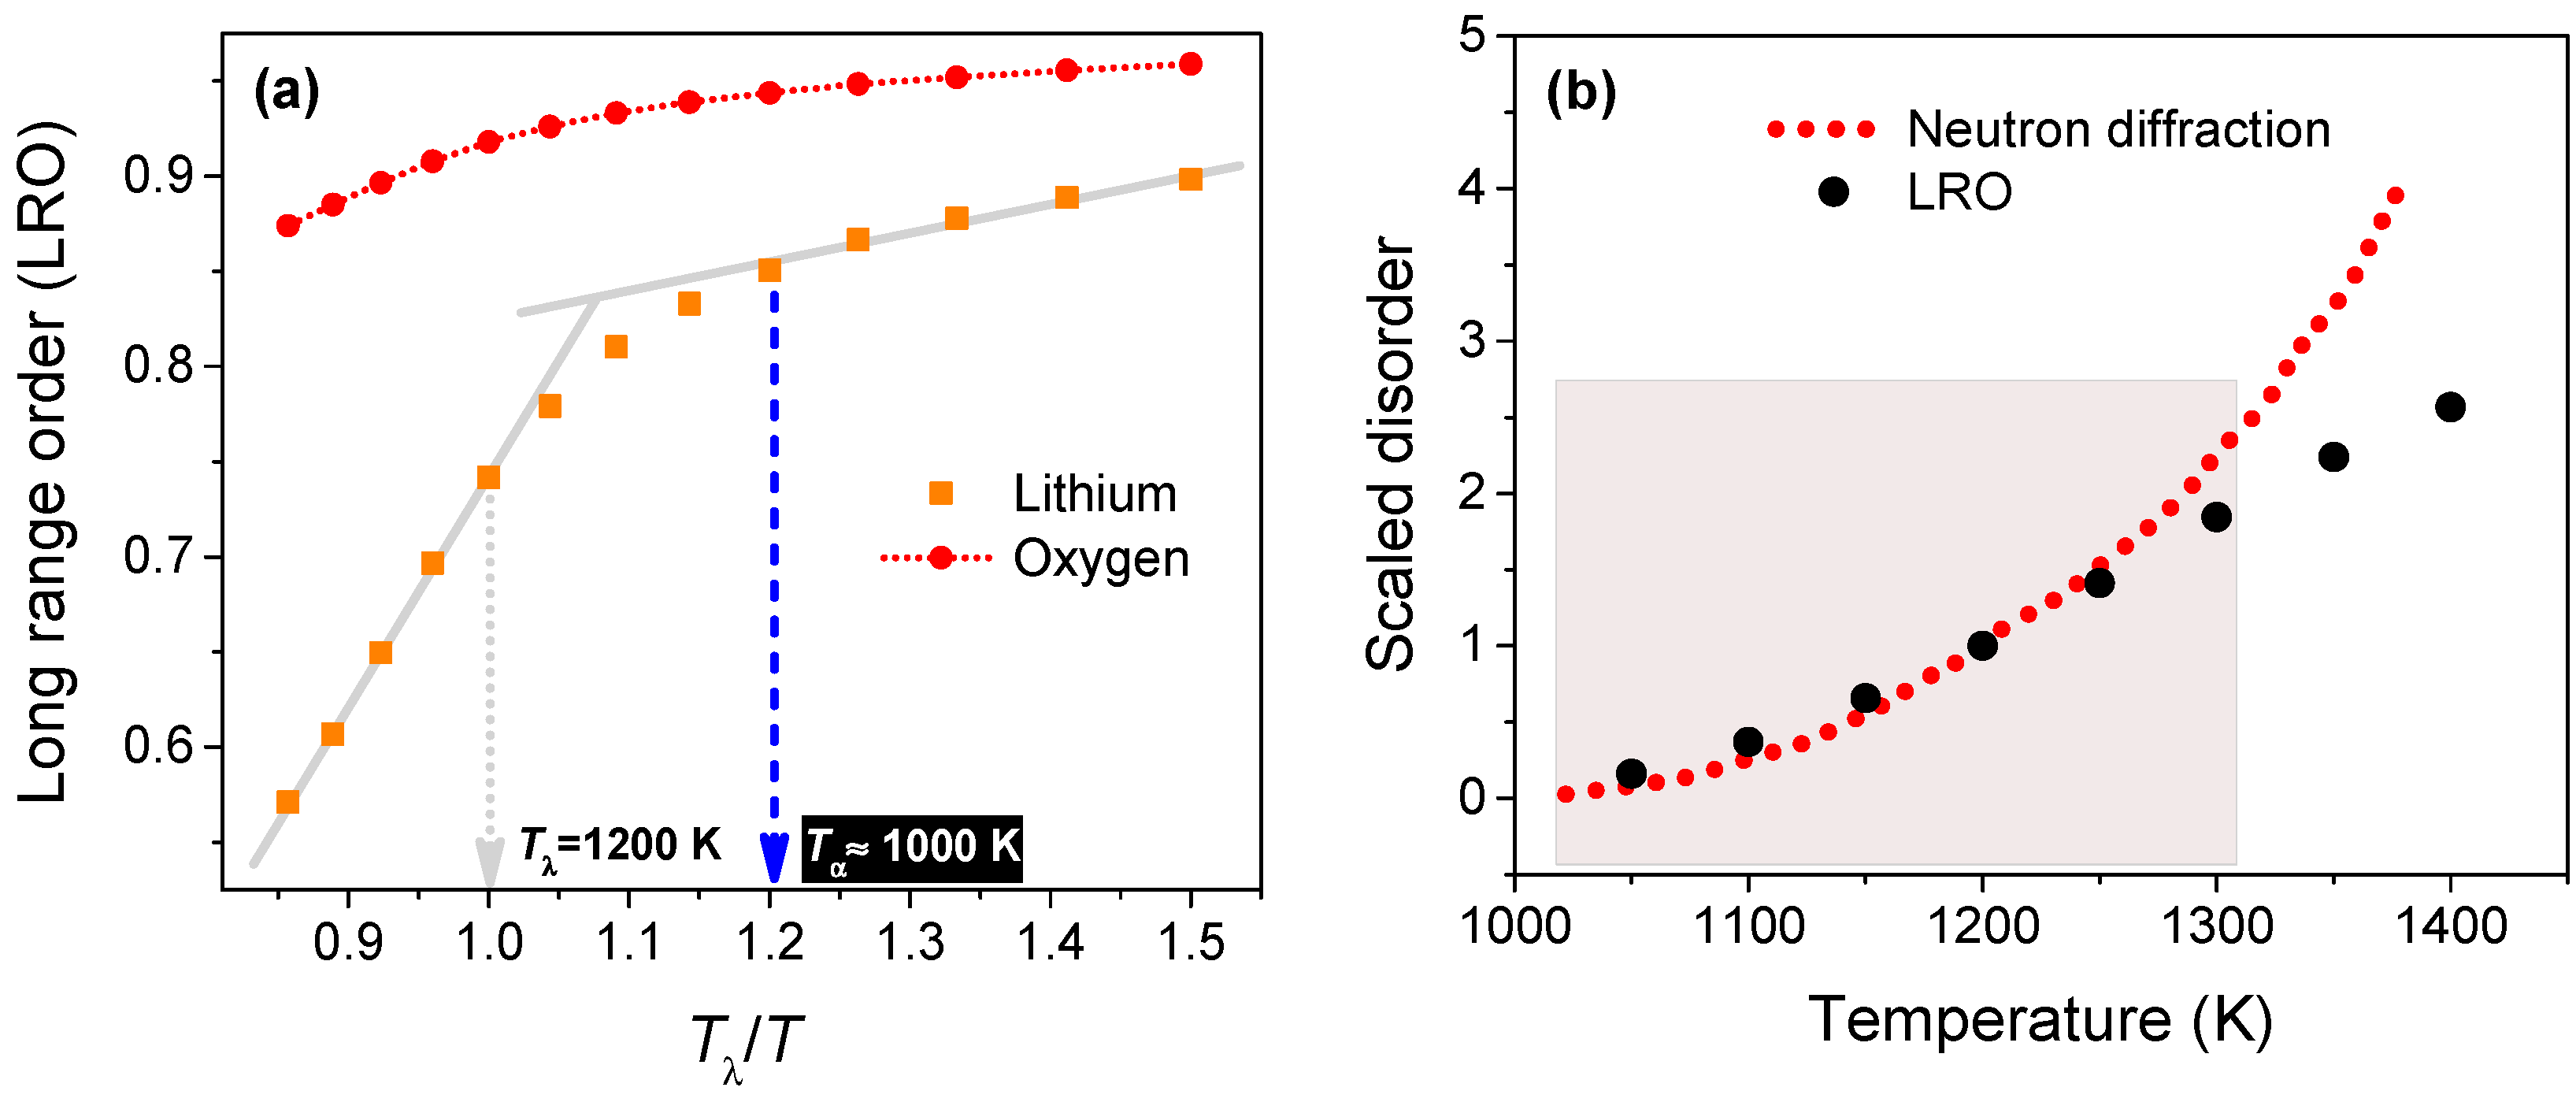
Figure 5.
(a) Normalized x-displacement of four randomly chosen lithium ions at 1200 K. Recall that the closest cation sites are separated by a/2, along the [1 0 0] direction; (b) The van Hove self-correlation function Gs(r,t) of lithium ions for a correlation time of 30 ps at a temperature of 1200 K. The Gs(r,t) peaks are nearly coincident with the nearest neighbor peaks of the partial Li radial distribution function (RDF).
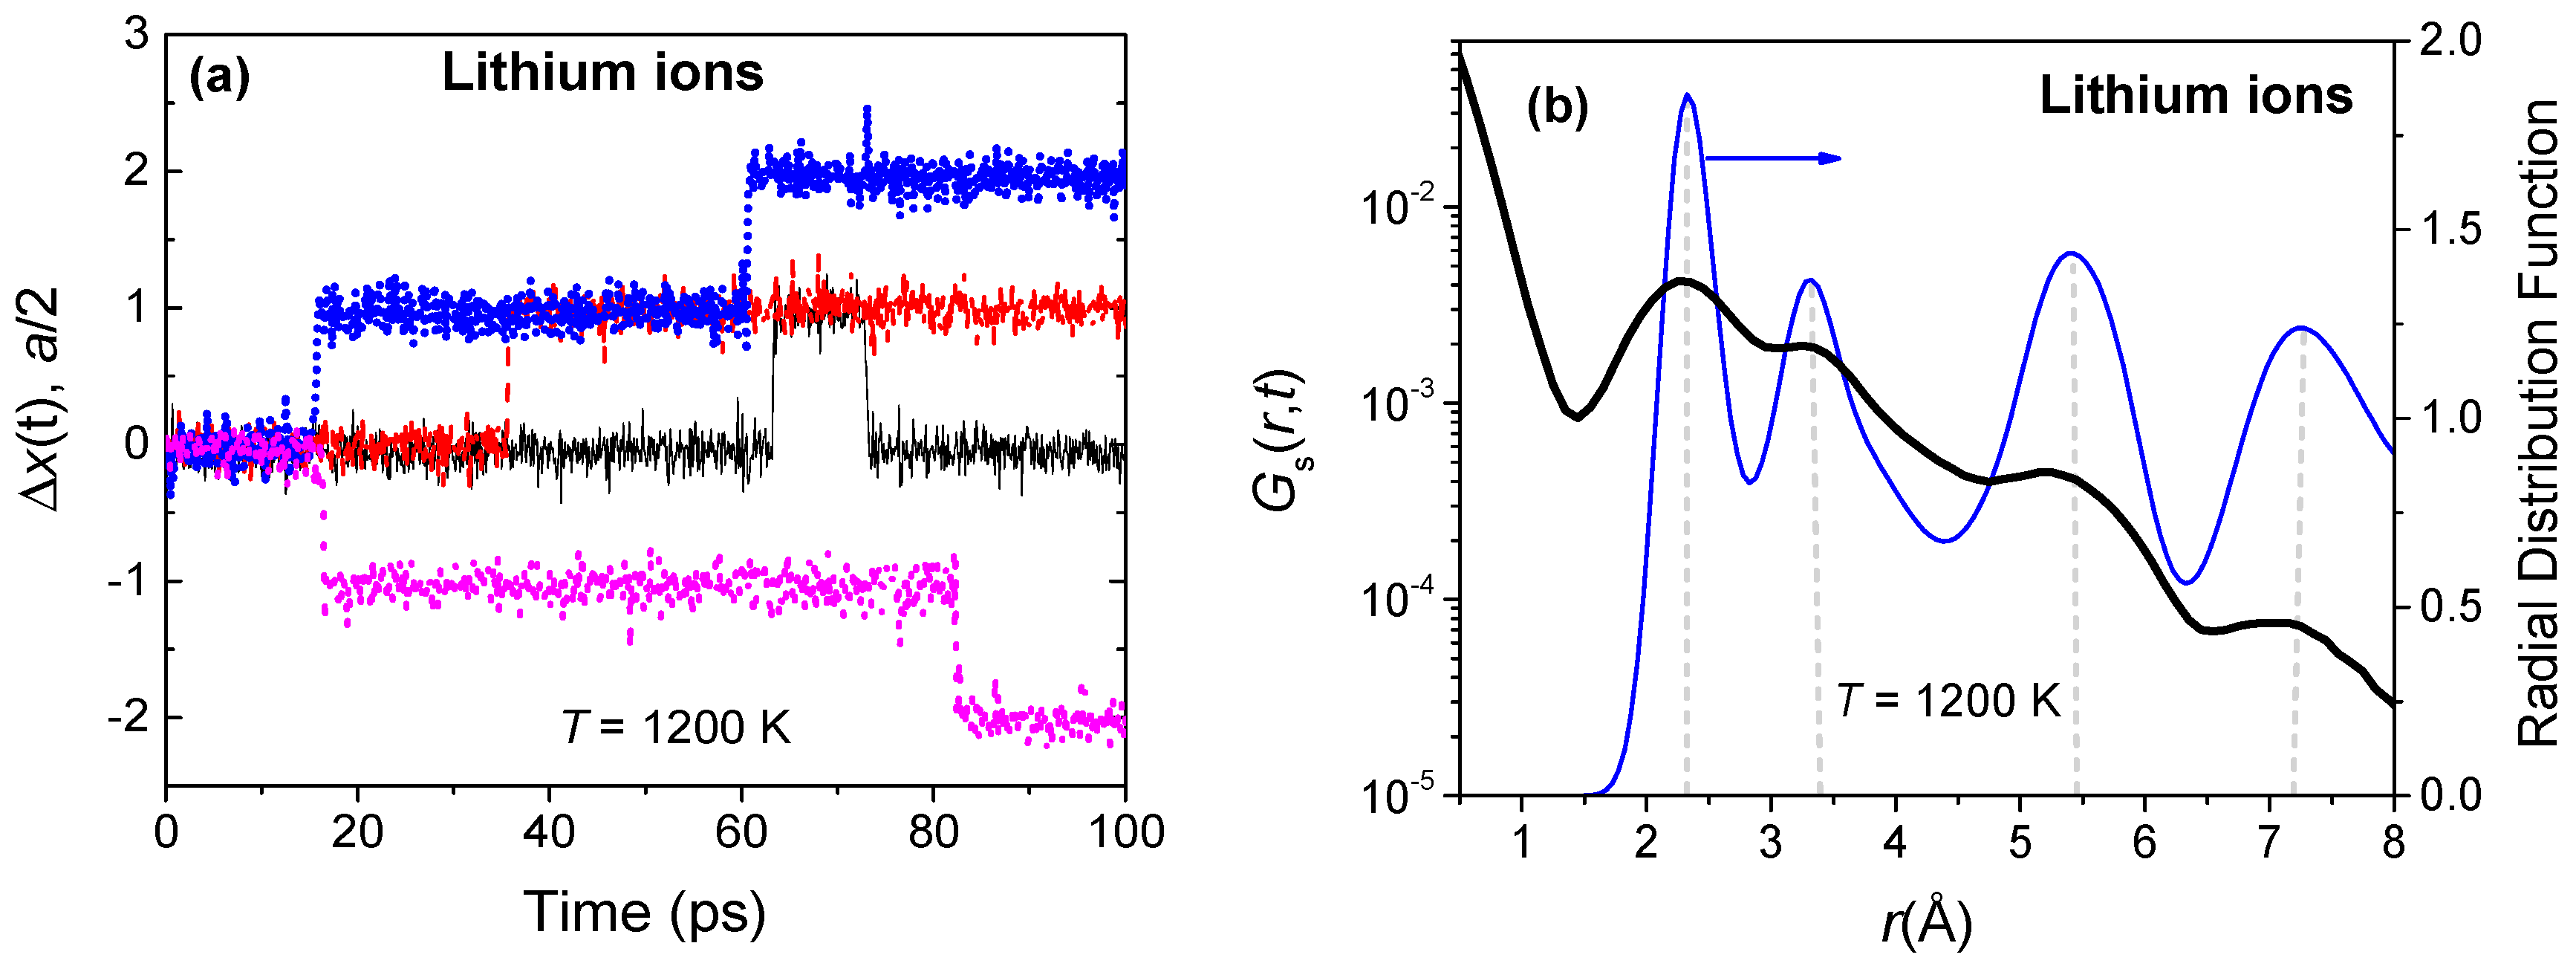
Figure 6.
(a) The evolution of string-like dynamical structures in time among the most mobile (top 5%) Li ions. The mean string length (Δ) is measured by the number of ions constituting the string; (b) The probability of finding a string of length L at different temperatures during the string lifetime τ*(T), which is defined as the time needed for establishing the longest string.

Figure 7.
(a) The fraction of ions participating in string-like dynamical structures among the most mobile (top 5%) Li ions; (b) Lifetimes corresponding to peak string length (τ*) and maximal Li ion participation (τP). While these timescales are nearly identical above Tλ (1200 K), they diverge below Tλ.

Figure 8.
Bulk and string diffusivities, scaled to the corresponding magnitudes at Tλ, for different temperatures. The inset shows the mean string displacement (δP) at peak string participation lifetime (τP).
Figure 8.
Bulk and string diffusivities, scaled to the corresponding magnitudes at Tλ, for different temperatures. The inset shows the mean string displacement (δP) at peak string participation lifetime (τP).
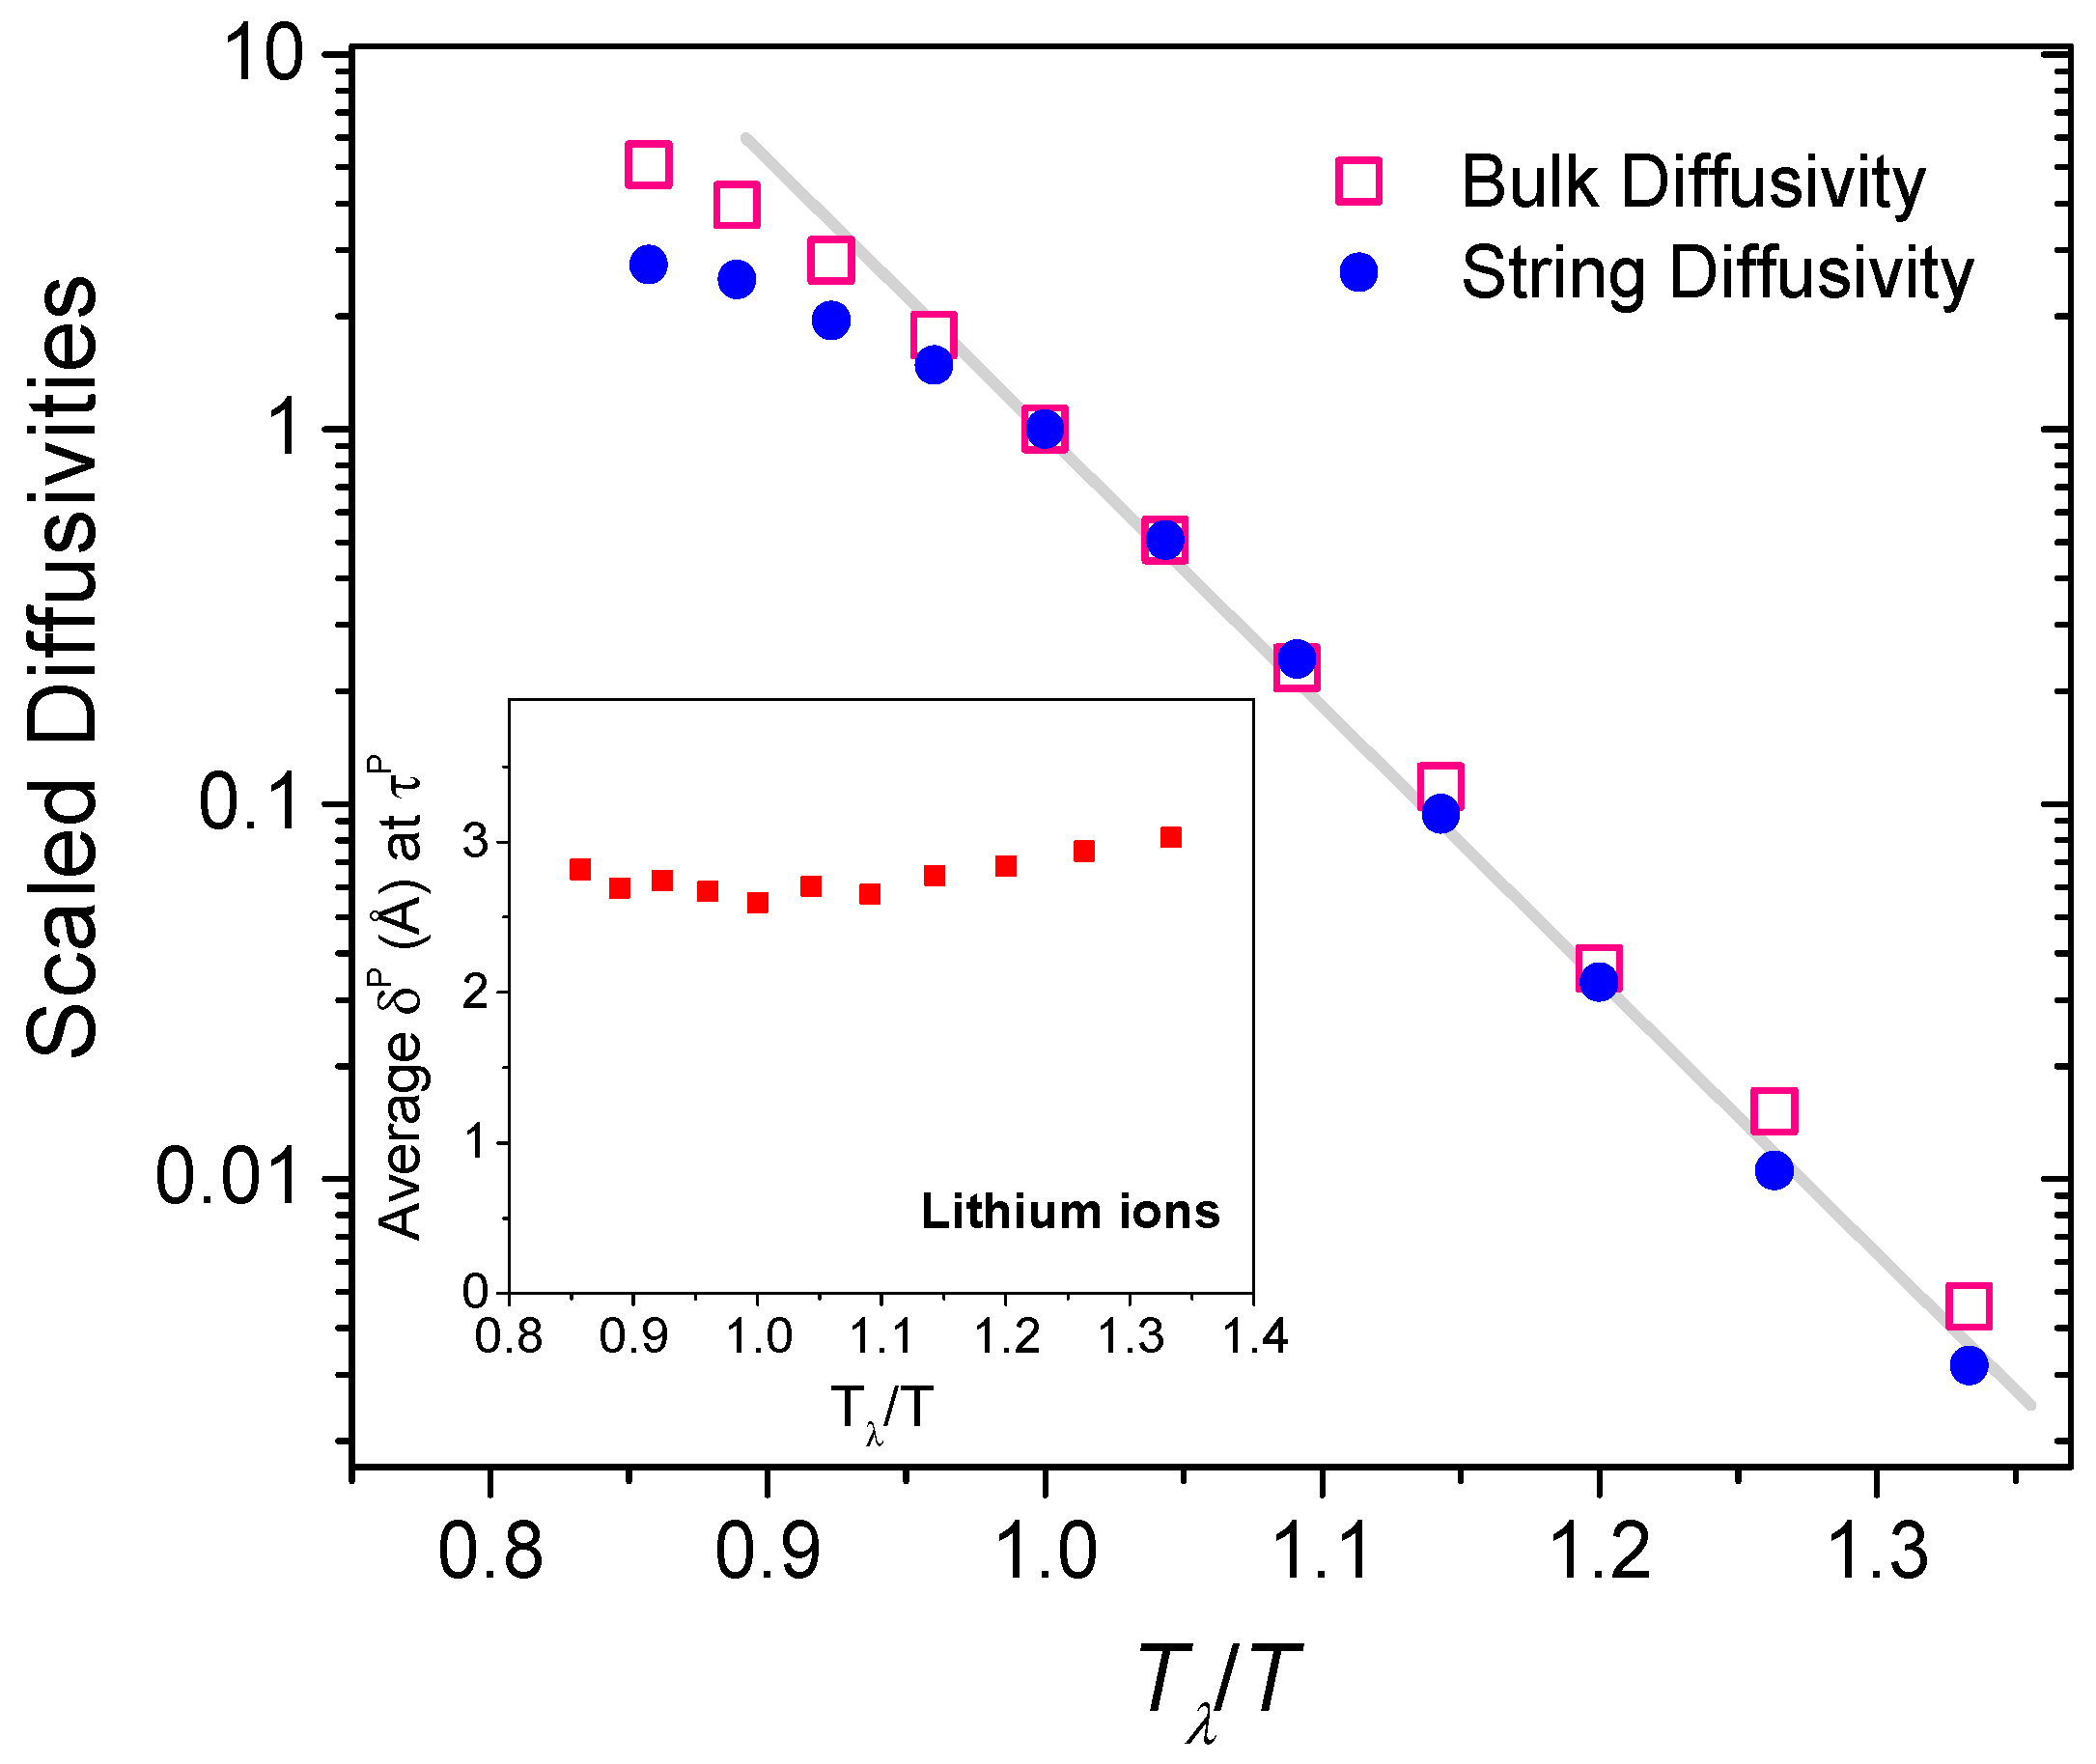
Table 1.
Comparison of transition temperatures in Li2O. Tλ and Tm refer to the λ transition temperature and the melting point, respectively, and Tα represents the disorder-onset temperature.
Table 1.
Comparison of transition temperatures in Li2O. Tλ and Tm refer to the λ transition temperature and the melting point, respectively, and Tα represents the disorder-onset temperature.
| Experiments | Atomistic (MD) Simulations | |
|---|---|---|
| Tα (K) | 1000 [2,10] | 1000 † |
| Tλ (K) | 1200 [10] | 1200 [24] |
| Tm (K) | 1711 [24] | 1715 [24] |
† Estimated from the long-range order parameter (LRO)—see Figure 4.
© 2017 by the authors. Licensee MDPI, Basel, Switzerland. This article is an open access article distributed under the terms and conditions of the Creative Commons Attribution (CC BY) license (http://creativecommons.org/licenses/by/4.0/).
Share and Cite
MDPI and ACS Style
Annamareddy, A.; Eapen, J. Ion Hopping and Constrained Li Diffusion Pathways in the Superionic State of Antifluorite Li2O. Entropy 2017, 19, 227. https://doi.org/10.3390/e19050227
AMA Style
Annamareddy A, Eapen J. Ion Hopping and Constrained Li Diffusion Pathways in the Superionic State of Antifluorite Li2O. Entropy. 2017; 19(5):227. https://doi.org/10.3390/e19050227
Chicago/Turabian StyleAnnamareddy, Ajay, and Jacob Eapen. 2017. "Ion Hopping and Constrained Li Diffusion Pathways in the Superionic State of Antifluorite Li2O" Entropy 19, no. 5: 227. https://doi.org/10.3390/e19050227
Note that from the first issue of 2016, this journal uses article numbers instead of page numbers. See further details here.