2.1. Mechanical characterization
Mechanical tests were performed on cylindrical gels (height ~ 1.9 cm; diameter 1.5 cm) at different deformation (ε
0) (3%, 6%, 9%, 12%, 15%, 18%) in order to determine the linear viscoelasticity range. We found that, regardless of the polymer concentration
Cp (= 0.5, 1.0, 2.5, 3.8, 5.0 g/100 mL, referred to as 0.5%, 1%, 2.5%, 3.8% and 5%, respectively), ε
0 = 10% fall in the linear viscoelastic region. Thus, ε
0 = 10% was selected as the constant deformation for the execution of the relaxation tests, which were aimed at the determination of gel Young modulus
E. Being
E time dependent for viscoelastic materials [
16], its evaluation needs a proper interpretation of the relaxation data. In particular, assuming that the viscoelastic properties of the system can be conveniently described by the generalized Maxwell model [
16], the dependence of the normal stress σ on time and constant deformation ε
0 is given by [
17]:
where
t is time, η
i an
Ei represent the generalized Maxwell model parameters,
N is the number of Maxwell elements considered (apart from the pure elastic element characterized by
E0) and
t1 is the time required to get the desired deformation ε
0. Obviously, when
![Molecules 14 03003 i002]()
(instantaneous compression), Equation (1) becomes:
where η
i/
Ei can be seen as the relaxation times λ
i. The Young modulus of the gel is given by the sum of the spring constants of all Maxwell elements (=
![Molecules 14 03003 i004]()
). For gel systems that are cross-linked in solution and that did not undergo further swelling/shrinking before the mechanical test, Flory’s theory [
12] establishes the following relation between the network crosslink density ρ
x and the Young modulus
E:
where
R is the universal gas constant and
T is the absolute temperature. The knowledge of the ρ
x value, together with the equivalent network theory [
13], allow the estimation of the average mesh size (ξ) of the polymeric network. Indeed, the equivalent network theory starts from the evidence that, in the majority of the situations, a detailed description of a real polymeric network is very hard [
18]. Therefore the equivalent network theory suggests to replace the real polymeric network by an idealized one, made up by a collection of spheres whose diameter coincides with the average network mesh size ξ (intended as the average distance between two consecutive network cross-links). Remembering the definition of cross-link density (moles of cross-links per hydrogel unit volume), it turns out that the volume of sphere is exactly equal to 1/(
NA ρ
x) (this is the volume competing to each cross-link):
where
NA is the Avogadro number. Solving Equation (4) for ξ leads to:
Equation (5) allows ξ estimation on the basis of ρ
x knowledge which in turn depends on the Young modulus (
E) of the hydrogel, as determinable by the mechanical measurements.
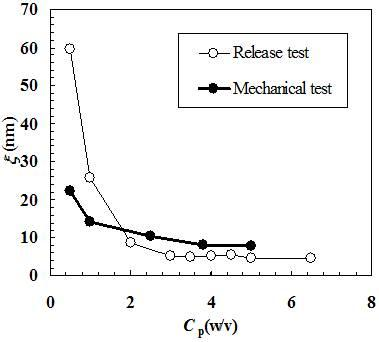
Figure 1 shows, in a bi-logarithmic diagram, that the relaxation process (normal stress σ versus time
t) progressively increases from low to high polymer concentrations. In particular, whereas for
Cp = 0.5% the relaxation process lasts about 100 s, for
Cp = 5.0% the relaxation process is approximately 100 times longer. In addition,
Figure 1 reports the good agreement between the experimental relaxation data (symbols) referring to hydrogels characterized by different polymer concentrations (0.5%, 1.0%, 2.5%, 3.8%, 5.0%) and Equation (1) best fitting (solid line).
Figure 1.
Comparison between the relaxation data (symbols) and model (Equation (1)) best fitting (solid line). σ and t represent the normal stress and time, respectively (constant deformation ε0 = 10%; t1 = 0.5 s). Different polymer concentrations are considered (0.5%, 1.0%, 2.5%, 3.8%, 5.0%).
Figure 1.
Comparison between the relaxation data (symbols) and model (Equation (1)) best fitting (solid line). σ and t represent the normal stress and time, respectively (constant deformation ε0 = 10%; t1 = 0.5 s). Different polymer concentrations are considered (0.5%, 1.0%, 2.5%, 3.8%, 5.0%).
Following a consolidate way [
16], Equation (1) fitting is carried out assuming that the relaxation times λ
i (= η
i/
Ei) are not independent each other, but they are scaled by a factor of ten (λ
i = 10* λ
i-1). Accordingly, only
E0, η
i and λ
1 represent the real fitting parameters of the model. The optimum number of Maxwell elements chosen to fit the experimental data is obtained minimizing the ratio between the sum of the squared errors and the number of the considered fitting parameters. The model fitting parameters and the derived parameters are reported in
Table 1. It is evident that, with the exception of
Cp = 2.5%, three Maxwell elements are required to satisfactory fit (see
F vales) the experimental data. The presented data also indicate that no pure elastic components (
E0 = 0) are present and that the Young modulus
E together with the crosslink density ρ
x, considerably increases with the polymer concentration. Although the
Cp = 2.5% case requires the presence of a pure elastic component, this leading to consider four Maxwell elements, its contribution to the overall mechanical behavior is very limited representing only the 3% of
E.
Table 1.
Model best fitting parameters (λ1, η1, η2, η3, E0) and derived parameters (E1, E2, E3, E, ρx, ξ) referring to relaxation data. t1 is the time required to get the desired cylindrical gel deformation (ε0 = 10%) while F indicates “F-statistic” parameter. Values are reported as mean ± standard deviation.
| Cp(w/v) | 0.5 | 1.0 | 2.5 | 3.8 | 5.0 |
| Fitting parameters |
| F(ν1, ν2, 0.95) | F(1, 181, 0.95) < 11365 | F(3, 311, 0.95) < 53299 | F(4, 676, 0.95) < 261761 | F
(3, 877, 0.95) < 907204 | F(3, 858, 0.95) < 50660 |
| t1(s) | 0.5 | 0.5 | 0.5 | 0.5 | 0.75 |
| λ1(s) | 3.3 ± 0.2 | 8.9 ± 0.1 | 15.0 ± 0.2 | 20.1 ± 0.1 | 22.5 ± 0.1 |
| η1(Pa s) | 2745 ± 207 | 16380 ± 943 | 76638 ± 1565 | 214758 ± 2724 | 303546 ± 11285 |
| η2(Pa s) | 38297 ± 1491 | 275052 ± 5603 | 853343 ± 14609 | 246630 ± 11870 | 1904260 ± 79867 |
| η3(Pa s) | 68038 ± 2693 | 2890350 ± 8136 | 1484800 ± 219043 | 49574000 ± 23398 | 65121400 ± 263613 |
| E0(Pa) | 0 | 0 | 688 ± 49 | 0 | 0 |
| Derived parameters |
| E1 = η1/λ1 | 818 ± 72 | 1835 ± 106 | 5088 ± 127 | 10677 ± 136 | 13545 ± 508 |
| E2 = η2/(10*λ1) | 1141 ± 45 | 3082 ± 63 | 5665 ± 87 | 12262 ± 59 | 8497 ± 356 |
| E3 = η2/(100*λ1) | 203 ± 8 | 3239 ± 9 | 9858 ± 145 | 24647 ± 11 | 29059 ± 117 |
| E = ΣiEi | 2162 ± 85 | 8158 ± 124 | 21294 ± 124 | 47587 ± 149 | 511902 ± 631 |
| ρx (mol cm-3) | (0.29 ± 0.01)*10-6 | (1.10± 0.01)*10-6 | (2.80± 0.03)*10-6 | (6.4 ± 0.02)*10-6 | (6.9 ± 0.1)*10-6 |
| ξ(nm) | 22.0 ± 0.3 | 14.0 ± 0.1 | 10.0 ± 0.1 | 7.9 ± 0.01 | 7.7 ± 0.03 |
| Cp(w/v) | 3.8 | 5.0 |
| Fitting parameters |
| F(ν1, ν2, 0.95) | F(3, 877, 0.95) < 907204 | F(3, 858, 0.95) < 50660 |
| t1(s) | 0.5 | 0.75 |
| λ1(s) | 20.1 ± 0.1 | 22.5 ± 0.1 |
| η1(Pa s) | 214758 ± 2724 | 303546 ± 11285 |
| η2(Pa s) | 246630 ± 11870 | 1904260 ± 79867 |
| η3(Pa s) | 49574000 ± 23398 | 65121400 ± 263613 |
| E0(Pa) | 0 | 0 |
| Derived parameters |
| E1 = η1/λ1 | 10677 ± 136 | 13545 ± 508 |
| E2 = η2/(10*λ1) | 12262 ± 59 | 8497 ± 356 |
| E3 = η2/(100*λ1) | 24647 ± 11 | 29059 ± 117 |
| E = ΣiEi | 47587 ± 149 | 511902 ± 631 |
| ρx (mol cm-3) | (6.4 ± 0.02)*10-6 | (6.9 ± 0.1)*10-6 |
| ξ(nm) | 7.9 ± 0.01 | 7.7 ± 0.03 |
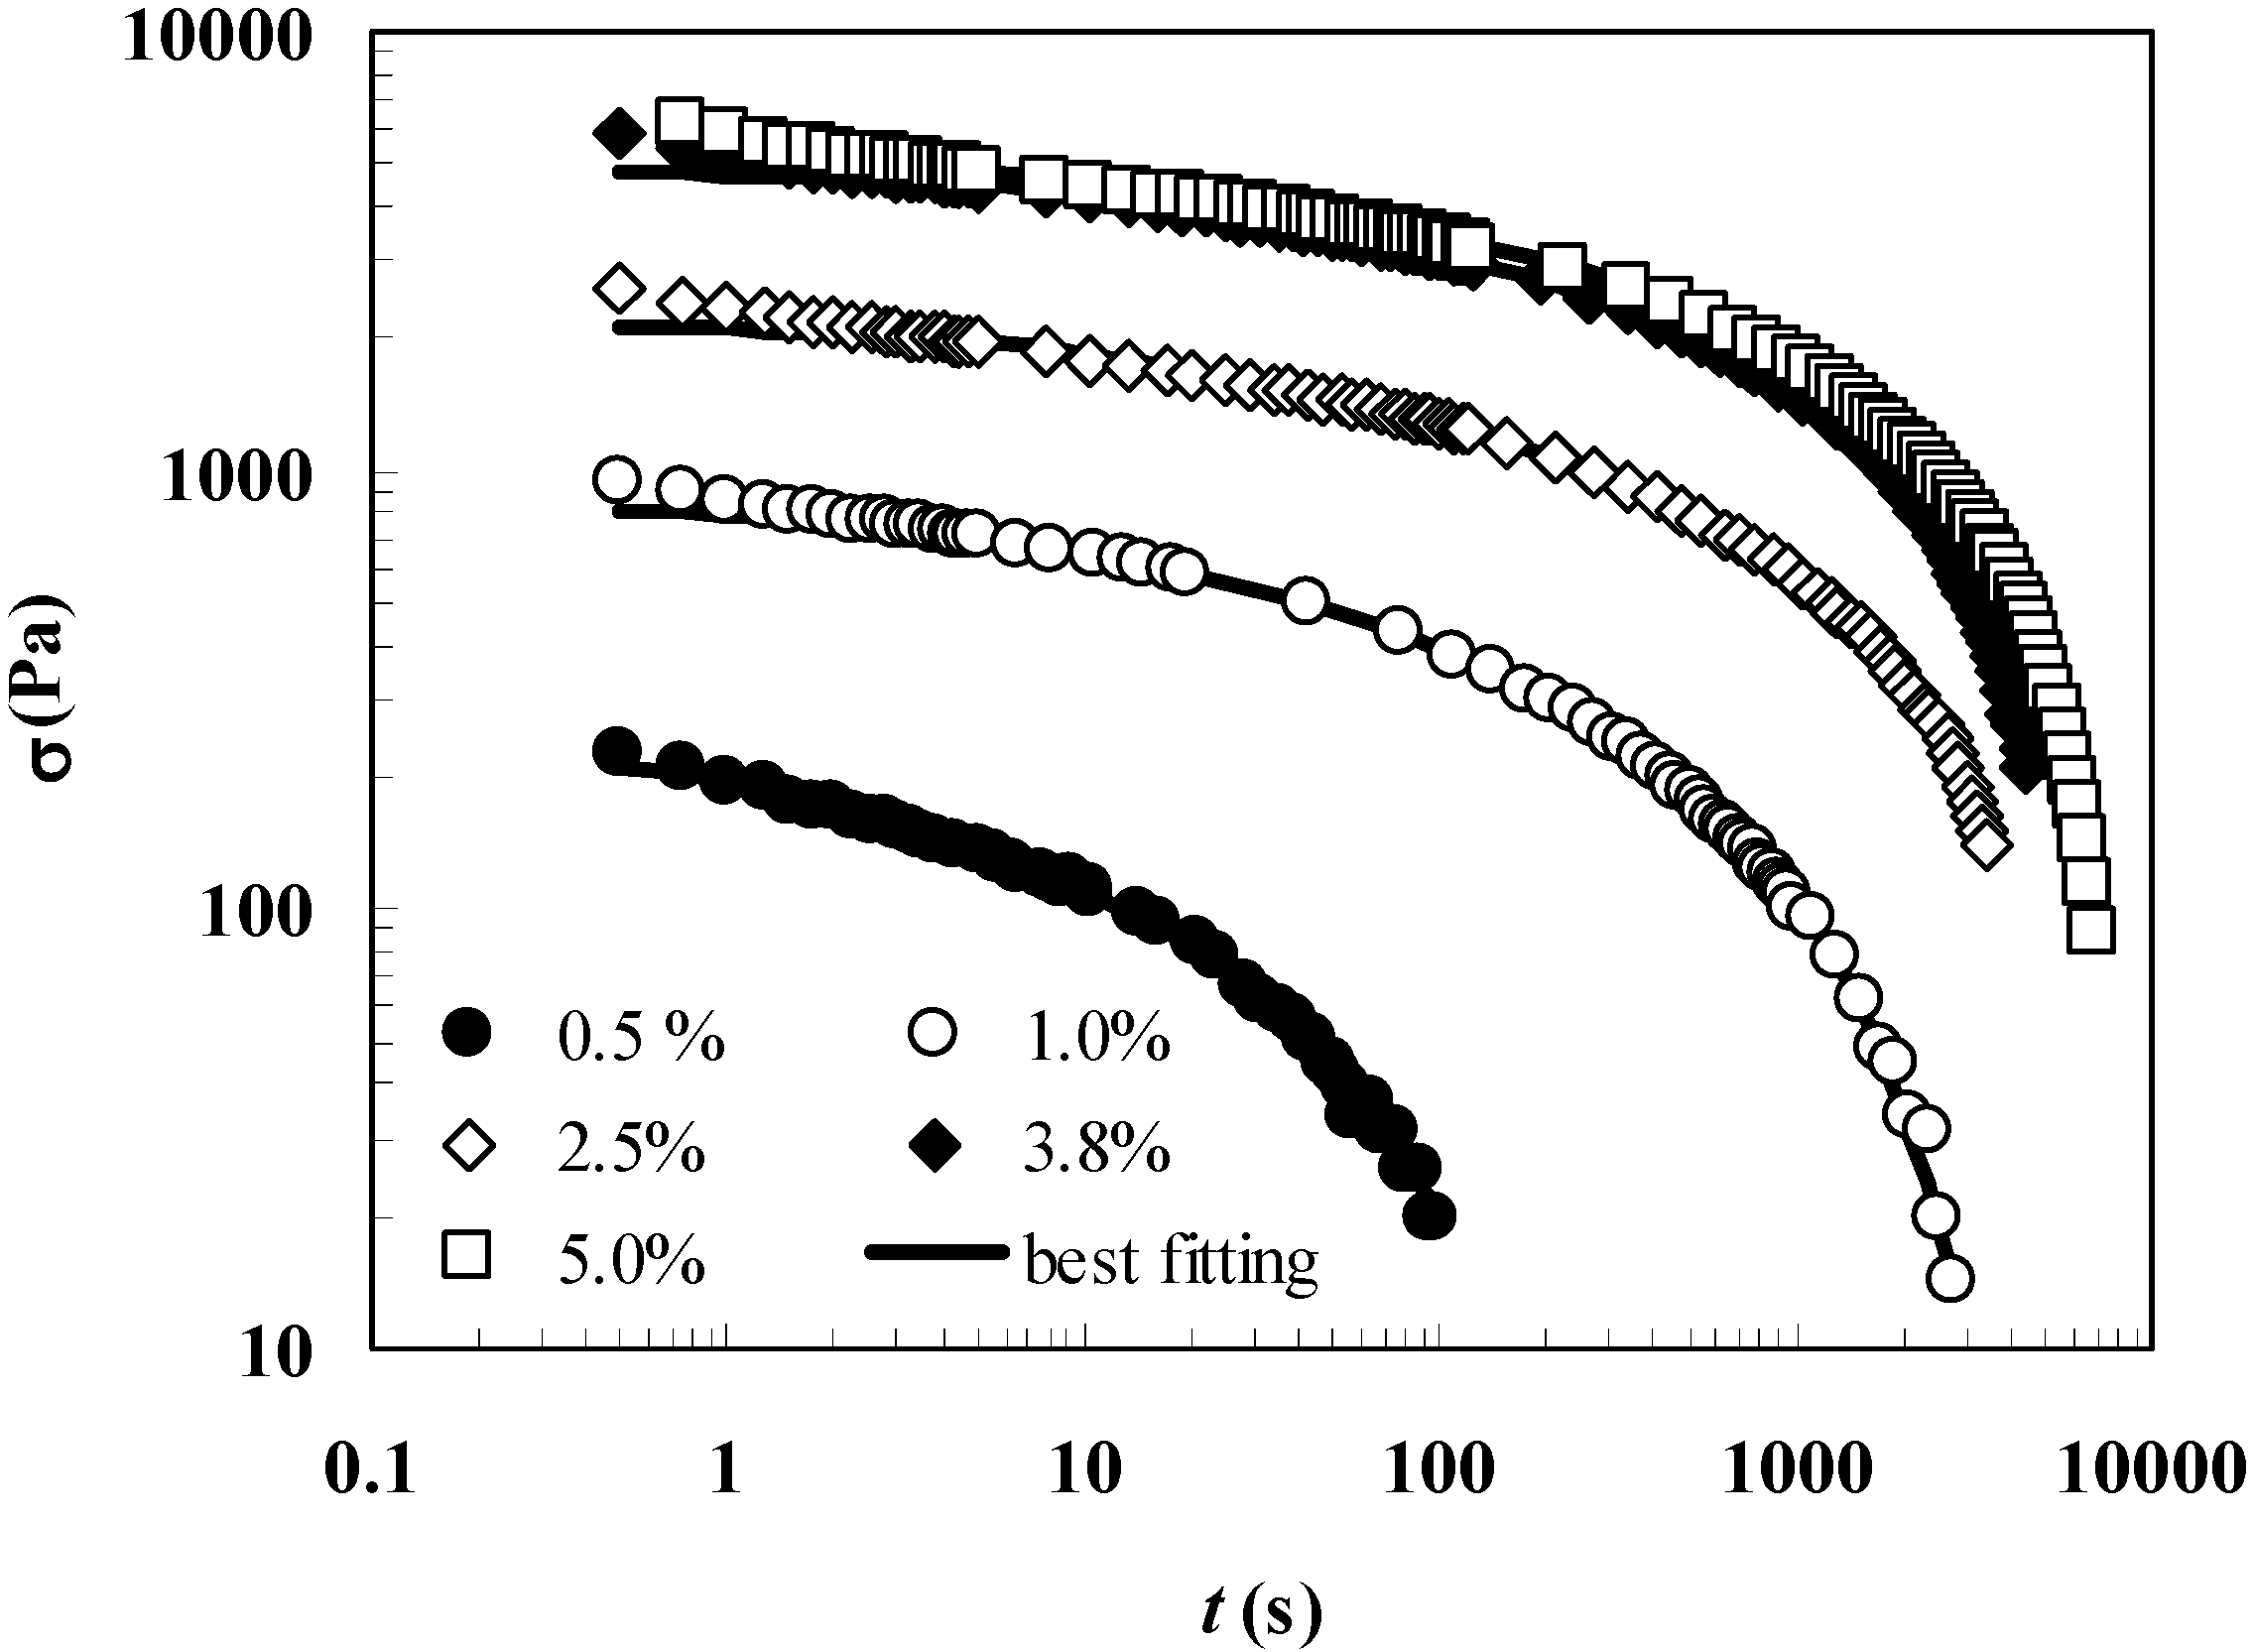
Interestingly,
Figure 2, reporting the relaxation spectra (
Ei vs λ
i) referring to the five polymer concentrations considered in this work, clearly shows that hydrogels characterized by
Cp > 0.5 show a typical solid-like behavior as the relevance (i.e. weight) of longer relaxation times is prevalent on the smaller ones. In other words, the
Ei vs λ
i curve has a positive slope. In addition, the increase of
Cp determines a rise of both
Ei and λ
1 (relaxation process becomes slower and slower). It is worth noticing that gel properties, regardless of the polymer concentration, are not significantly modified in the presence of our model drug (myoglobin; van der Waals radius 2.1 nm [
19]) up to the studied concentration (7.6 mg/cm
3).
Figure 2.
Relaxation spectra referring to
Cp = 0.5%, 1.0%, 2.5%, 3.8% and 5.0% hydrogels. This picture relies on the data shown in
Table 1.
Figure 2.
Relaxation spectra referring to
Cp = 0.5%, 1.0%, 2.5%, 3.8% and 5.0% hydrogels. This picture relies on the data shown in
Table 1.
As stated above, the mechanical characterization can also provide information about the gel nano-structure. Indeed, Equation (3) allows the estimation of the cross-link density ρ
x of the polymeric network. In turn, the equivalent network theory [
13] allows, via Equation (5), the determination of the gel average mesh size ξ.
Table 1 indicates that ξ decreases in a not linear manner, with the polymer concentration from about 22 nm (
Cp = 0.5%) to 7.7 nm (
Cp = 5.0%). In this last case, the mesh dimension is less than two times the van der Waals diameter of myoglobin (4.2 nm [
19]); this indicates that the polymeric network should exert a considerable reduction of model drug mobility.
2.2. Release characterization
The mesh size (ξ) of the polymeric network was also estimated from the drug (myoglobin) diffusion coefficient in the polymeric network (
D) and in the swelling agent (water in our case,
D0). Indeed, it is well known that the knowledge of the drug diffusion coefficient in the polymeric network (
D) and in the swelling agent (water in our case,
D0) allows an approximate estimation of the polymeric network average mesh size ξ [
14,
15]. Peppas and coworkers [
14,
15] combining the free volume theory [
20] with the assumption that the probability that a solute of radius
rs has to pass through an opening of diameter ξ is linearly dependent on the ratio 2
rs/ξ, determined the following relation between the ratios
D/
D0, 2
rs/ξ and polymer volume fraction:
where
k2 is a model parameter to be determined. Although the authors suggest that the product
k2 ![Molecules 14 03003 i010]()
can be approximately set equal to one, we preferred to estimate it from the experimental data. The real difficulty in
k2 determination comes from the fact that Peppas and co-workers did not provide a functional dependence of ξ on polymer volume fraction φ (if the function ξ(φ) were known,
k2 could be simply determined by fitting Equation (6) on experimental data of
D/
D0 vs φ). Accordingly,
k2 was determined observing that in the limit φ → 0, ξ(φ) becomes infinite,
rs/ξ(φ) becomes zero and the exponential term in Equation (6) can be transformed in the light of Taylor series development (
![Molecules 14 03003 i011]()
) as
X = (φ/(1-φ)) becomes zero:
Thus, in the limit φ → 0, we have:
Accordingly,
k2 can be determined as:
The determination of myglobin diffusion coefficient inside the gel network can be performed recurring to a mathematical model based on the Fick law of diffusion. Due to gel symmetry, the intrinsically three dimensional diffusive problem could be reduced to a simpler two dimensional one:
where
D is the drug diffusion coefficient in the gel,
t is time,
C is the drug concentration (mass/volume) in the cylinder,
R and
Z are the radial and axial axes, respectively. This equation must satisfy the following initial and boundary conditions:
Boundary conditions
where 2
Zc and
Rc are, respectively, cylinder height and radius,
C0 is the initial drug concentration in the cylinder,
Cr and
Vr are the drug concentration and the volume of the release medium while
kp is the drug partition coefficient between the cylindrical gel and the environmental release fluid. Equations (11)–(12) state, respectively, that the gel is uniformly loaded with a drug at
C0 concentration, while the release environment is initially drug free. Equation (13) expresses the partitioning condition at the cylinder/release fluid interface, while Equation (14) is a drug mass balance for the gel/release fluid system allowing to state the relation between
Cr and
C(
Z,
R, t).
From the experimental point of view, myoglobin release was studied considering cylindrical gels (height = 1.9 cm; diameter = 1.5 cm) characterized by different polymer concentration
Cp (= 0.5, 1.0, 2.0, 3.0, 3.5, 4.0, 4.5, 5.0 and 6.5%). Although our gels did not undergo further swelling during the release tests (no dimensional increases were observed), they showed an erosion whose magnitude was proportional to the time but almost independent from the polymer concentration (after 8 hours, about 15% of the whole polymeric content was found in the release environment). As gel shape and dimensions were not modified during the whole release period (8 hours), we concluded that gel erosion was not superficial but “bulk” and thus drug release was always imputable to a diffusive mechanism. On the contrary, the observed erosion should, in principle, increase myoglobin mobility inside the gel and, at the same time, improve the resistance effect exerted by the hydrodynamic boundary layer surrounding the gel matrix. Indeed, the presence of a sustaining net (to suspend the gel in the release environment) enveloping the gel matrix should favor the polymer entrapment and residence at the gel release environment interface. In order to account for this complex situation in a simple manner, we supposed that myoglobin diffusion coefficient was time dependent according to:
where
D0 is the value of the myoglobin diffusion coefficient at the beginning (time
t = 0; i.e when the gel is unaffected by erosion) while
k,
A and
n are fitting parameters. This equation states that
D modifies with time according to a stretched exponential law. Thus, the entire mathematical model is represented by Equations (10)–(15) and Equation (15) was introduced for the
D0 estimation.
D0 value, independent on the erosion effect, was used to estimate the network mesh size by Equation (6). In order to reduce model fitting parameters to 3 (
D0,
k,
A), the partition coefficient
kp was set equal to 1 and
n was set equal to 6 (this corresponds to a sharp
D variation from
D0 to
D(
t = ∞)). The numerical solution of the model was performed according to the control volume method [
21]. This approach is based on the subdivision of the calculation domain into a number of non-overlapping control volumes (rings, in our 2D frame) where Equation (10) is integrated assuming uniform model drug concentration in each control volume. In order to ensure the reliability of the numerical solution, the domain was subdivided into 100 control volumes in the radial and axial direction (for a total of 10
4 control volumes) and the integration time step was set equal to 22.5 s.
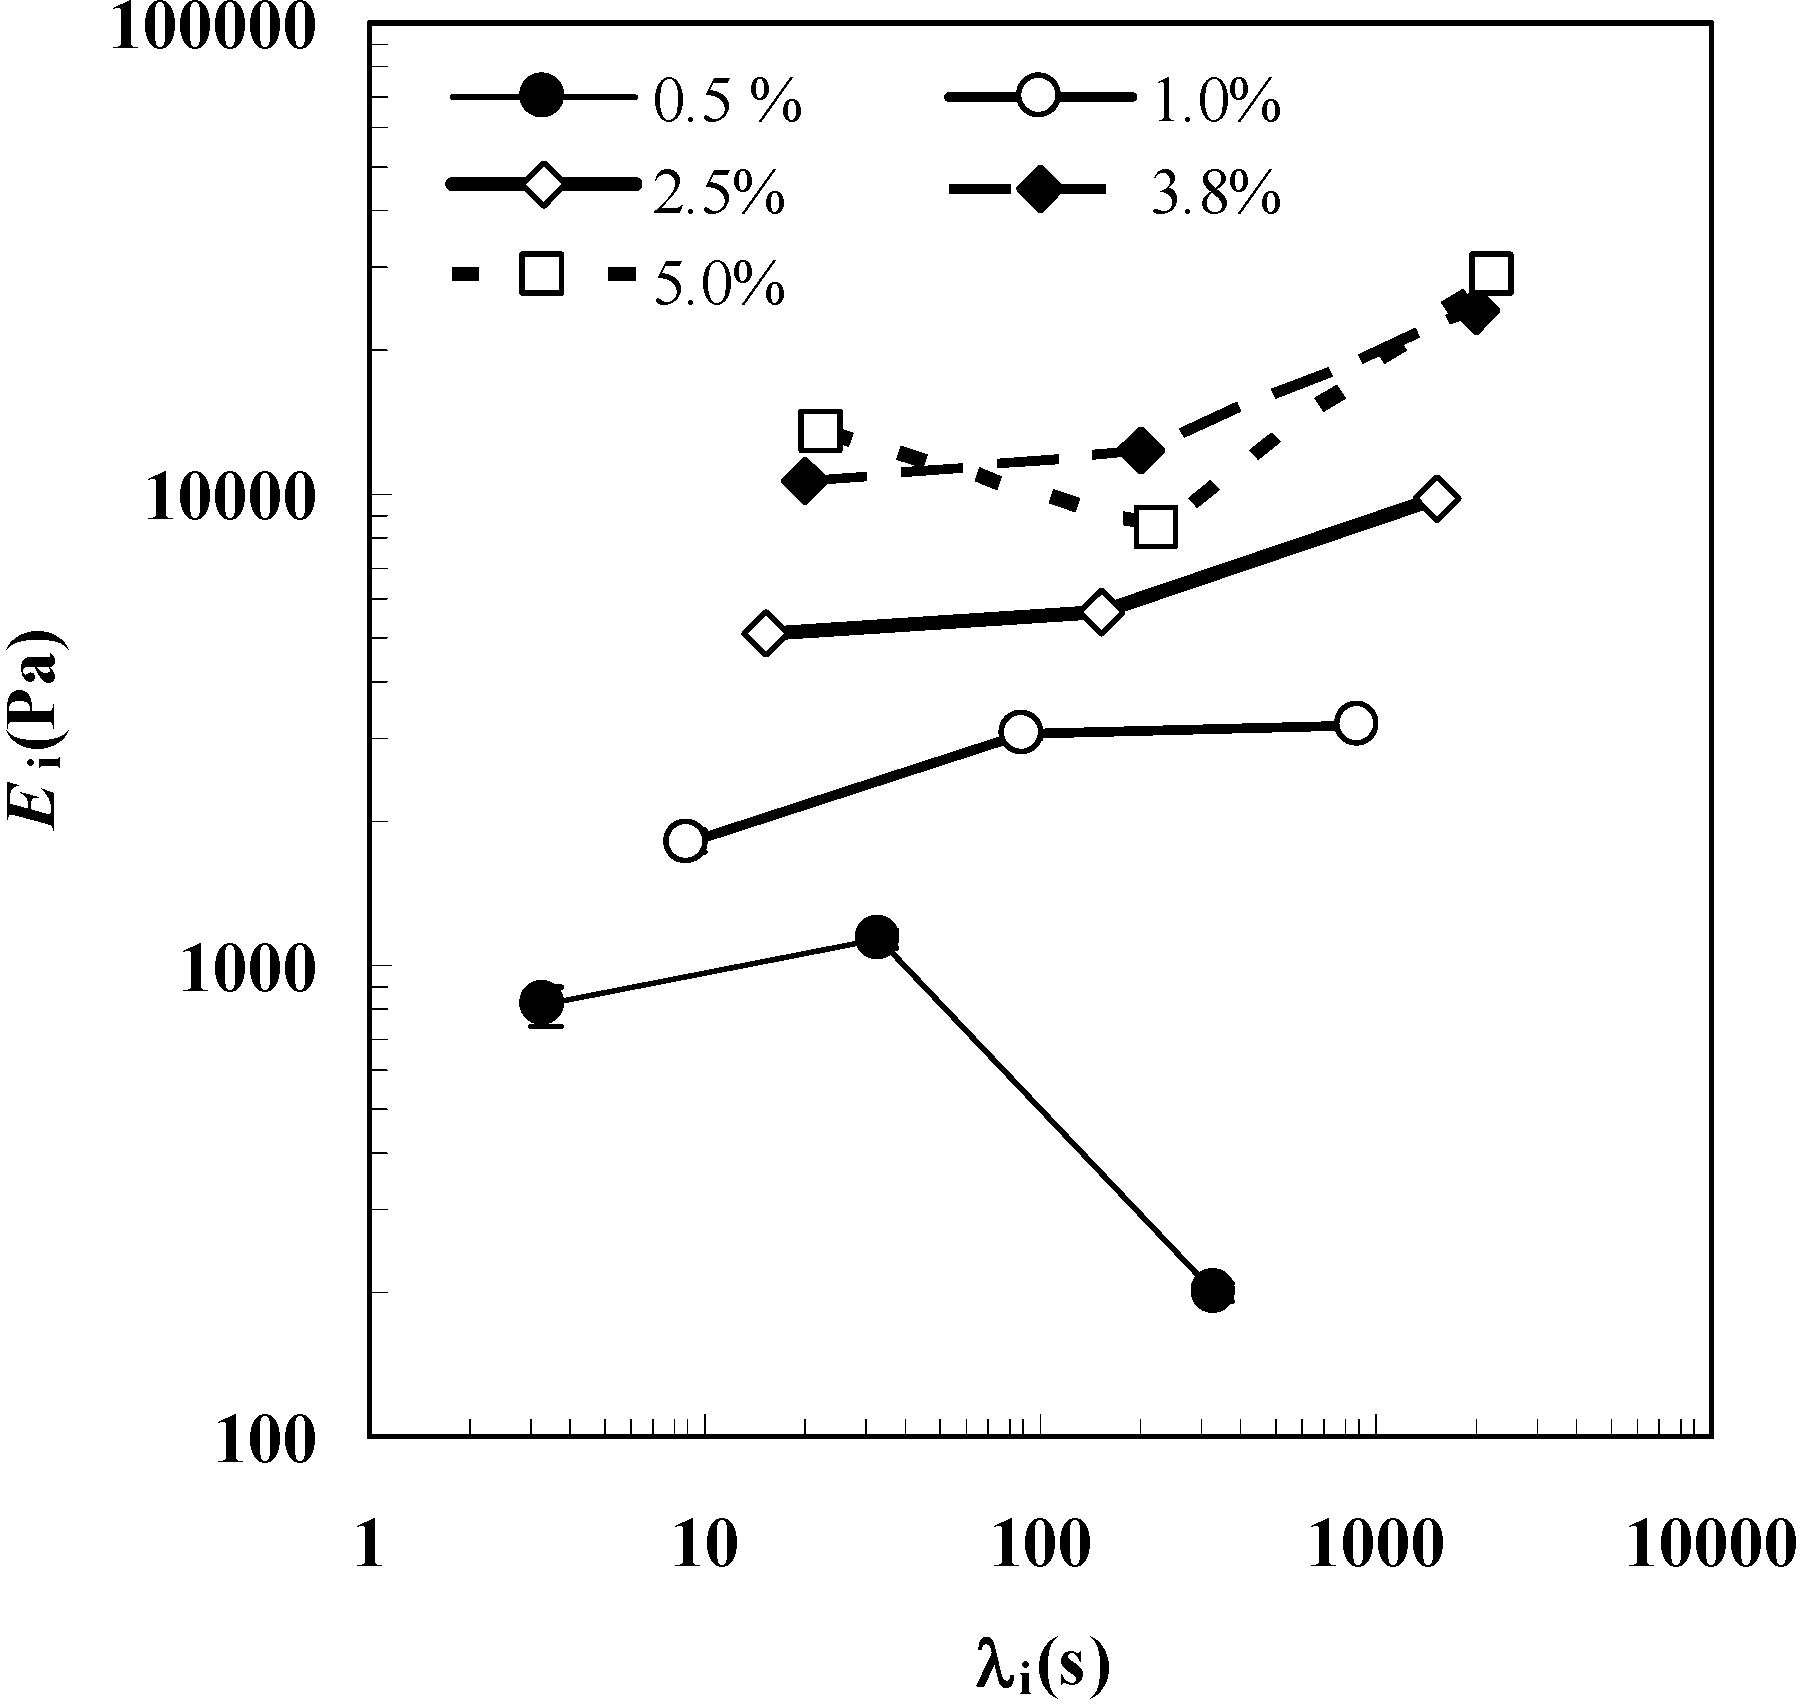
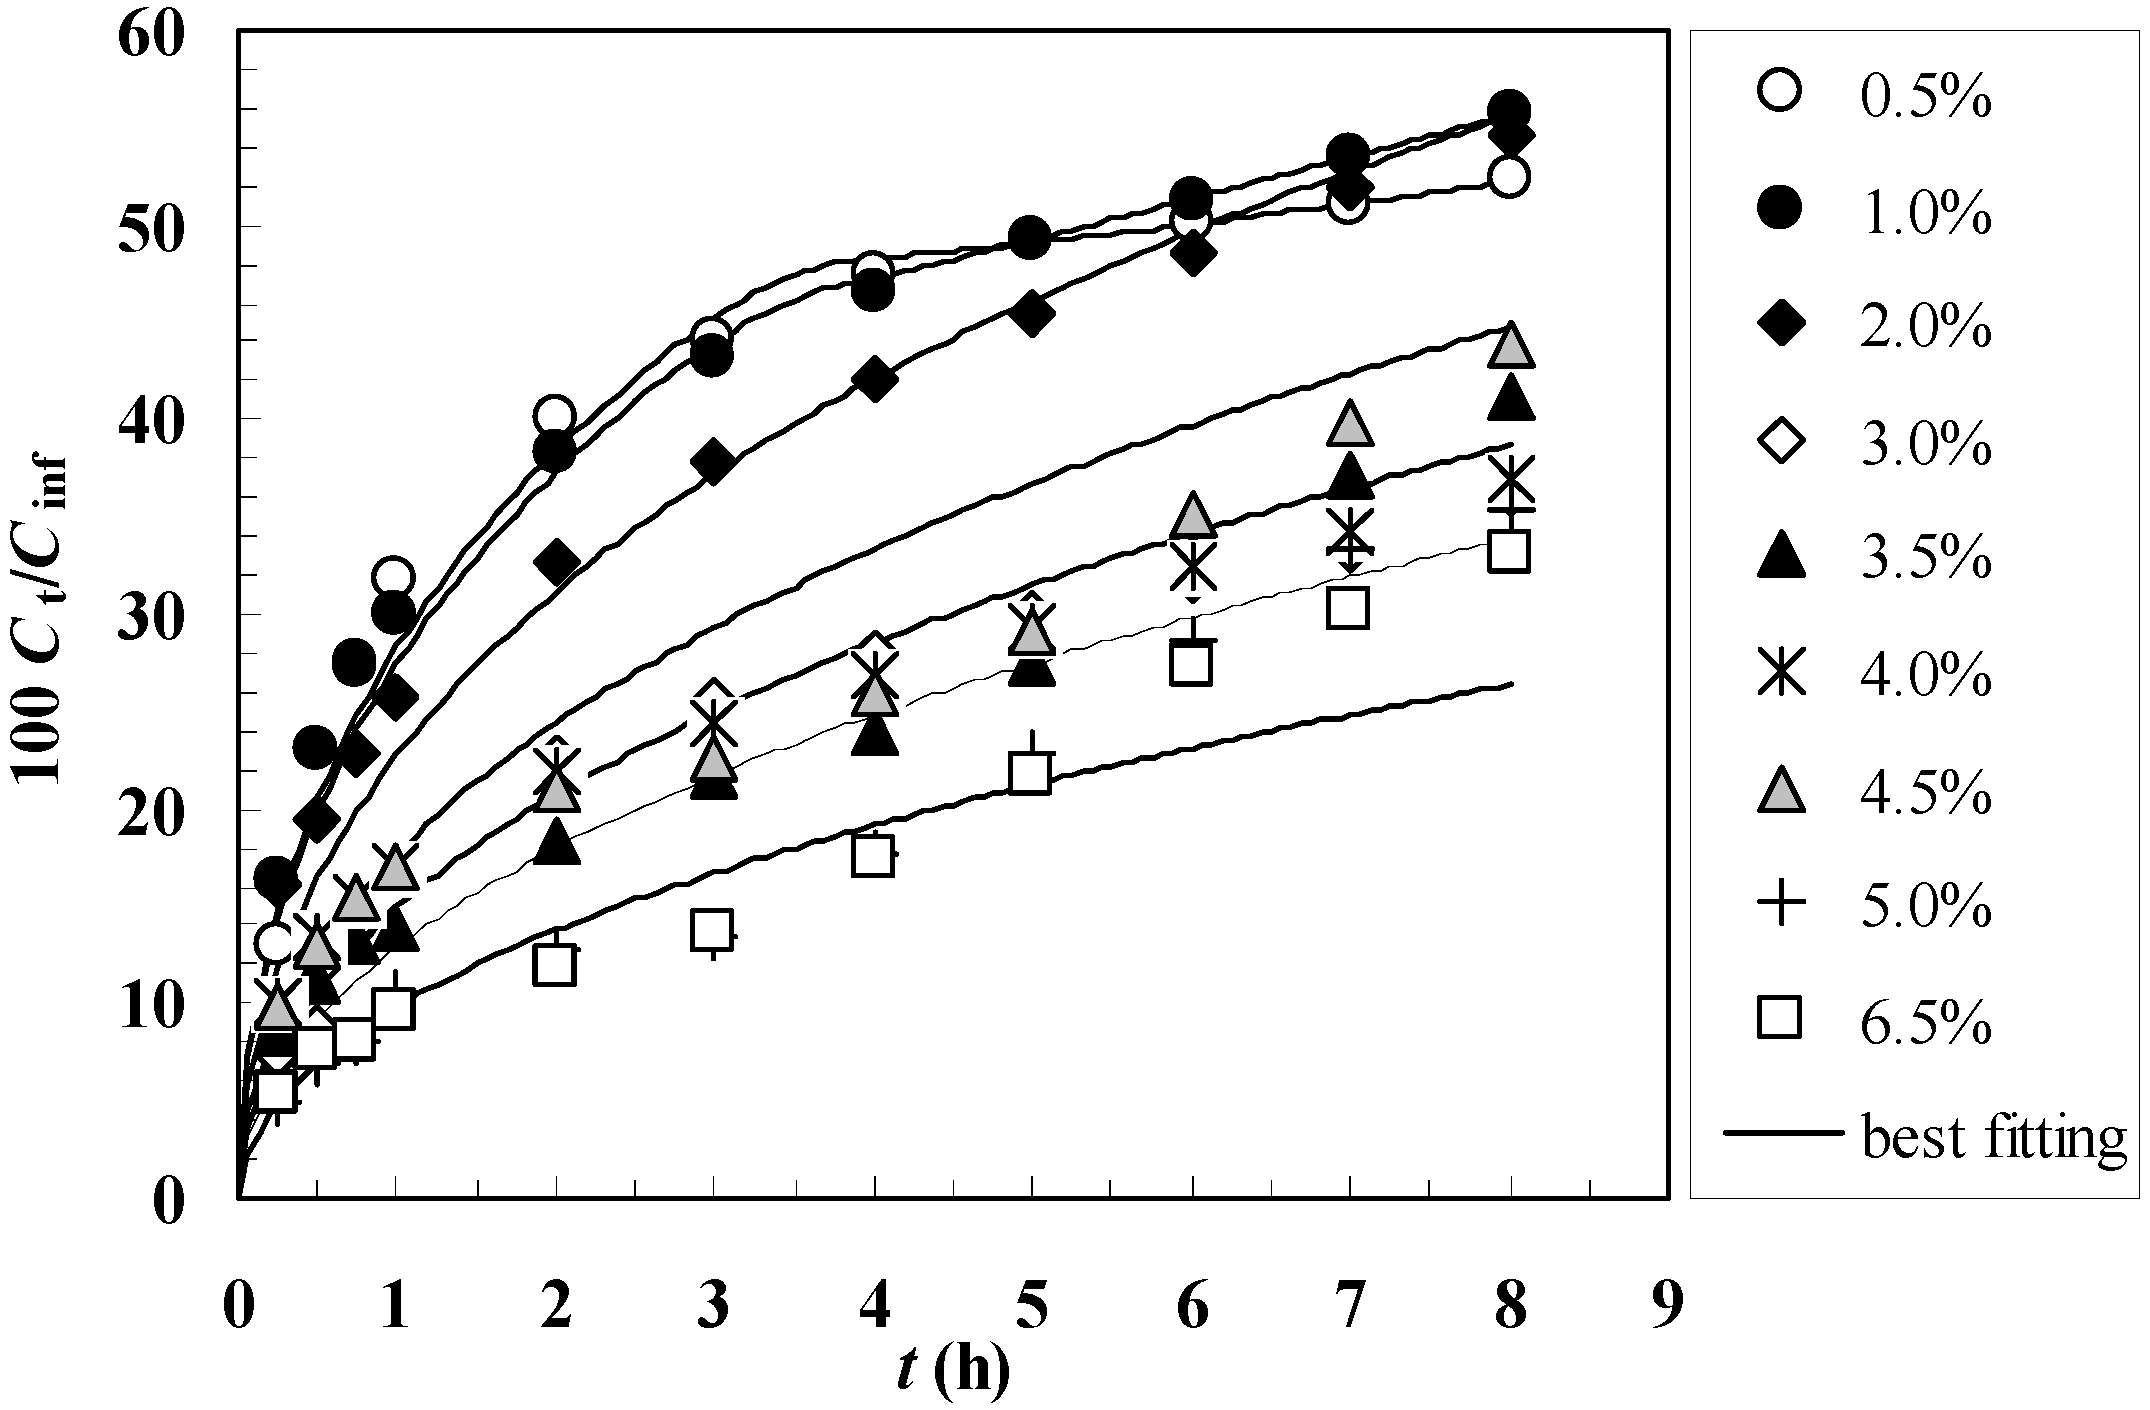
Figure 3 shows the comparison between the model best fitting (solid line) and the experimental release data (symbols) referring to gels characterized by different polymer concentrations
Cp. It can be seen that the agreement between the experimental data and the model best fitting is satisfactory, as also witnessed by the
F statistic values reported in
Table 2. Limited to the
Cp = 0.5 and 1.0% cases, it is necessary to adopt the time dependent diffusion coefficient defined by Equation (15). In all the other situations, the statistic indicates that the use of Equation (15) is unnecessary so that the model fitting parameters reduce to
D0 =
D. This means that for
Cp > 1, in the light of the “high” polymer concentration, the effect of the boundary layer and the reduction of gel network connectivity do not sensibly affect the average mobility of myoglobin (and, thus, its release rate). On the contrary, for lower polymer concentrations, this effect becomes important. Indeed, as the extent and nature (presence of eroded polymer) of the boundary layer mainly depends on the conditions of the hydrodynamic environment and on the net presence (conditions equal for all our gels), it seems reasonable that the combined effect of bulk erosion and boundary layer build up is more evident for lower polymer concentrations. The fact that for
Cp = 0.5 and 1.0% the model fitting leads to a decrease of
D (
k > 0 in Equation (15)), indicates that the permeability of the boundary layer to myoglobin reduces with time; this could imply a boundary layer thickness increase and/or the increase of eroded polymer concentration in it. The model best fitting reveals that the increase of
Cp from 0.5% to 6.5% results in a decrease of the myoglobin diffusion coefficient of about one order of magnitude (see
Table 2).
Figure 3.
Comparison between model best fitting (solid line) and experimental release data (symbols) referring to gels characterized by different polymer concentrations Cp (0.5% - 6.5%). Ct and Cinf indicate the drug concentration in the release environment after time t and after a very long time (infinite), respectively.
Table 2.
Model best fitting parameters (
D0,
k,
A) and derived parameters (ξ,
D0/
D0,
k2) referred to the release data.
D0 is the diffusion coefficient of myoglobin in water (37°C) [
11],
n (= 6) is Equation (15) exponent while
F indicates “
F-statistic” parameter. Values are reported as mean ± standard deviation.
Table 2.
Model best fitting parameters (D0, k, A) and derived parameters (ξ, D0/D0, k2) referred to the release data. D0 is the diffusion coefficient of myoglobin in water (37°C) [11], n (= 6) is Equation (15) exponent while F indicates “F-statistic” parameter. Values are reported as mean ± standard deviation.
| Cp(w/v) | 0.5 | 1.0 | 2.0 |
| F(ν1, ν2, 0.95) | F(2, 10, 0.95) < 324 | F(2, 10, 0.95) < 664 | F(1, 10, 0.95) < 305 |
| D0(cm2/s) | (1.5 ± 0.1)*10-6 | (1.4 ± 0.05)*10-6 | (0.94 ± 0.04)*10-6 |
| k(s-6) | (6 ± 3)*10-25 | (6 ± 2)*10-25 | - |
| A(-) | (8 ± 3)*10-3 | (27 ± 3)*10-3 | - |
| k2(nm-2) | 2.96 ± 0.22 | 2.96 ± 0.22 | 2.96 ± 0.22 |
| 100*D0/D0(-) | 96 ± 6.5 | 90 ± 3 | 60 ± 2 |
| ξ(nm) | 59 ± 53 | 25.7 ± 4.4 | 8.7 ± 0.4 |
| Cp(w/v) | 3.0 | 3.5 | 4.0 |
| F(ν1, ν2, 0.95) | F(1, 10, 0.95) < 1013 | F(2, 10, 0.95) < 191 | F(1, 10, 0.95) < 305 |
| D0(cm2/s) | (0.38 ± 0.10)*10-6 | (0.28 ± 0.05)*10-6 | (0.38 ± 0.03)*10-6 |
| k(s-6) | - | - | - |
| A(-) | - | - | - |
| k2(nm-2) | 2.96 ± 0.22 | 2.96 ± 0.22 | 2.96 ± 0.22 |
| 100*D0/D0(-) | 24 ± 1 | 18.0 ± 0.3 | 24 ± 2 |
| ξ(nm) | 5.20 ± 0.04 | 4.90 ± 0.02 | 5.1 ± 0.1 |
| Cp(w/v) | 4.5 | 5.0 | 6.5 |
| F(ν1, ν2, 0.95) | F(1, 10, 0.95) < 51.5 | F(1, 10, 0.95) < 155 | F(1, 10, 0.95) < 87 |
| D0(cm2/s) | (0.55 ± 0.04)*10-6 | (0.16 ± 0.006)*10-6 | (0.22 ± 0.02)*10-6 |
| k(s-6) | - | - | - |
| A(-) | - | - | - |
| k2(nm-2) | 2.96 ± 0.22 | 2.96 ± 0.22 | 2.96 ± 0.22 |
| 100*D0/D0(-) | 35 ± 3 | 10 ± 0.4 | 14 ± 1.2 |
| ξ(nm) | 5.6 ± 0.2 | 4.5 ± 0.01 | 4.6 ± 0.04 |
Remembering that the following relation between polymer concentration
Cp and polymer volume fractions φ holds:
where ρ
p is polymer density (1.8 g/cm
3 [
22]), it is possible estimating the dependence of myoglobin diffusion coefficient on j. This, in turn, allows the estimation of
k2 (see Equation (6)) according to Equation (9):
On the basis of this result, Equation (6) can be used to estimate the average mesh size of the polymeric network and its standard deviation σ
ξ (calculated according to the error propagation law):
where
![Molecules 14 03003 i022]()
and
![Molecules 14 03003 i023]()
are, respectively, the standard deviation of the
D0/
D0 ratio and of
k2 (see
Table 2).
Table 2 shows that ξ reduces with
Cp in a non-linear manner and that its standard deviation is considerably high for
Cp = 0.5%. This underlines the criticality of ξ determination for very low values of polymer volume fraction. In this regards it is worth mentioning that the most important contribute to
![Molecules 14 03003 i024]()
is given by the uncertainty related to the estimation of
D0/
D0, i.e.
![Molecules 14 03003 i022]()
.
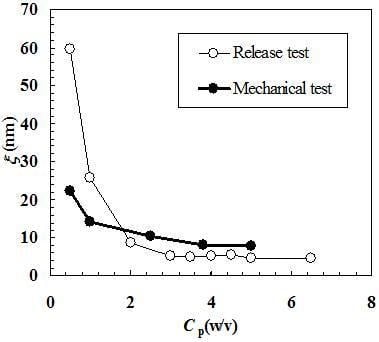
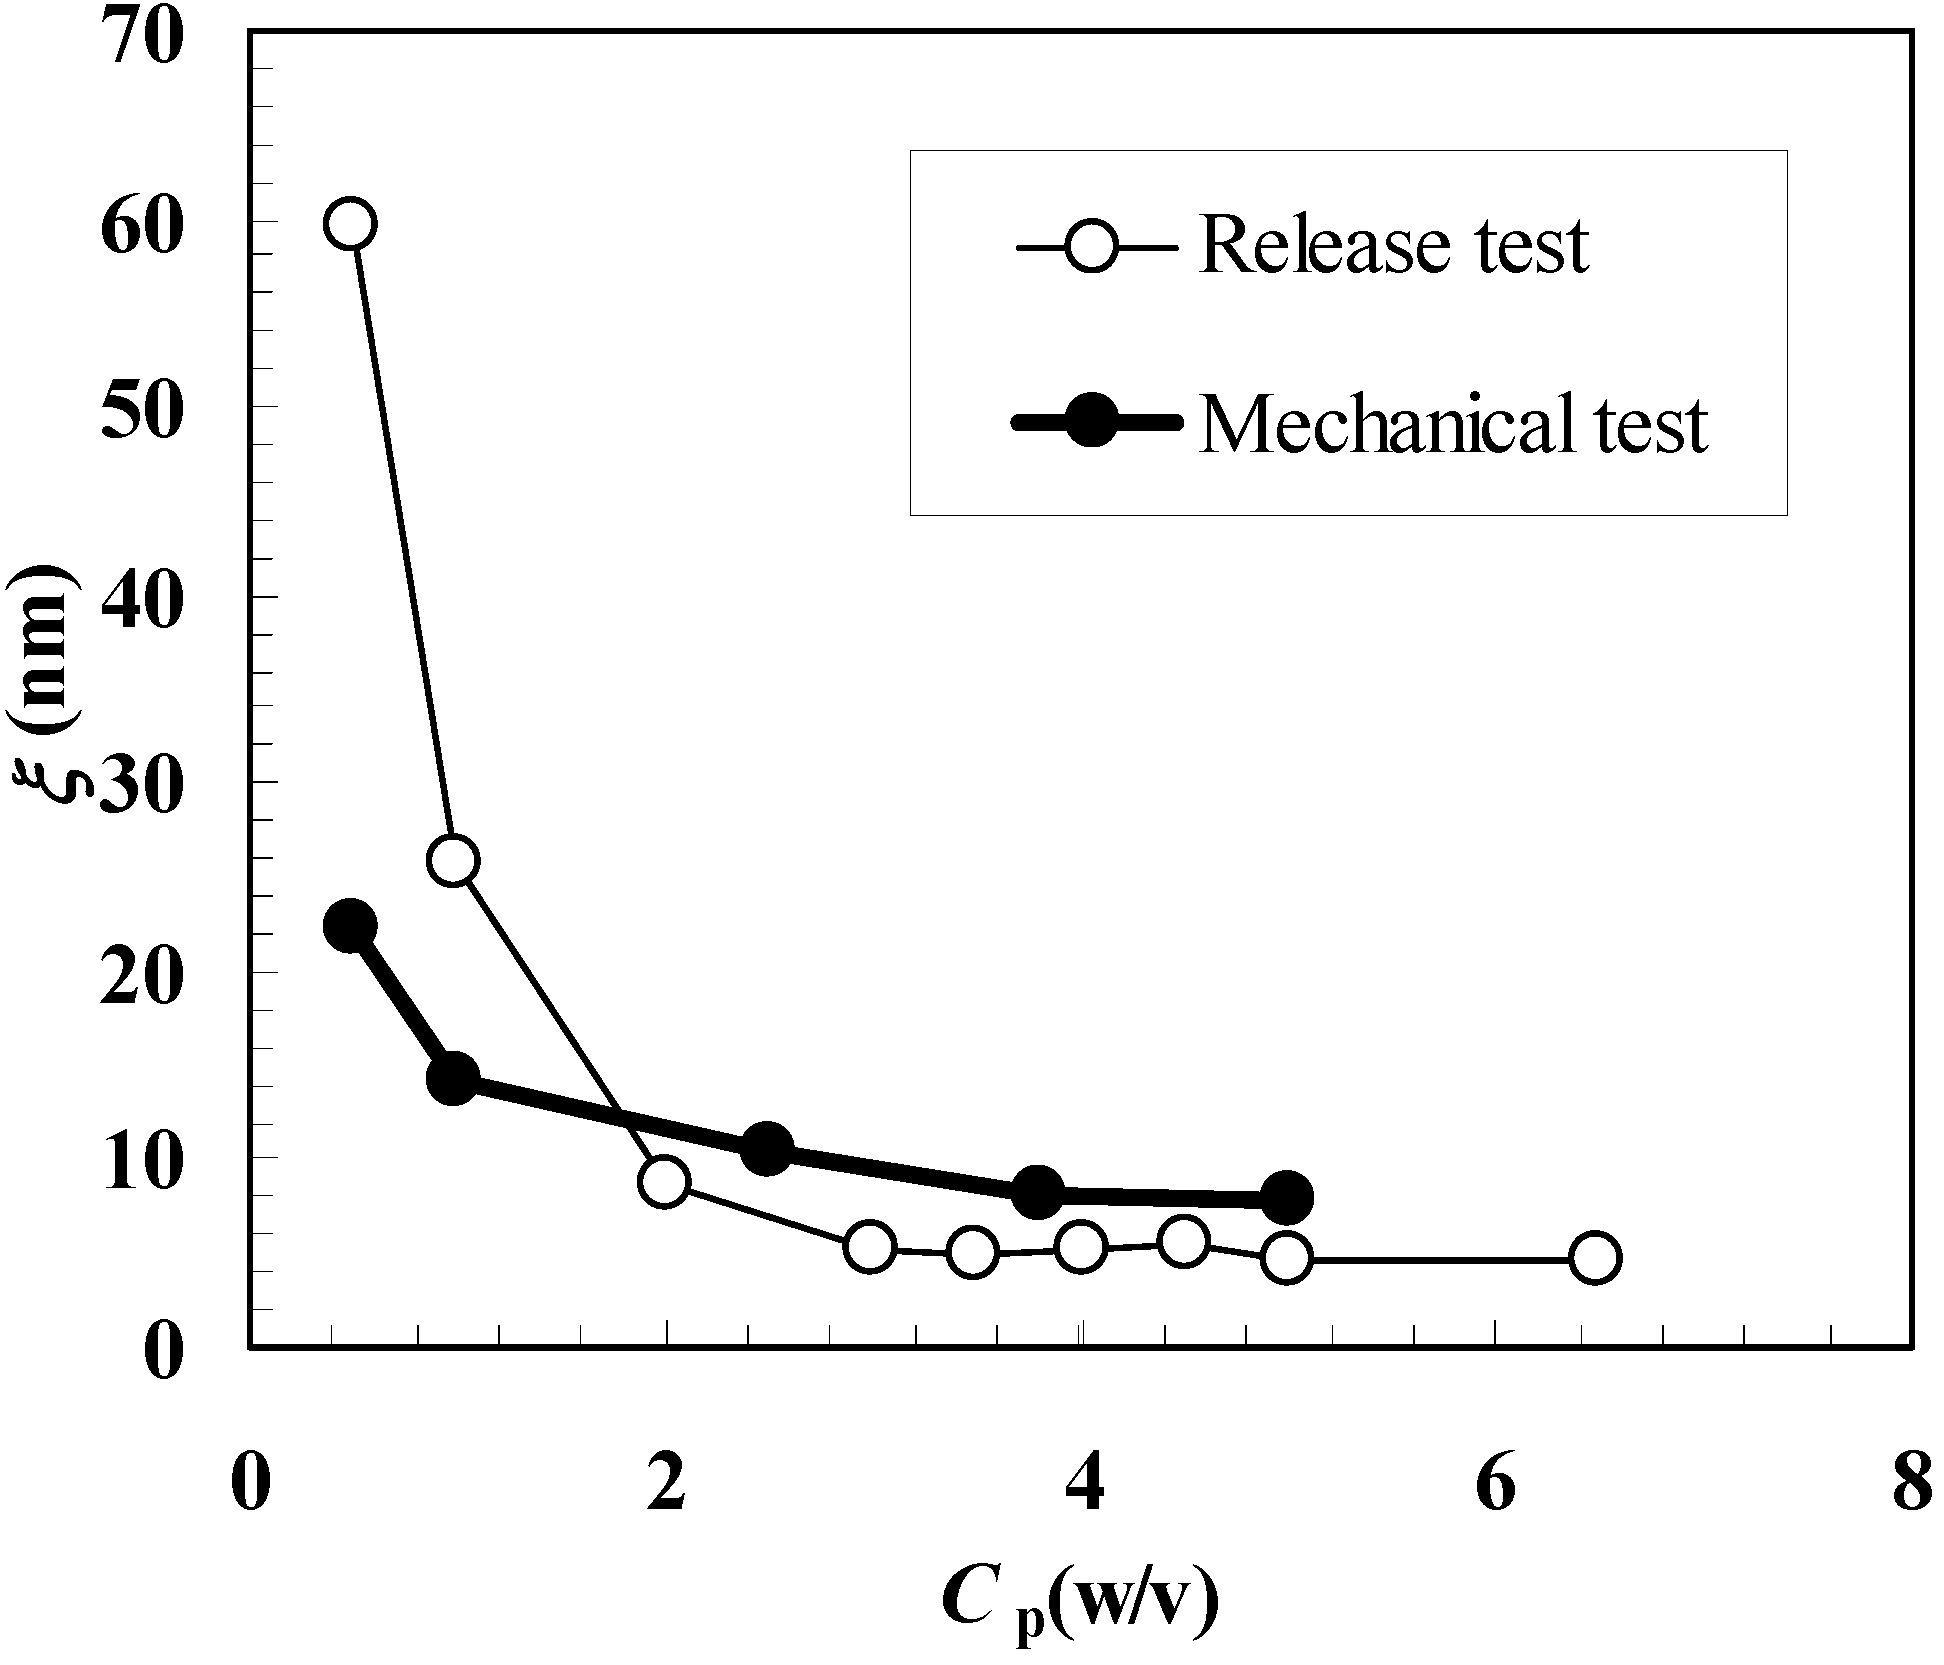
Figure 4 shows the comparison between ξ estimation according to the mechanical and release approaches. It can be seen that, with the exception of
Cp = 0.5%, similar results are obtained even if the release approach yields higher ξ values for
Cp = 1.0% and smaller values for
Cp ≥ 2.0%. These differences cannot be imputed to the different temperatures at which mechanical (25 °C) and release (37 °C) tests were performed. The high standard deviation associated to ξ for
Cp = 0.5% suggests a low reliability of the release approach for what concerns ξ estimation at very low
Cp (or j) values. This is reasonable as, in this φ range, the effect of polymeric network on model drug diffusion (mobility) is very low and a reliable experimental determination of the diffusion coefficient becomes problematic. Probably, in this diluted range, it would be necessary to consider bigger model drugs whose van der Waals diameter is not negligible in comparison to ξ (myglobin’s van der Waals diameter is approximately 1/5 and 1/10 of ξ calculated according to the mechanical and release approach, see
Table 1 and
Table 2.). On the contrary, the mechanical approach seems to be more reliable (at least judging from the standard deviation values associated to ξ, see
Table 1) also in this diluted range. Again, the reason for this relies on the gel characteristic tested by the mechanical approach, i.e. network connectivity that, although low, is able to confer to the water-polymer system a mechanical behavior more similar to that of a solid rather than to that of a solution. Anyway, diluted range apart, Equation (6) proved to be a reliable tool for ξ estimation.
Figure 4.
Comparison between the values of the polymeric network average mesh size (ξ) calculated according to the mechanical and release approaches. Cp represents the polymer concentration.
Figure 4.
Comparison between the values of the polymeric network average mesh size (ξ) calculated according to the mechanical and release approaches. Cp represents the polymer concentration.


 (instantaneous compression), Equation (1) becomes:

 ). For gel systems that are cross-linked in solution and that did not undergo further swelling/shrinking before the mechanical test, Flory’s theory [12] establishes the following relation between the network crosslink density ρx and the Young modulus E:


 can be approximately set equal to one, we preferred to estimate it from the experimental data. The real difficulty in k2 determination comes from the fact that Peppas and co-workers did not provide a functional dependence of ξ on polymer volume fraction φ (if the function ξ(φ) were known, k2 could be simply determined by fitting Equation (6) on experimental data of D/D0 vs φ). Accordingly, k2 was determined observing that in the limit φ → 0, ξ(φ) becomes infinite, rs/ξ(φ) becomes zero and the exponential term in Equation (6) can be transformed in the light of Taylor series development (
  ) as X = (φ/(1-φ)) becomes zero:


 and
and  are, respectively, the standard deviation of the D0/D0 ratio and of k2 (see Table 2). Table 2 shows that ξ reduces with Cp in a non-linear manner and that its standard deviation is considerably high for Cp = 0.5%. This underlines the criticality of ξ determination for very low values of polymer volume fraction. In this regards it is worth mentioning that the most important contribute to
  is given by the uncertainty related to the estimation of D0/D0, i.e.