Article

Determination of the Volatile Constituents in Radix Flemingiae Philippinensis by GC-MS and a Heuristic Evolving Latent Projection Method

1
Department of Chemistry and Pharmaceutical, Quzhou College, Quzhou 324000, China
2
Quzhou Center of Calibration and Testing for Quality and Technical Supervision, Quzhou 324000, China
3
Changde Institute for Drug Control, Changde 415000, China
*
Author to whom correspondence should be addressed.
Molecules 2010, 15(6), 4055-4066; https://doi.org/10.3390/molecules15064055
Submission received: 10 March 2010 / Revised: 24 May 2010 / Accepted: 28 May 2010 / Published: 4 June 2010

Abstract

:
With the help of chemometric resolution methods, a technique for qualitative and quantitative determination of the volatile chemical constituents in Radix Flemingiae Philippinensis by chromatography-mass spectrometry was developed. After the overlapping chromatographic peaks were resolved into pure chromatograms and spectra using a heuristic evolving latent projections (HELP) method, qualitative analysis was performed by similarity search of the obtained pure mass spectrum of each component in the NIST library and the quantitative results were obtained by calculating the total two-way response volume. A total of 63 components were separated and 55 components were identified, accounting for 90.62% of the total content. The main components were farnesol isomer and β-caryophyllene, accounting for 31.33% and 12.60% of the total content, respectively. The obtained results can provide useful information for further study and development of Radix Flemingiae Philippinensis.

Introduction

Due to their low toxicity, high pharmacological activity and low incidence of complications, people have been paying more and more attention to Traditional Chinese Medicines (TCMs) in recent decades [1]. Radix Flemingiae Philippinensis, the root of Flemingiae Philippinensis Merr. et Rolfe, belongs to the leguminous plants class. As a TCM, it has been widely used to cure rheumatism, lumbar muscle strains, myasthenia of limbs, injuries from falls, swelling and sore throat, etc. [2]. Although Radix Flemingiae Philippinensis contains tens or even hundreds of compounds, only a limited number of compounds might be responsible for any observed pharmaceutical or toxic effects. The volatile compounds are the main pharmacological active components in Radix Flemingiae Philippinensis. Radix Flemingiae Philippinensis, like other TCMs, is very complex, compared with Western medicines [3], which makes the screening and analysis of bioactive components in it extremely difficult. Generally the analysis of the volatile compounds is performed with gas chromatography (GC) and gas chromatography–mass spectrometry (GC–MS) [4]. GC has seen enormous growth due to its speed, simplicity, relatively low cost, and wide applicability as a separation tool. However, in the case of GC, the identification of components is carried out just by means of comparison of retention times with reference compounds. This means that often some components cannot be identified due to the complexity of the matrix or the lack of an appropriate reference material. In addition, retention times have no uniform criteria because they are affected by many factors. Although GC–MS is a useful and powerful method for the analysis of the volatile compounds in Radix Flemingiae Philippinensis [5], only 39 components are qualitatively and quantitatively analyzed by GC–MS. The main reason is that the determination is performed only through the direct similarity searches in MS database attached to the GC–MS instruments. There exist at least two serious problems with the GC–MS method. First, the background can not be accurately corrected. Second as the boiling points of components analyzed are close to each other, there are always overlapping peaks although the chromatographic conditions are optimized. In such a case, it is hard to identify the components by direct similarity search in a MS database alone, which can result in wrong conclusions. Therefore, developing a simple and reliable approach for the determination of the volatile constituents in Radix Flemingiae Philippinensis is necessary. To date many associated methods have been developed to provide more information for chemical analysis both in chromatographic separation and in spectral identification, such as evolving factor analysis (EFA) [6,7], window factor analysis (WFA) [8], heuristic evolving latent projections (HELP) [9,10], subwindow factor analysis (SFA) [11,12].These methods make resolution of complex systems possible [13,14,15]. In this paper, the volatile compounds in Radix Flemingiae Philippinensis were studied with GC–MS and heuristic evolving latent projections (HELP). The developed method can be used for quality control of Radix Flemingiae Philippinensis.

Results and Discussion

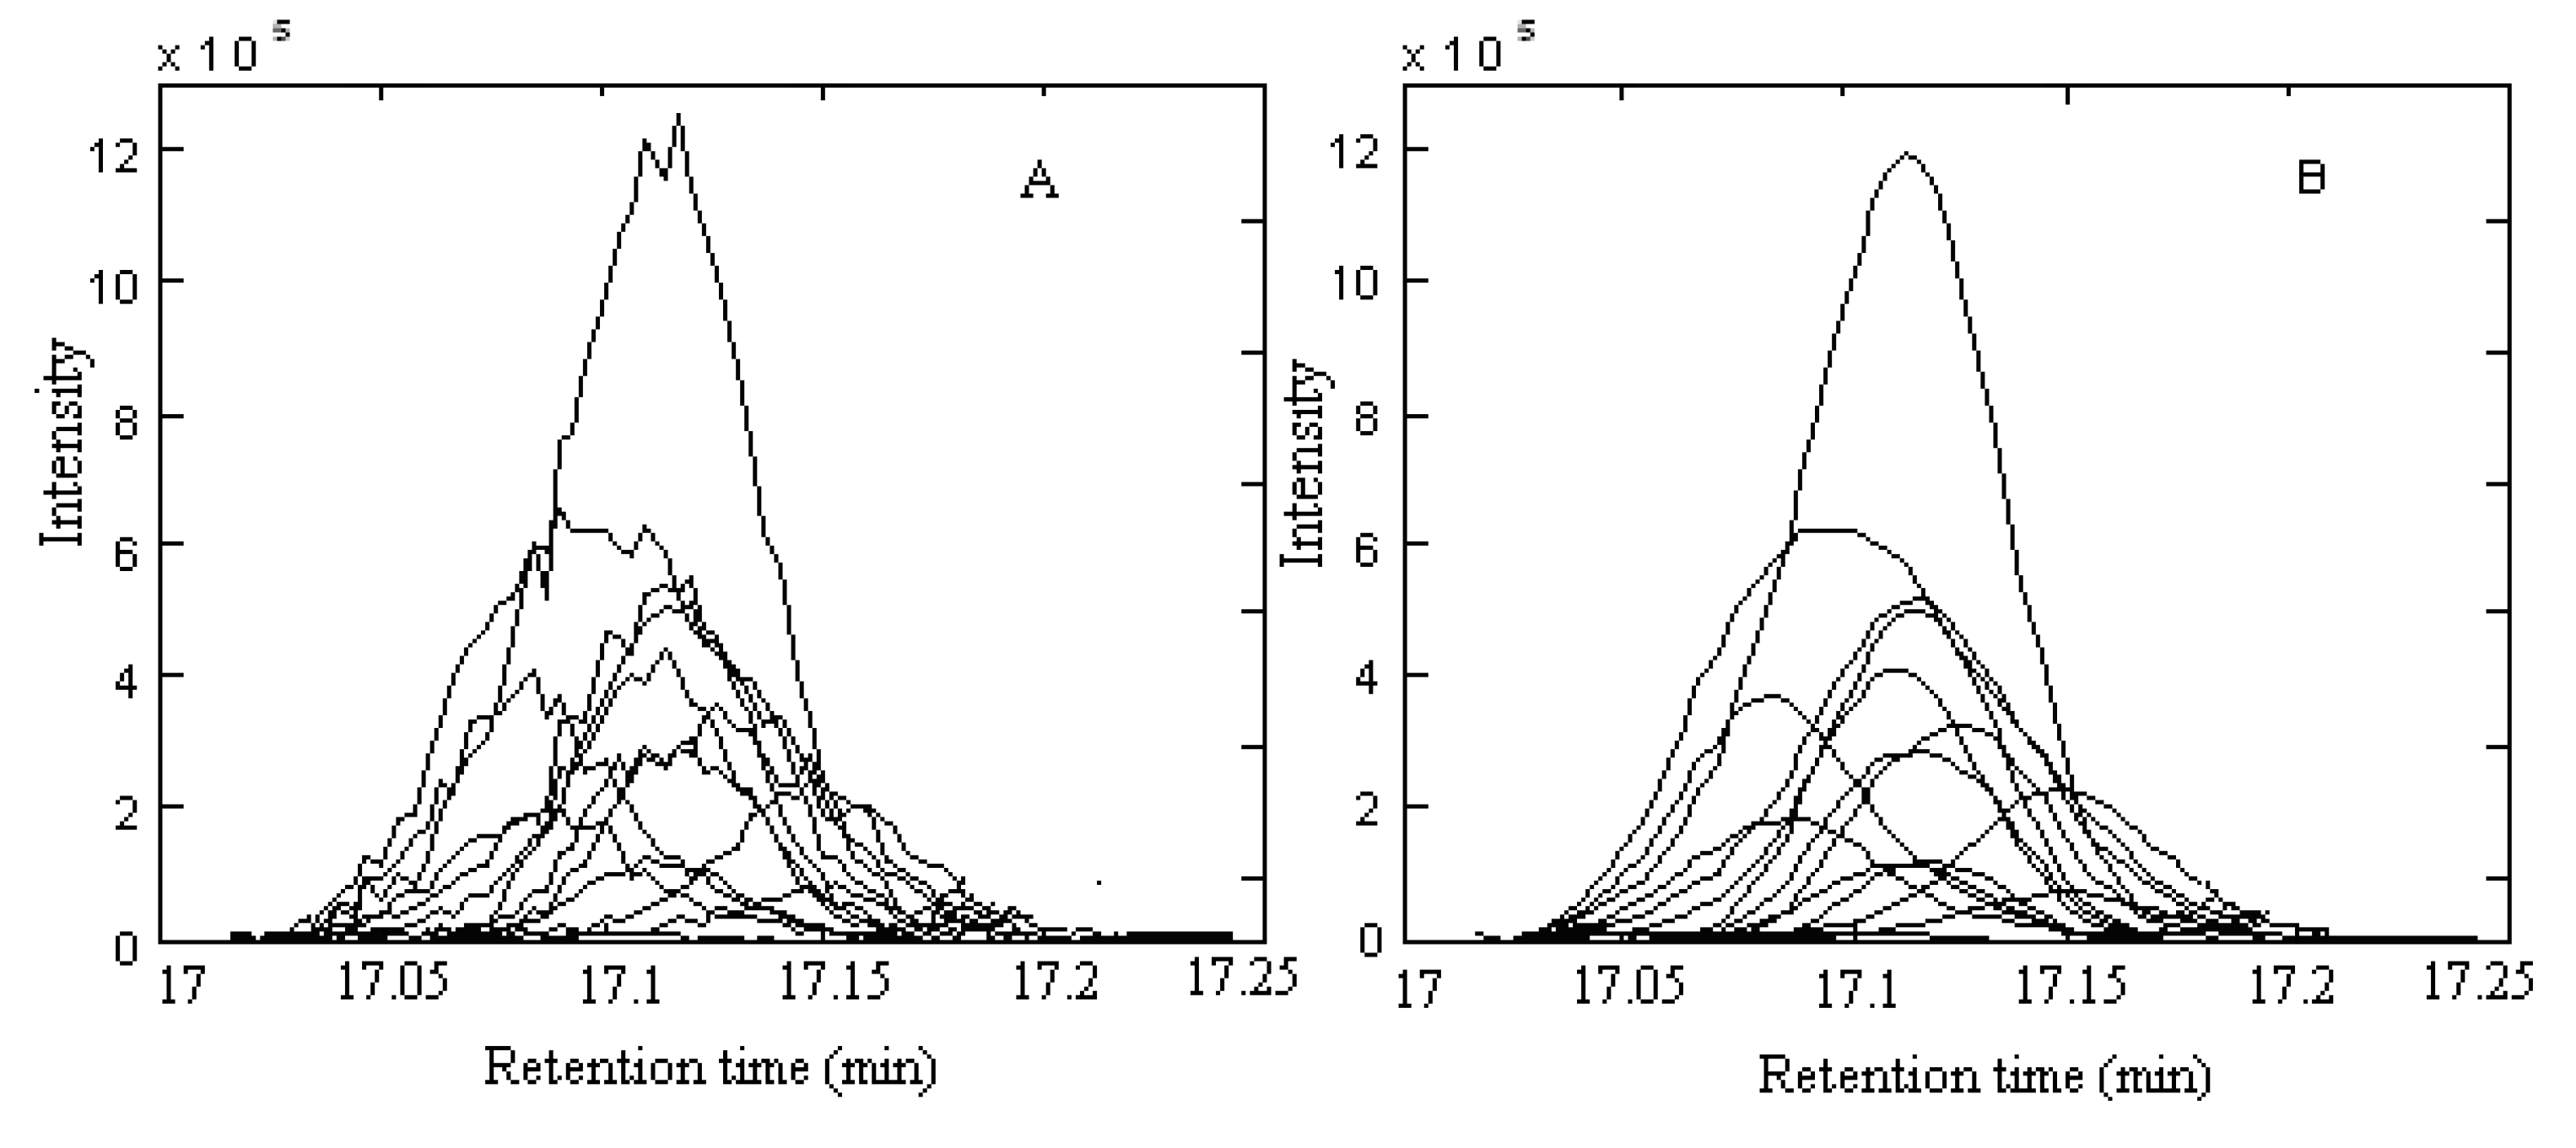
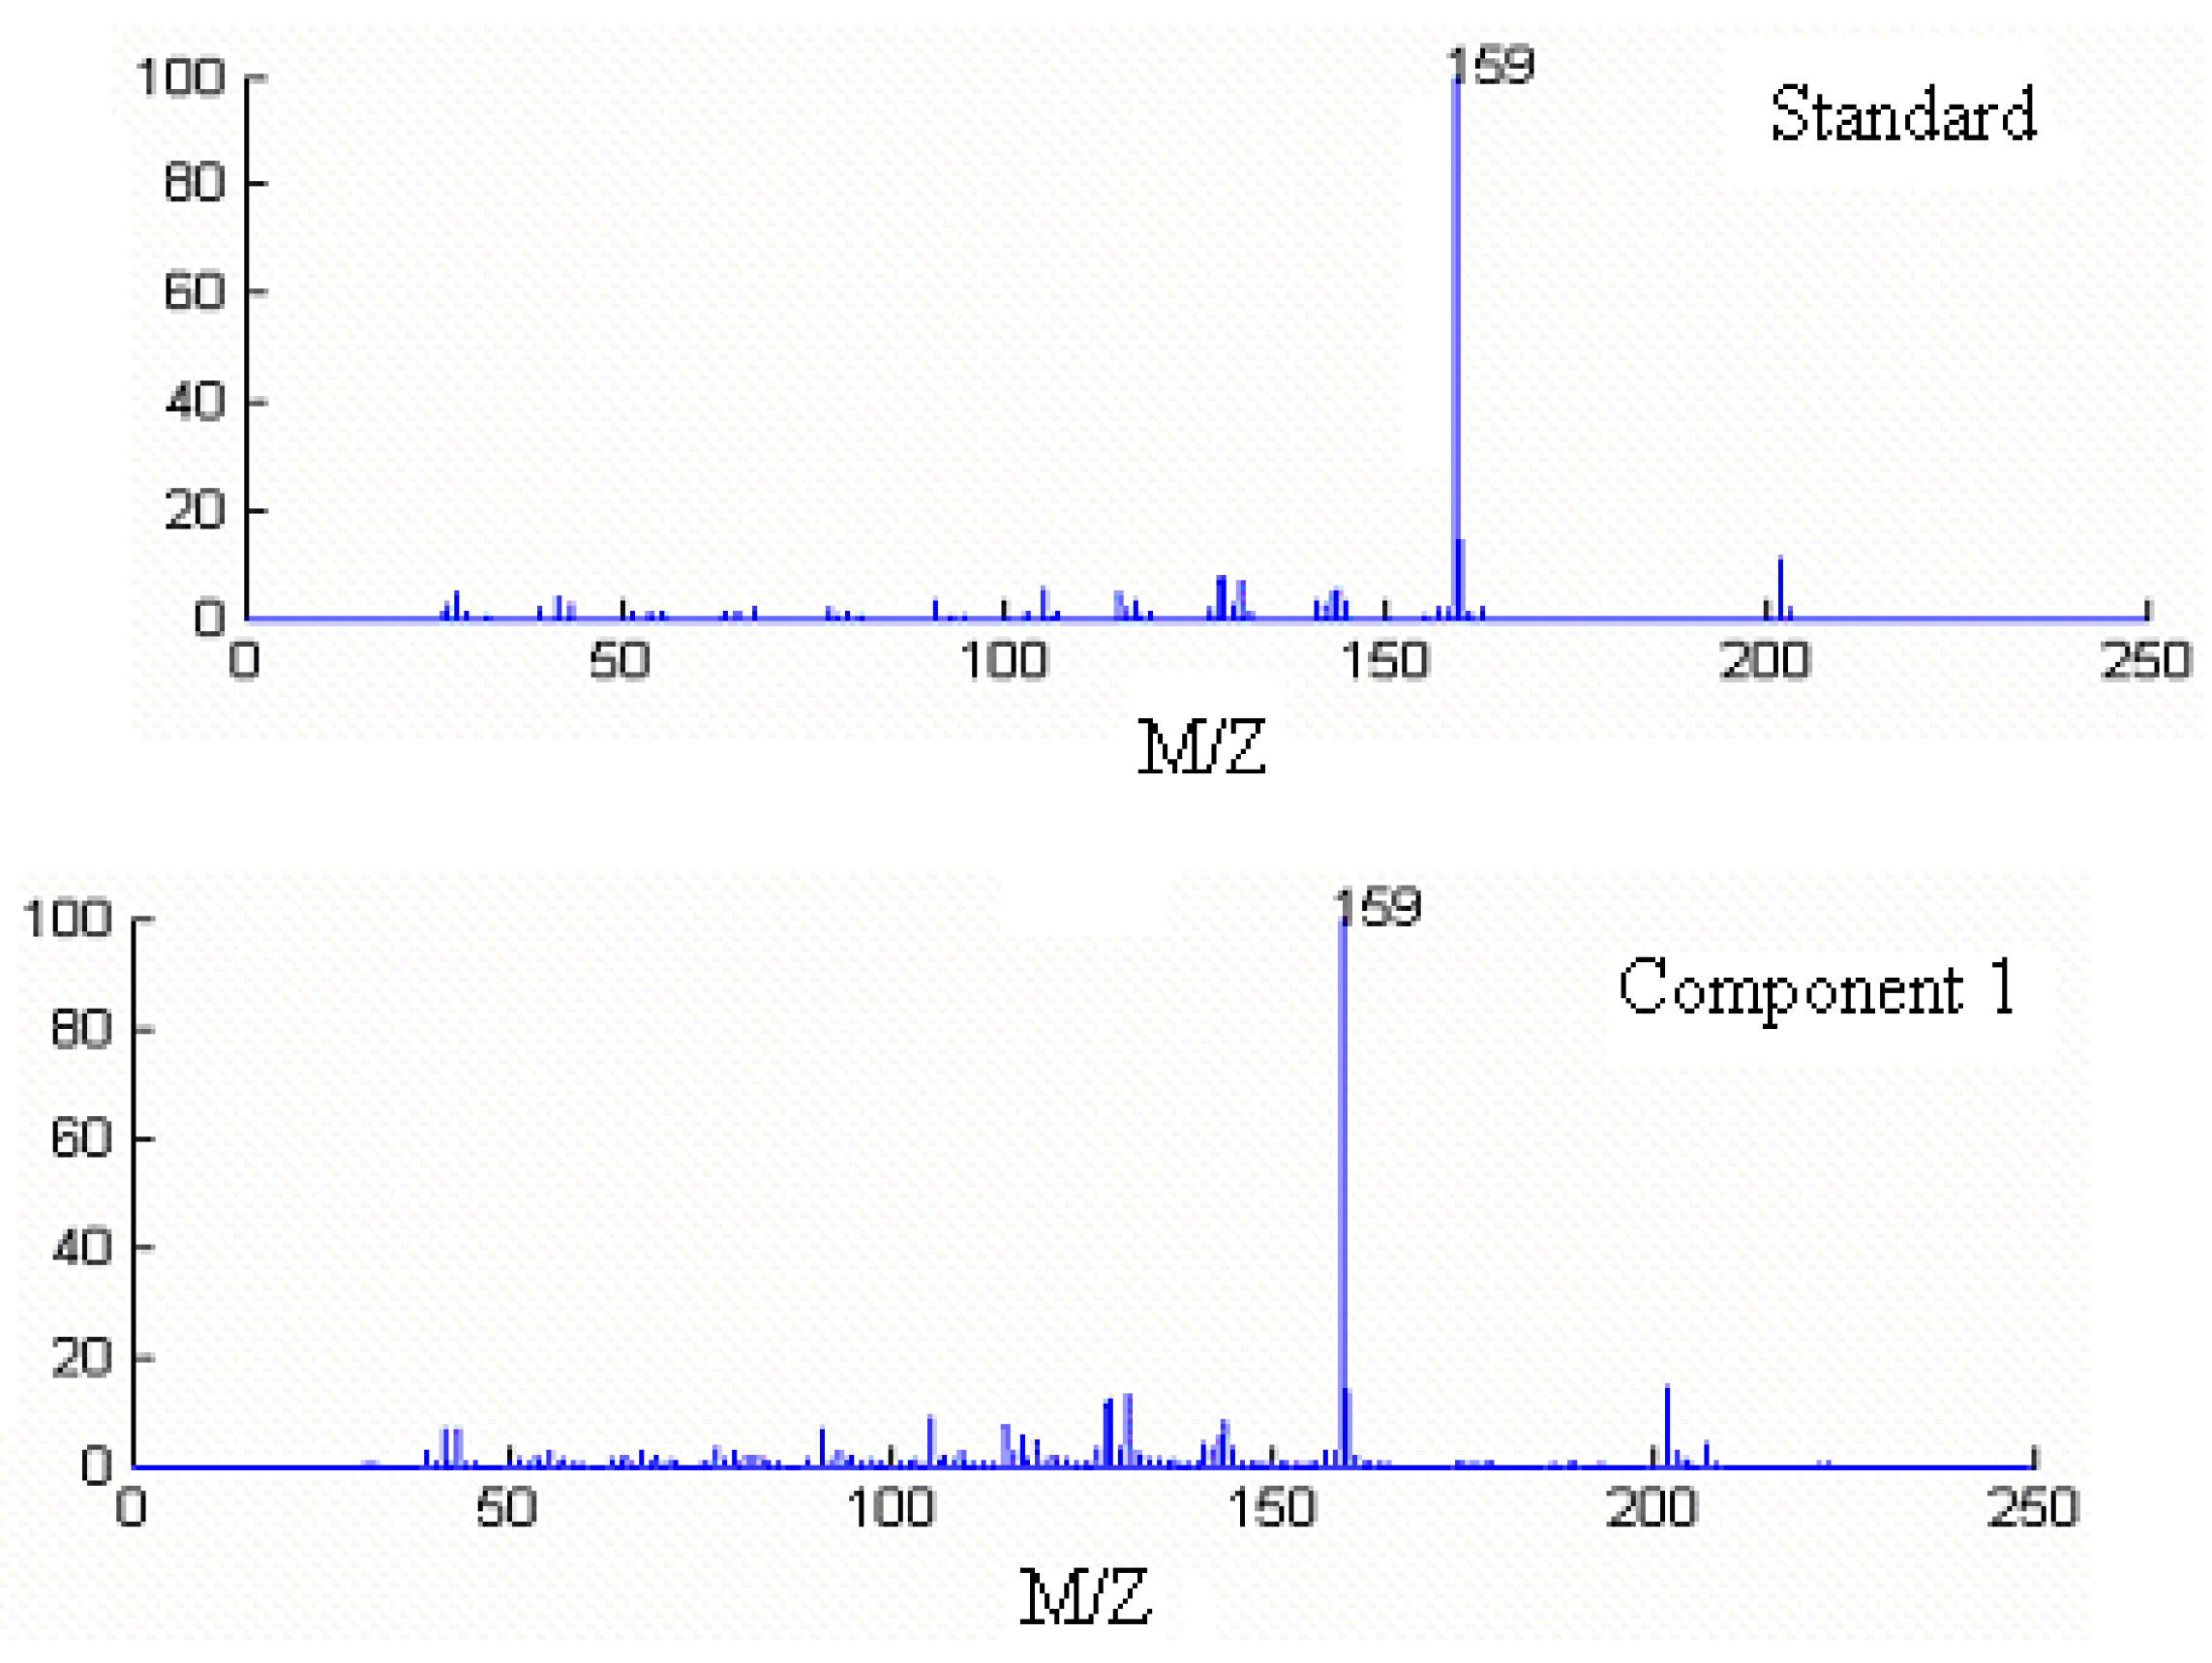
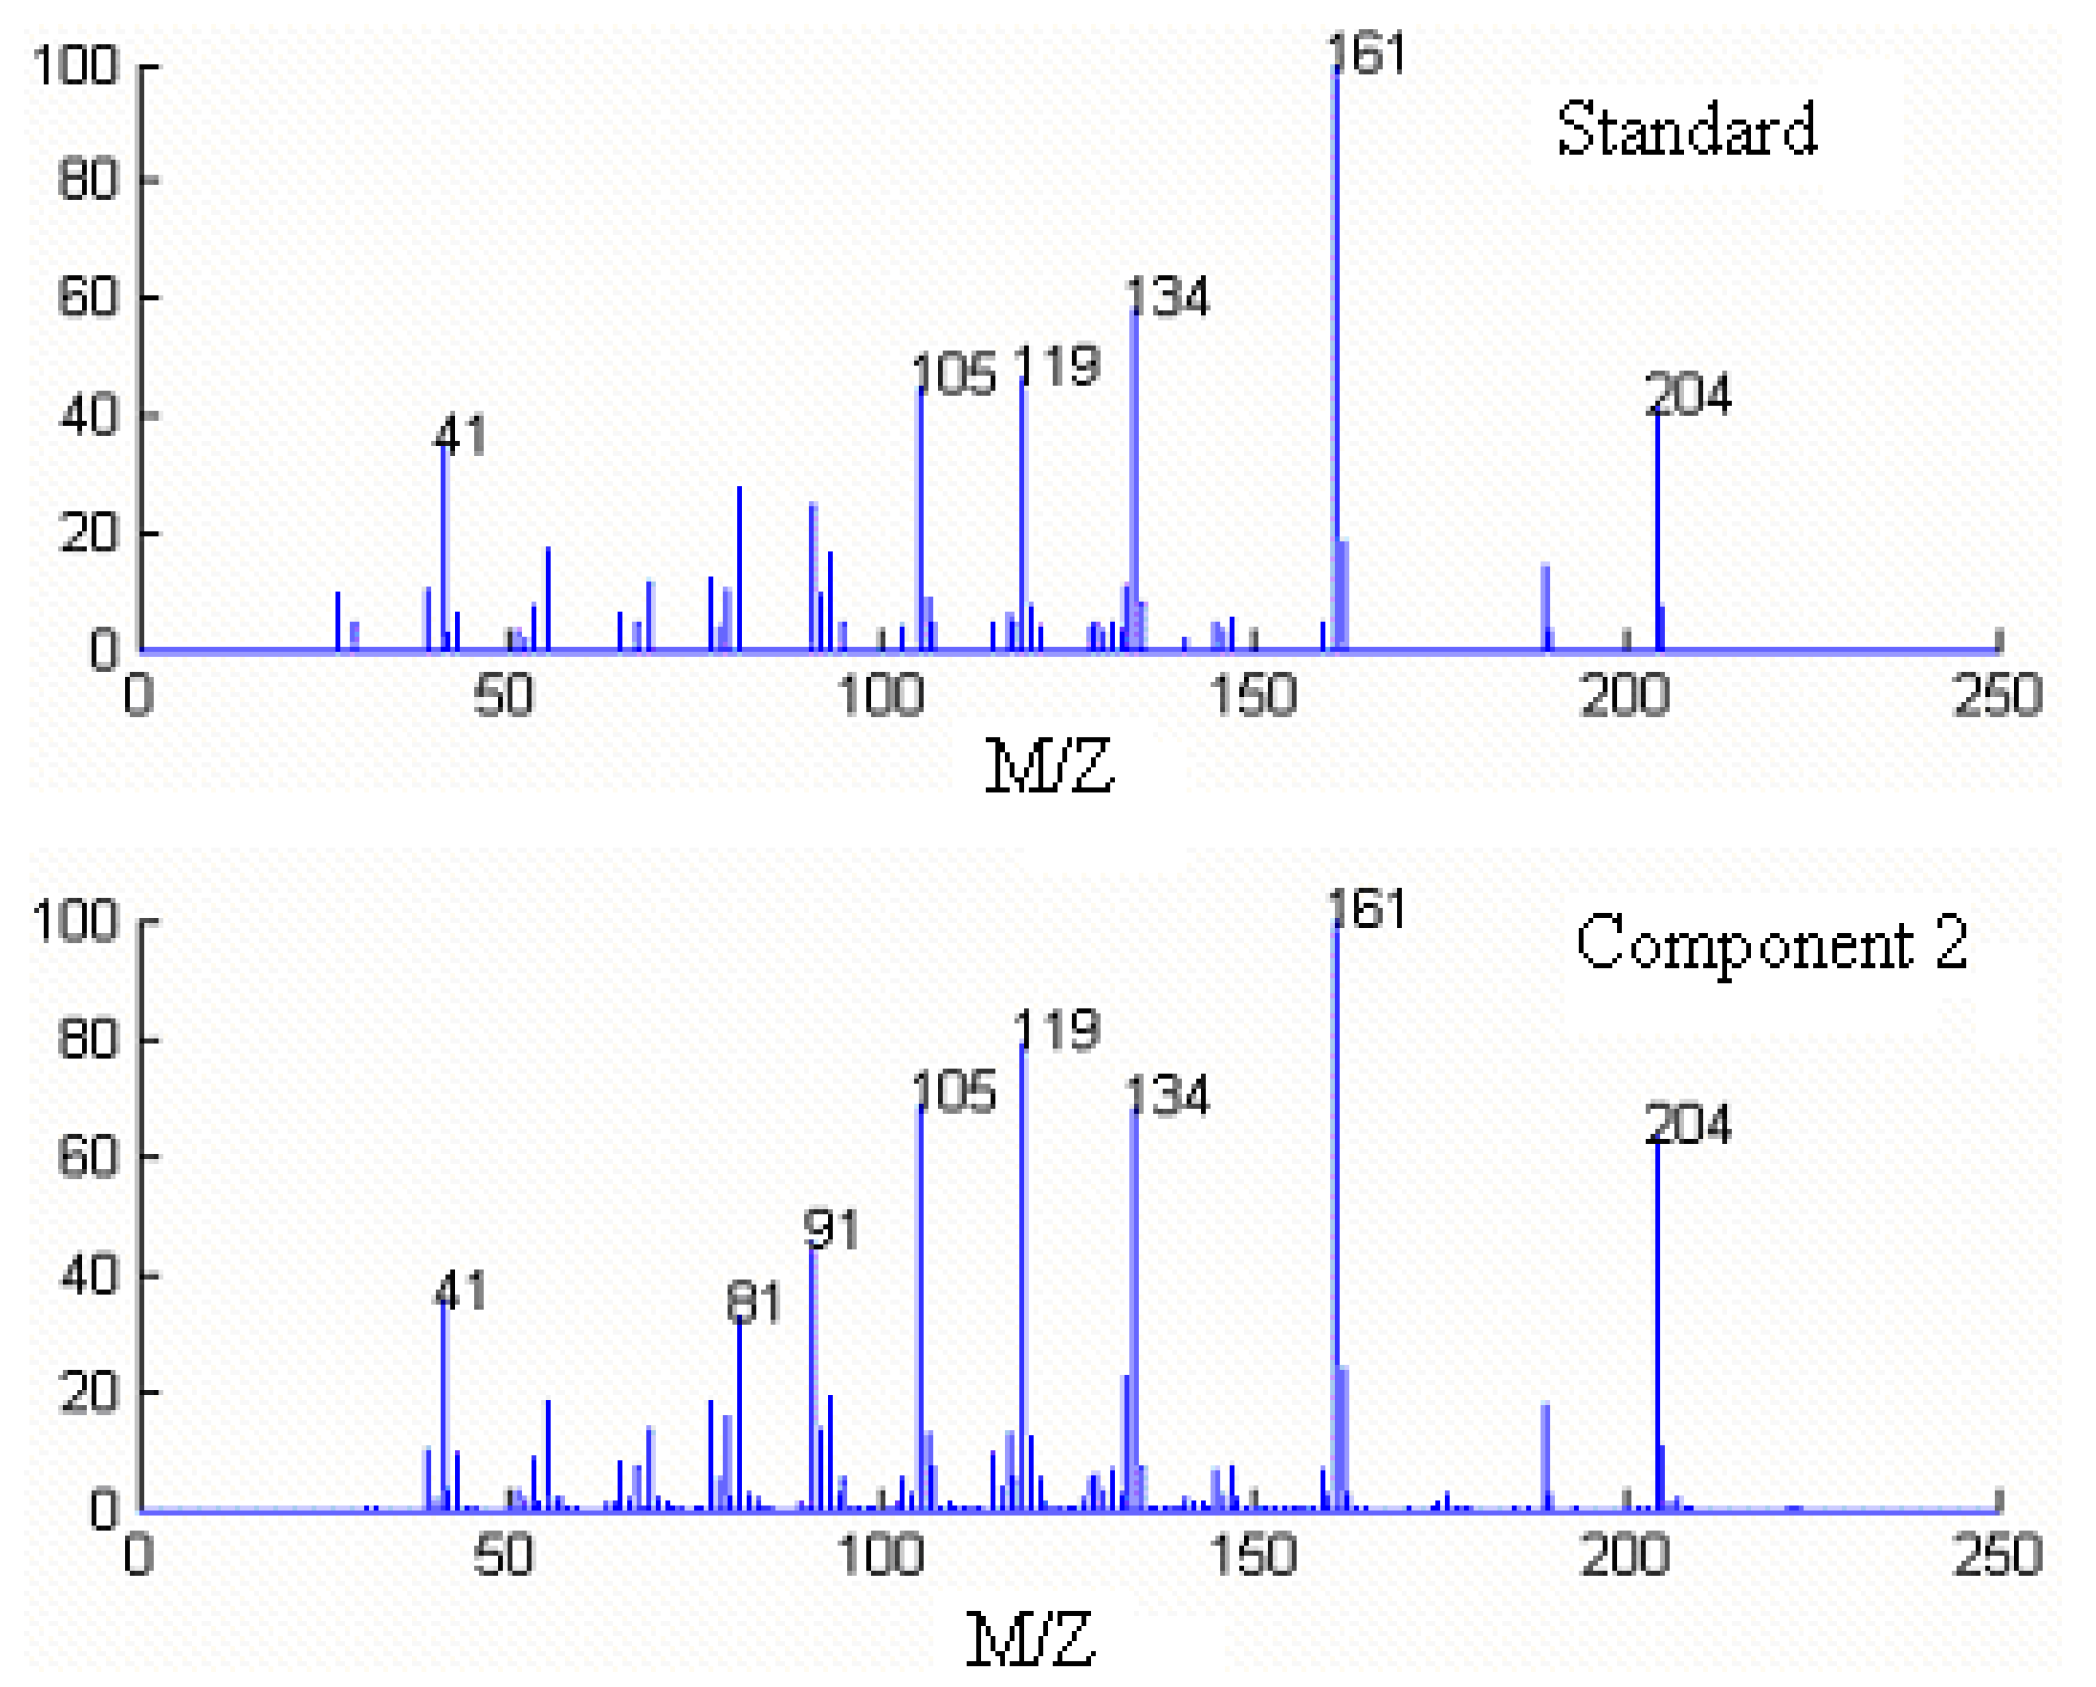
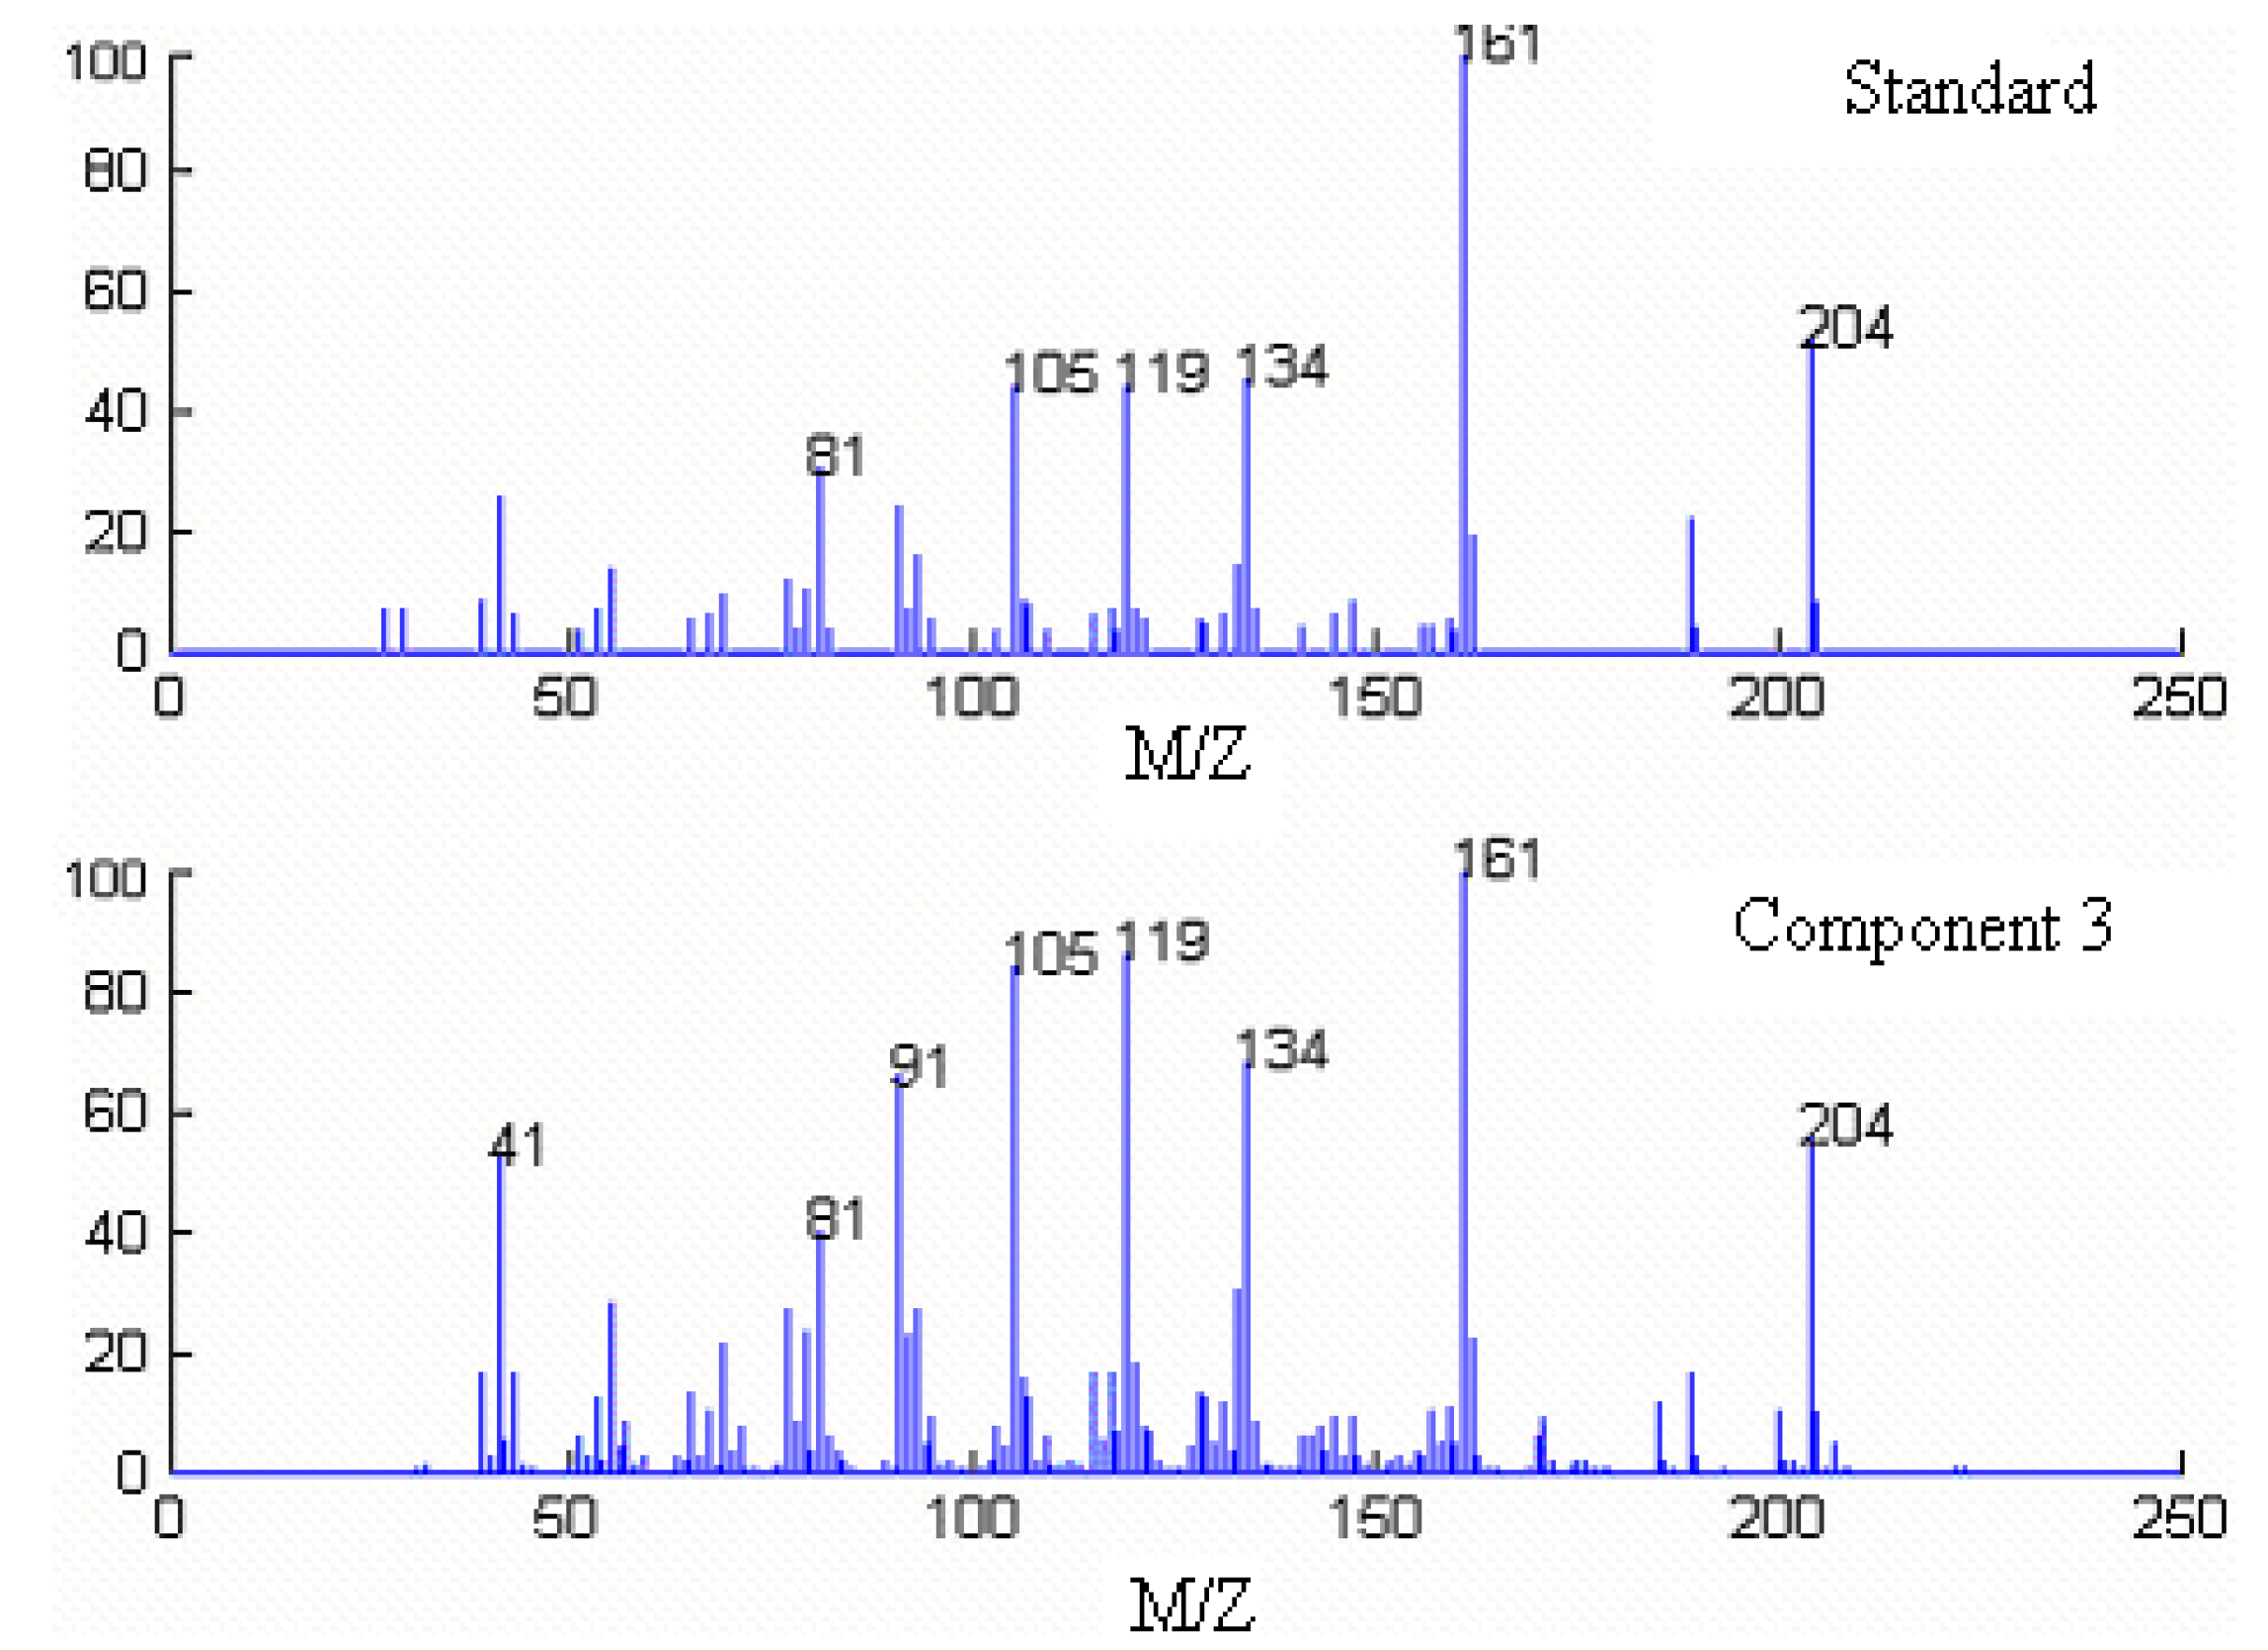
Qualitative analysis

The real total ion chromatogram (TIC) of the volatile components in Radix Flemingiae Philippinensis is shown in Figure 1.
Figure 1. The Total Ion Chromatogram (TIC) of the volatile components in Radix Flemingiae Philippinensis.
Molecules 15 04055 g001
As can be seen from Figure 1, there are a lot of peaks and their relative levels vary greatly. Apparently, it is indeed a very complicated system. Although chromatographic separation was optimized, some of components still overlap with one another and the concentrations of many volatile components are very low. If the compounds were directly searched in the NIST mass spectral database, incorrect identifications may be obtained. First, the similarity indices obtained from direct searching within the NIST mass database were quite low for most of these chromatographic peaks and sometimes the same component was identified at different chromatographic scan points. Second, the components with low content were very difficult to identify directly with the NIST mass database, since two-dimensional data obtained by mass spectral measurement unavoidably contains peaks associated with column background and noise. However, if the overlapped peaks and the components with low content could be resolved into pure spectra and chromatograms with some relative chemometric resolution method, the qualitative analysis of components would be improved to a considerable extent. The HELP method was a commonly used chemometric technique for solving this problem. A brief depiction of the HELP method follows.
Some data represented by Xm×n obtained from the GC–MS is a bilinear matrix. According to the Lambert–Beer law, it can be expressed simply as follows:
Xm×n=CST+E=cisiT+E (i=1,2,…,N)
where Xm×n denotes an intensity matrix with N components of m chromatographic scan points at n atom mass units (amu). C and S are the pure chromatographic matrix and the pure spectral matrix, respectively. The superscript T represents the transpose of matrix S. E denotes the measurement noise. With local full rank analysis in the HELP method, a two-dimensional data can be resolved into the chromatograms and spectra of the pure chemical components. The TIC of peak cluster A in the 17.0–17.25 min range in Figure 2 is taken as an example to demonstrate the whole procedures of this approach.
Figure 2. The total ion chromatogram of peak cluster A (A) Data without smoothing; (B) Data after smoothing.
Molecules 15 04055 g002
First, the background can be estimated by eigenvalue decomposition of the data of the zero component region before and after the chromatographic peak, and then it can be deducted through least squares [13,17]. Then the rankmap was obtained with a fixed size moving wndow evolving factor analysis (FSMWEFA) [18], and was shown in Figure 3.
Figure 3. Rank map obtained by FSMWEFA (window size = 6) for cluster A (A) Result of the raw data, (B) result of the data after correcting background and baseline shift, and (C) result of the smoothed data by roughness penalty processing.
Molecules 15 04055 g003
The local rank in the elution sequence can be seen from the rankmap. If the local rank was one, there was one component in the specified region. If the local rank was two, there were two components co-eluting. Figure 3(A) was the rankmap of the raw data with a window size of 6. Apparently it was a kind of typical heteroscedastic noise, the greater the signal, the bigger the noise. Figure 3(B) was the rankmap of the peak cluster A after background and baseline shift corrected. Figure 3(A) and (B) showed that the difference between them mainly came from the 17.0 min to 17.03 min region. In this region, Figure 3(A) seemed to tell us there were two components, but in the same region in Figure 3(B) only one component was shown. In fact, this was caused by the background. We can see the lower signal-to-noise ratio and heteroscedastic noise were still existence in both cases. However, if the data was smoothed by the rough penalty smoothing method [19], the detection ability of the GC–MS data would be improved. Unlike polynomial regression, the roughness penalty approach is a kind of non-parametric regression, which aims to overcome white noise in hyphenated chromatographic data. The chromatograms of peak cluster A after smoothing were shown in Figure 2(B). It was seen that the data has been reasonably smoothed without apparent distortion. Its rankmap was shown in Figure 3(C) and the eigenvalve representing the noise level was on the same level. In Figure 3(C), not only the first and second eigenvalue provide the component information, but the third eigenvalue can also provide the refined structure of the component elution information, the start and end point of each component. Apparently, heteroscedastic noise in the data has been removed and the signal-to-noise ratio was increased with the help of the smoothing treatment. Therefore, the rankmap clearly showed us that there were three components in peak cluster A. With all the information determined, the two-dimensional data matrix can be resolved into the pure chromatographic profiles and mass spectrum of each component with the HELP method. Finally, when each pure spectrum was extracted and the resolved chromatographic profiles of the three components were obtained (Figure 4), then their identification can be done by similarity searches in the NIST mass database.
Figure 4. Resolved chromatographic profiles of peak cluster A.(1) calamenene (C15H22), (2) δ-cadinene (C15H24),and (3) β-cadinene (C15H24).
Molecules 15 04055 g004
Component 1, 2 and 3 in this cluster may be calamenene (C15H22), δ-cadinene (C15H24) and β-cadinene (C15H24), with similarity matching indexes of 0.99, 0.97 and 0.93, respectively. The accuracy and reliability of the results were increased greatly. The searched corresponding standard spectra of each component in cluster A were shown in Figure 5, Figure 6 and Figure 7.
Figure 5. Resolved mass spectrum of component 1 by HELP and standard mass spectrum of calamenene (C15H22).
Molecules 15 04055 g005
Figure 6. Resolved mass spectrum of component 2 by HELP and standard mass spectrum of δ-cadinene (C15H24).
Molecules 15 04055 g006
Figure 7. Resolved mass spectrum of component 2 by HELP and standard mass spectrum of β-cadinene (C15H24).
Molecules 15 04055 g007
Other overlapped peaks certainly existed in the total ion chromatogram (TIC) of the volatile components in Radix Flemingiae Philippinensis. The TIC of peak cluster p in Figure 1 within 15.9–16.3 min, which was shown in Figure 8, was another example. It seemed to include one component peak. However, in this way, the spectrum changed a lot at different positions. In fact, the similarity was relatively lower. Therefore, it was also necessary to resolve this overlapped peak. Background, baseline shift and heteroscedastic noise in the raw dimensional data was pretreated by the corresponding method [13,17,19].
According to the rank estimation method [18], there were three components in this peak cluster. With all the information determined, the two-dimensional data matrix can also be resolved into pure chromatographic profiles and mass spectrum of each component with the HELP method. Figure 9 showed the resolved chromatographic profiles. Components 1 and 2 in this cluster may be 2-cyclopropylidene-1,7,7-trimethylbicylo [2,2,1]heptane (C13H20) and 3,3,5,5-tetra-methylcyclohexanol (C10H20O), with similarity matching results of 0.97 and 0.95, respectively. The searched corresponding standard spectra of each component in cluster p are shown in Figure 10 and Figure 11. Component 3 were not identified due to the very low match values. Likewise, the spectra of components in other segments can be obtained. The qualitative results were listed in Table 1.
Figure 8. The TIC chromatogram of peak cluster P (a) Curve a was the original chromatogram. (b) Curve b was the chromatogram after background removal.
Molecules 15 04055 g008
Figure 9. Resolved chromatographic profiles of peak cluster P: (1) 2-cyclopropylidene-1,7,7-trimethylbicylo [2,2,1]heptane (2) 3,3,5,5-tetramethylcyclohexanol and (3) not identified.
Molecules 15 04055 g009
Figure 10. Resolved mass spectrum of component 1 by HELP and standard mass spectrum of 2-cyclopropylidene-1,7,7-trimethylbicylo [2,2,1]heptane (C13H20).
Molecules 15 04055 g010
Figure 11. Resolved mass spectrum of component 2 by HELP and standard mass spectrum of 3,3,5,5-tetramethylcyclohexanol(C10H20O).
Molecules 15 04055 g011
Table 1. Identification and quantification of the volatile components in Radix Flemingiae Philippinensis.
Series No.Retention time (min)Compound nameMolecular formulaRelative content (%)
13.653HexanalC6H12O0.29
26.3682-Amylfuran C9H14O0.08
37.979LinaloolC10H18O0.04
48.682L-camphorC10H16O0.05
59.267p-Menth-1-en-4-olC10H18O0.04
69.419p-Menth-1-en-8-olC10H18O0.13
710.549Nonanoic acidC9H18O20.06
811.065Bornyl acetateC12H20O20.08
911.2942,3,4,5-Tetramethyltricyclo[3.2.1.02,7]oct-3-ene C12H 180.11
1012.750α-CubebeneC15H240.13
1112.929α-LongipineneC15H240.11
1213.035Di-epi-α-CedreneC15H240.04
1313.330YlangeneC15H241.22
1413.476LongicycleneC15H242.49
1513.675CopaeneC15H240.06
1614.315LongofoleneC15H245.20
1714.560β-CaryophylleneC15H2412.60
1814.744Germacrene DC15H240.30
1915.057(Z)-β-FarneseneC15H240.47
2015.2322,4a,5,6,7,8,9,9a-Octahydro-3,5,5-trimethyl-9-methylene 1 H-benzocyclohepteneC15H240.52
2115.398α-CaryophylleneC15H240.73
2215.665DihydrocurcumeneC15H240.19
2315.812α-CurcumeneC15H241.20
2415.858EremophileneC15H240.56
2516.0372-Cyclopropylidene-1,7,7-trimethylbicylo-[2,2,1]- heptaneC13H200.56
2616.1423,3,5,5-TetramethylcyclohexanolC10H20O0.59
2716.153Longifolene-(V4)C15H240.64
2816.288α-GuaieneC15H240.28
2916.419PatchouleneC15H240.33
3016.551α-MuuroleneC15H241.69
3116.721β-HimachaleneC15H241.59
3217.092CalameneneC15H221.85
3317.133δ-CadineneC15H242.13
3417.217β-CadineneC15H240.90
3517.538AcoradieneC15H240.96
3617.6933-Bromomethyl- 1,1-dimethyl-1 H-indeneC15H223.83
3718.134NerolidolC15H26O1.57
3818.255Cadala-1(10),3,8-trieneC15H220.26
3918.710Caryophyllenyl alcoholC15H26O0.18
4019.076Caryophyllene oxideC15H24O1.37
4119.772CedrolC15H26O1.94
4219.969BulnesolC15H26O0.31
4320.442EpiglobulolC15H26O0.36
4420.611CubenolC15H26O2.67
4520.996ι-CadinolC15H26O0.50
4621.090δ-CadinolC15H26O0.75
4721.196TorreyolC15H26O0.89
4821.377β-SelinenolC15H26O2.33
4921.510α-EudesmolC15H26O0.27
5022.025CadaleneC15H181.34
5122.185HedycaryolC15H26O0.11
5222.916PeruviolC15H26O0.71
5325.654Farnesol isomer C15H26O31.33
5426.361cis-FarnesalC15H24O0.66
5533.868Hexadecanoic acidC16H32O21.12

Quantitative analysis

After the pure chromatographic profile and mass spectrum of each component were resolved, the total two-way response of each component can be obtained from the outer product of the concentration vector and the spectrum vector for each component, namely Ci SiT. Similar to the general chromatographic quantitative method with peak area or height, the concentration of each component is proportional to the overall volume of its two-way response (Ci SiT). The advantage of this quantitative method over general peak-area integration is that all mass spectral absorbing points are taken into consideration. The final relative quantitative results were also listed in Table 1. A total of 55 components were identified in Radix Flemingiae Philippinensis, which represented 90.62% of the volatile components.

Experimental

Apparatus

GC–MS was performed with Shimadzu GC-2010 gas chromatography instrument coupled with a Shimadzu 2010 mass spectrometer. Compounds were separated on a 30 m × 0.25 mm i.d. capillary column coated with 0.25μm OV-1 film.

Materials

Radix Flemingiae Philippinensis was purchased from a Zhejiang pharmaceutical store market and was identified by a researcher from Institute of Materia Medica, Zhejiang Academy of Traditional Chinese Medicine and Materia Medica.

Extraction of the essential oil

The samples were dried at constant temperature 40 °C for 2 h, and extracted by water distillation for 8h, using a set of standard apparatus, according to the procedure described in the Chinese Pharmacopoeia [16]. The essential oils obtained were stored in the refrigerator at 4 °C prior to analysis. The yield of the essential oil samples of Radix Flemingiae Philippinensis was 0.35% (v/w).

Gas chromatography–mass spectrometry

Analytical conditions were as follows: the oven was held at 50 °C for 1 min during injection, then temperature programmed at 10 °C·min-1 to 150 °C and then ramped at 2 °C·min-1 to a final temperature of 200 °C and held for 5 min. Inlet temperature was kept at 260 °C all the time. A 1.0 µL volume of essential oil was injected into the GC. Helium carrier gas at a constant flow-rate of 1.0 mL·min-1 and a 10:1 split ratio were used simultaneously. Mass spectrometer was operated in full scan and electron impact (EI+) modes with an electron energy of 70eV. Interface temperature was 250 °C and MS source temperature was 200°C. In the range of m/z 30 to 350, mass spectra were recorded with 0.2 s·scan-1 velocity.

Data analysis

Data analysis was performed on a Pentium based IBM compatible personal computer. All programs of the chemometrics resolution methods were coded in MATLAB 6.5 for Windows. The library searches and spectral matching of the resolved pure components were conducted on the National Institute of Standards and Technology (NIST) MS database, containing about 107,000 compounds.

Conclusions

In this work, the volatile constituents in Radix Flemingiae Philippinensis have been determined with GC-MS and a combined chemometrics resolution method for the first time. Fifty five of 63 separated constituents in the essential oil of Radix Flemingiae Philippinensis were identified and quantified, accounting for 90.62% of the total content. The developed method can be used for the identification, differentiation and quality evaluation of Radix Flemingiae Philippinensis. The obtained results showed that the combination of GC-MS and a relative chemometrics resolution method are a useful and powerful technique for the analysis of bioactive components in TCMs.

Acknowledgements

This research work is financially supported by Province Natural Science Foundation of Zhejiang of P.R China (GrantNo.Y4080442) and Zhejiang Qianjiang Talent Project. The authors gratefully acknowledge the experimental assistance of Associate Professor Fang-qiu Guo (College of Chemistry and Chemical Engineering of Central South University, Changsha 410083, China) for GC–MS analysis.
  • Samples Availability: Samples of the extracts from Radix Flemingiae Philippinensis are available from the authors.

References and Notes

  1. Wen, K.C.; Huang, C.Y.; Lu, F.L. Determination of baicalin and puerarin in traditional Chinese medicinal preparations by high-performance liquid chromatography. J. Chromatogr. A 1993, 631, 241–250. [Google Scholar] [CrossRef]
  2. Chen, H.H; Sun, C.C.; Tseng, M.P.; Hsu, C.J. A patch test study of 27 crude drugs commonly used in Chinese topical medicaments. Contact Dermatitis 2003, 49, 8–14. [Google Scholar] [CrossRef]
  3. Wang, H.; Zou, H.; Kong, L.; Ni, J. Analysis of bioactive components in traditional Chinese medicines by molecular biochromatography with alpha1acid glycoprotein stationary phase. J. Basic Clin. Physiol. Pharmacol. 2000, 11, 155–172. [Google Scholar]
  4. Kulkarni, R.N.; Mallavarapu, G.R.; Baskaran, K.; Ramesh, S.; Kumar, S. Composition of the essential oils of two isomenthone-rich variants of geranium (Pelargonium sp.). Flavour Frag. J. 1998, 13, 389–392. [Google Scholar] [CrossRef]
  5. Liu, J.H.; Gao, L.X.; Gao, Y.Q.; Huo, X. Study on the chemical constituents of volatile oil from Radix Flemingiae Philippinensis. Chin. Tradit. Pat. Med. 2003, 6, 485–487. [Google Scholar]
  6. Maeder, M. Evolving factor analysis for the resolution of overlapping chromatographic peaks. Anal. Chem. 1987, 59, 527–530. [Google Scholar] [CrossRef]
  7. Maeder, M.; Zilian, A. Evolving factor analysis, a new multivariate technique in chromatography. Chemom. Intell. Lab. Syst. 1988, 3, 205–213. [Google Scholar] [CrossRef]
  8. Malinowski, E.R. Window factor analysis, theoretic derivation and application to flow injection analysis data. J. Chemometr. 1992, 6, 29–40. [Google Scholar] [CrossRef]
  9. Kvalheim, O.M.; Liang, Y.Z. Heuristic evolving latent projections: Resolving two-way multicomponent data. Part 1. Selectivity, latent projective graph, datascope, local rank and unique resolution. Anal. Chem. 1992, 64, 936–946. [Google Scholar] [CrossRef]
  10. Liang, Y.Z.; Kvalheim, O.M.; Keller, H.R.; Massart, D.L.; Kiechle, P.; Erni, F. Heuristic evolving latent projections: Resolving two-way multicomponent data. Part 2: Detection and resolution of minor constituents. Anal. Chem. 1992, 64, 946–953. [Google Scholar] [CrossRef]
  11. Manne, R.; Shen, H.L.; Liang, Y.Z. Subwindow factor analysis. Chemom. Intell. Lab. Syst. 1999, 45, 171–176. [Google Scholar] [CrossRef]
  12. Shen, H.L.; Manne, R.; Xu, Q.S.; Chen, D.Z.; Liang, Y.Z. Local resolution of hyphenated chromatographic data. Chemom. Intell. Lab. Syst. 1999, 45, 323–330. [Google Scholar] [CrossRef]
  13. Guo, F.Q.; Liang, Y.Z.; Xu, C.J; Huang, L.F.; Li, X.N. Comparison of the volatile constituents of Artemisia capillaris from different locations by gas chromatography-mass spectrometry and projection method. J. Chromatogr. A 2004, 1054, 73–79. [Google Scholar]
  14. Xu, X.N.; Tang, Z.H.; Liang, Y.Z.; Zhang, L.X.; Zeng, M.M.; Deng, J.H. Comparison of the volatile constituents of different parts of Cortex magnolia officinalis by GC–MS combined with chemometric resolution method. J.Sep.Sci. 2009, 32, 3466–3472. [Google Scholar] [CrossRef]
  15. Yi, L.Z.; Yuan, D.L.; Liang, Y.Z.; Xie, P.S.; Zhao, Y. F Ingerprinting alterations of secondary metabolites of tangerine peels during growth by HPLC-DAD and chemometric methods. Anal.Chim.Acta 2009, 649, 43–51. [Google Scholar] [CrossRef]
  16. Chinese Pharmacopoeia Committee, Chinese Pharmacopoeia (2000). Publishing House of People’s Health: Beijing, China; Volume Appendix 62.
  17. Sanchez, F.C.; Rutan, S.C.; Gil Garcia, N.D. Resolution of multicomponent overlapped peaks by the orthogonal projection approach, evolving factor analysis and window factor analysis. Chemom. Intell. Lab. Syst. 1997, 36, 153–164. [Google Scholar] [CrossRef]
  18. Liang, Y.Z. White, Grey and Black Multicomponent Systems and Their Chemometric Algorithms; Hunan Publishing House of Science and Technology: Changsha, China, 1996. [Google Scholar]
  19. Li, X.N.; Liang, Y.Z.; Chau, F.T. Smoothing methods applied to dealing with heteroscedastic noise in GC/MS. Chemom. Intell. Lab. Syst. 2002, 63, 139–153. [Google Scholar] [CrossRef]

