Comparison of A and B Starch Granules from Three Wheat Varieties

Abstract
:1. Introduction
2. Results and Discussion
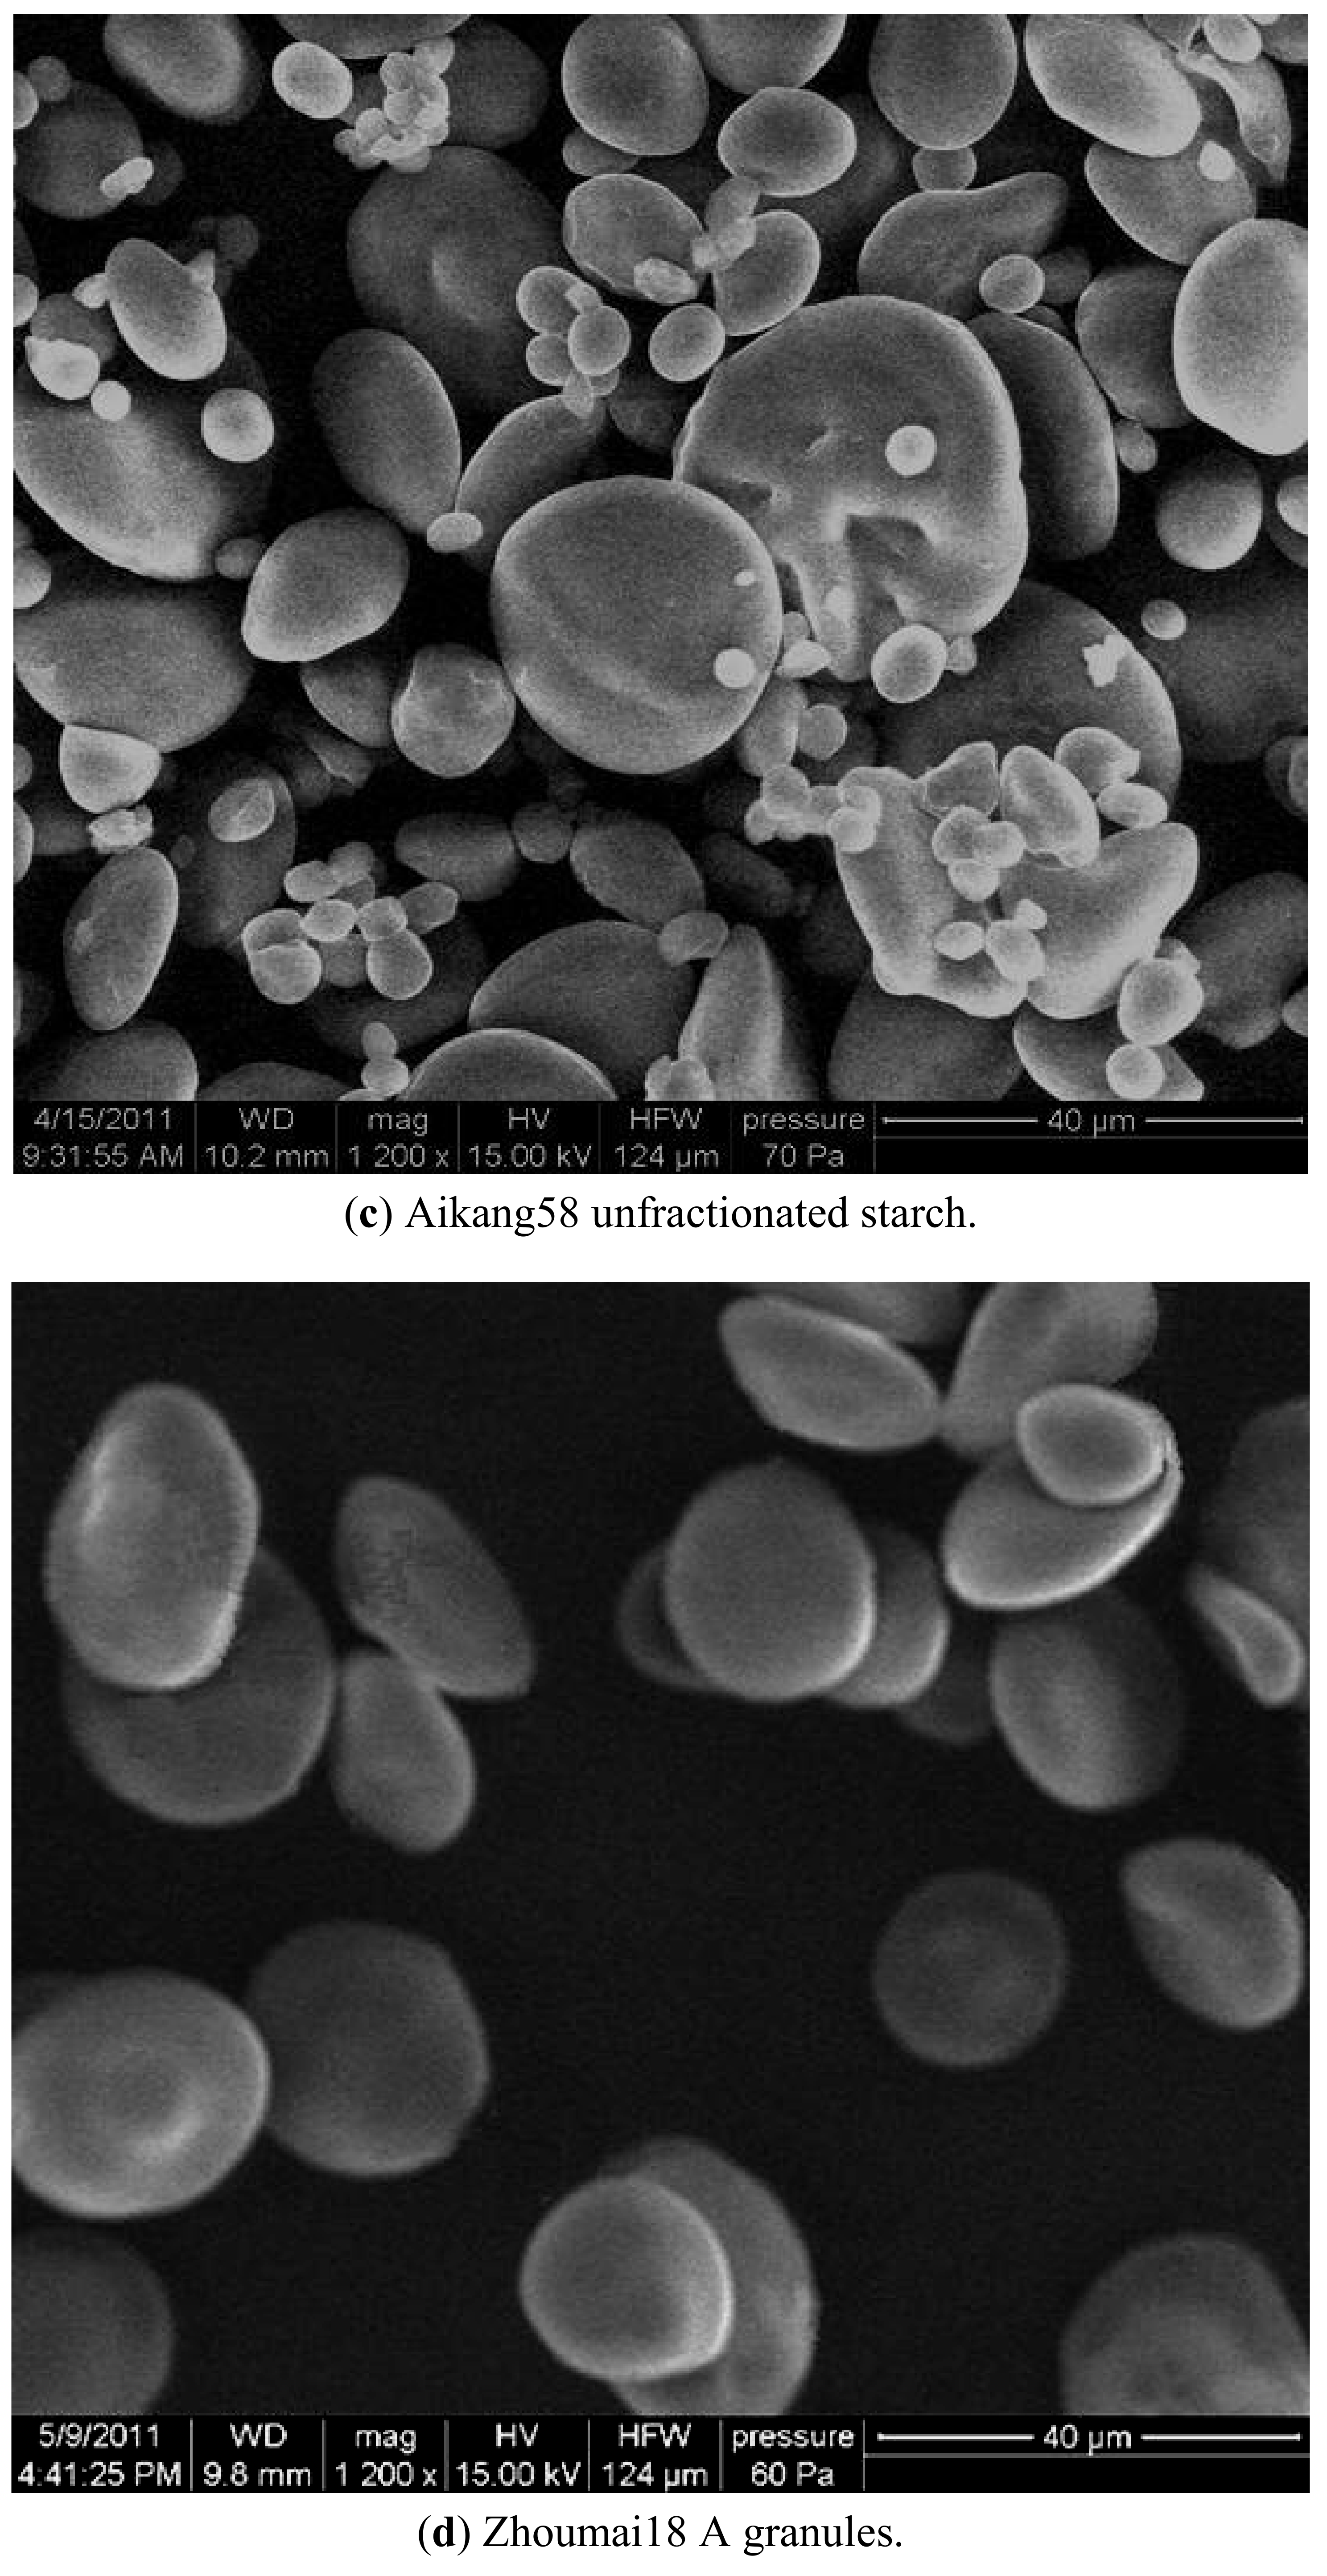
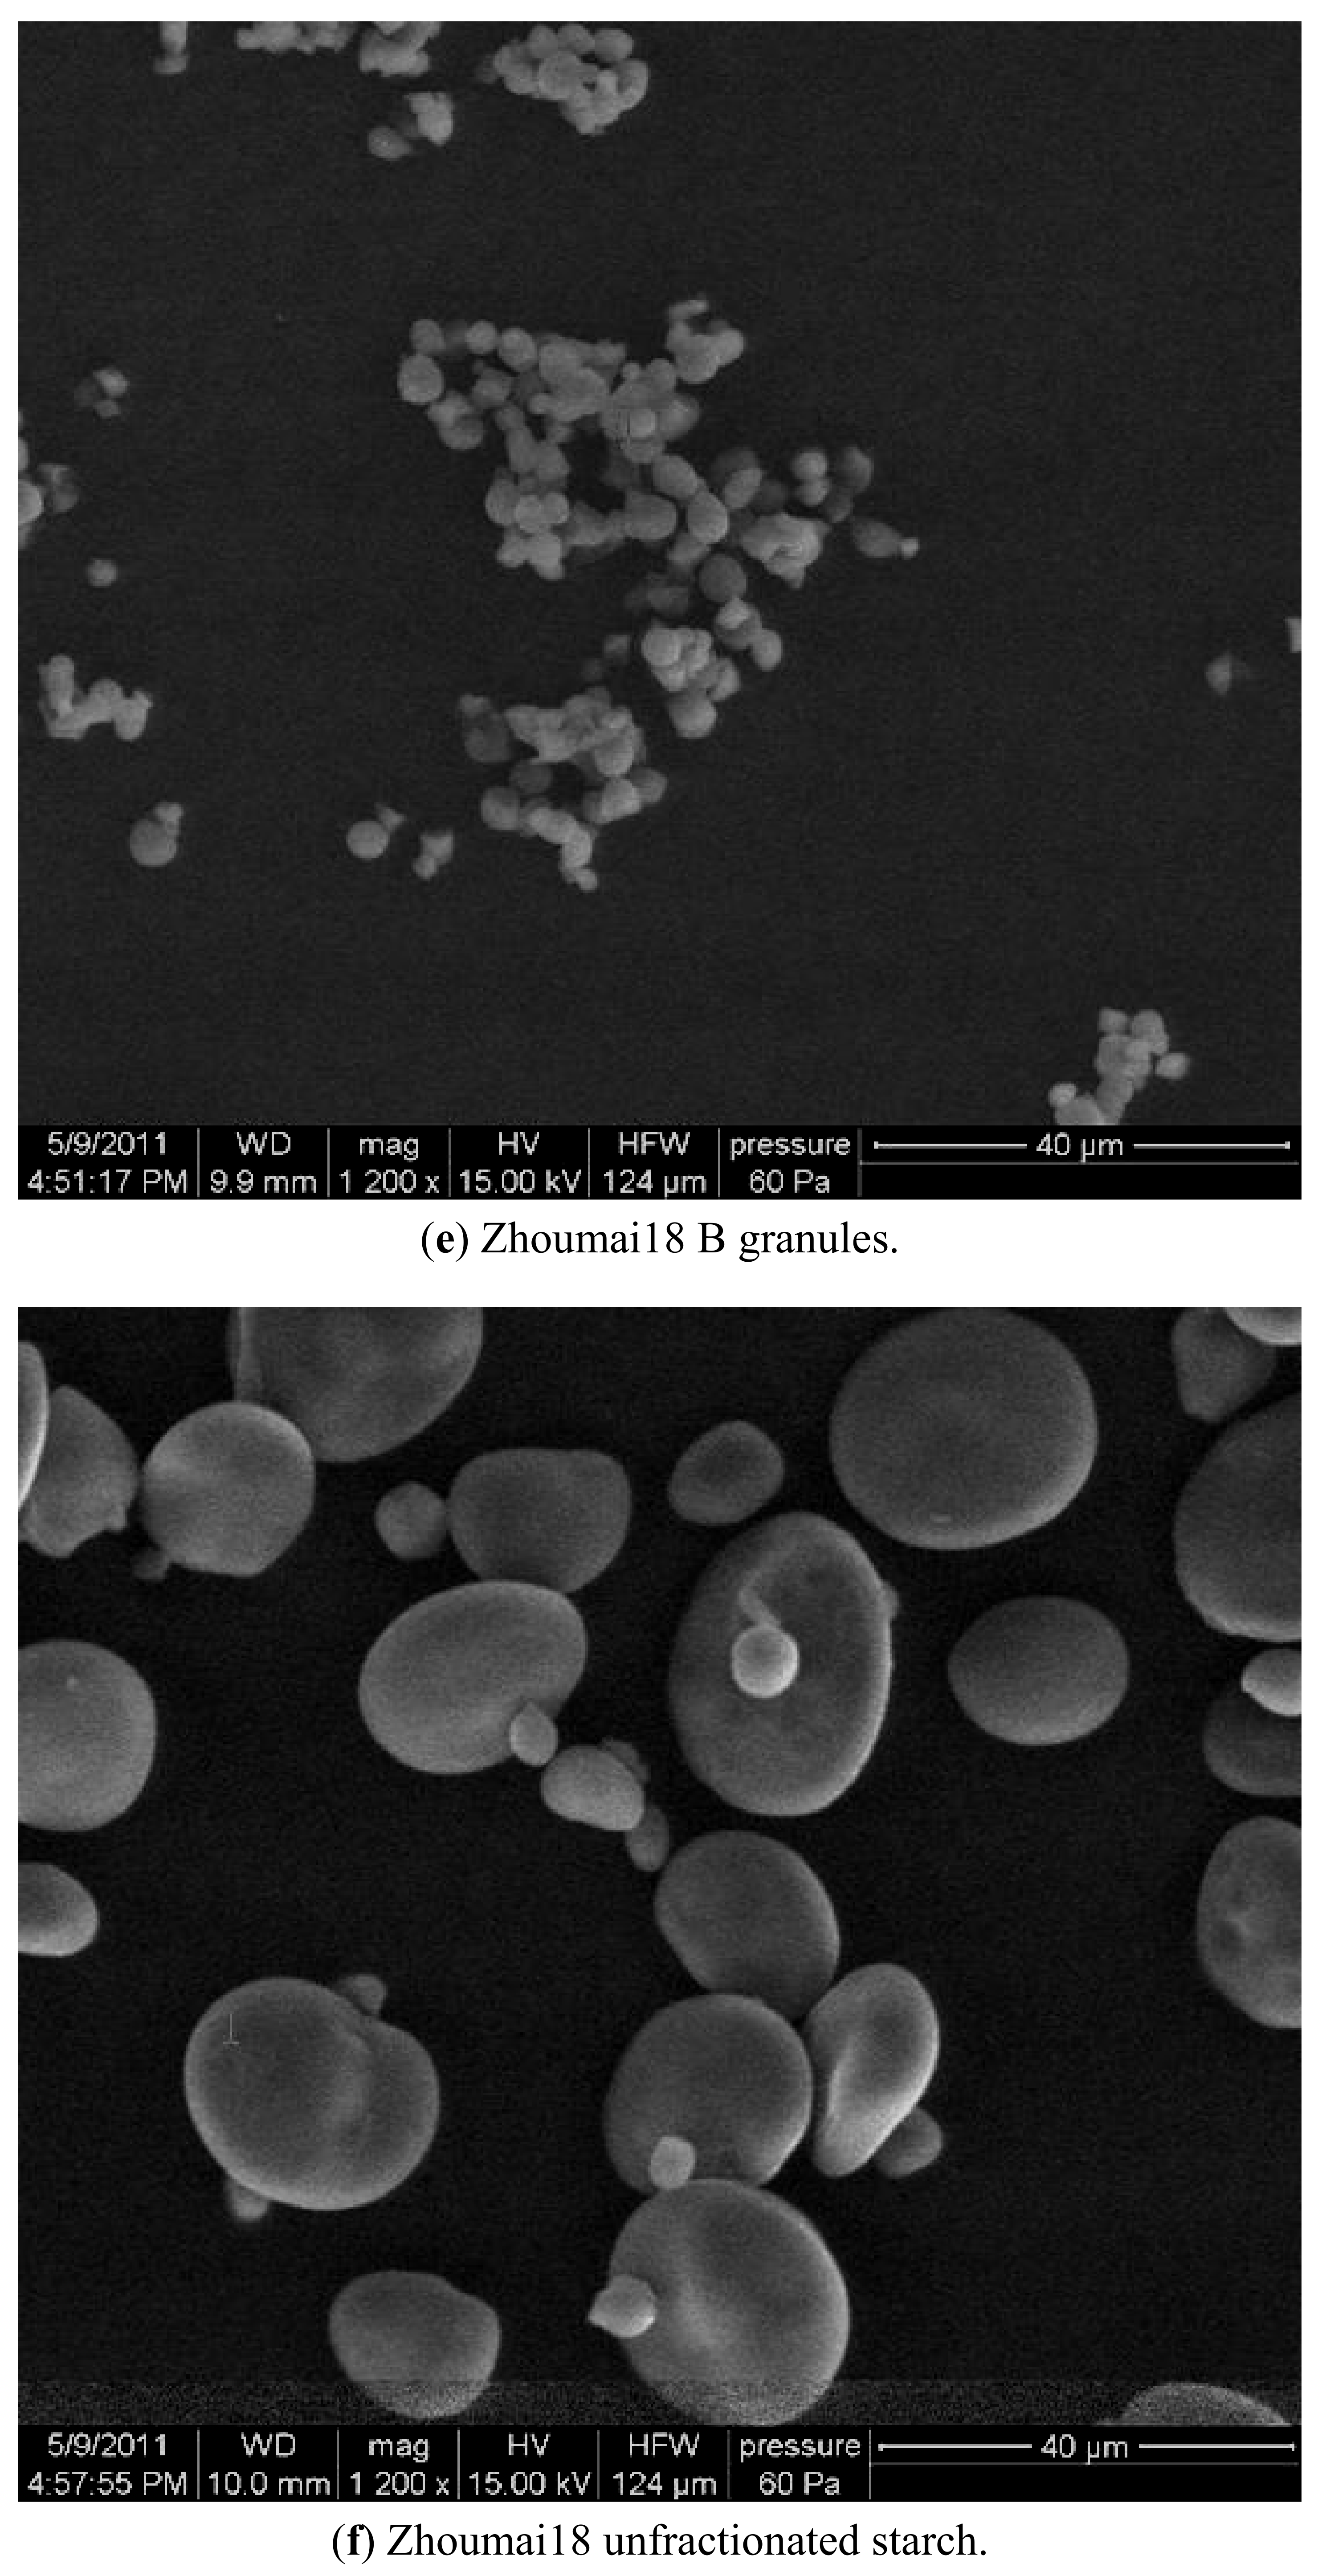
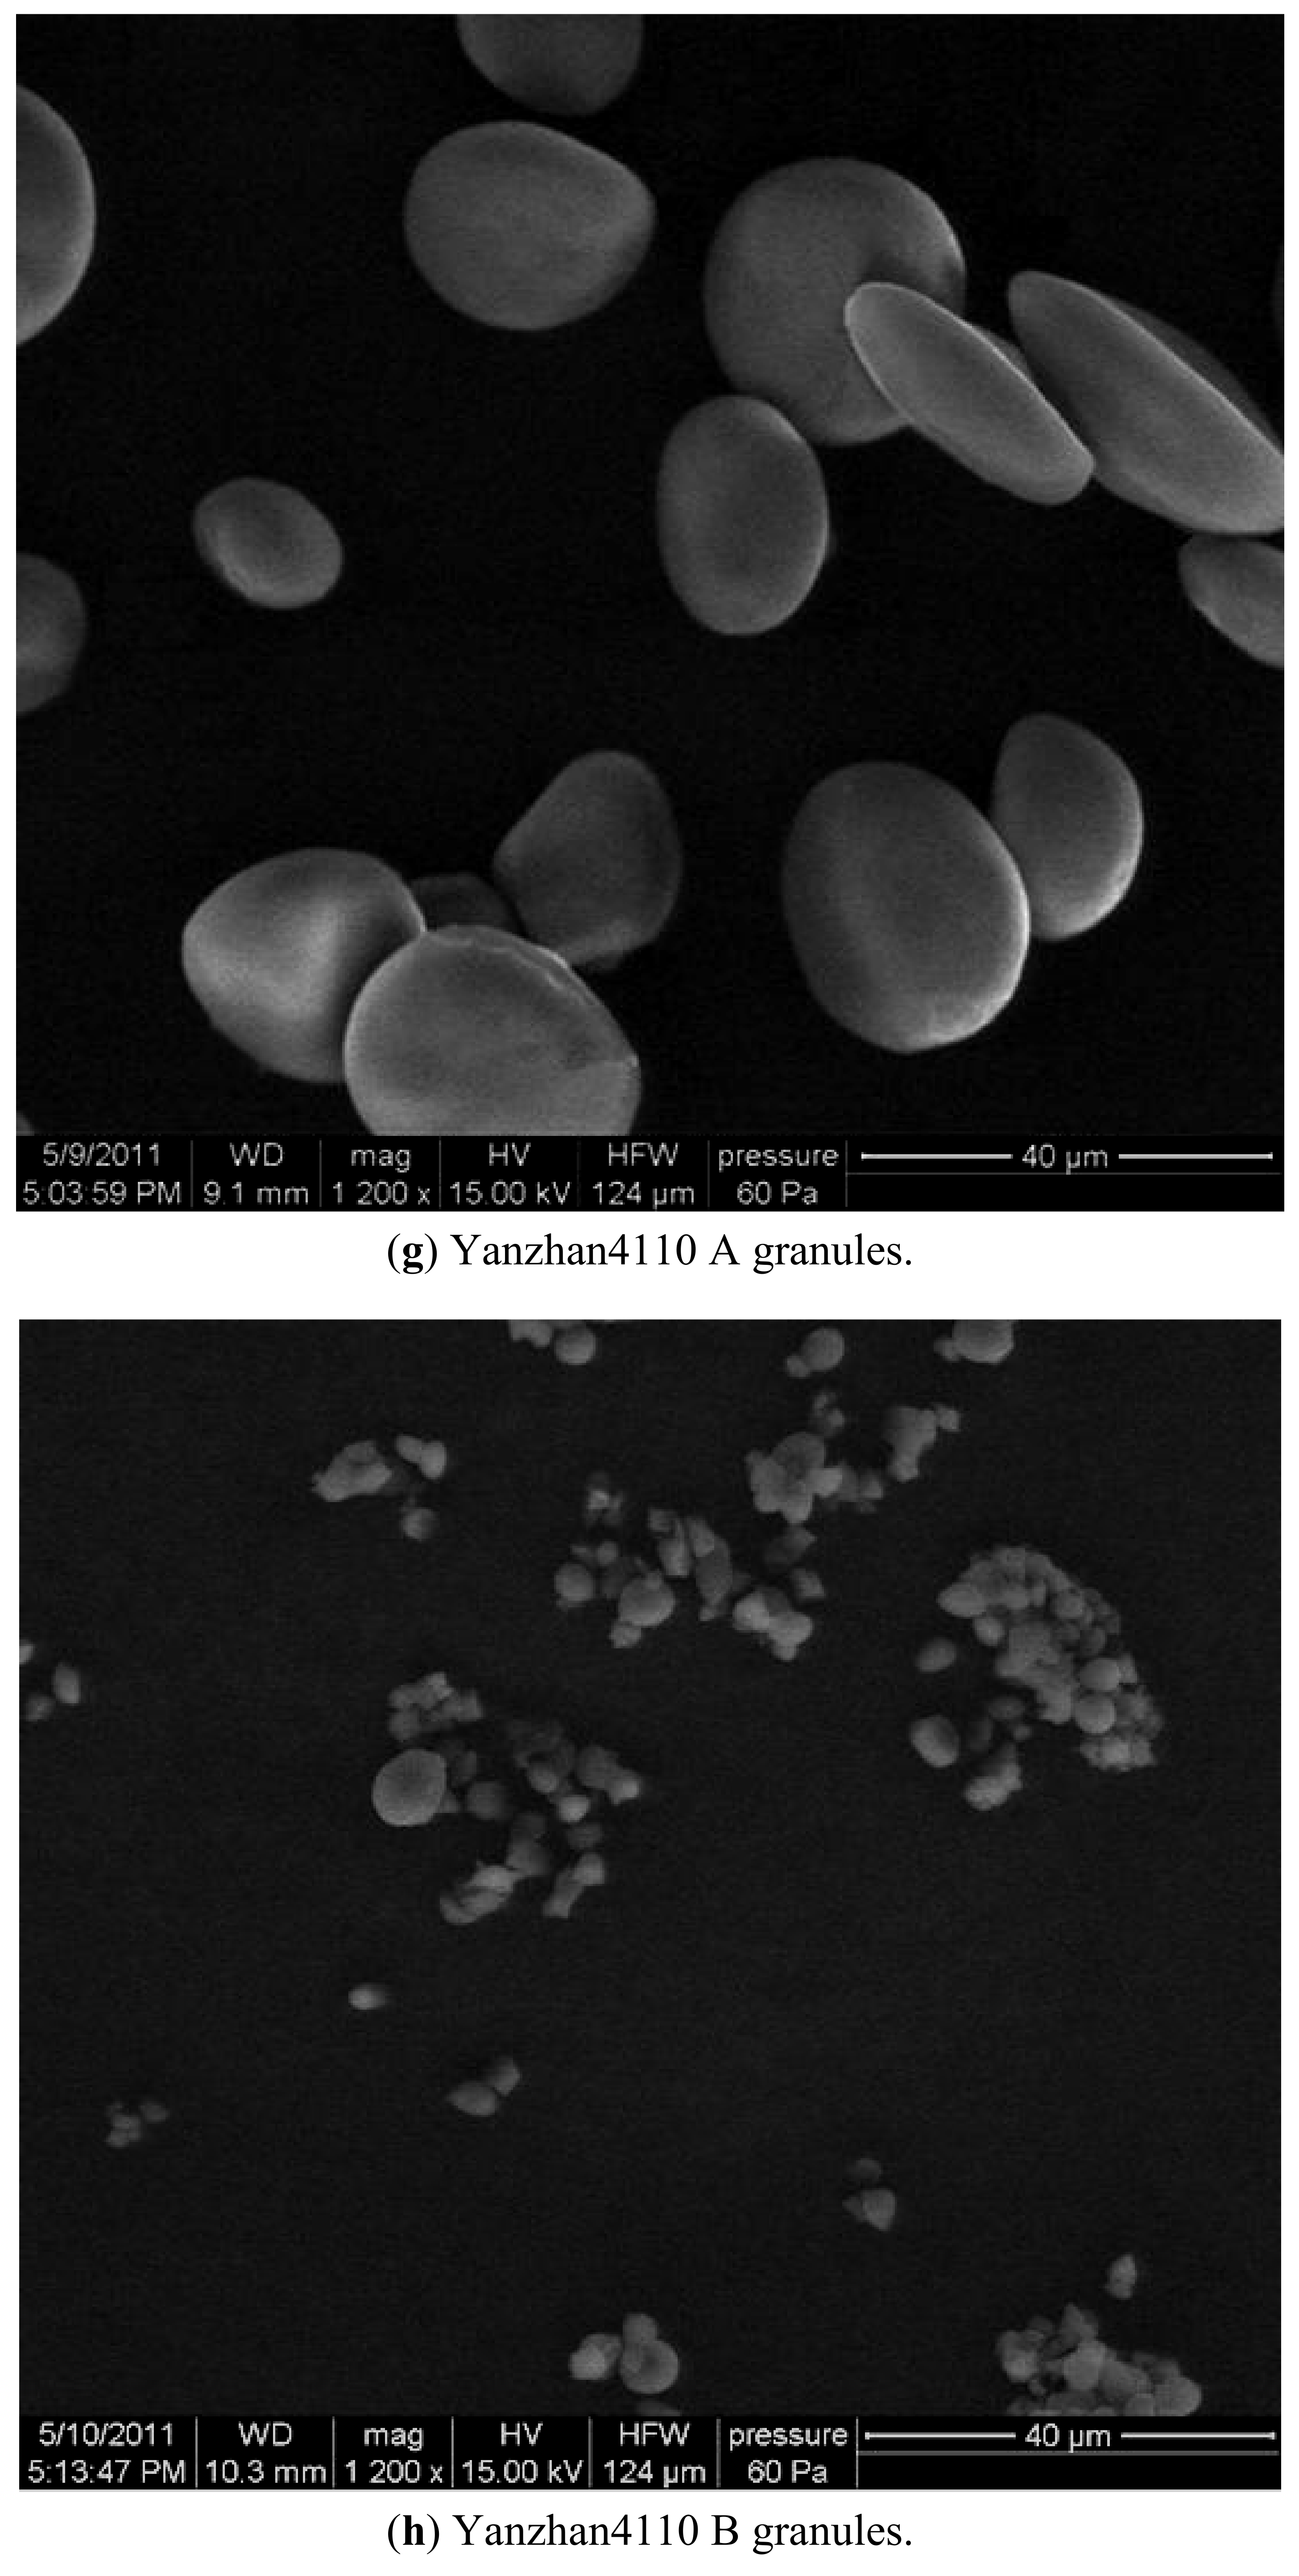
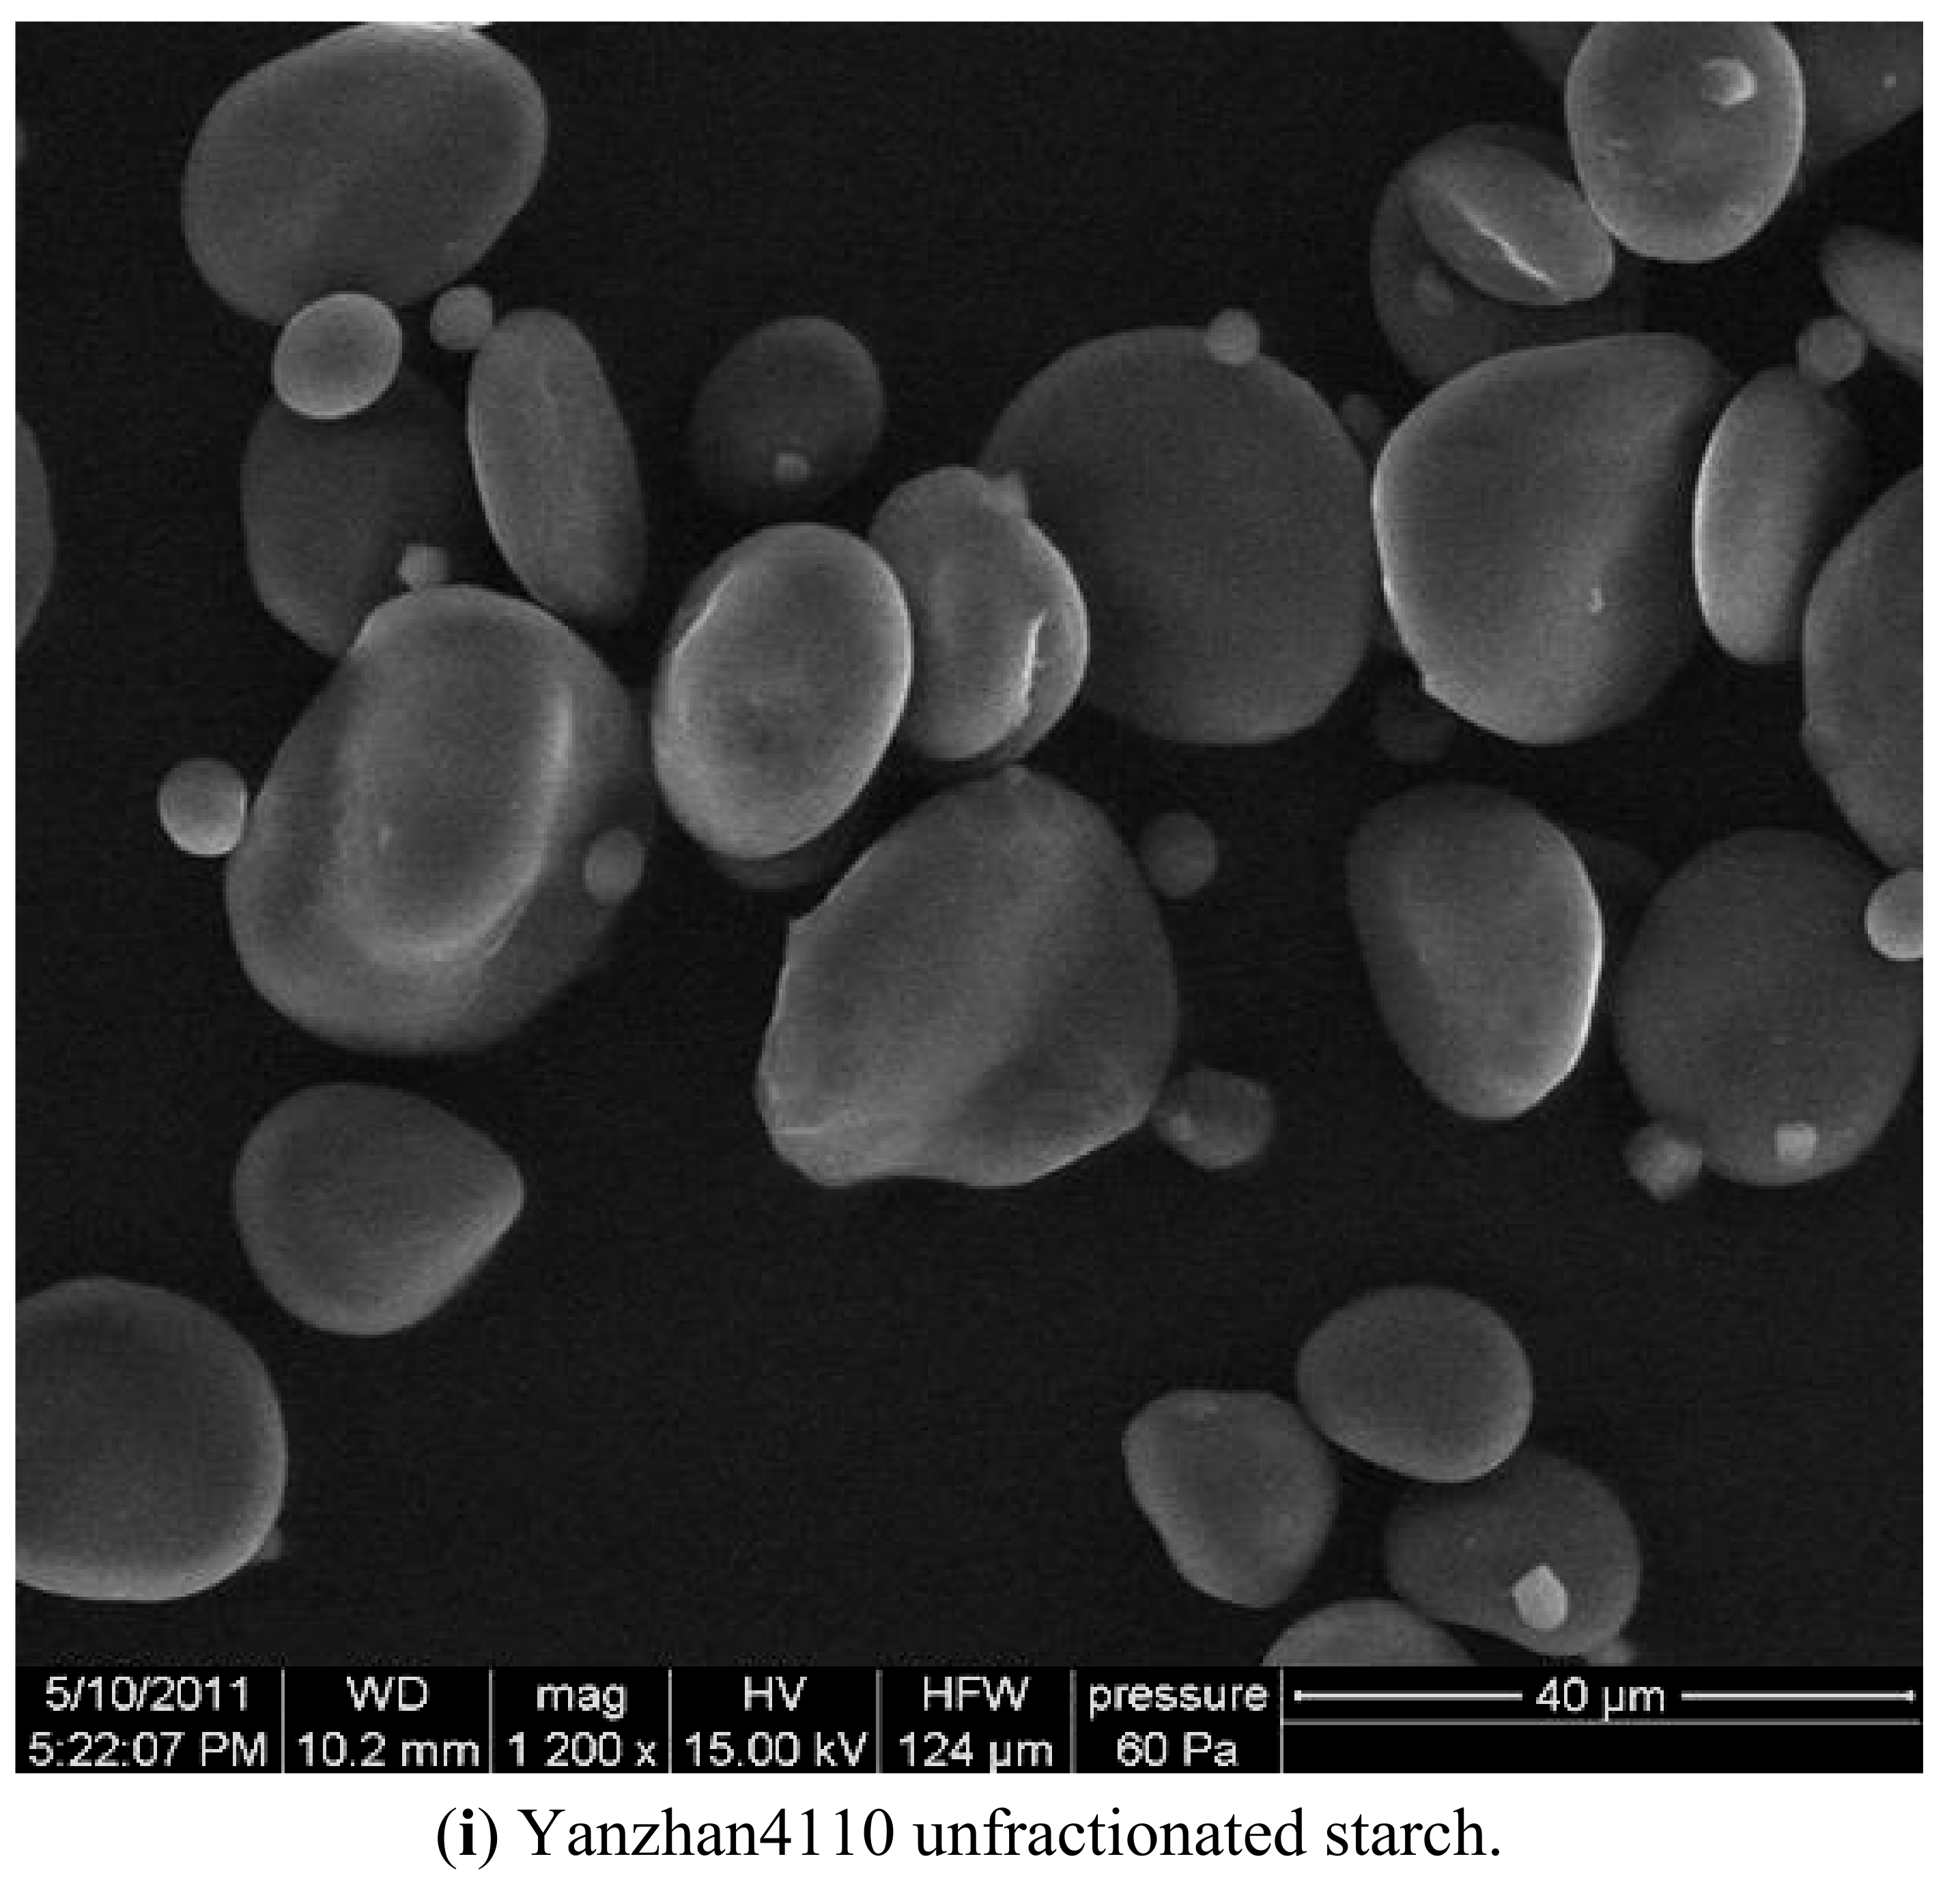
2.1. SEM Analysis


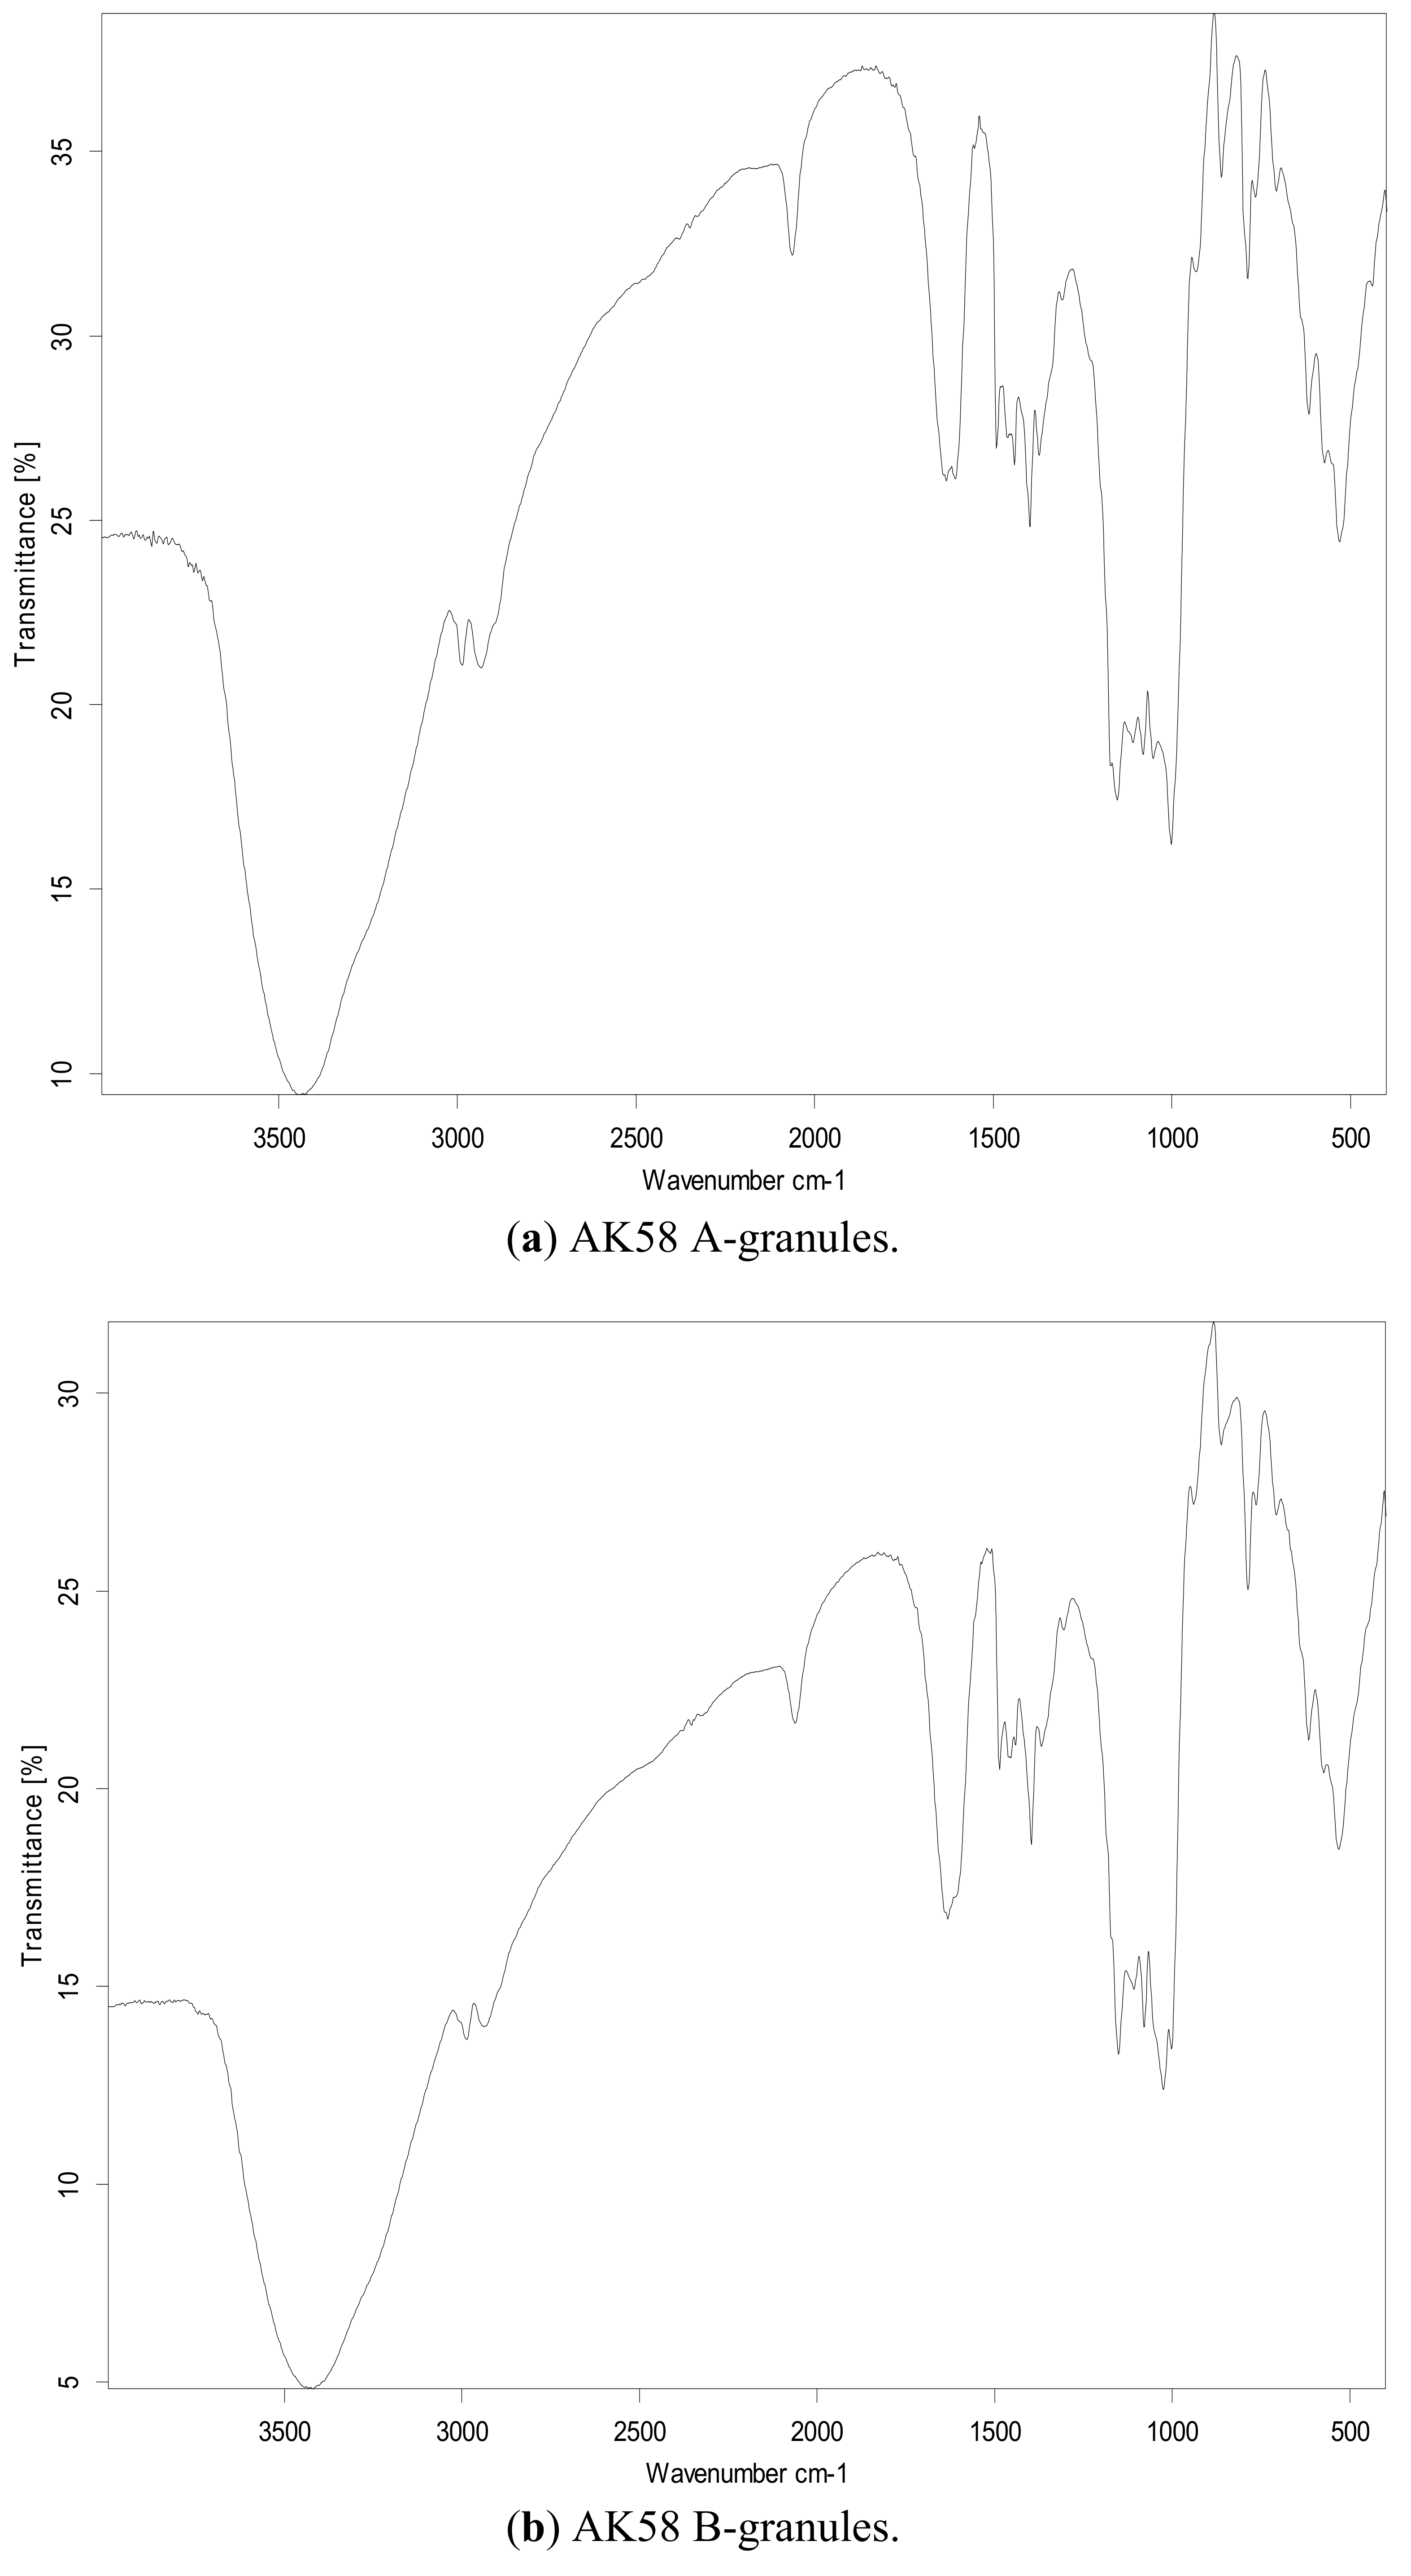
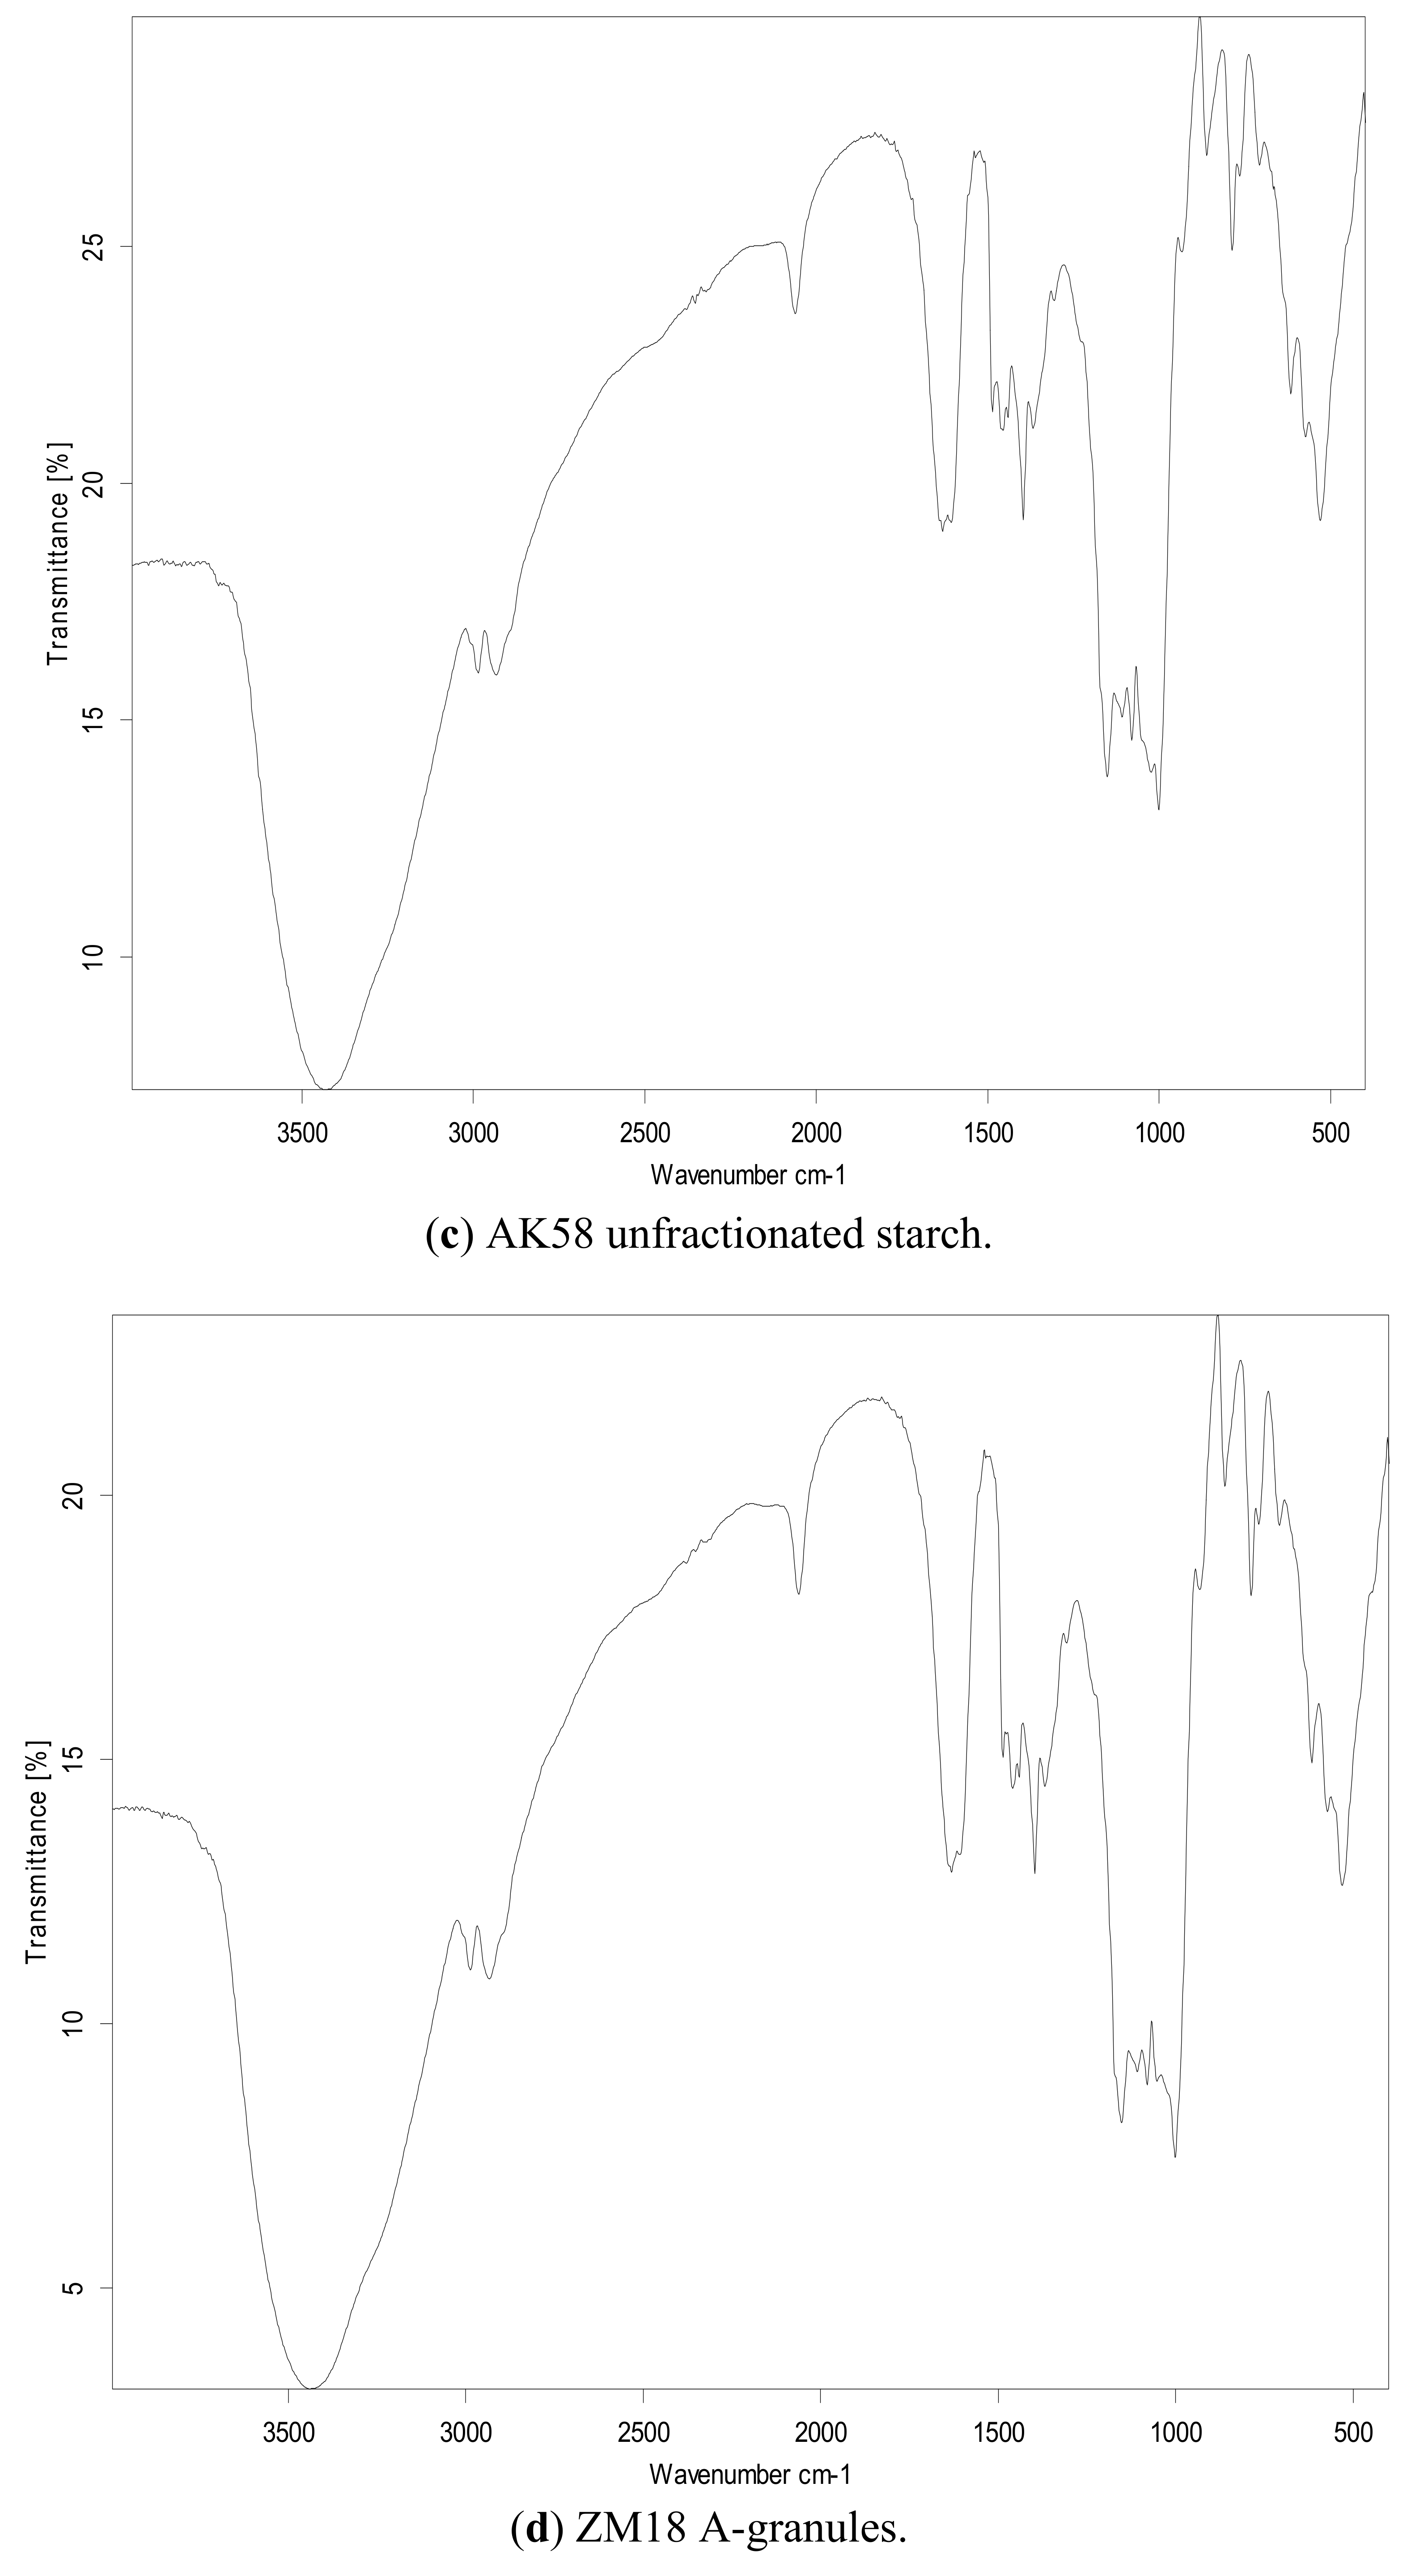
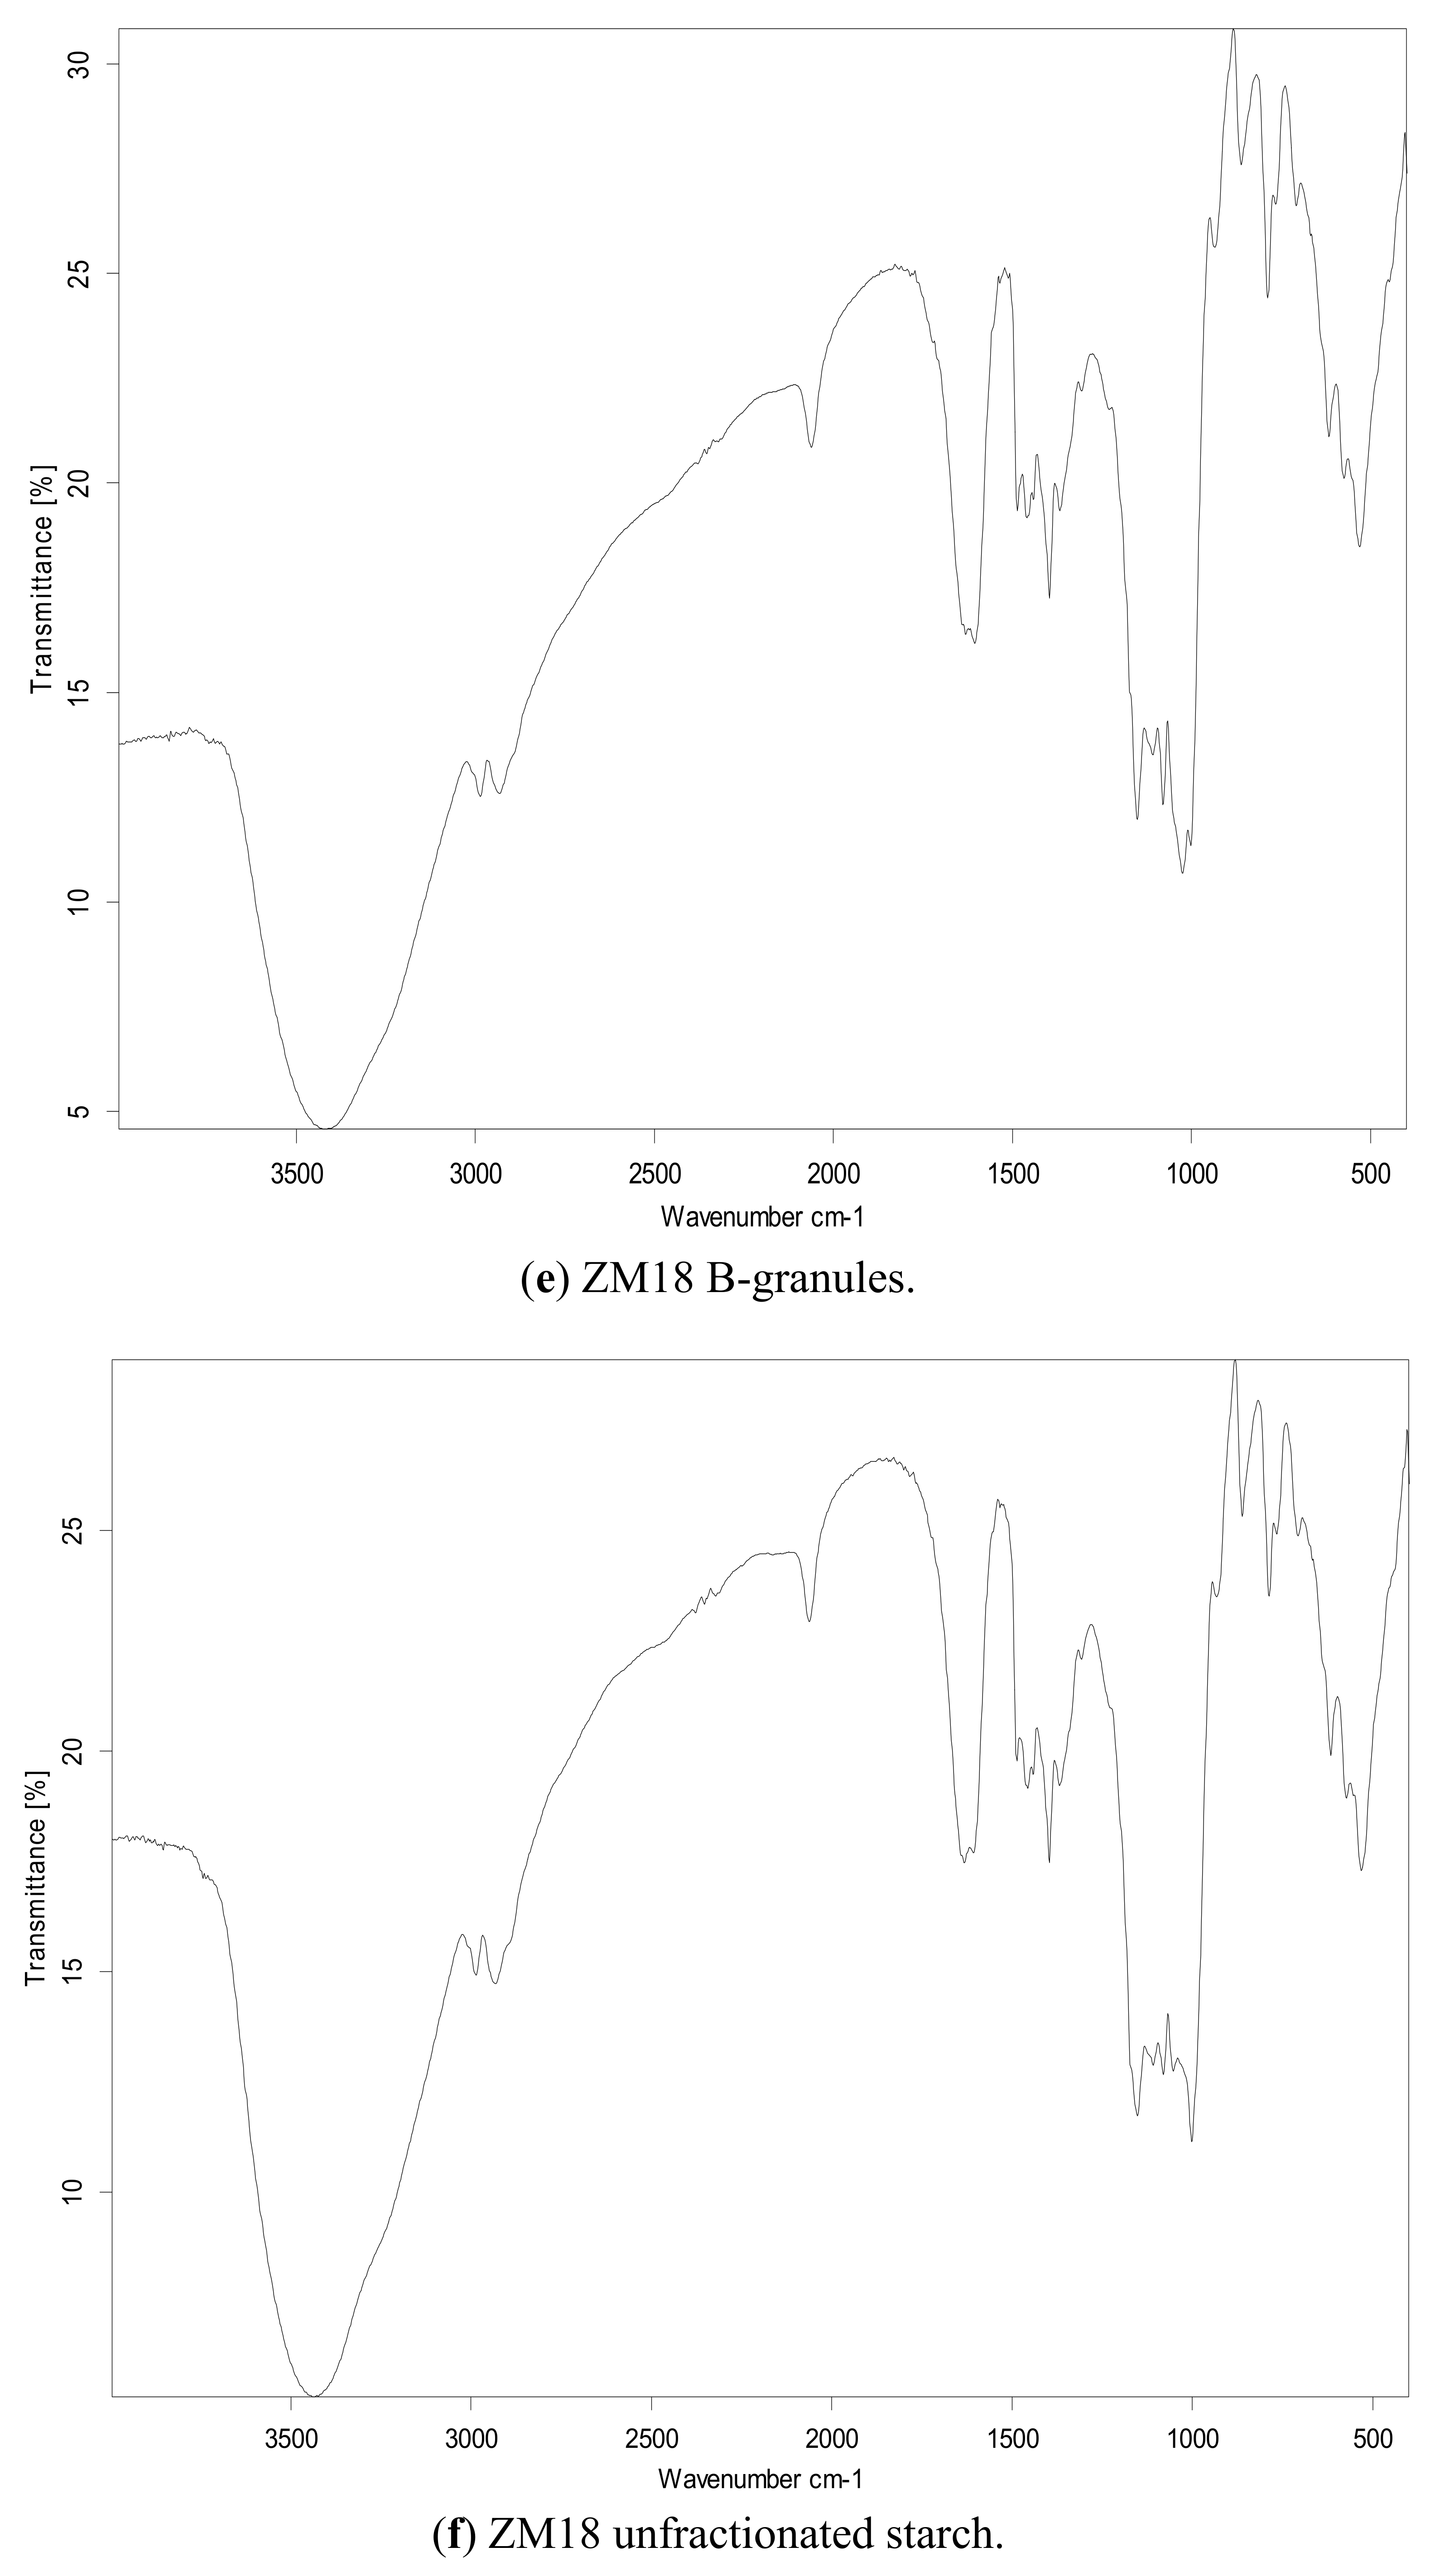
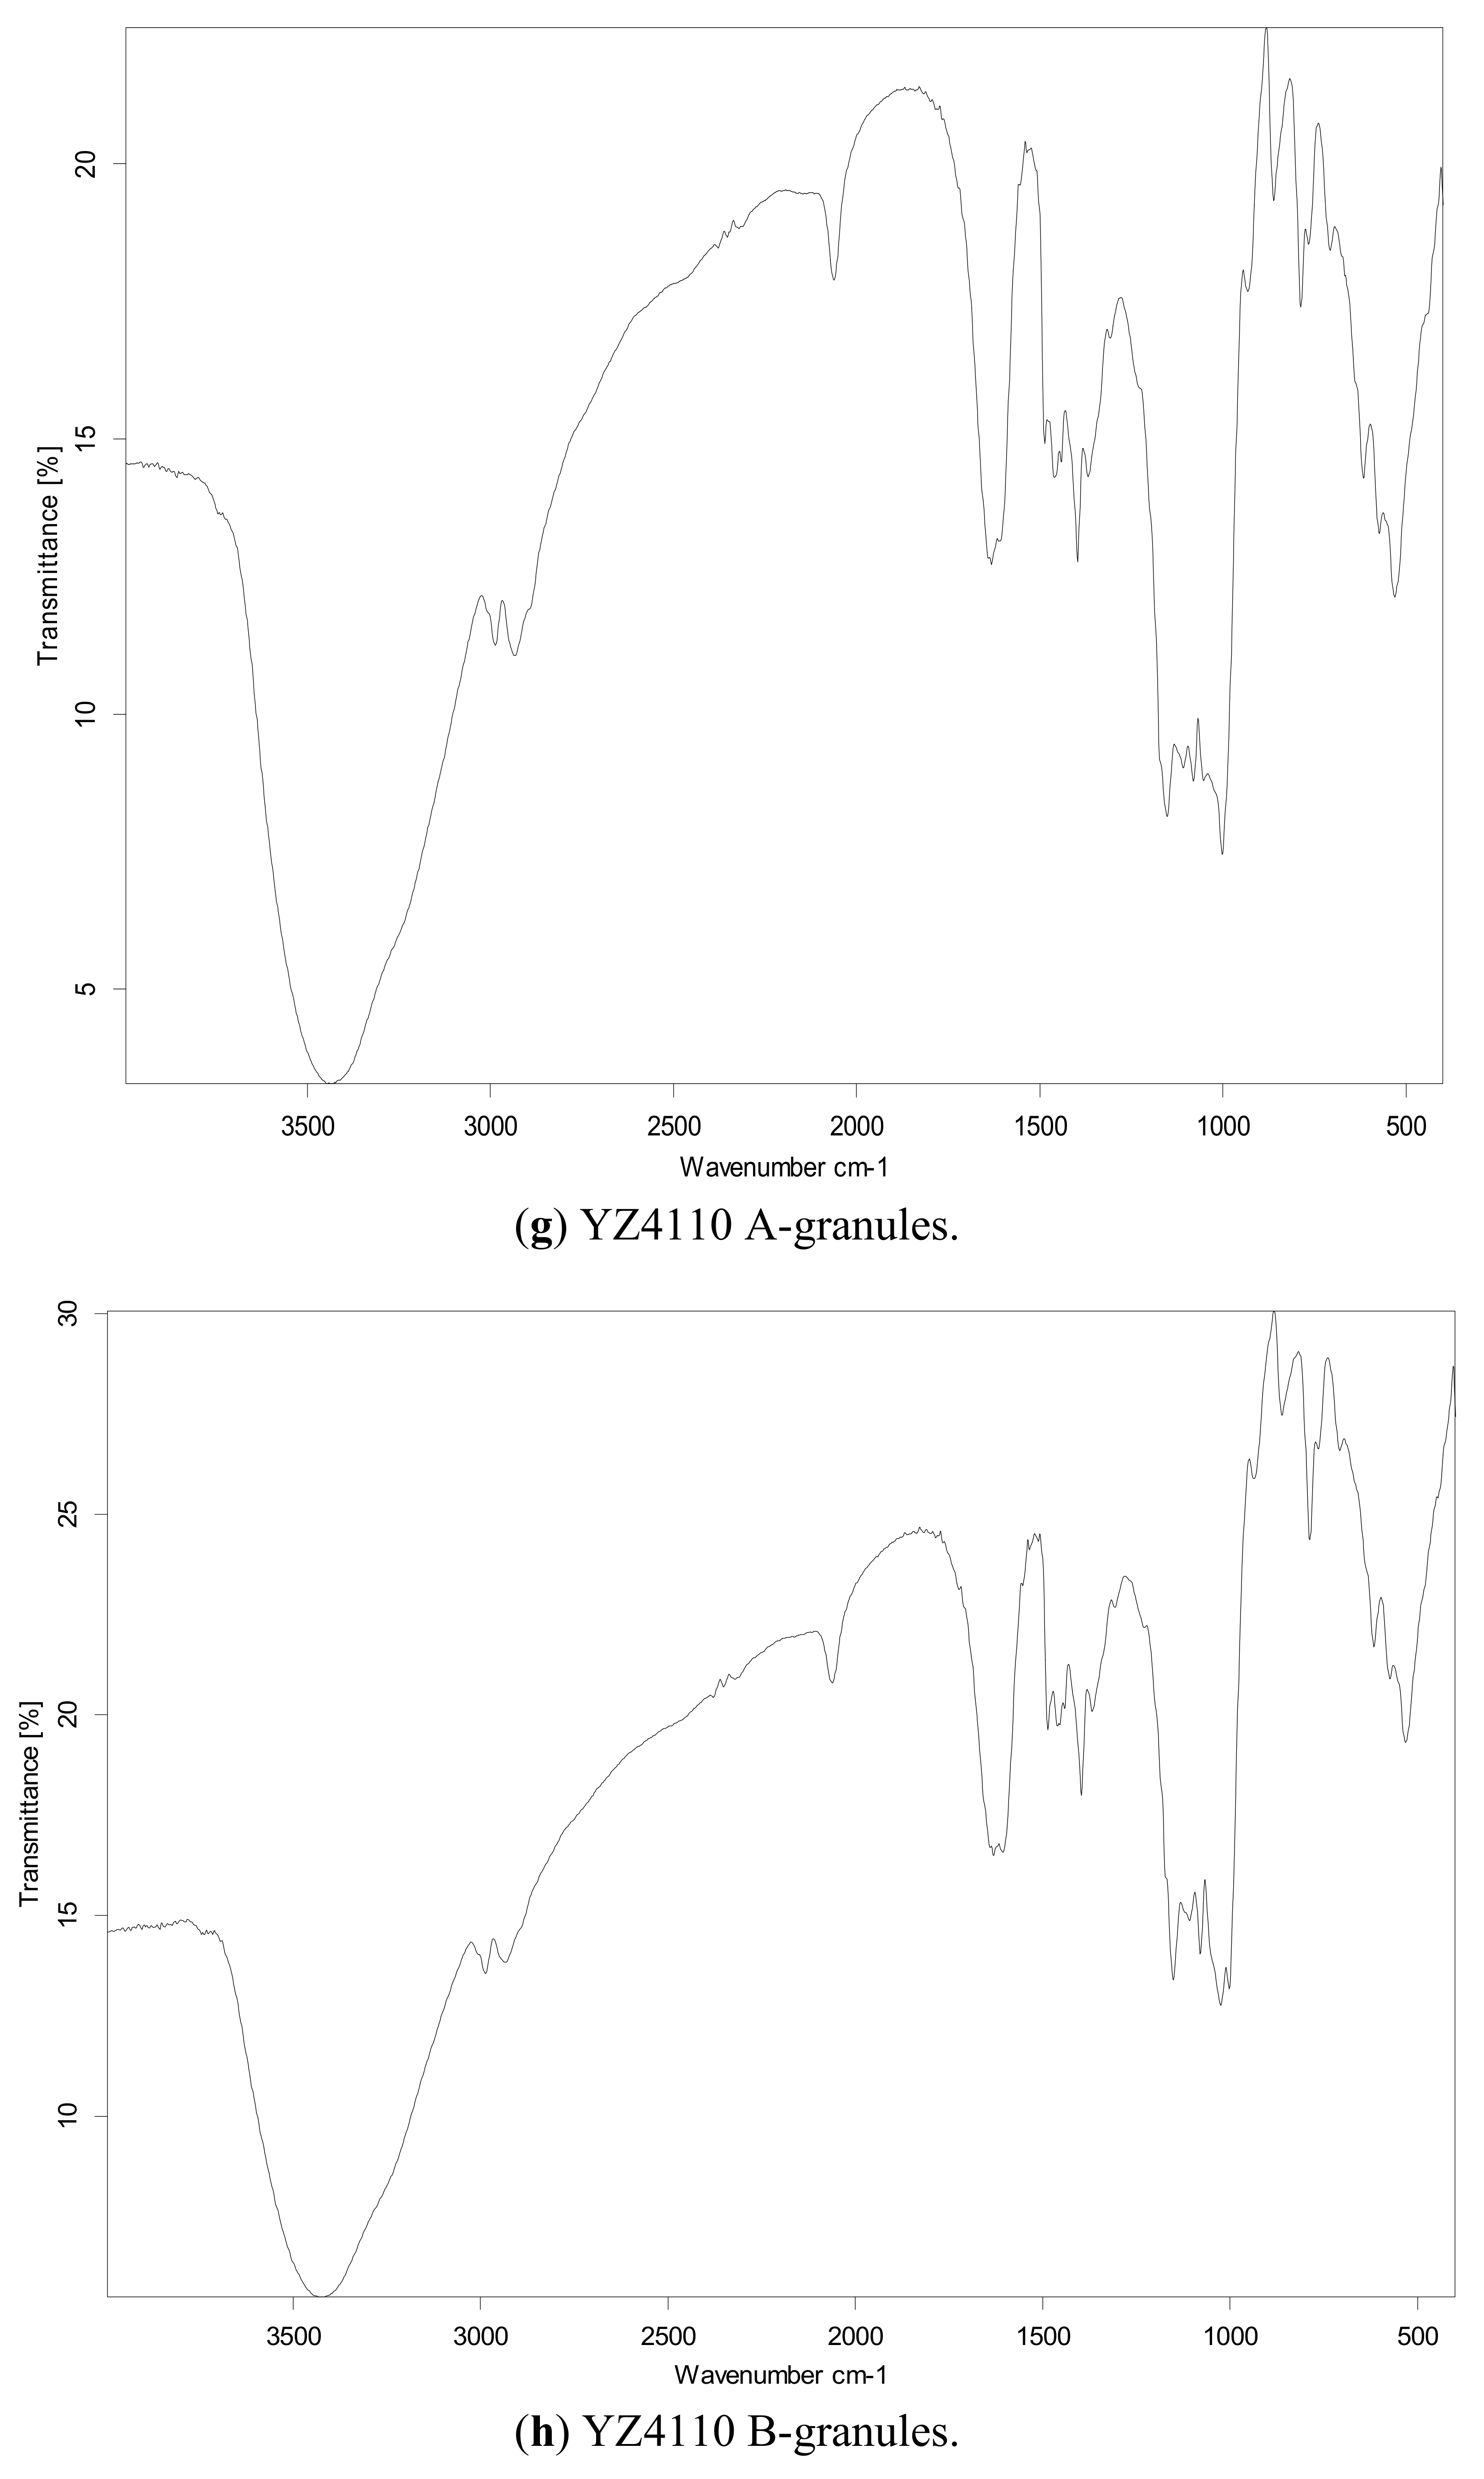
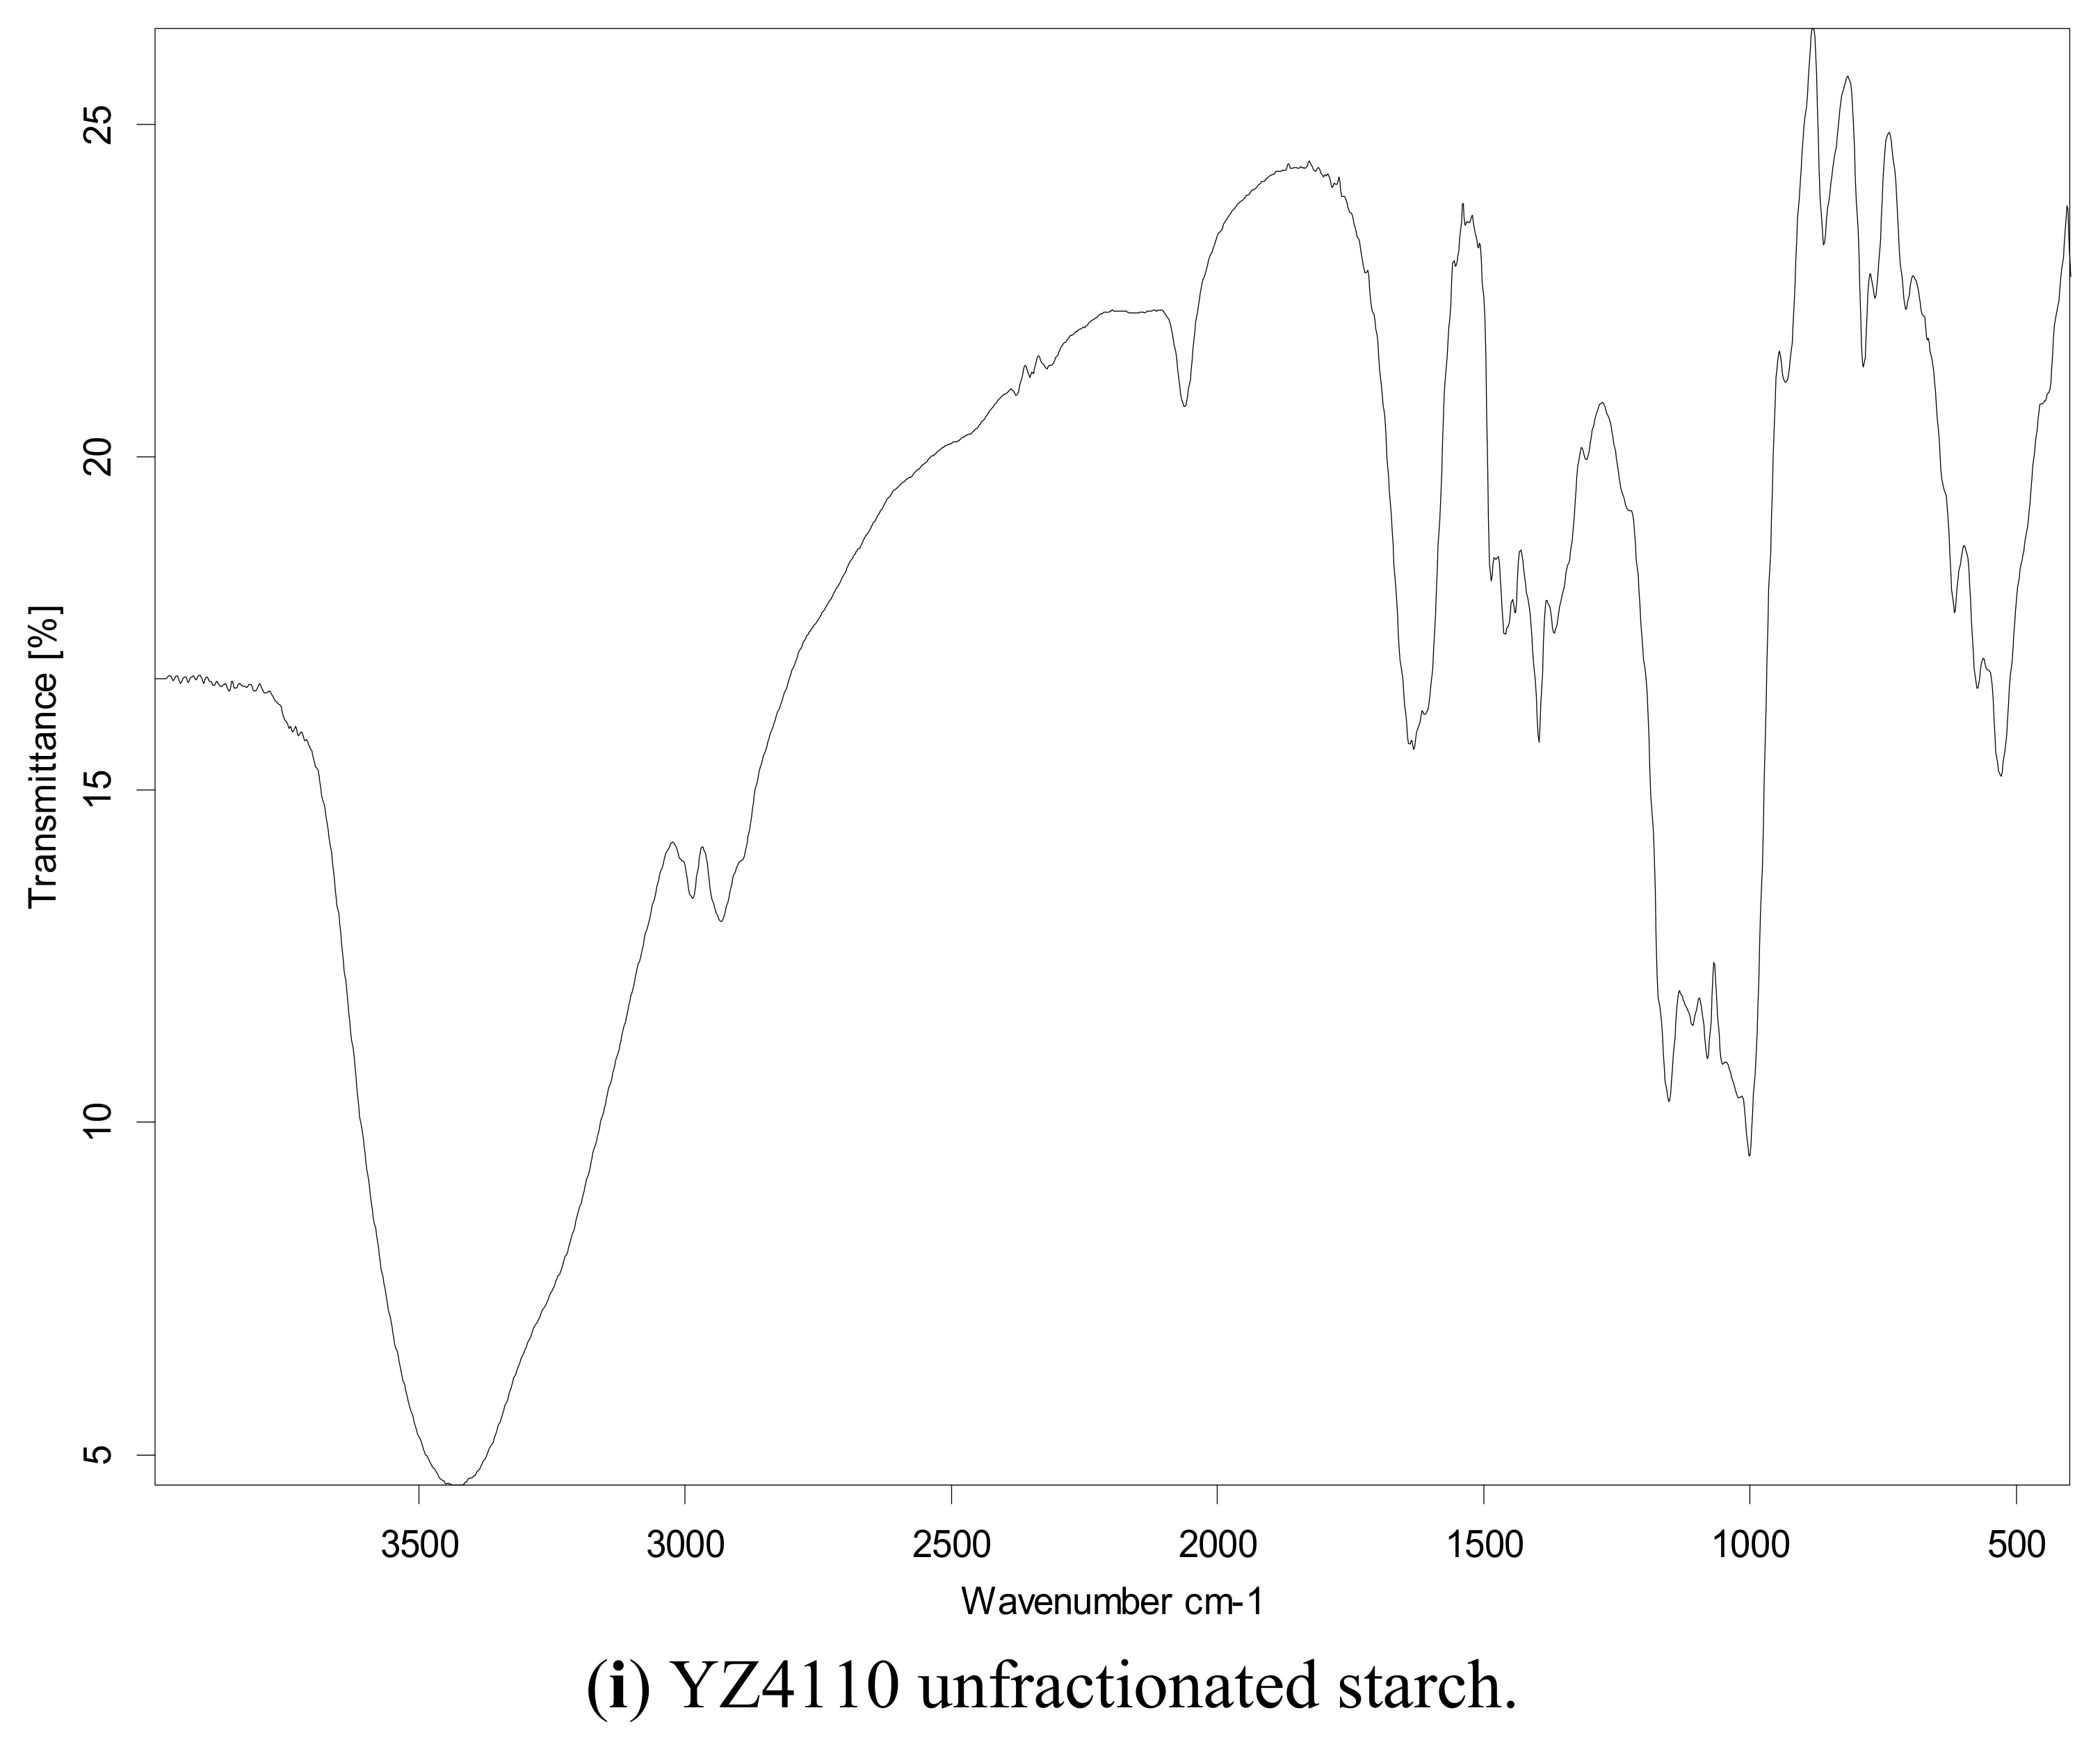
2.2. FT-IR Analysis


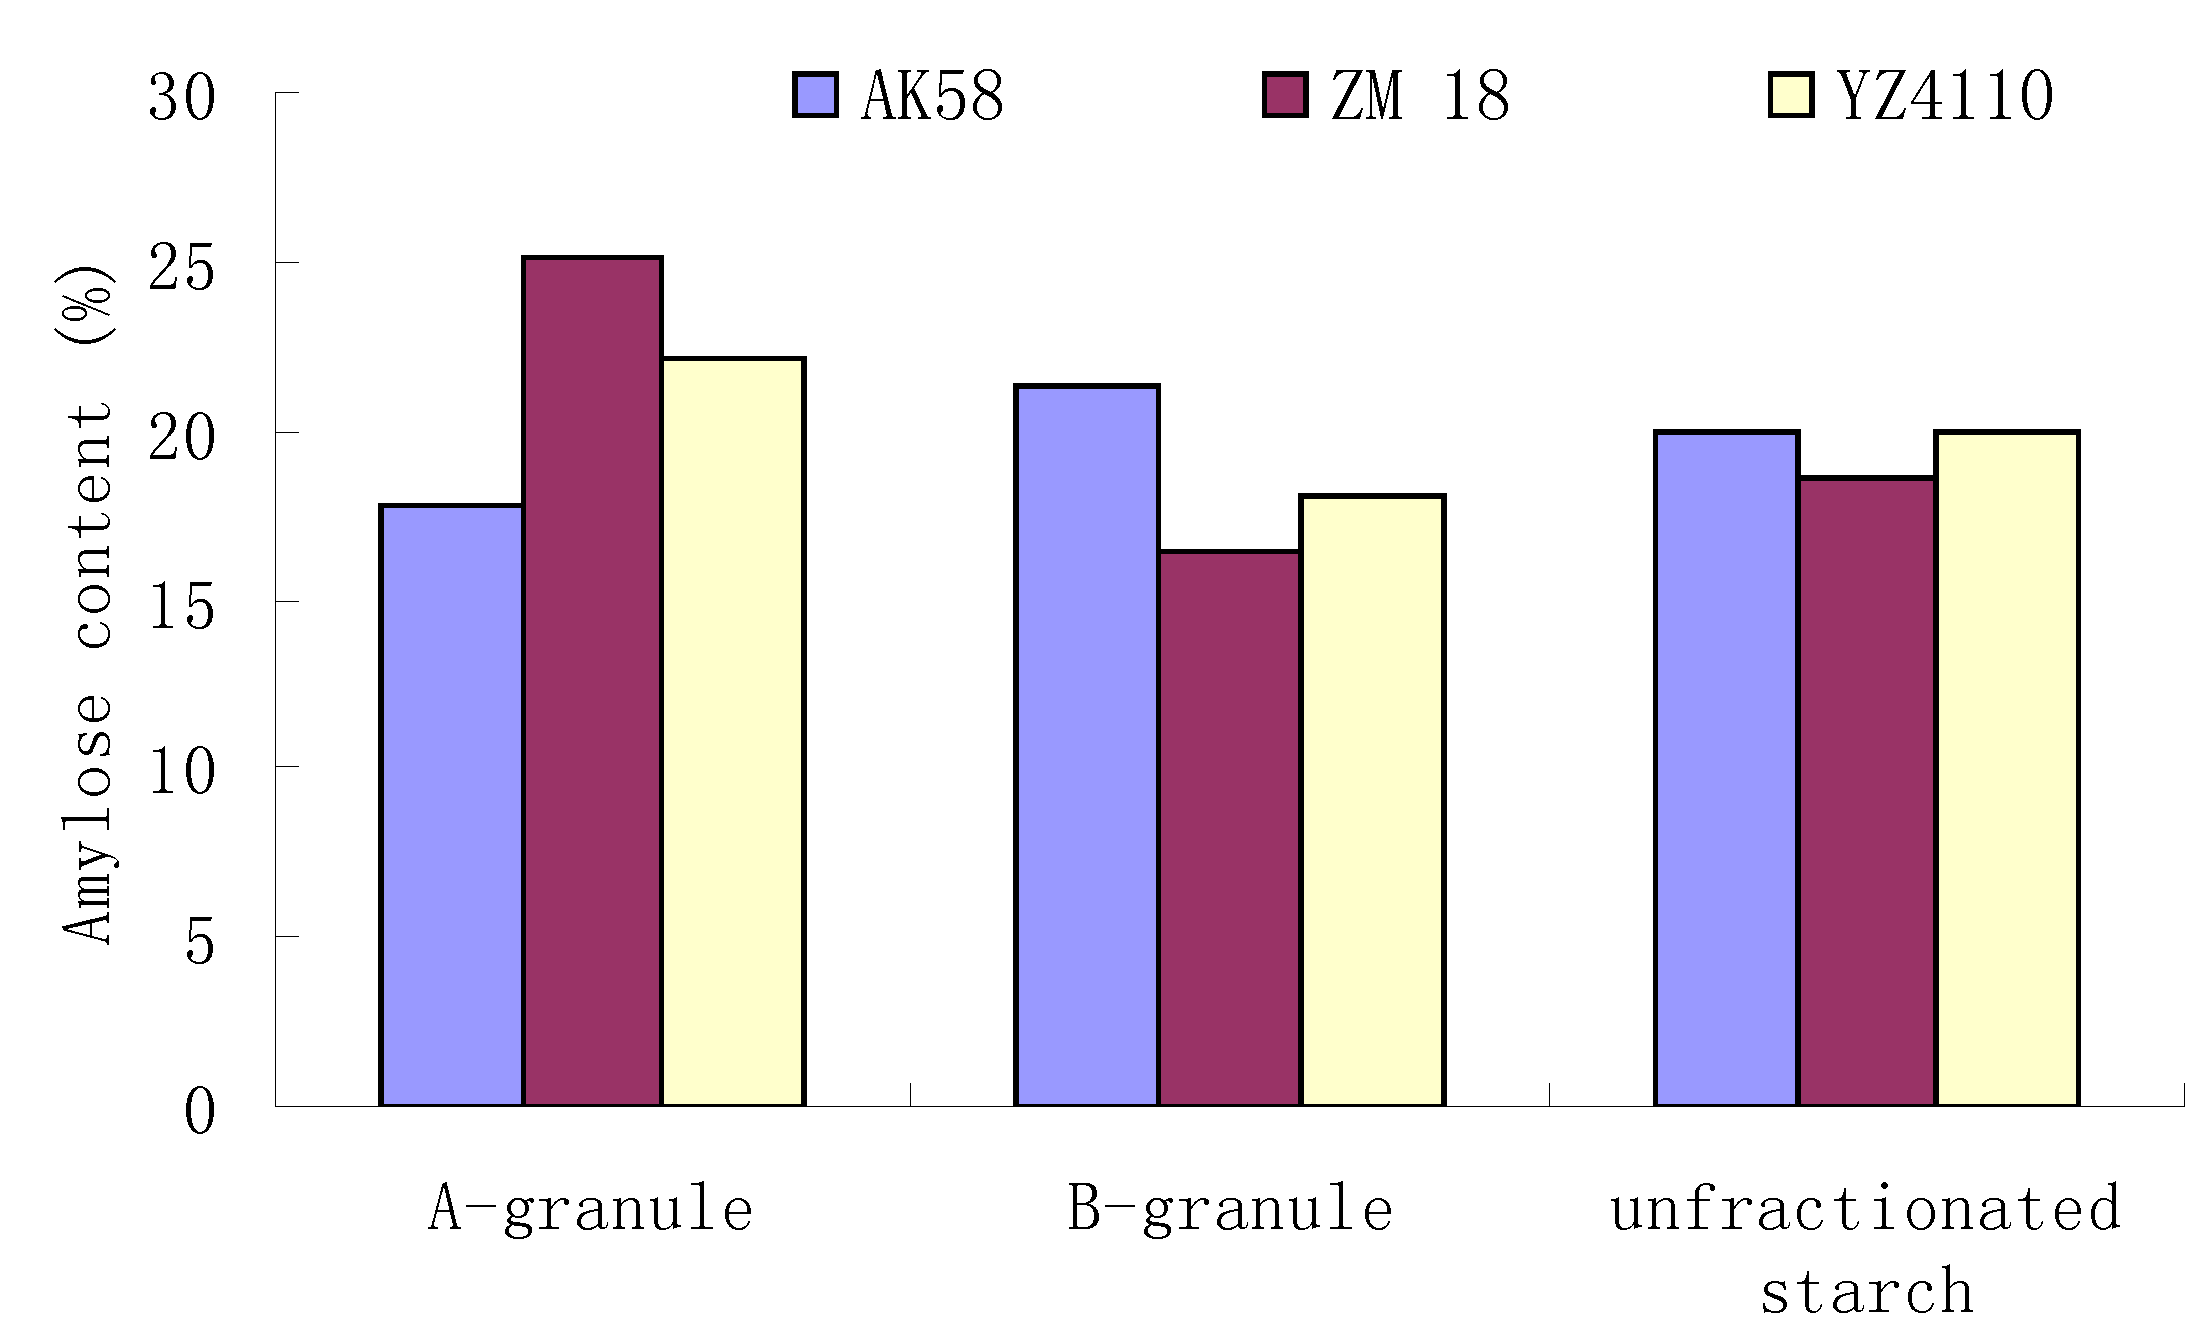
2.3. Amylose Content Analysis

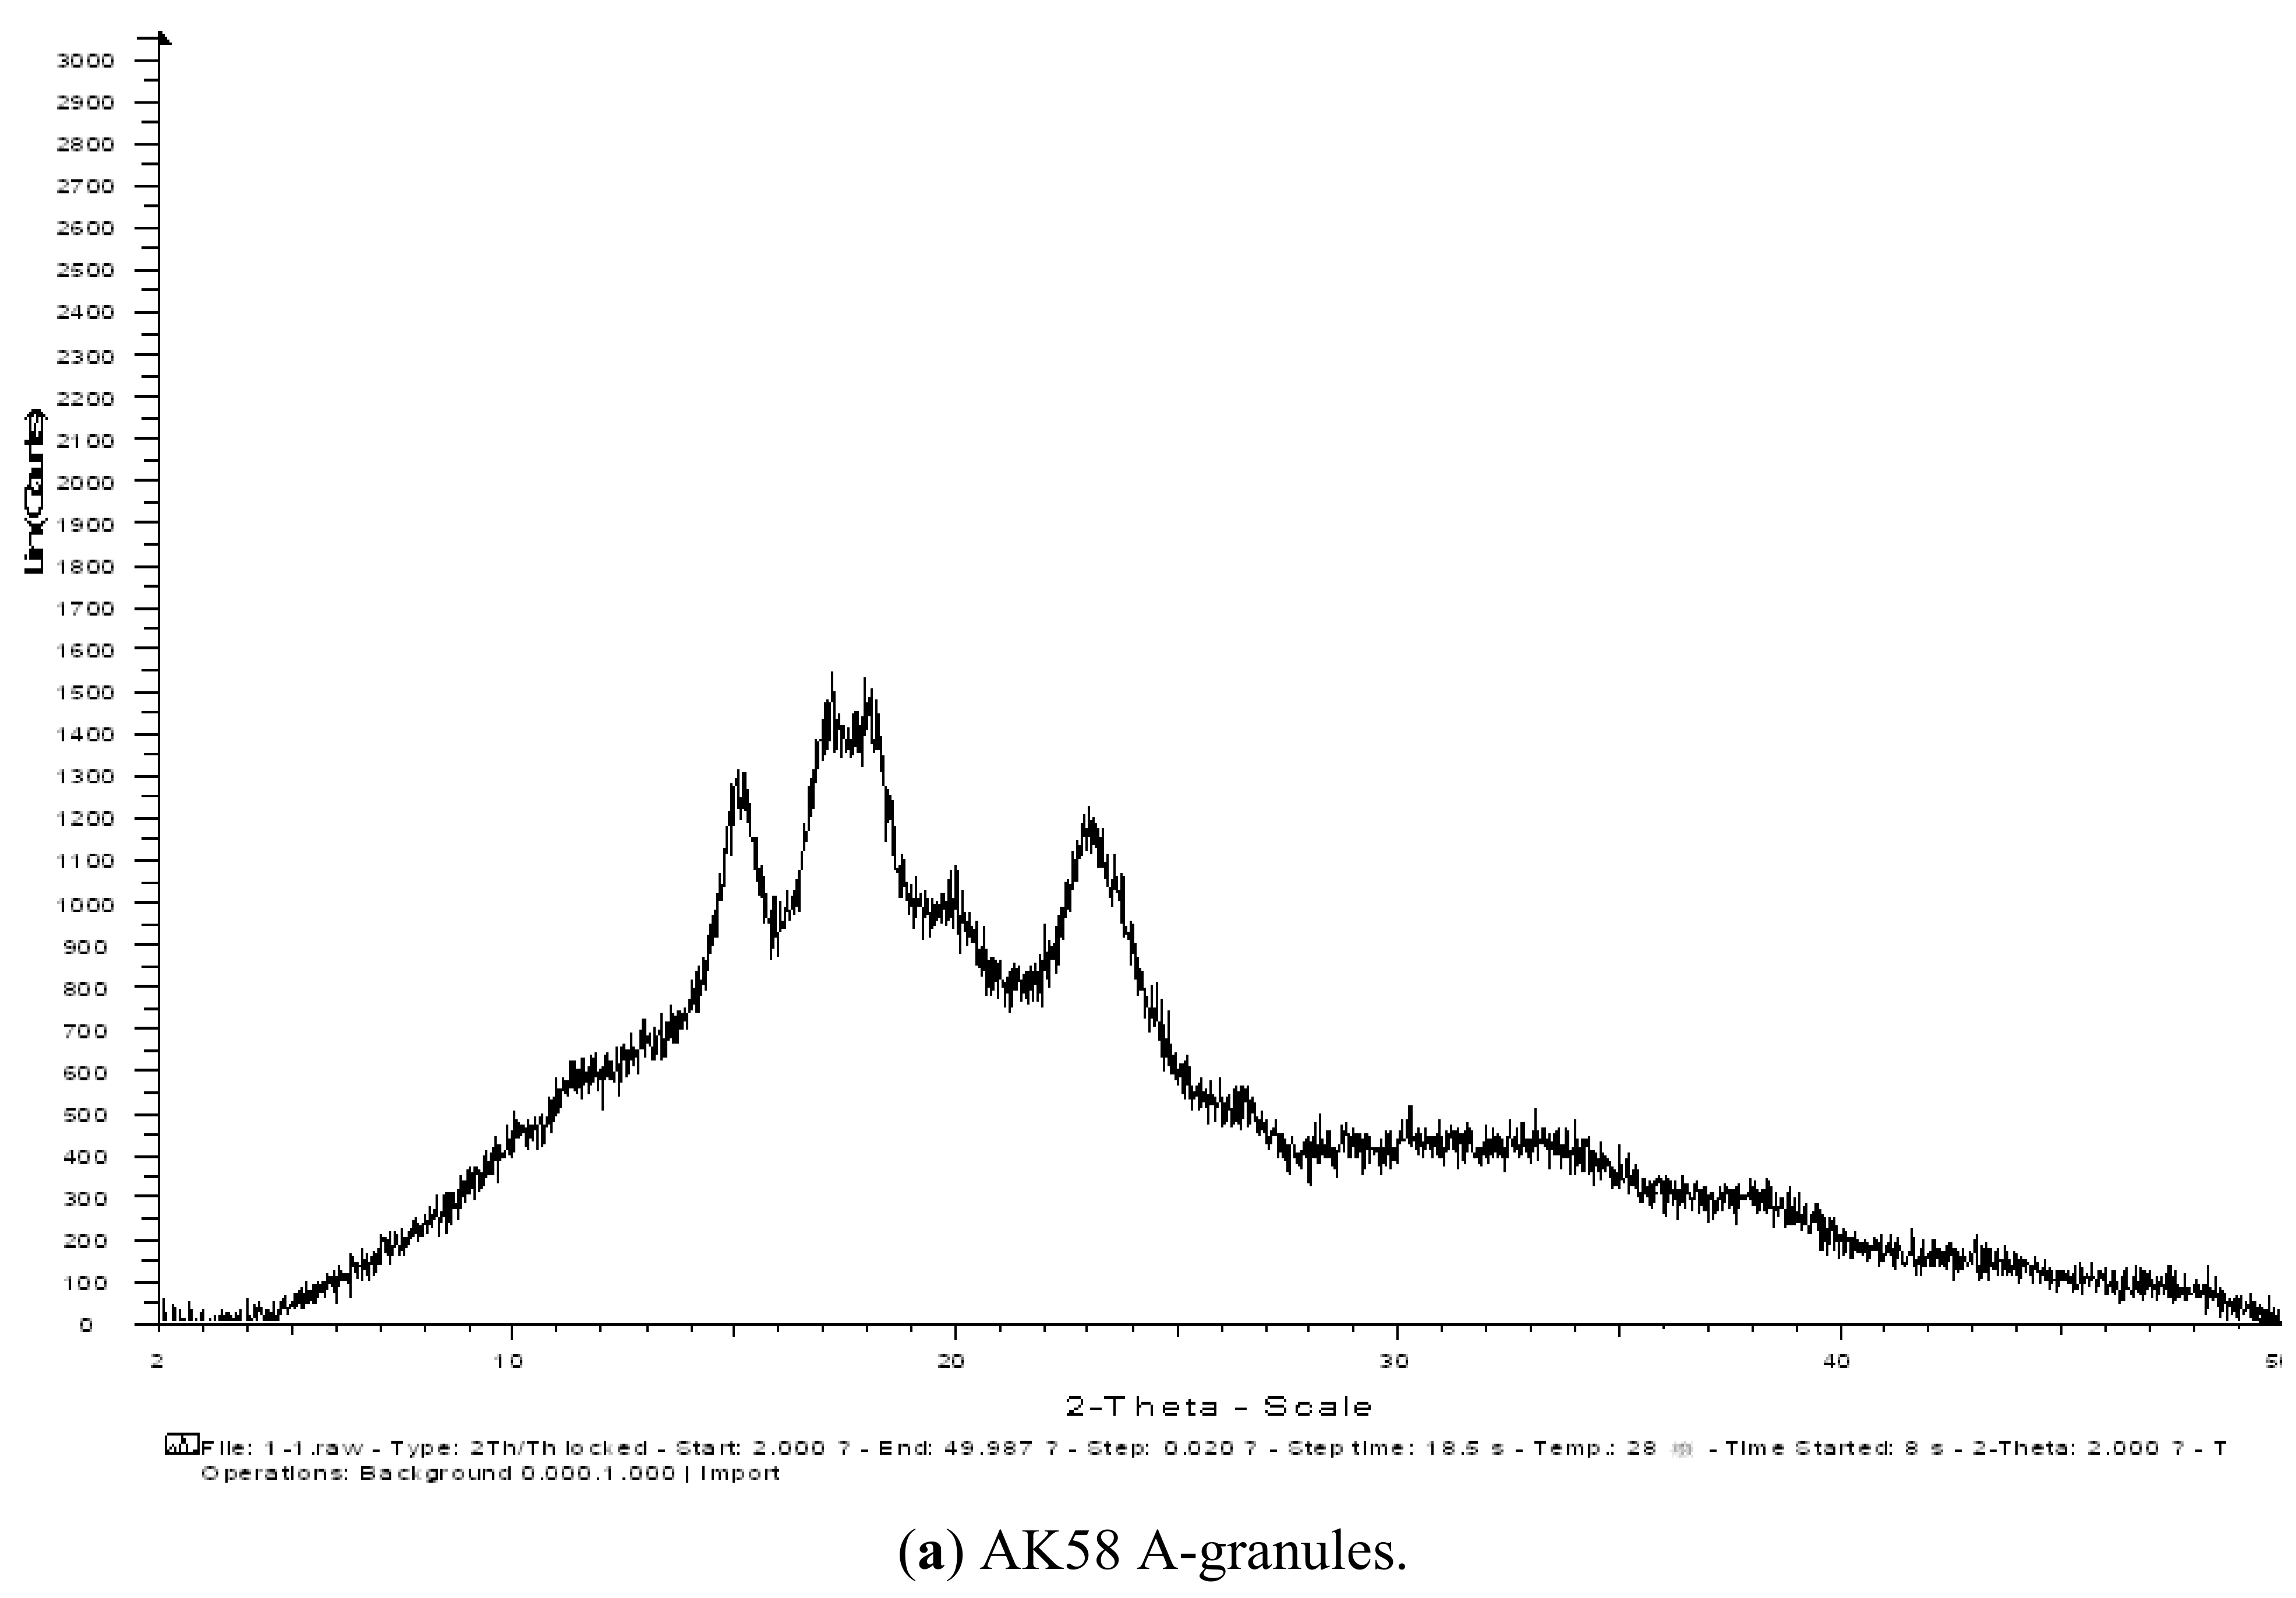
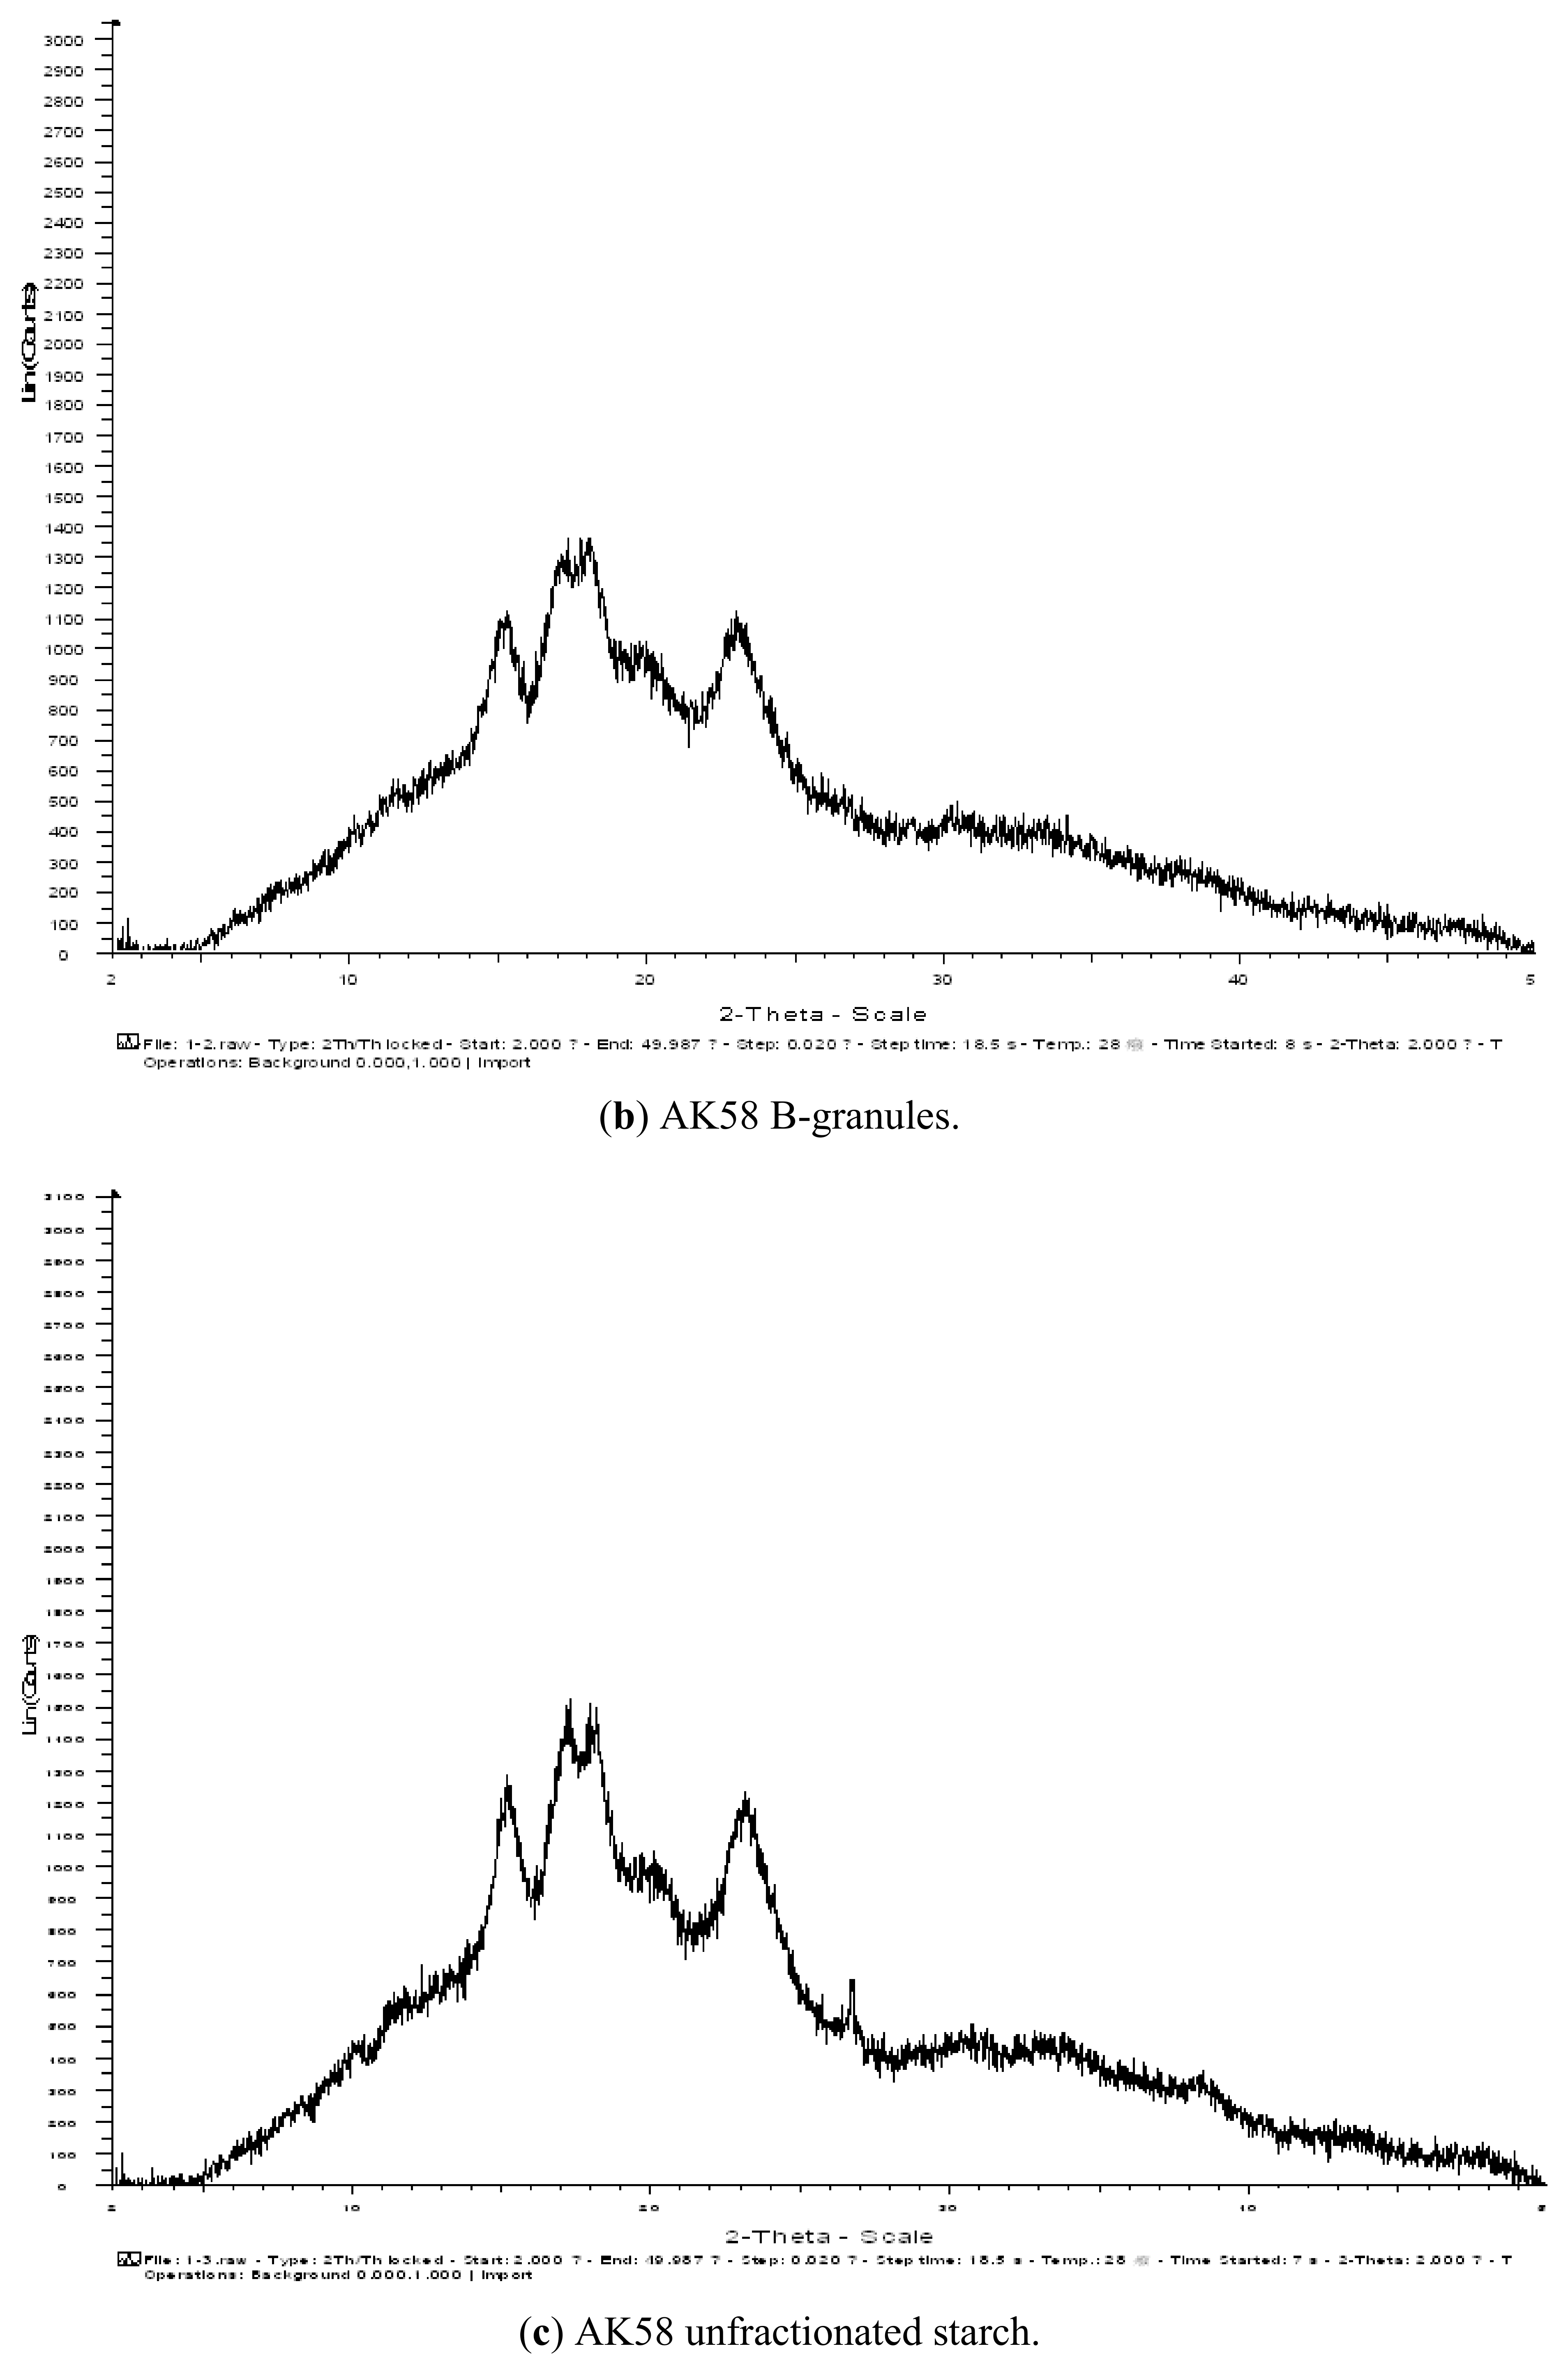
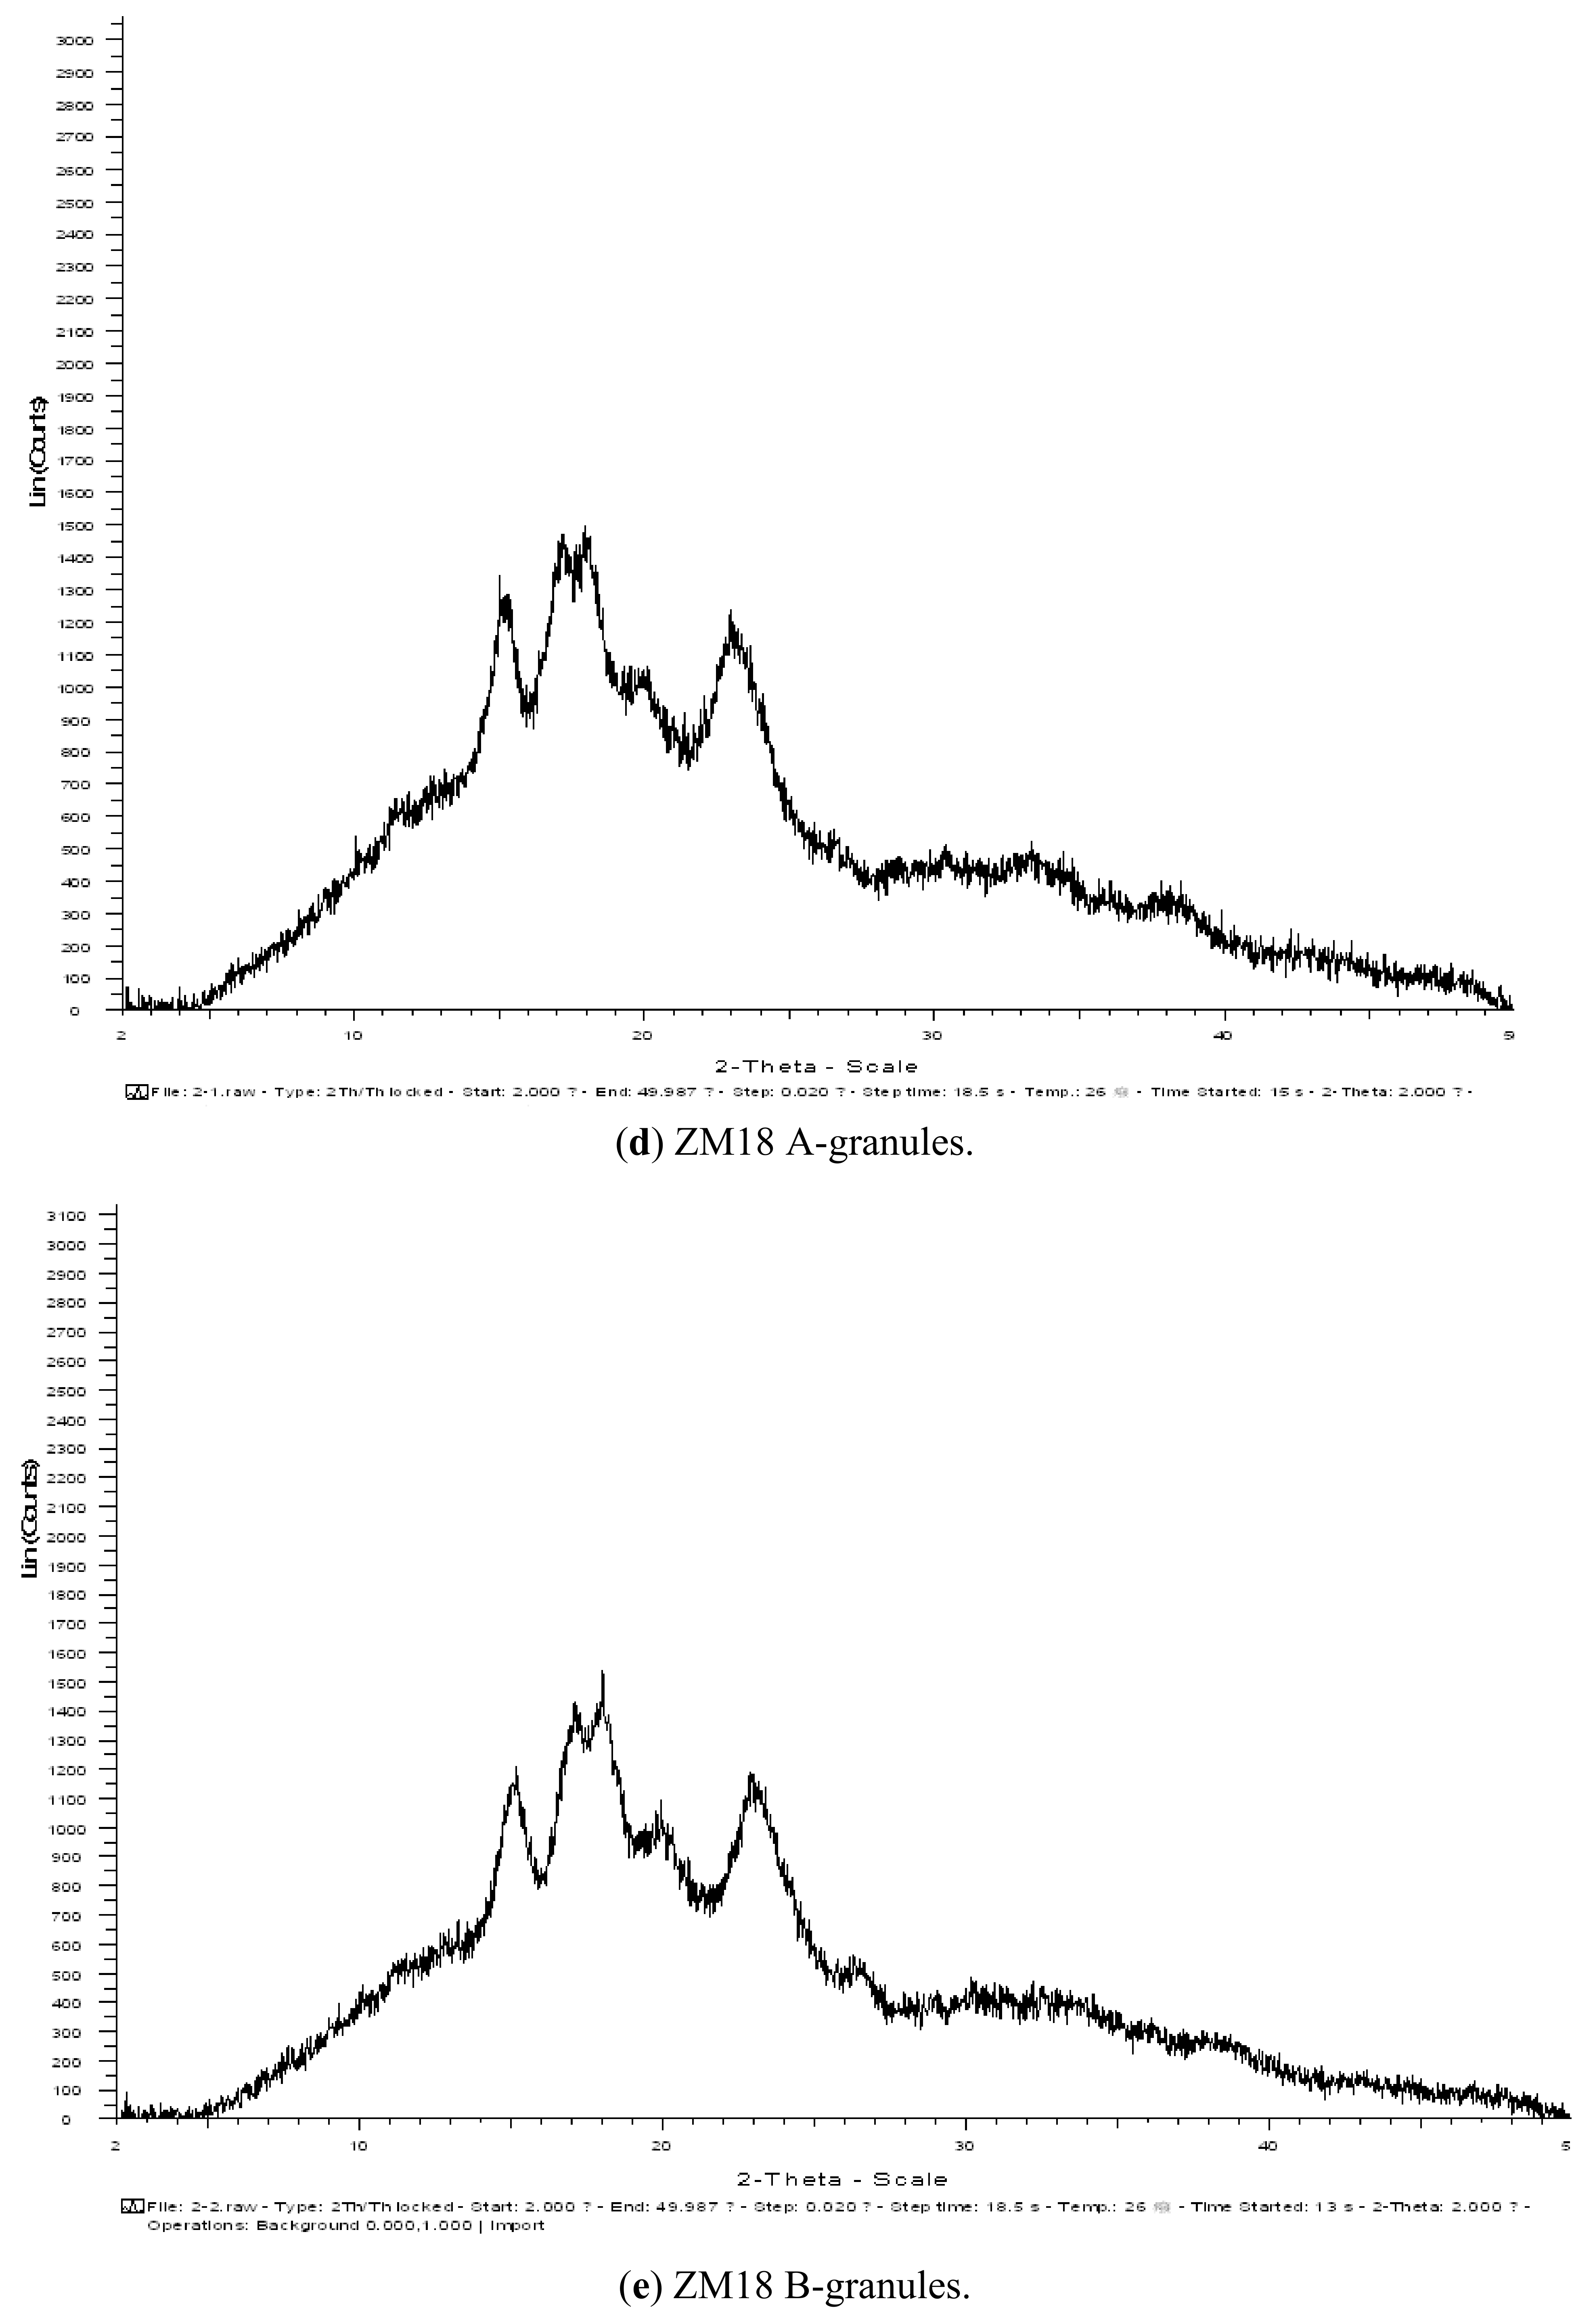
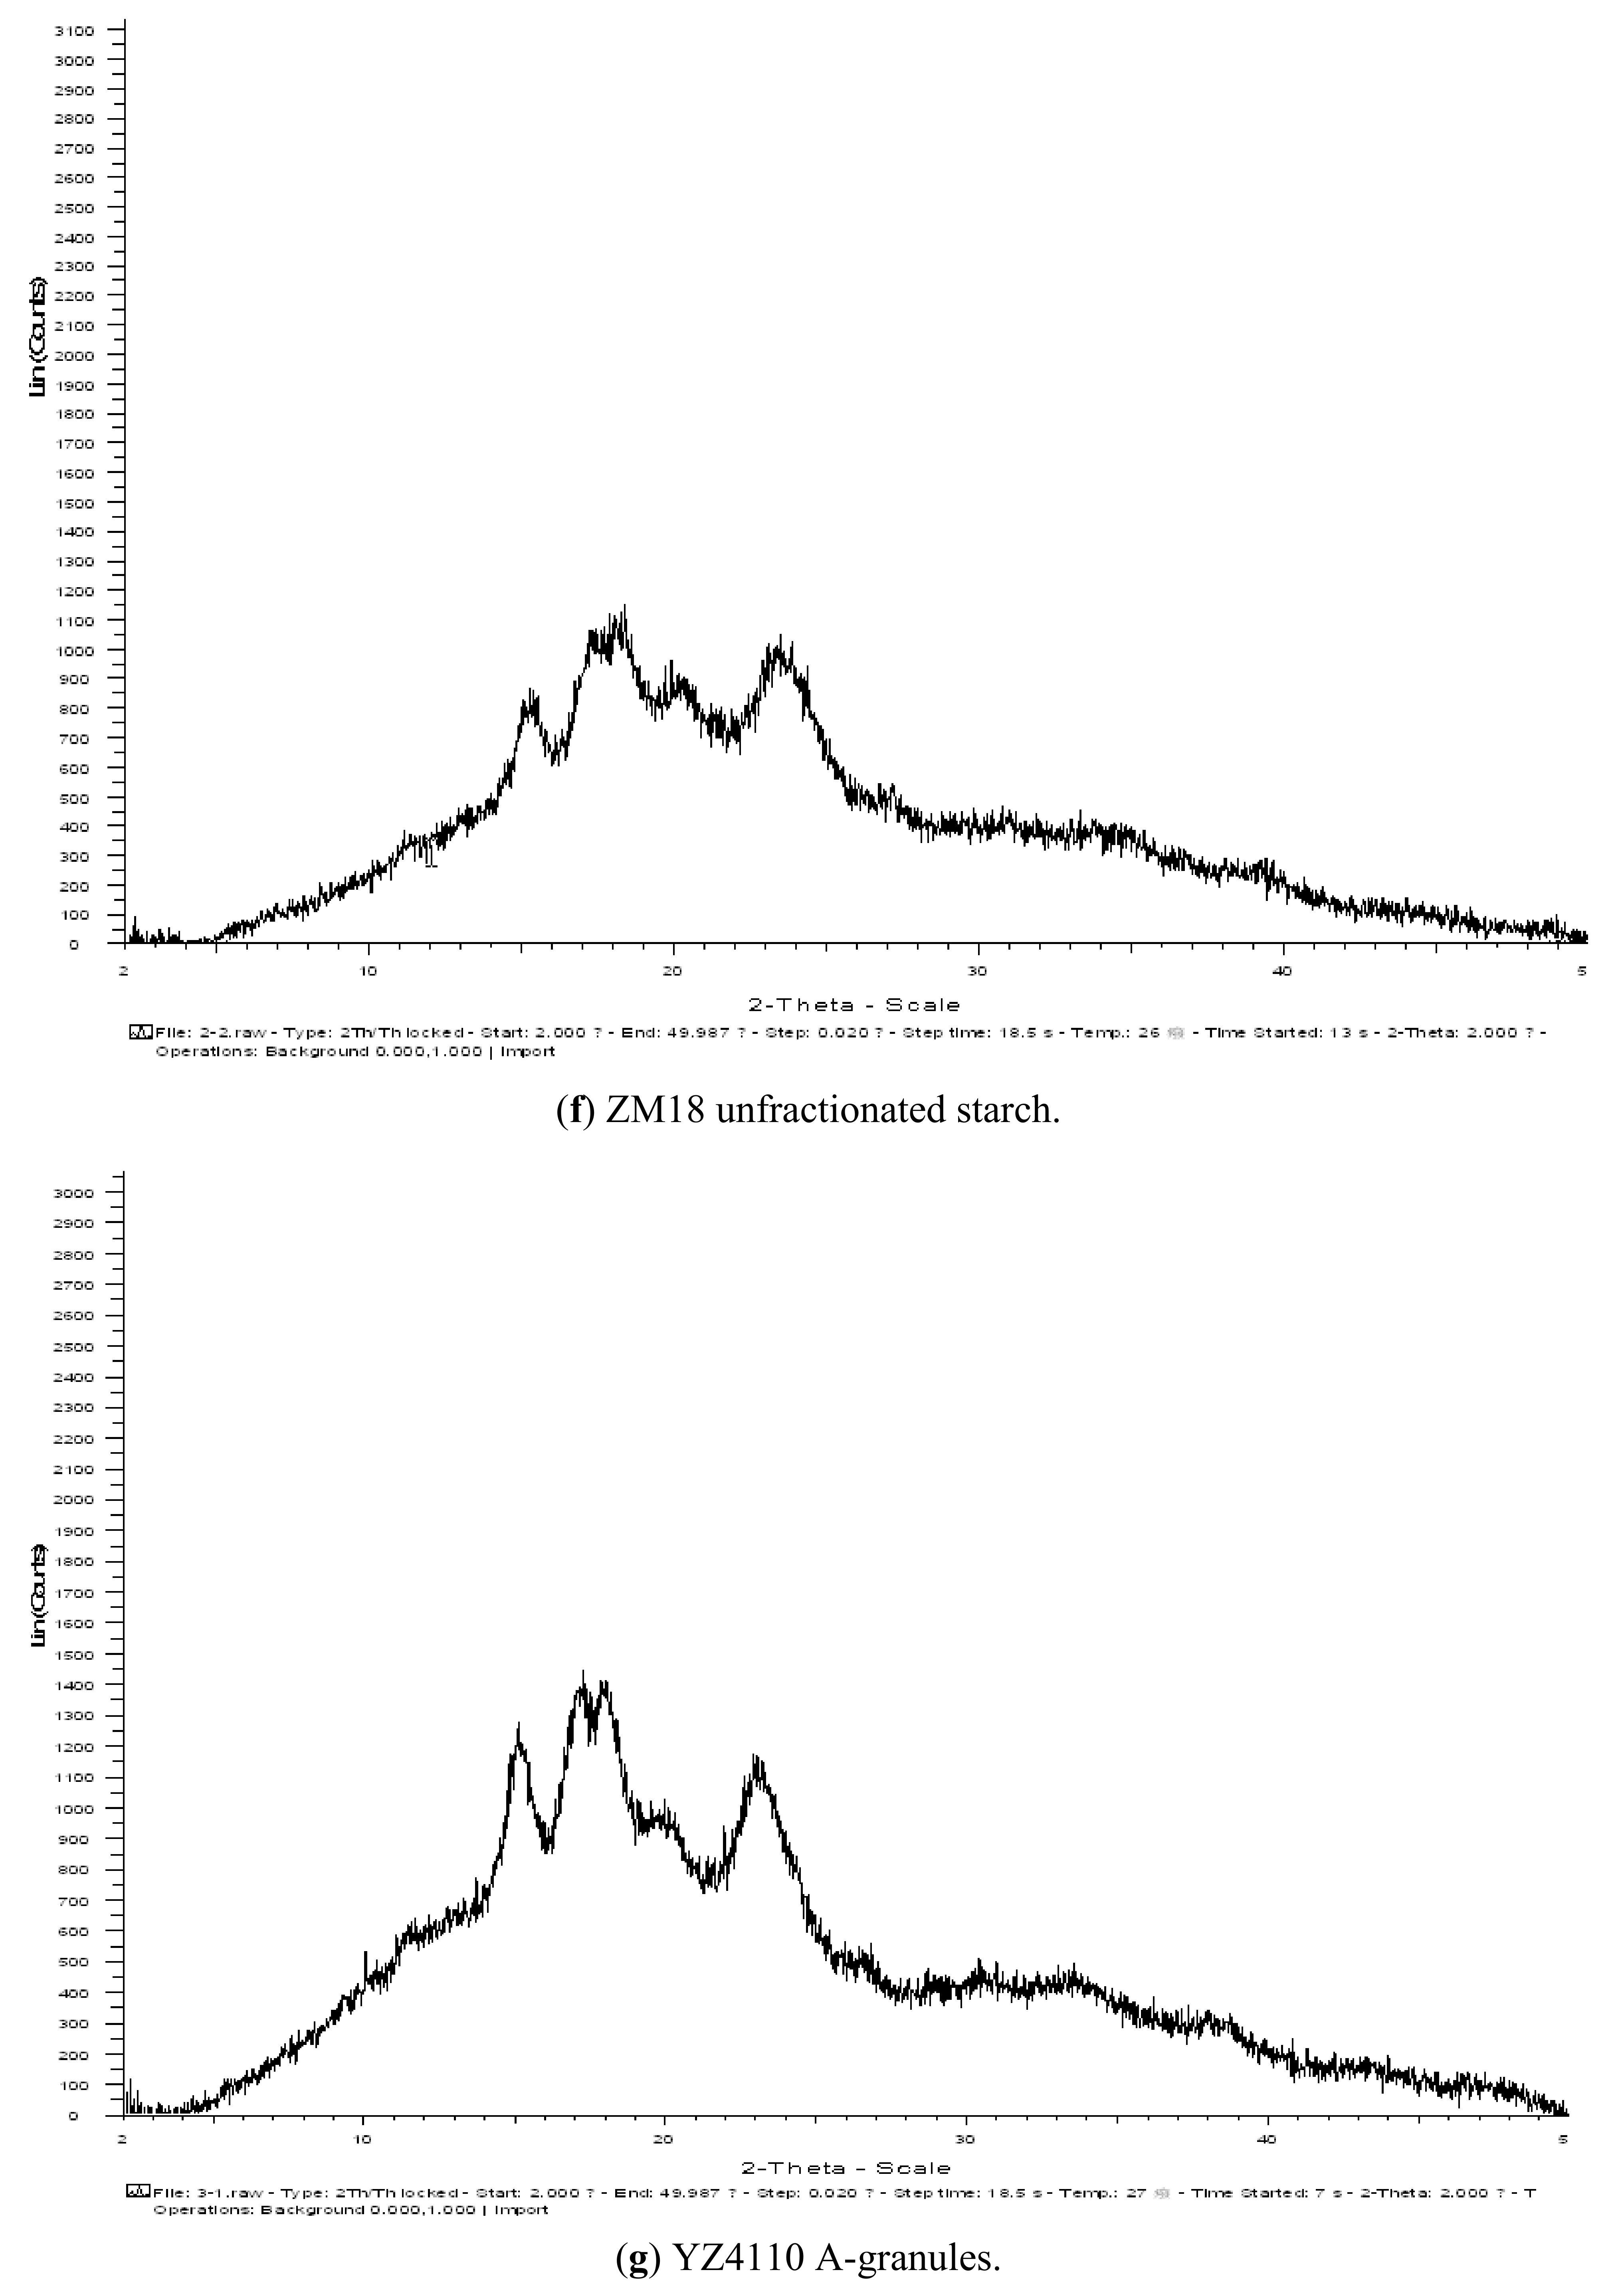
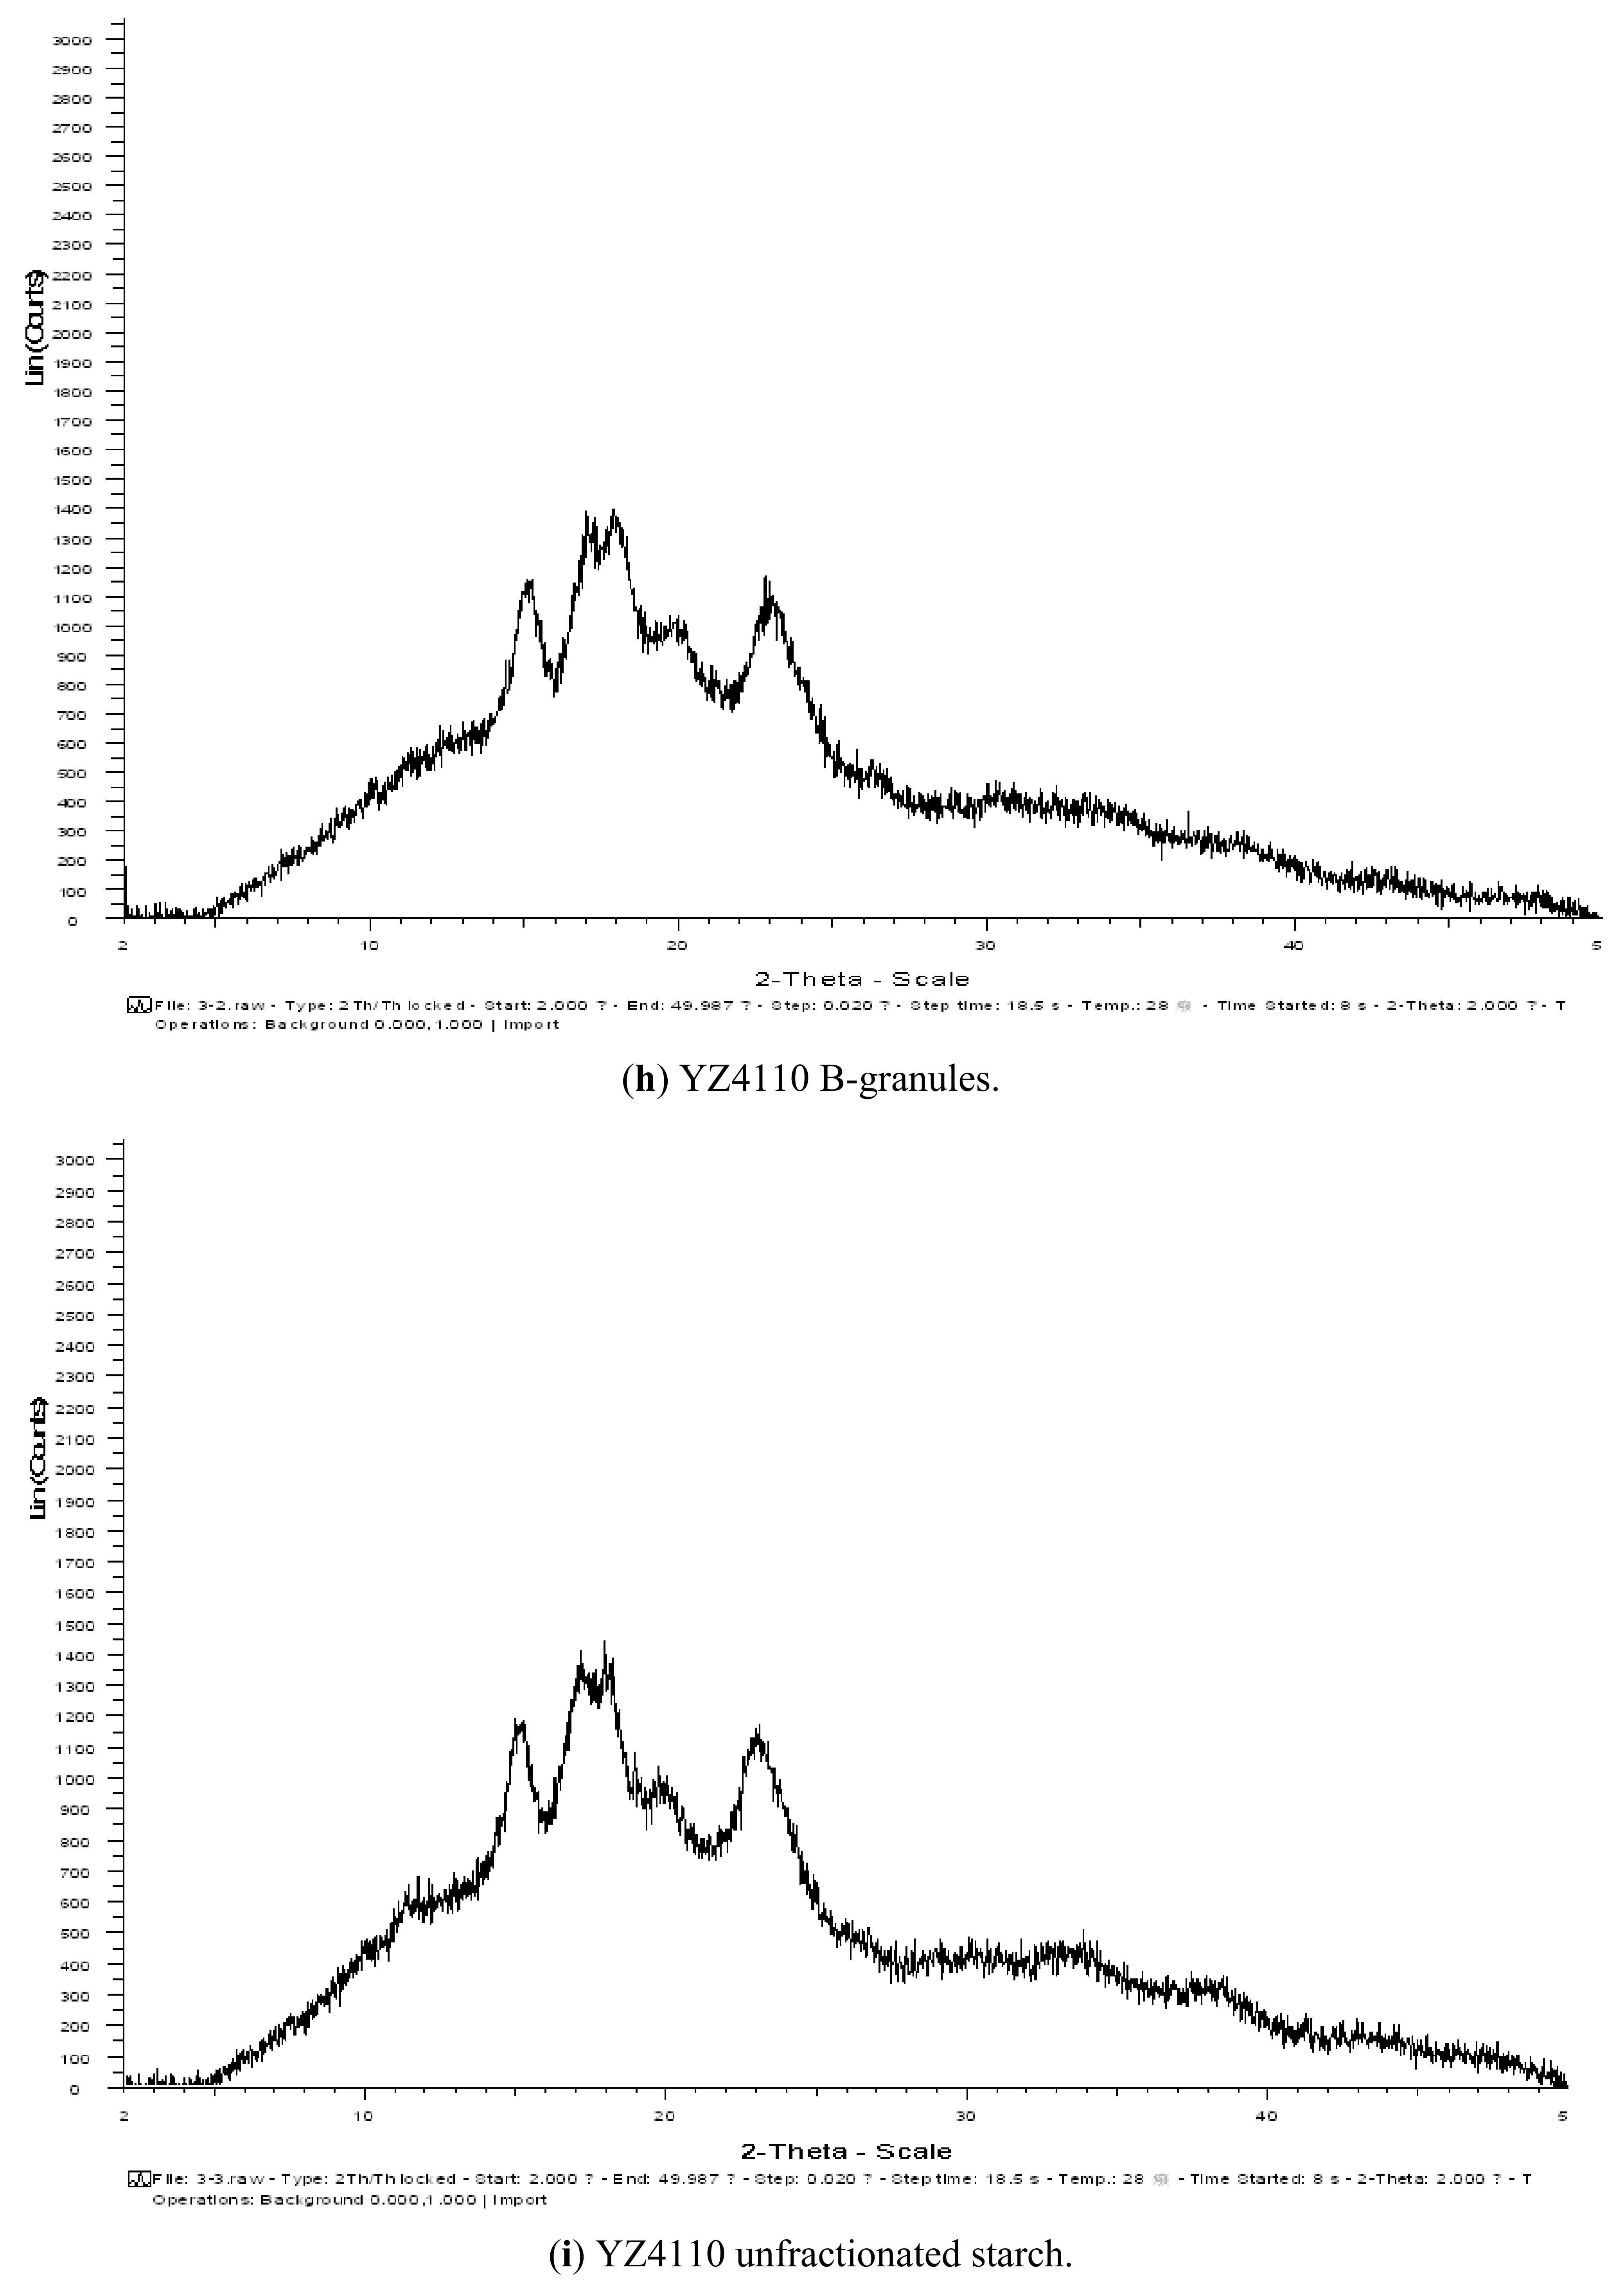
2.4. XRD Analysis


2.5. DSC Analysis

| Variety | Granule | To (°C) | Tp (°C) | Tc (°C) | Tc-To | △H |
|---|---|---|---|---|---|---|
| AK58 | A | 60.48 | 64.86 | 84.25 | 23.77 | 2.663 |
| B | 64.29 | 71.58 | 85.39 | 21.10 | 1.807 | |
| Unfractionated starch | 61.13 | 66.05 | 86.34 | 25.21 | 2.289 | |
| ZM18 | A | 60.72 | 65.66 | 85.58 | 24.86 | 3.342 |
| B | 66.36 | 73.63 | 88.95 | 22.35 | 2.888 | |
| Unfractionated starch | 61.48 | 66.91 | 84.25 | 23.02 | 2.933 | |
| YZ4110 | A | 59.65 | 64.01 | 80.65 | 20.85 | 2.869 |
| B | 63.05 | 69.60 | 82.35 | 19.30 | 2.196 | |
| Unfractionated starch | 60.58 | 65.09 | 80.08 | 19.50 | 2.819 |
2.6. Pasting Properties
| Variety | Granule | Peak (cP) | Trough (cP) | Breakdown (cP) | Final viscosity (cP) | Setback (cP) | Pasting Temperature (°C) |
|---|---|---|---|---|---|---|---|
| AK58 | A | 3750 | 3230 | 529 | 4576 | 1355 | 77.1 |
| B | 3345 | 3033 | 312 | 3765 | 732 | 84.75 | |
| Unfract. starch | 3237 | 2785 | 452 | 3927 | 1143 | 84.45 | |
| ZM18 | A | 3200 | 2507 | 710 | 3698 | 1207 | 85.75 |
| B | 3804 | 3226 | 578 | 4025 | 799 | 76.51 | |
| Unfract. starch | 3788 | 2723 | 1065 | 4475 | 1752 | 78.67 | |
| YZ4110 | A | 3312 | 2677 | 635 | 3816 | 1139 | 84.95 |
| B | 3376 | 2888 | 488 | 4340 | 1452 | 79.30 | |
| Unfract. starch | 3347 | 2751 | 597 | 4191 | 1441 | 81.38 |
3. Experimental
3.1. Materials and Chemicals
3.2. Isolation of Starch
3.3. Separation of the A-and B-Granule Starch
3.4. Amylose Content Determination
3.5. SEM
3.6. FT-IR
3.7. XRD
3.8. DSC
3.9. RVA
3.10. Statistical Analysis
4. Conclusions
Supplementary Materials
Supplementary File 1Acknowledgements
References and Notes
- Li, W.Y.; Yan, S.H.; Yin, Y.P.; Li, Y.; Liang, T.B.; Gu, F.; Dai, Z.M.; Wang, Z.L. Comparison of starch granule size distribution between hard and soft wheat cultivars in eastern China. Agric. Sci. China 2008, 7, 907–914. [Google Scholar] [CrossRef]
- Paul, C. The structure of starch. Nature 1997, 389, 338–339. [Google Scholar]
- Soulaka, A.B.; Morrison, W.R. The amylose and lipid content, dimensions, and gelatinization charactertistics of some wheat starches and their A- and B-granule fractions. J. Sci. Food Agric. 1985, 36, 709–718. [Google Scholar] [CrossRef]
- Dündar, E.; Turan, Y.; Blaurock, A.E. Largescale structure of wheat, rice and potato starch revealed by ultra small angle X-ray diffraction. Int. J. Biol. Macromol. 2009, 45, 206–212. [Google Scholar] [CrossRef]
- Ellis, R.P.; Cochrane, M.P.; Dale, M.F.B.; Duffus, C.M.; Lynn, A.; Morrison, I.M.; Prentice, R.D.M; Swanston, J.S.; Tiller, S.A. Starch production and industrial use. J. Sci. Food Agric. 1998, 77, 289–311. [Google Scholar]
- Dai, Z.; Yin, Y.; Wang, Z. Starch granule size distribution from seven wheat cultivars under different water regimes. Cereal Chem. 2009, 86, 82–87. [Google Scholar] [CrossRef]
- Soh, H.N.; Sissons, M.J.; Turner, M.A. Effect of starch granule size distribution and elevated amylase content on durum dough rheology and spaghetti cooking quality. Cereal Chem. 2006, 83, 513–519. [Google Scholar] [CrossRef]
- Šubarić, D.; Babić, J.; LaLić, A.; Ačkar, D.; Kopjar, M. Isolation and characterization of starch from different barley and oat varieties. Czech J. Food Sci. 2011, 29, 354–360. [Google Scholar]
- Singh, N.; Singh, S.; Isono, N.; Noda, T.; Singh, A.M. Diversity in amylopectin structure, thermal and pasting properties of starches from wheat varieties/lines. Int. J. Biol. Macromol. 2009, 45, 298–304. [Google Scholar] [CrossRef]
- Jane, J.; Kasemsuwan, T.; Leas, S.; Zobel, H.; Robyt, J.F. Anthology of starch granule morphology by scanning electron microscopy. Starch/Staerke 1994, 46, 121–129. [Google Scholar] [CrossRef]
- Yoo, S.H.; Jane, J. Structural and physical characteristics of waxy and other wheat starches. Carbohyd. Polym. 2002, 49, 297–305. [Google Scholar] [CrossRef]
- Koksel, H.; Masatcioglu, T.; Kahraman, K.; Ozturk, S.; Basman, A. Improving effect of lyophilization on functional properties of resistant starch preparations formed by acid hydrolysis and heat treatment. J. Cereal Sci. 2008, 47, 275–282. [Google Scholar] [CrossRef]
- Sitohy, M.Z.; Labib, S.M.; El-Saadany, S.S.; Ramadan, M.F. . Optimizing the conditions for starch dry phosphorylation with sodium mono- and dihydrogen orthophosphate under heat and vacuum. Starch/Staerke 2000, 52, 95–100. [Google Scholar] [CrossRef]
- Goni, I.; García-Diz, L.; Mañas, E.; Saura-Calixto, F. Analysis of resistant starch: a method for foods and food products. Food Chem. 1996, 56, 445–449. [Google Scholar] [CrossRef]
- Pan, D.D.; Jane, J. Internal structure of normal maize starch granules revealed by chemical surface gelatinization. Biomacromolecules 2000, 1, 126–132. [Google Scholar] [CrossRef]
- Eliasson, A.C.; Karlson, R. Gelatinization properties of different size classes of wheat starch granules measured with differential scanning calorimetry. Starch/Staerke 1983, 35, 130–133. [Google Scholar] [CrossRef]
- Kasemsuwan, T.; Jane, J.; Schnable, P.; Stinard, P.; Robertson, D. Characterization of the dominant mutant amylose-extender (Ael-5180) maize starch. Cereal Chem. 1995, 71, 457–464. [Google Scholar]
- Takeda, Y.; Takeda, C.; Mizukami, H.; Hanashiro, I. Structures of large, medium and small starch granules of barley grain. Carbohyd. Polym. 1999, 38, 109–114. [Google Scholar] [CrossRef]
- Samples Availability: Samples of the compounds are available from the authors.
© 2011 by the authors; licensee MDPI, Basel, Switzerland. This article is an open access article distributed under the terms and conditions of the Creative Commons Attribution license ( http://creativecommons.org/licenses/by/3.0/).
Share and Cite
Zeng, J.; Li, G.; Gao, H.; Ru, Z. Comparison of A and B Starch Granules from Three Wheat Varieties. Molecules 2011, 16, 10570-10591. https://doi.org/10.3390/molecules161210570
Zeng J, Li G, Gao H, Ru Z. Comparison of A and B Starch Granules from Three Wheat Varieties. Molecules. 2011; 16(12):10570-10591. https://doi.org/10.3390/molecules161210570
Chicago/Turabian StyleZeng, Jie, Guanglei Li, Haiyan Gao, and Zhengang Ru. 2011. "Comparison of A and B Starch Granules from Three Wheat Varieties" Molecules 16, no. 12: 10570-10591. https://doi.org/10.3390/molecules161210570