1. Introduction
Design and synthesis of fluoroionophores for metal ions is a vigorous research area [
1,
2,
3,
4,
5,
6]. These fluoroionophores have an ion recognition unit (such as a crown ether, calixarene or thiacalixarene) and a fluorophore unit (such as dansyl, anthracenyl, and pyrenyl groups) connected by appropriate linkers. When the ion recognition unit interacts with the target metal ions, chemical signals, such as absorbance or fluorescence intensities, are typically generated or attenuated in the fluorophore unit.
Among alkali metal ions a number of fluoroionophores for Na
+ and K
+ have been reported because these ions play particular roles in the regulation of many biological events. [
7,
8,
9]. We have previously reported a
p-
tert-butylcalix[4]arene derivative which is connected with
p-
tert-butylcalix[4]arene and pyrene by a CH
2CO linker [
10]. This derivative shows an increase of pyrene monomer emission and a decrease of pyrene excimer emission with increased Na
+ concentration. Subsequently, we have synthesized podand-type fluoroionophores, with two pyrene units
1 and
2 using 2,2´-dihydroxydiphenylmethane as a precursor of calix[4]arene and 2,2´-dihydroxydiphenyl ether, respectively, and examined the binding abilities toward alkali metal ions [
11]. Although
1 has only slight affinity for alkali metal ions,
2 has good sensitivity for Na
+ showing an increase of pyrene mononer emission and a decrease of pyrene excimer emission with increased Na
+ ion. The oxygen atom between two phenyl groups in fluoroionophore
2 was found to play a crucial role in binding Na
+. This observation led us to construct novel podand-type fluoroionophores in which the oxygen atom between the two phenyl groups in
2 is replaced by different types of atoms with binding abilities for alkali metal ions other than Na
+.
Fluoroionophores for Li
+ have been developed recently with regard to their medical and clinical applications for the treatment of manic-depressive psychosis [
12,
13,
14]. However, relatively few studies concerning fluoroionophores for Li
+ have been reported compared with those for Na
+ and K
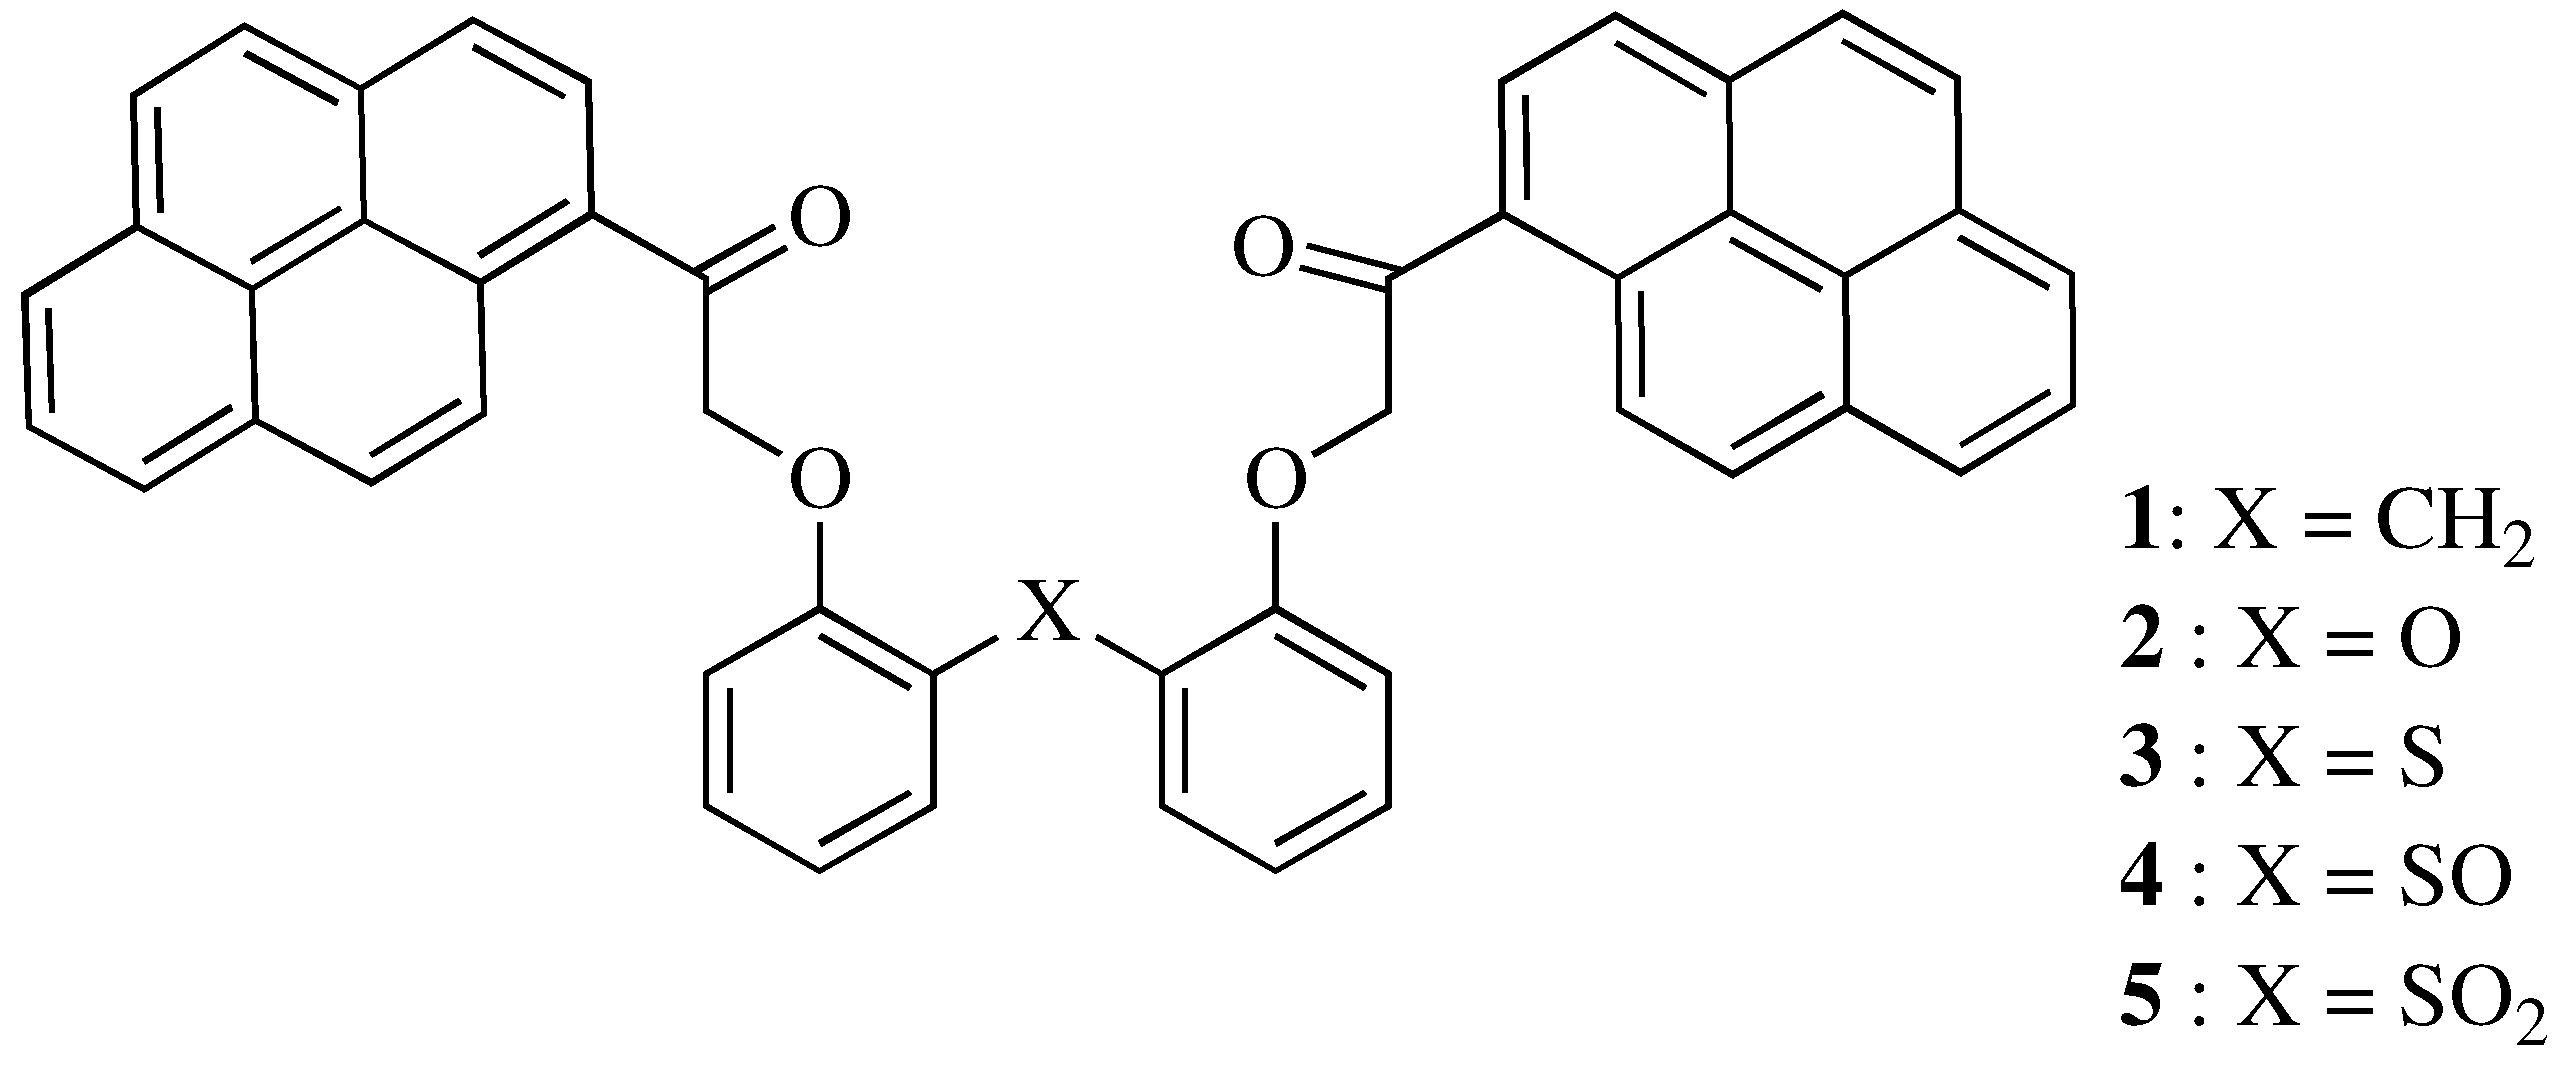
+. Here, we report the synthesis of novel podand-type compounds
3–
5 (
Figure 1) having two pyrene units as a fluorophore unit and a sulfur atom, sulfinyl group, or sulfonyl group as a binding site. Binding studies of compounds
3–
5 toward alkali metal ions (Li
+, Na
+, K
+, Rb
+, Cs
+) have shown that compound
4, which has a sulfinyl group, has a good binding ability for Li
+.
Figure 1.
Fluoroionophores 1, 2 and novel compounds 3, 4, and 5.
Figure 1.
Fluoroionophores 1, 2 and novel compounds 3, 4, and 5.
2. Results and Discussion
The fluoroionophores
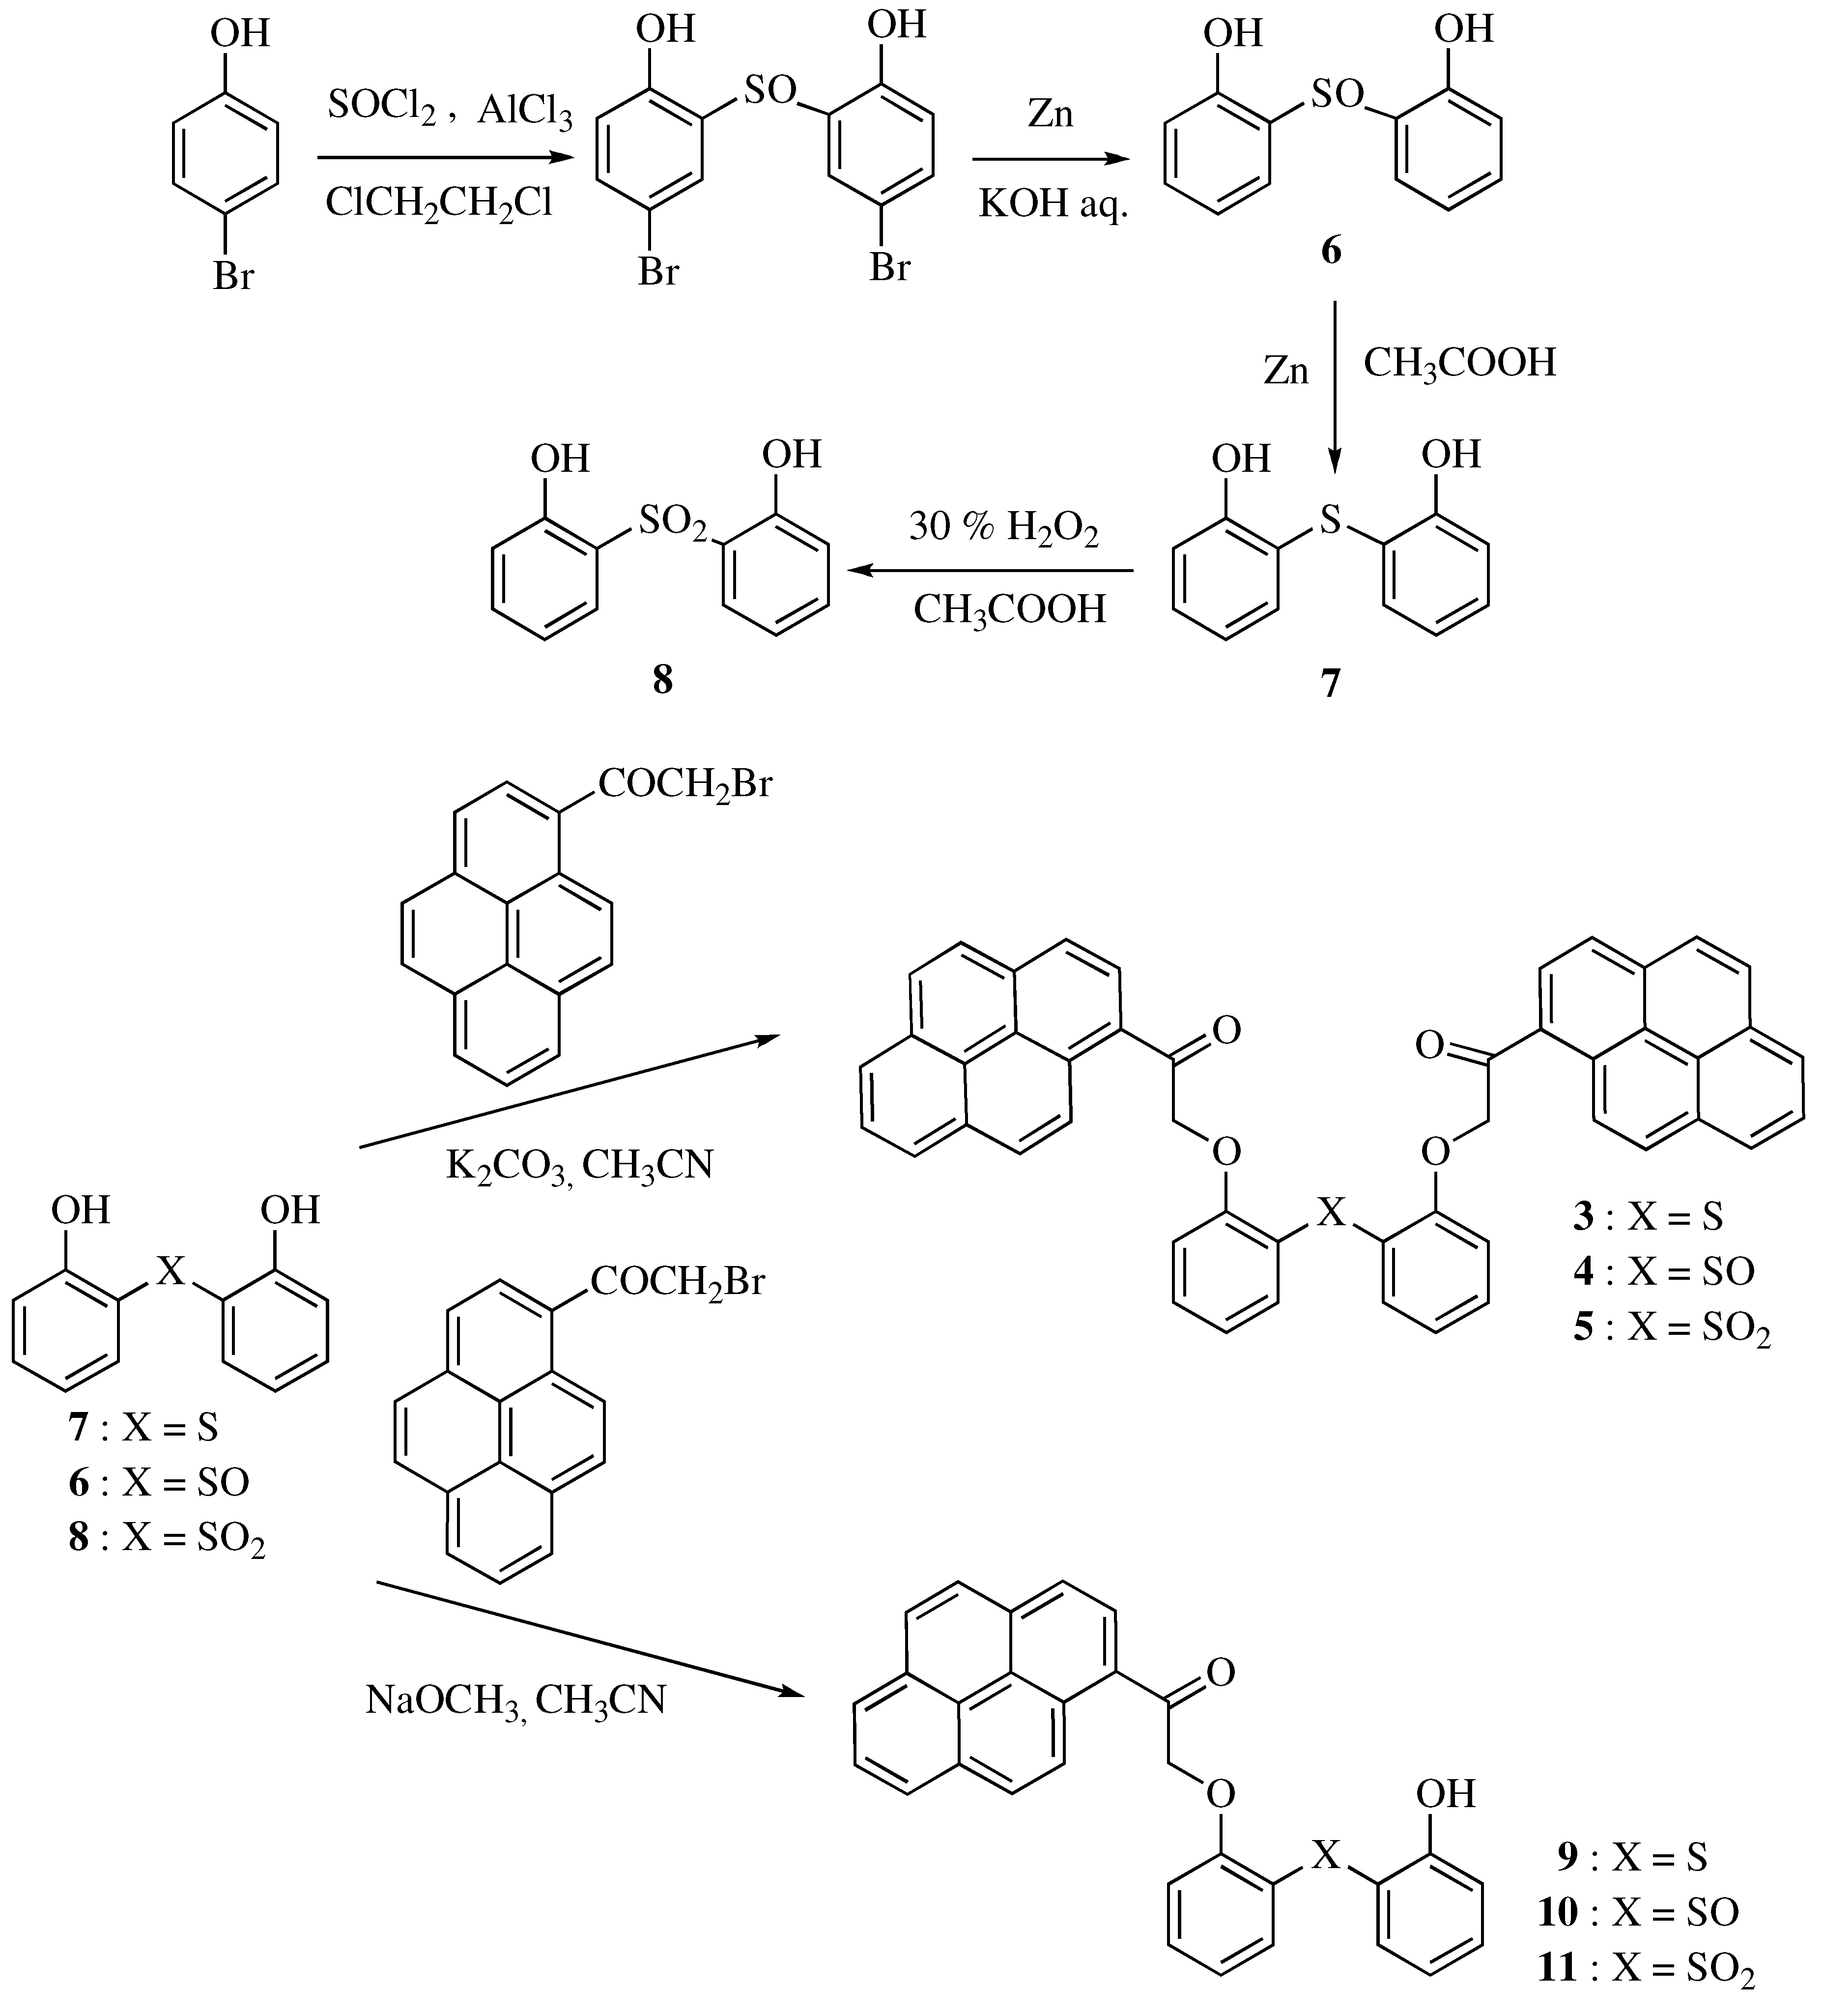
3–
5 were synthesized by connecting two 1-pyrenecarbonylmethyl groups with the two hydroxy groups of 2,2´-dihydroxydiphenyl sulfide, sulfoxide, or sulfone, respectively (
Scheme 1). First, 2,2´-dihydroxydiphenyl sulfoxide
6, sulfide
7, and sulfone
8 were synthesized using 4-bromophenol as a starting material according to a reported procedure [
15]. Then, compounds
3,
4, and
5, with two pyrene units, were synthesized by the reaction of
7,
6, and
8, respectively, with two equivalents of 1-(bromoacetyl)pyrene in the presence of potassium carbonate in acetonitrile. Furthermore, compounds
9,
10, and
11, with one pyrene unit, were synthesized as reference compounds by the reaction of
7,
6, and
8, respectively, with one equivalent of 1-(bromoacetyl)pyrene in the presence of sodium methoxide in acetonitrile. The structures of all the new fluoroionophores were determined by FAB MS and NMR spectra.
Scheme 1.
Synthetic routes of compounds 3, 4, and 5, with two pyrene units, and 9, 10, and 11, with one pyrene unit.
Scheme 1.
Synthetic routes of compounds 3, 4, and 5, with two pyrene units, and 9, 10, and 11, with one pyrene unit.
Figure 2 shows the UV-Vis spectra of 10.0 μM chloroform solutions of compounds
3,
4, and
5. The difference of binding site X does not significantly modify the absorption spectra, characterized by an absorption maximum (λ
max) at 366 nm and a shoulder at 393 nm.
Figure 2.
UV-Vis spectra of 3, 4, and 5 (10.0 μM in chloroform).
Figure 2.
UV-Vis spectra of 3, 4, and 5 (10.0 μM in chloroform).
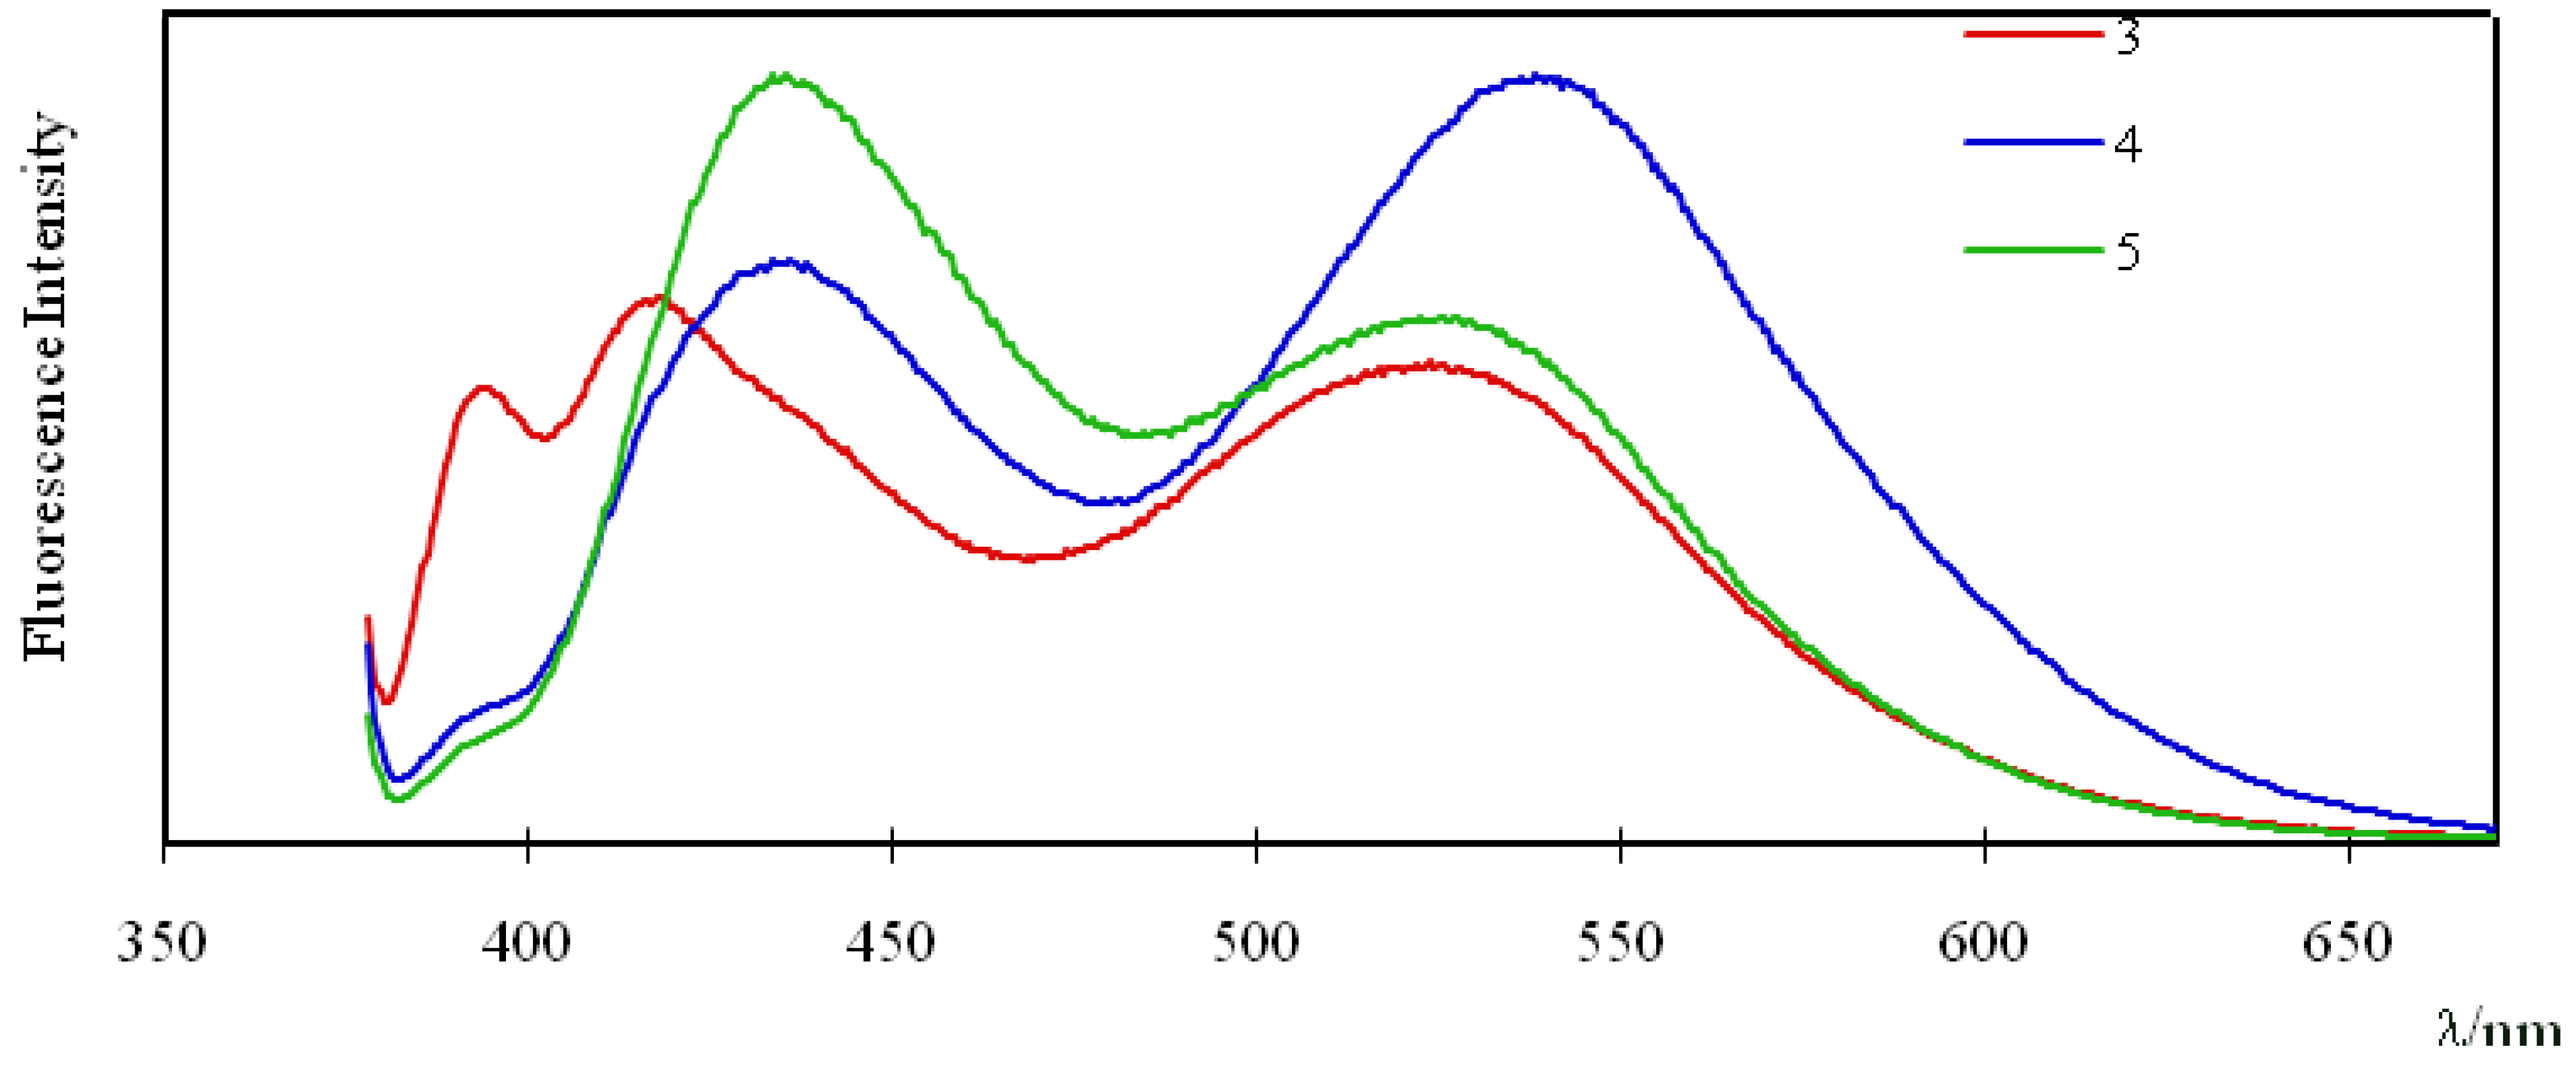
Figure 3 shows the fluorescence spectra of 1.0 μM chloroform solutions of compounds
3,
4, and
5 under excitation at 360 nm. The pyrene monomer emission of compound
3 appeared at 380–440 nm, and those of compounds
4 and
5 appeared at 380–485 nm. On the other hand, the pyrene excimer emission of compounds
3,
4, and
5 appeared at different wavelengths: around 523 nm for
3, 534 nm for
4, and 527 nm for
5. The fluorescence of pyrene in concentrated solutions shows dual emission bands: pyrene monomer emission at 370–425 nm, and excimer emission at around 480 nm [
16,
17]. The pyrene monomer and excimer emission bands of compounds
3,
4, and
5 were shifted to longer wavelengths than the corresponding emission bands of pyrene itself. These results can presumably be attributed to the effect of the electron-withdrawing carbonyl group [
18,
19,
20,
21].
Figure 3.
Fluorescence spectra of 3, 4, and 5 (1.0 μM in chloroform). Excitation wavelength: 360 nm.
Figure 3.
Fluorescence spectra of 3, 4, and 5 (1.0 μM in chloroform). Excitation wavelength: 360 nm.
It is noteworthy that the fluorescence intensity ratio (Ie/Im) for compound 4 (1.32) is greater than that of compounds 3 (0.88) and 5 (0.69), where Ie and Im are the fluorescence intensities of the pyrene excimer (at 523 nm for 3, 534 nm for 4, and 527 nm for 5) and monomer (at 419 nm for 3 and 438 nm for 4 and 5), respectively. These results indicate that the two pyrene units in compound 4 would be in closer proximity than those in compounds 3 and 5.
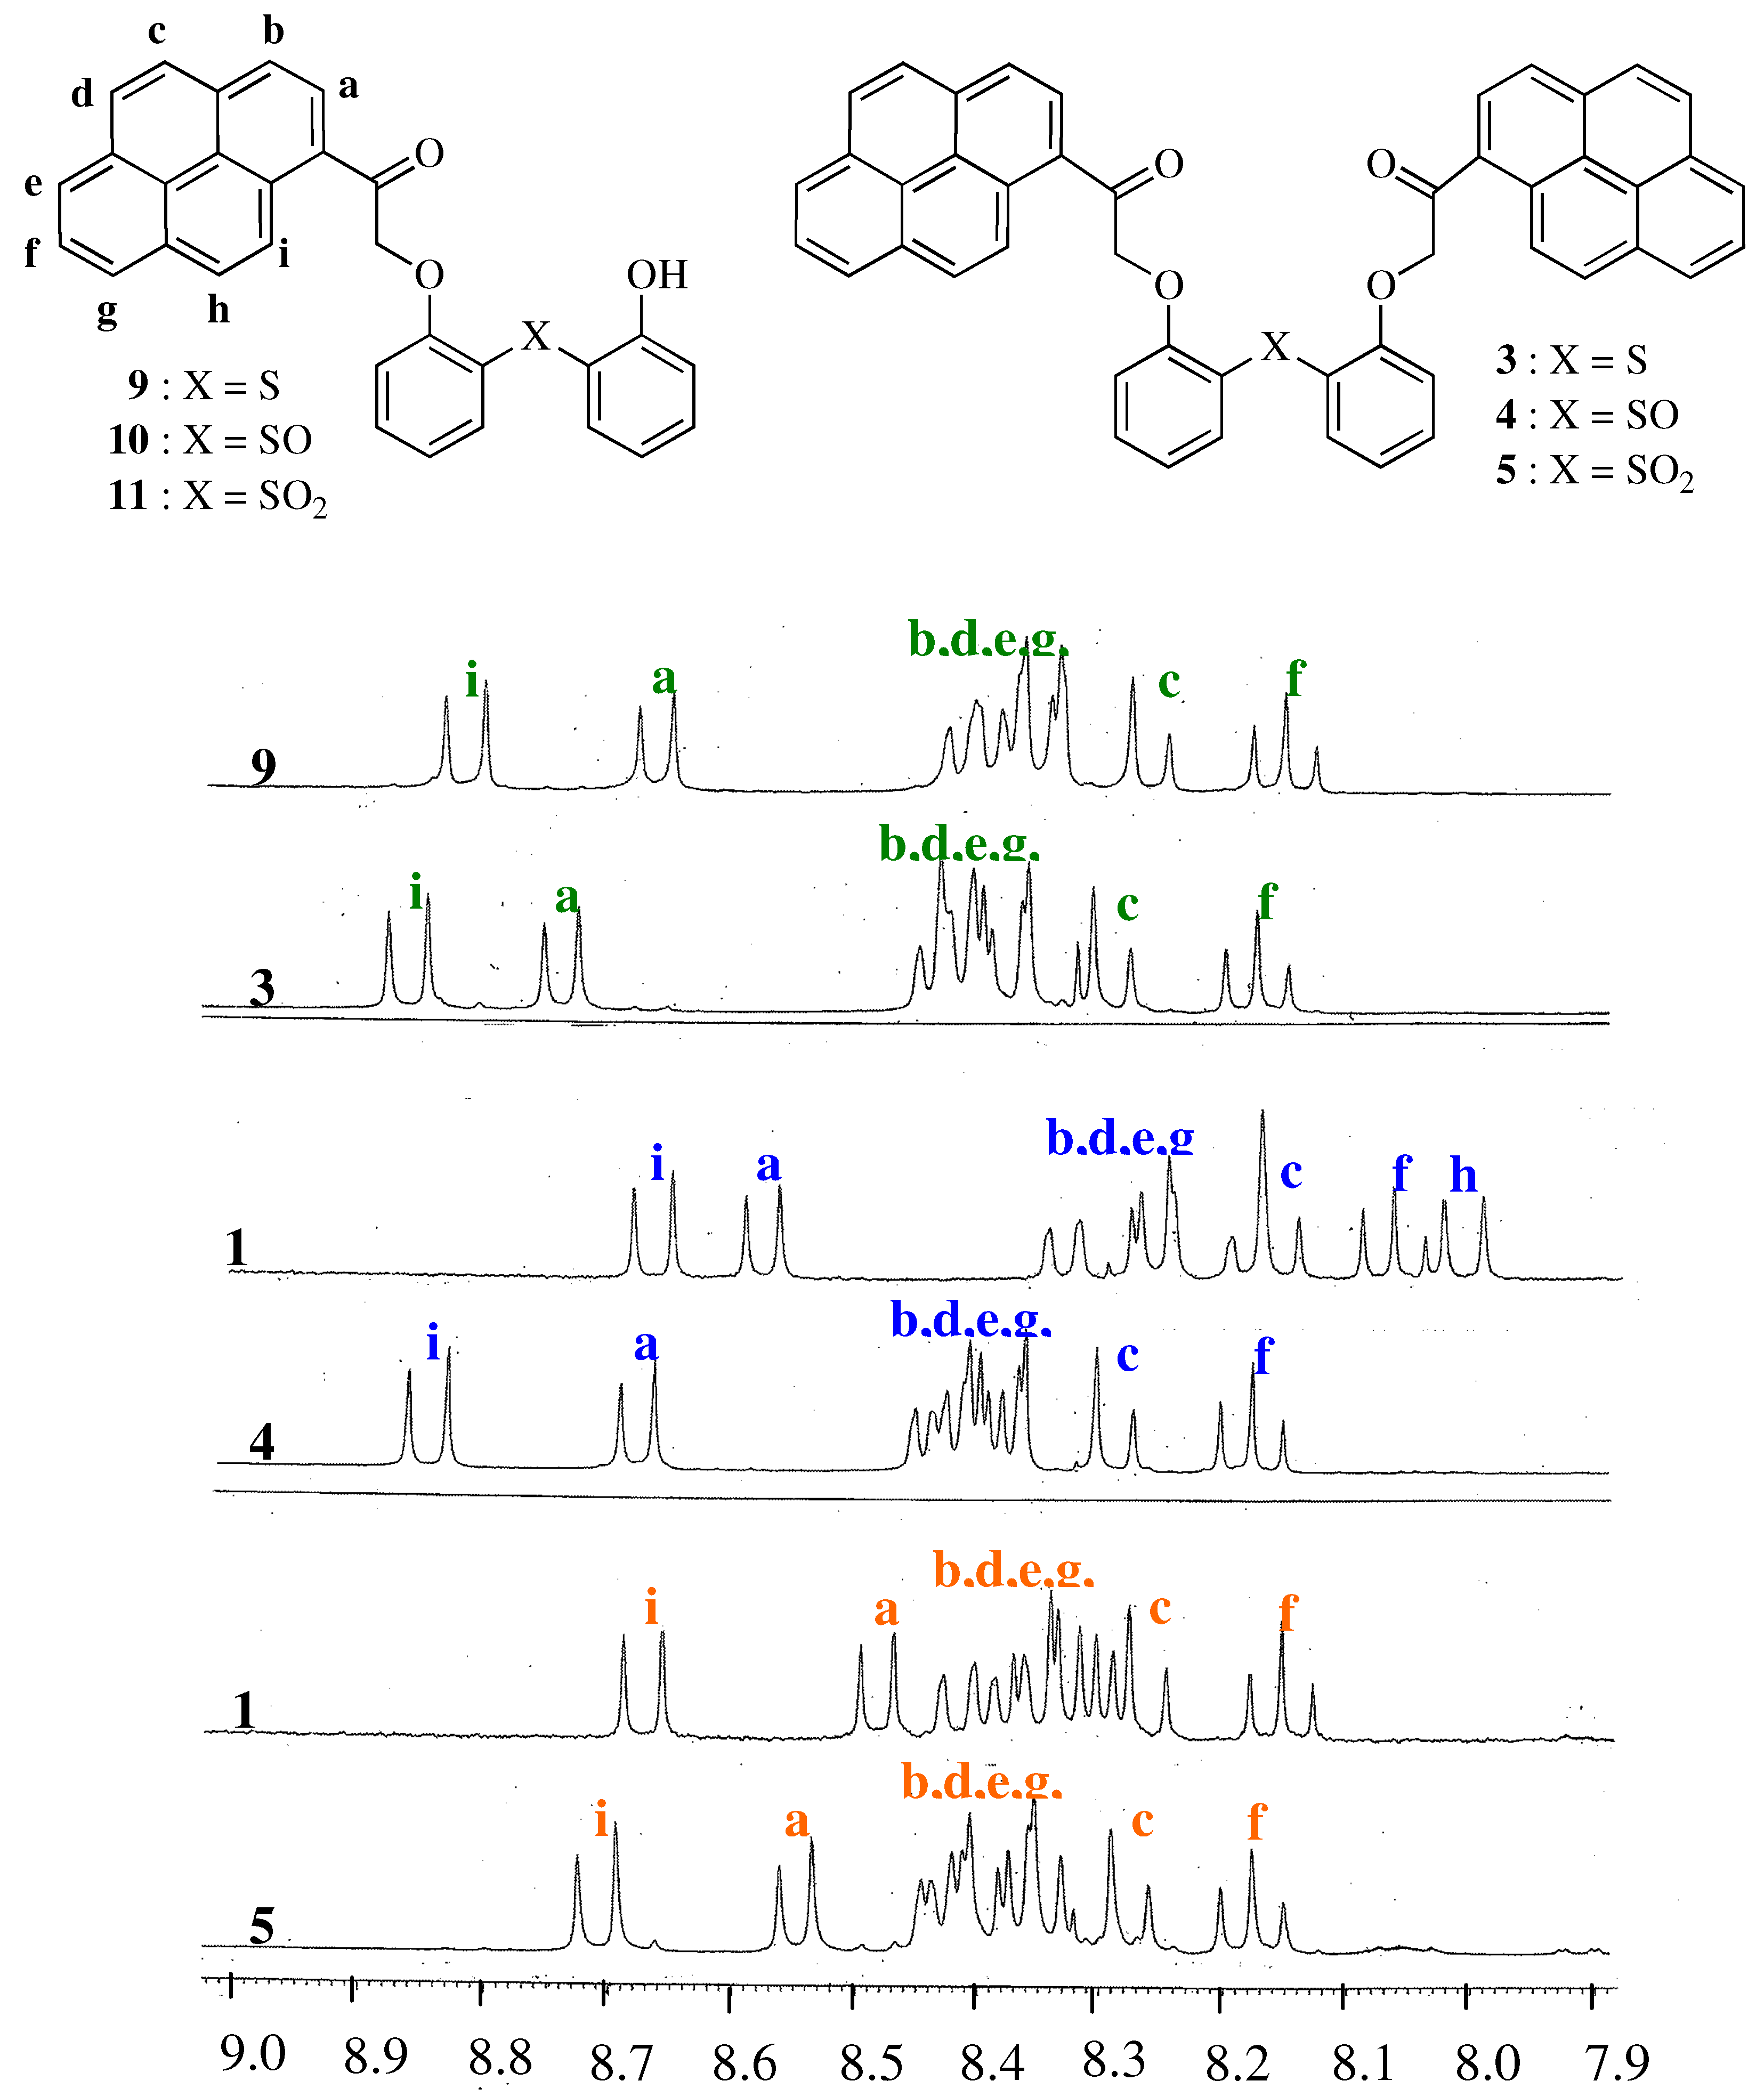
To examine the structures of compounds
3,
4, and
5 in detail, the
1H-NMR spectra of
3,
4, and
5 were compared with those of the corresponding compounds
9,
10, and
11, which have one pyrene unit [
22,
23]. The
1H-NMR spectra of all compounds were examined in DMSO-
d6 by
1H-
1H COSY,
1H-
13C COSY, and HMBC spectroscopy. The spectra of the pyrene unit are shown in
Figure 4. The chemical shifts (δ) of all compounds and the induced shifts (Δδ) are listed in
Table 1.
Figure 4.
1H-NMR spectra of 3, 4, 5 (0.02 M in DMSO-d6) and 9, 10, 11 (0.04 M in DMSO-d6).
Figure 4.
1H-NMR spectra of 3, 4, 5 (0.02 M in DMSO-d6) and 9, 10, 11 (0.04 M in DMSO-d6).
Table 1.
Chemical shift values (δ) of pyrene protons in compounds 3–5 and 9–11 and the induced shifts (Δδ) between the pyrene protons a–i in compounds 3–5, with two pyrene units, and the corresponding pyrene protons in compounds 9–11, with one pyrene unit.
Table 1.
Chemical shift values (δ) of pyrene protons in compounds 3–5 and 9–11 and the induced shifts (Δδ) between the pyrene protons a–i in compounds 3–5, with two pyrene units, and the corresponding pyrene protons in compounds 9–11, with one pyrene unit.
| Protons (δ: ppm) |
|---|
| Compound | a | b | c | d | e | f | g | h | i |
|---|
| 9 | 8.74 | 8.42 | 8.29 | 8.38 | 8.41 | 8.18 | 8.44 | 8.38 | 8.86 |
| 3 | 8.67 | 8.39 | 8.26 | 8.35 | 8.40 | 8.15 | 8.41 | 8.35 | 8.82 |
| Δδ (9–3) | 0.07 | 0.03 | 0.03 | 0.03 | 0.01 | 0.03 | 0.03 | 0.03 | 0.04 |
| 10 | 8.68 | 8.39 | 8.29 | 8.38 | 8.43 | 8.18 | 8.44 | 8.38 | 8.84 |
| 4 | 8.57 | 8.18 | 8.15 | 8.26 | 8.25 | 8.06 | 8.33 | 8.00 | 8.66 |
| Δδ (10–4) | 0.11 | 0.21 | 0.14 | 0.12 | 0.18 | 0.12 | 0.11 | 0.38 | 0.18 |
| 11 | 8.55 | 8.35 | 8.28 | 8.37 | 8.43 | 8.18 | 8.43 | 8.39 | 8.71 |
| 5 | 8.48 | 8.30 | 8.26 | 8.36 | 8.38 | 8.15 | 8.42 | 8.32 | 8.67 |
| Δδ(11–5) | 0.07 | 0.05 | 0.02 | 0.01 | 0.05 | 0.03 | 0.01 | 0.07 | 0.04 |
Table 1 shows that all the pyrene protons of
4 were shifted upfield compared to the corresponding protons of compound
10. The Δδ (
10–
4) values are larger than the corresponding values of Δδ (
9–
3) and Δδ (
11–
5). These results suggest that both pyrene units in compound
4 are closer together than those in
3 and
5, because it is well-established that π–π stacking interactions between two aromatic rings shield the protons due to the anisotropy of the ring current effect [
23,
24].
To examine the alkali metal ion binding abilities of compounds
3,
4, and
5, we investigated the absorption and fluorescent spectral changes in chloroform-acetonitrile (97:3, v/v). No alkali metal ion-dependent changes in the UV-Vis spectra of
3,
4, and
5 were observed upon addition of 300 μM Li
+, Na
+, K
+, Rb
+, and Cs
+ (all metal ions as perchlorate salts, except for Rb
+ as thiocyanate salt to enhance solubility) to 1.0 μM
3,
4, and
5. On the other hand, pyrene monomer emissions of
4 (at 438 nm), and
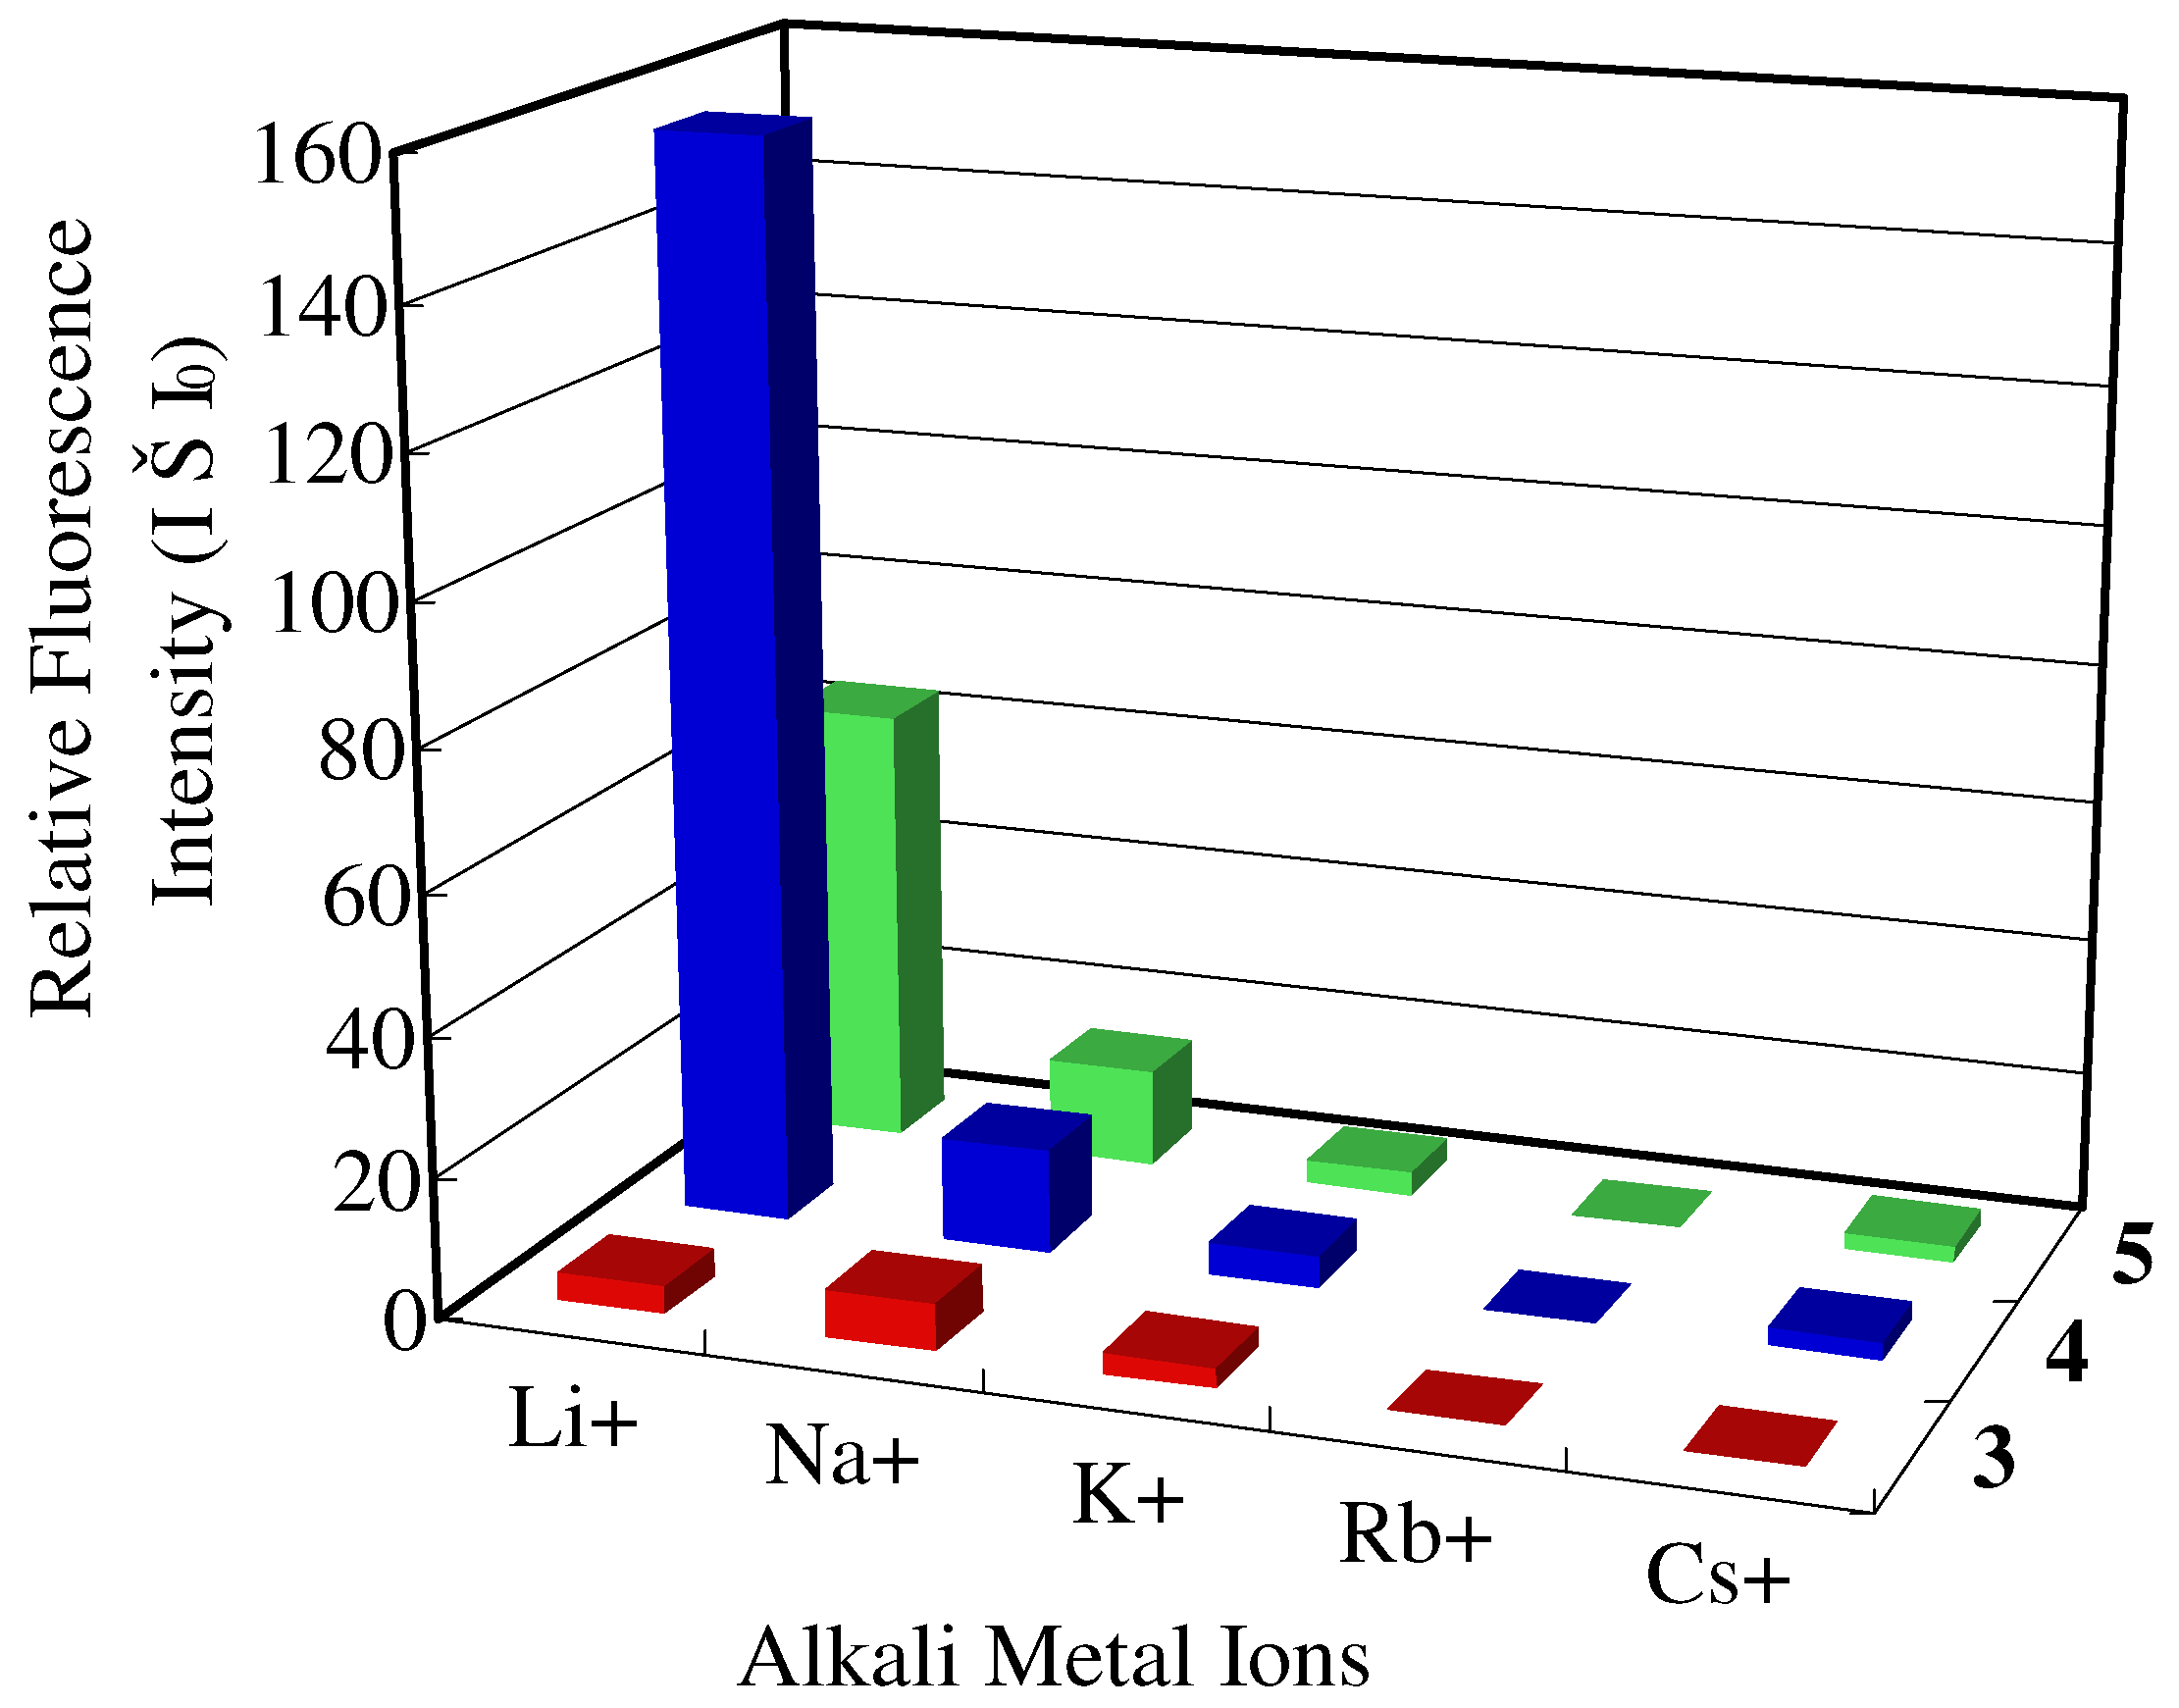
5 (at 438 nm) were enhanced by the addition of some alkali metal ions.
Figure 5 shows the relative fluorescence intensity (I–I
0), where I and I
0 are the fluorescence intensity in the presence of 300 equiv. of each metal ion and the fluorescence intensity in the absence of metal ions, respectively. The addition of Li
+ to solution
4, which has a sulfinyl group, induced a remarkable intensity change. In contrast, a moderate change in the fluorescence of compound
5, which has sulfonyl group, was observed with the addition of Li
+. For
3, which has a sulfur atom, no significant changes were observed. It is noteworthy that compounds
3,
4, and
5 interact slightly with Na
+ compared with compound
2[
11]. The oxygen atom(s) of the SO and SO
2 groups in compounds
4 and
5, which bridge two phenyl groups, apparently have a crucial role in binding Li
+, because even the compound
5 showed a moderate affinity to Li
+.
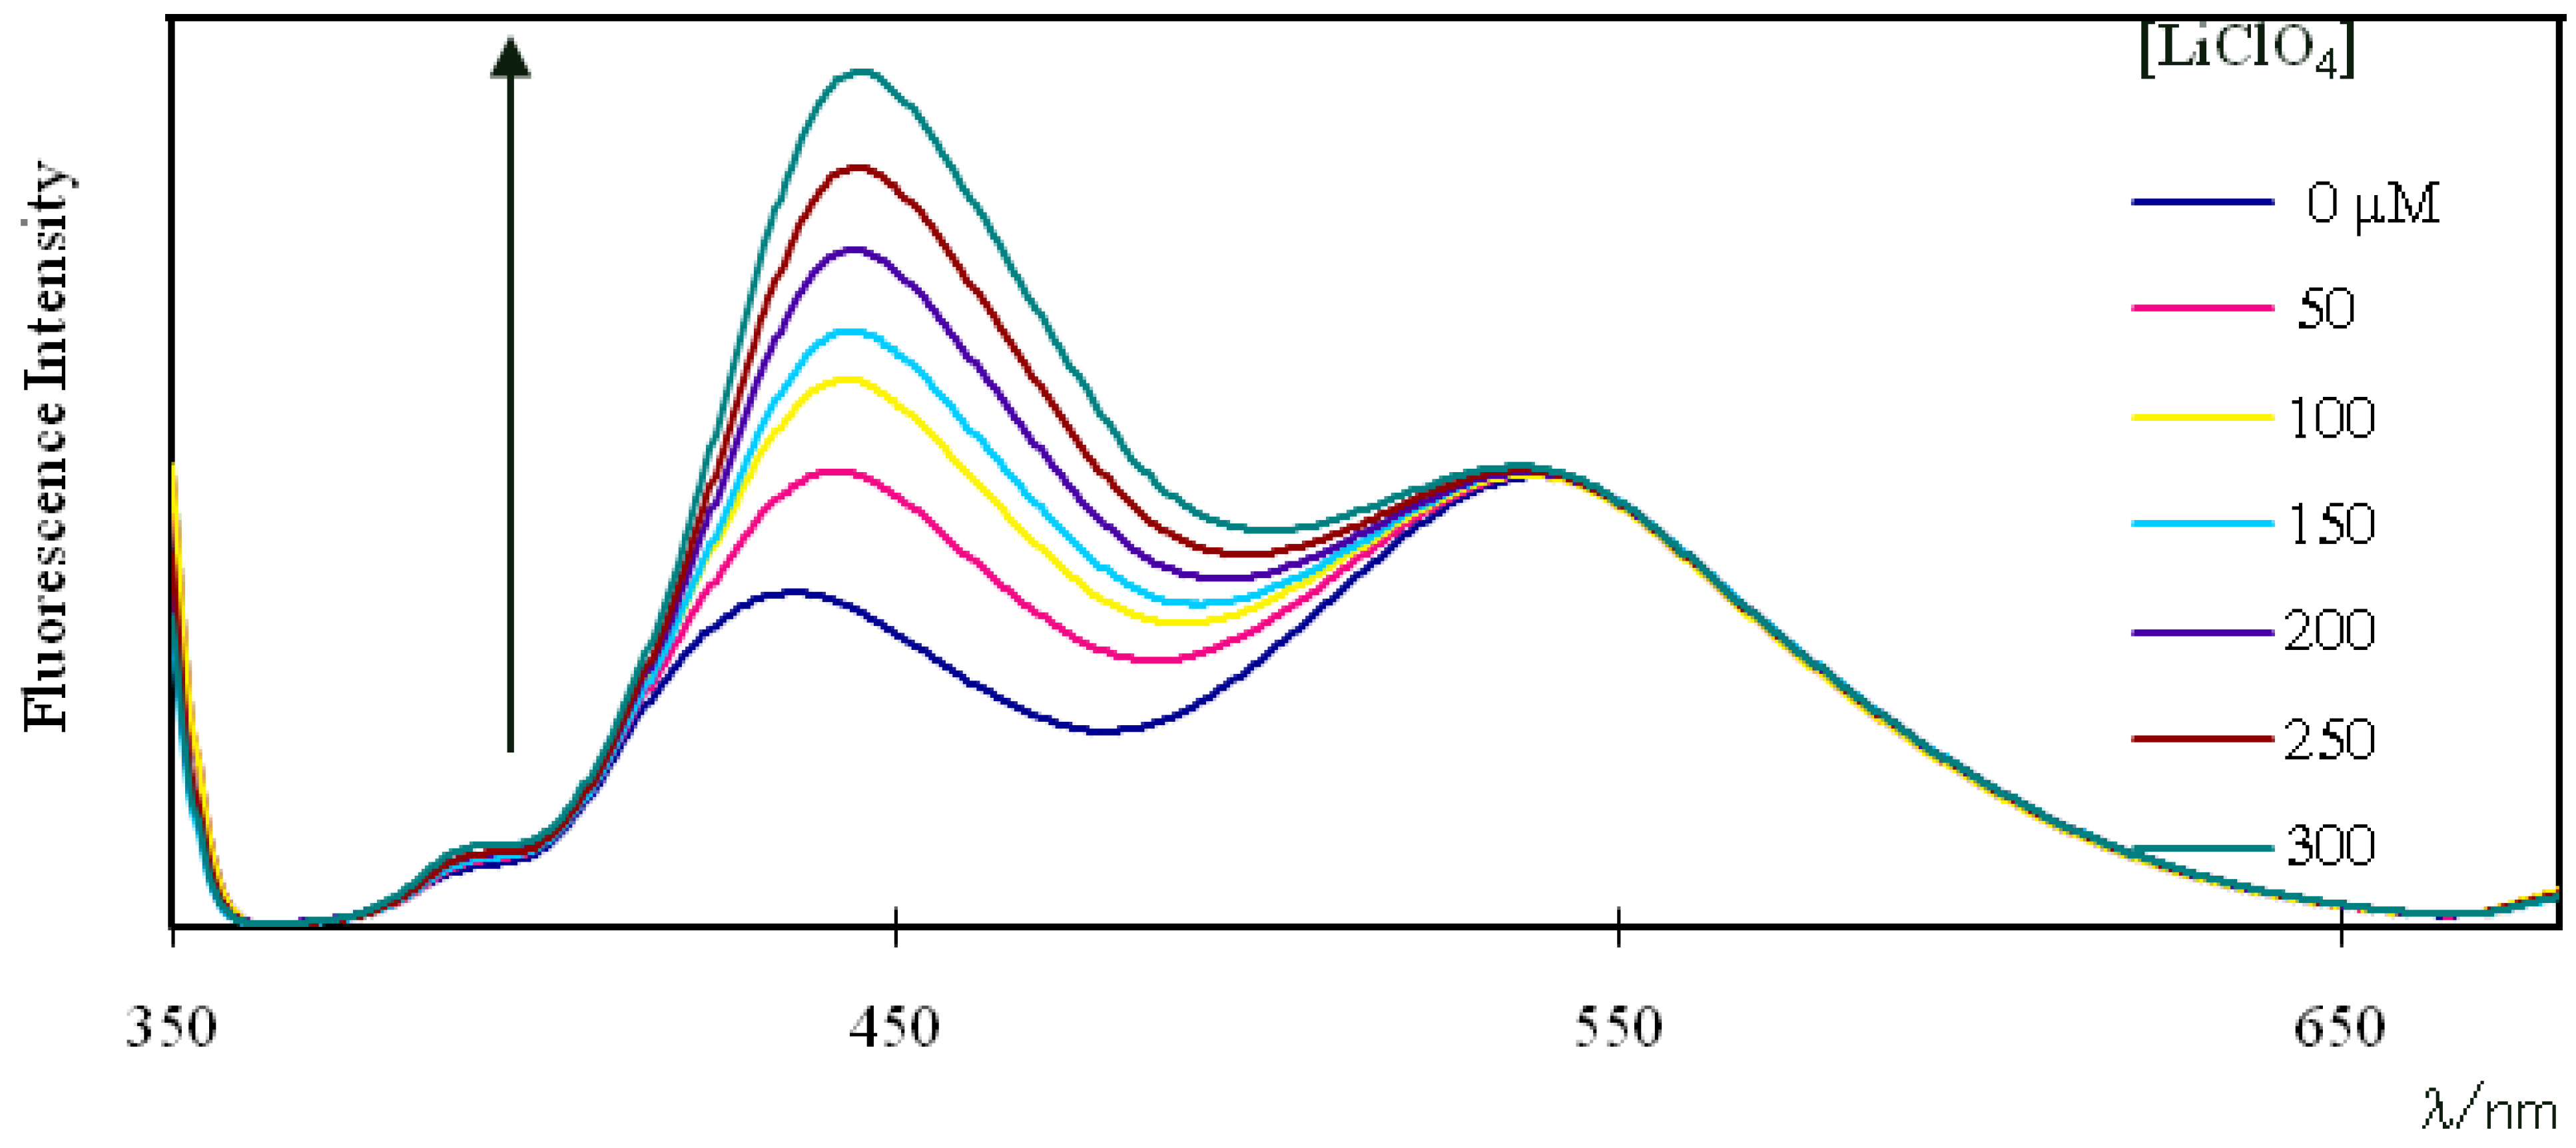
Figure 6 shows the change in fluorescence of compound
4 with various Li
+ concentrations under excitation at 360 nm. With the addition of Li
+ in the range of 50–300 μM, the pyrene monomer emission increased dramatically, and the pyrene excimer emission changed slightly. Similar fluorescence changes were observed for compound
5 by the addition of Li
+ (not shown).
Figure 5.
Effect of 300 μM alkali metal ions (Li+, Na+, K+, Rb+, Cs+) on the fluorescence spectra of compounds 3, 4, and 5 (1.0 μM) in chloroform-acetonitrile (97:3, v/v) at 419 nm for 3 and 438 nm for 4 and 5. I0 and I are the fluorescence intensities of 3, 4, and 5 in the absence and presence, respectively, of alkali metal ions.
Figure 6.
Changes in fluorescence spectra of a 1.0 μM solution of 4 in chloroform-acetonitrile (97:3, v/v) upon addition of LiClO4. Excitation wavelength: 360 nm.
Figure 6.
Changes in fluorescence spectra of a 1.0 μM solution of 4 in chloroform-acetonitrile (97:3, v/v) upon addition of LiClO4. Excitation wavelength: 360 nm.
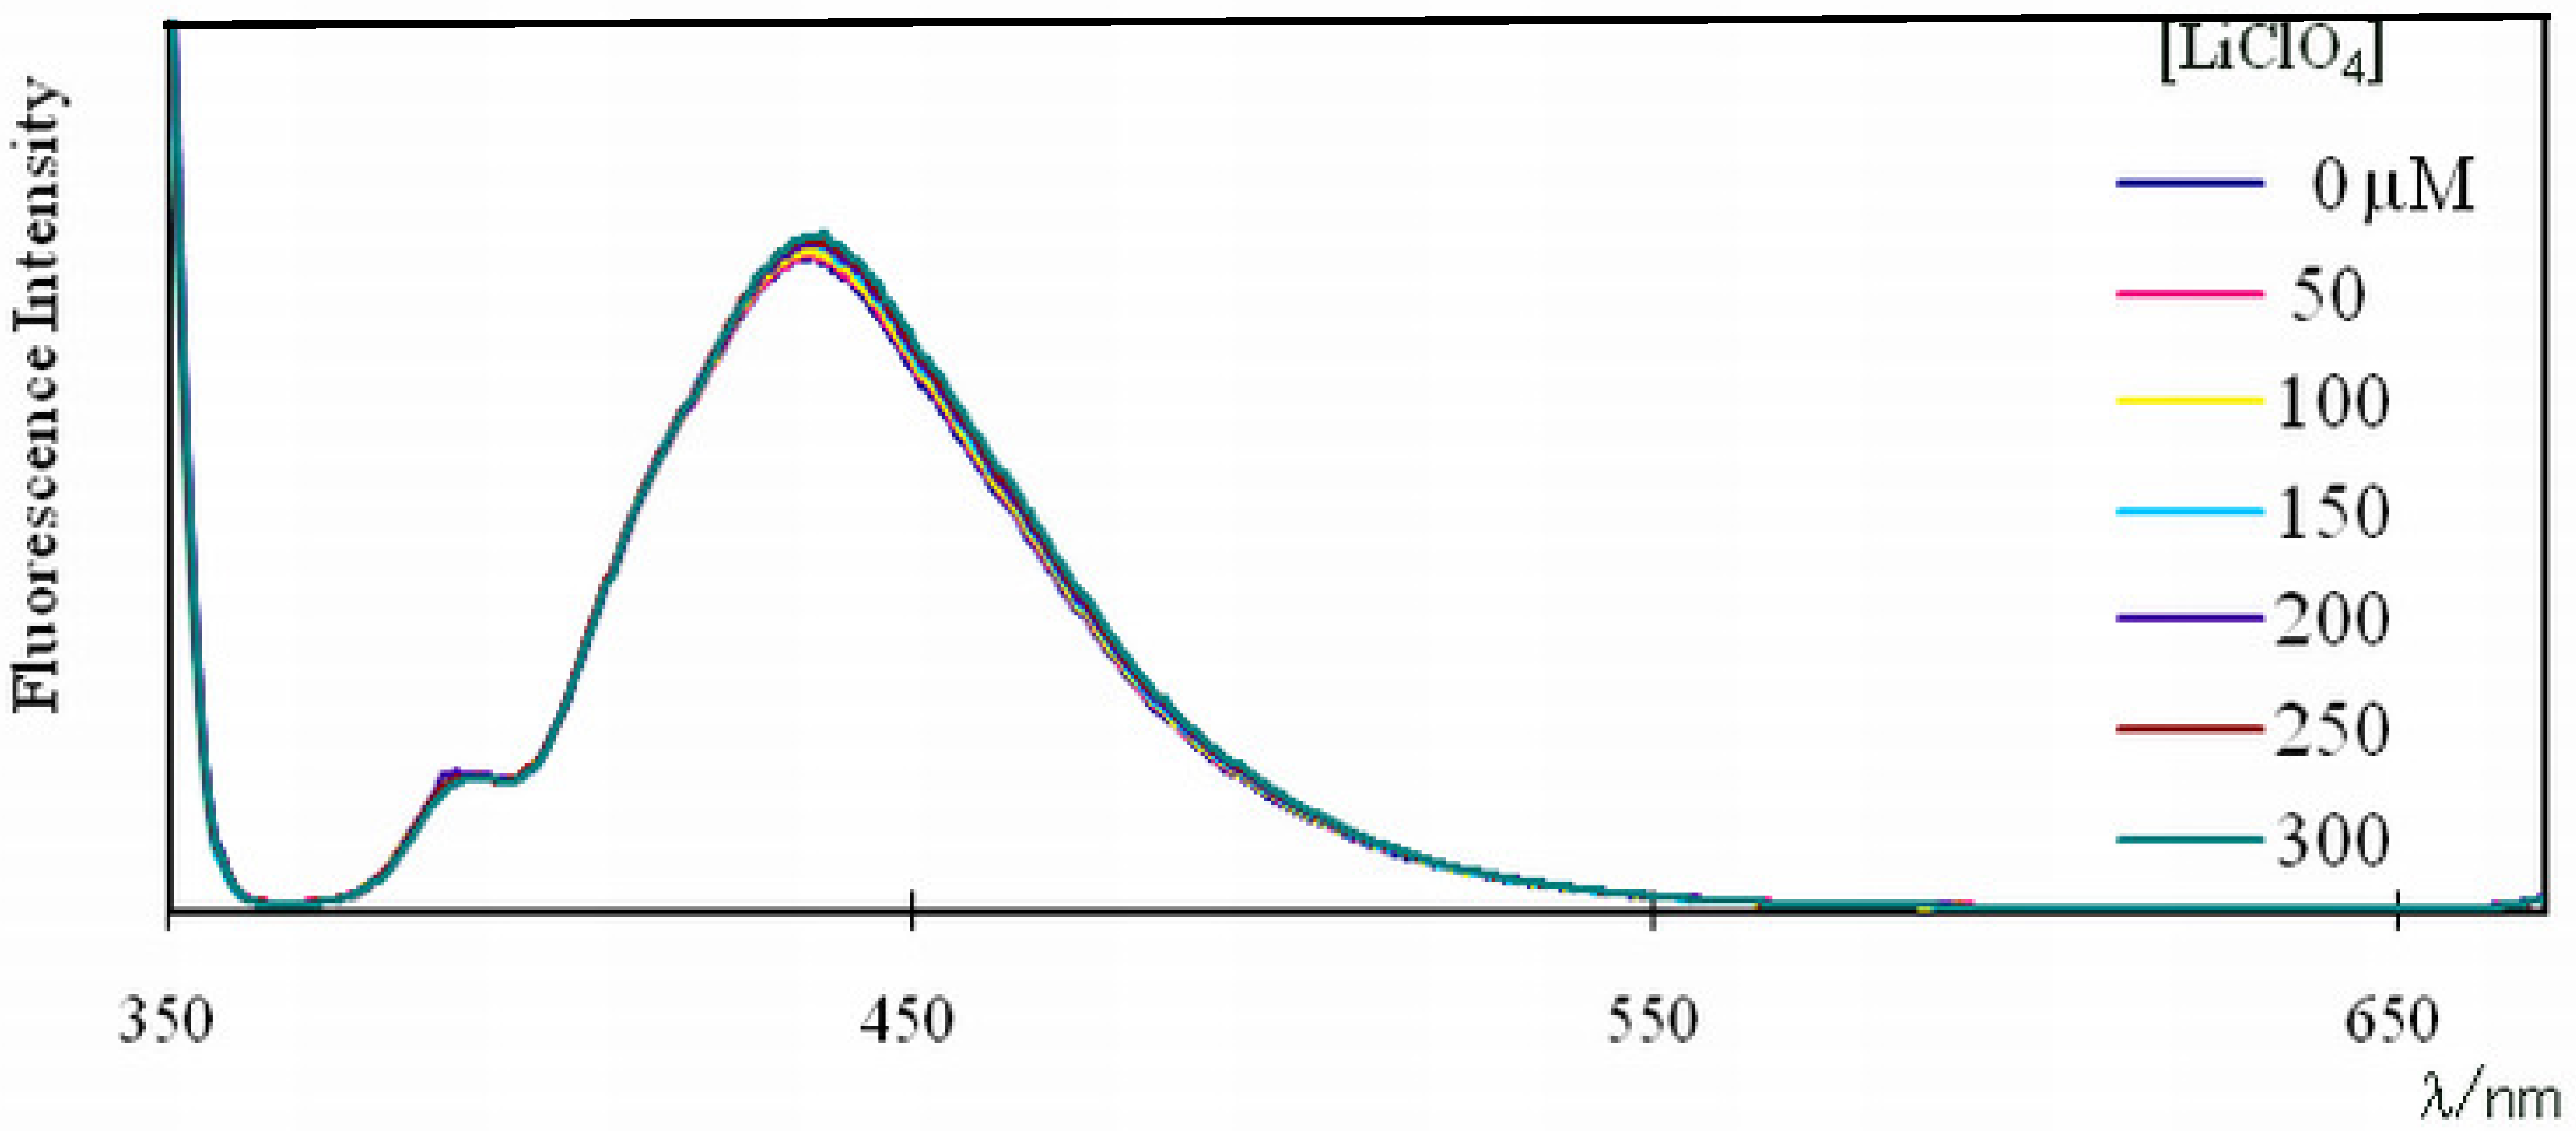
As shown in
Figure 7, the pyrene monomer emission of
10, with one pyrene unit, was unchanged by the addition of Li
+ in the range of 50–300 μM. This result clearly indicates that the increases in pyrene monomer emissions of compound
4 with increasing Li
+ concentration were caused by interaction between the two pyrene units in
4. Namely, these interactions in
4 weaken with increasing Li
+ concentration.
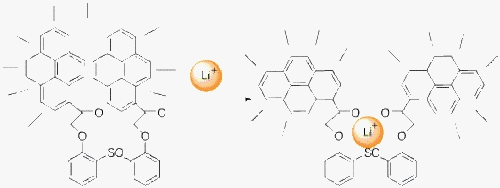
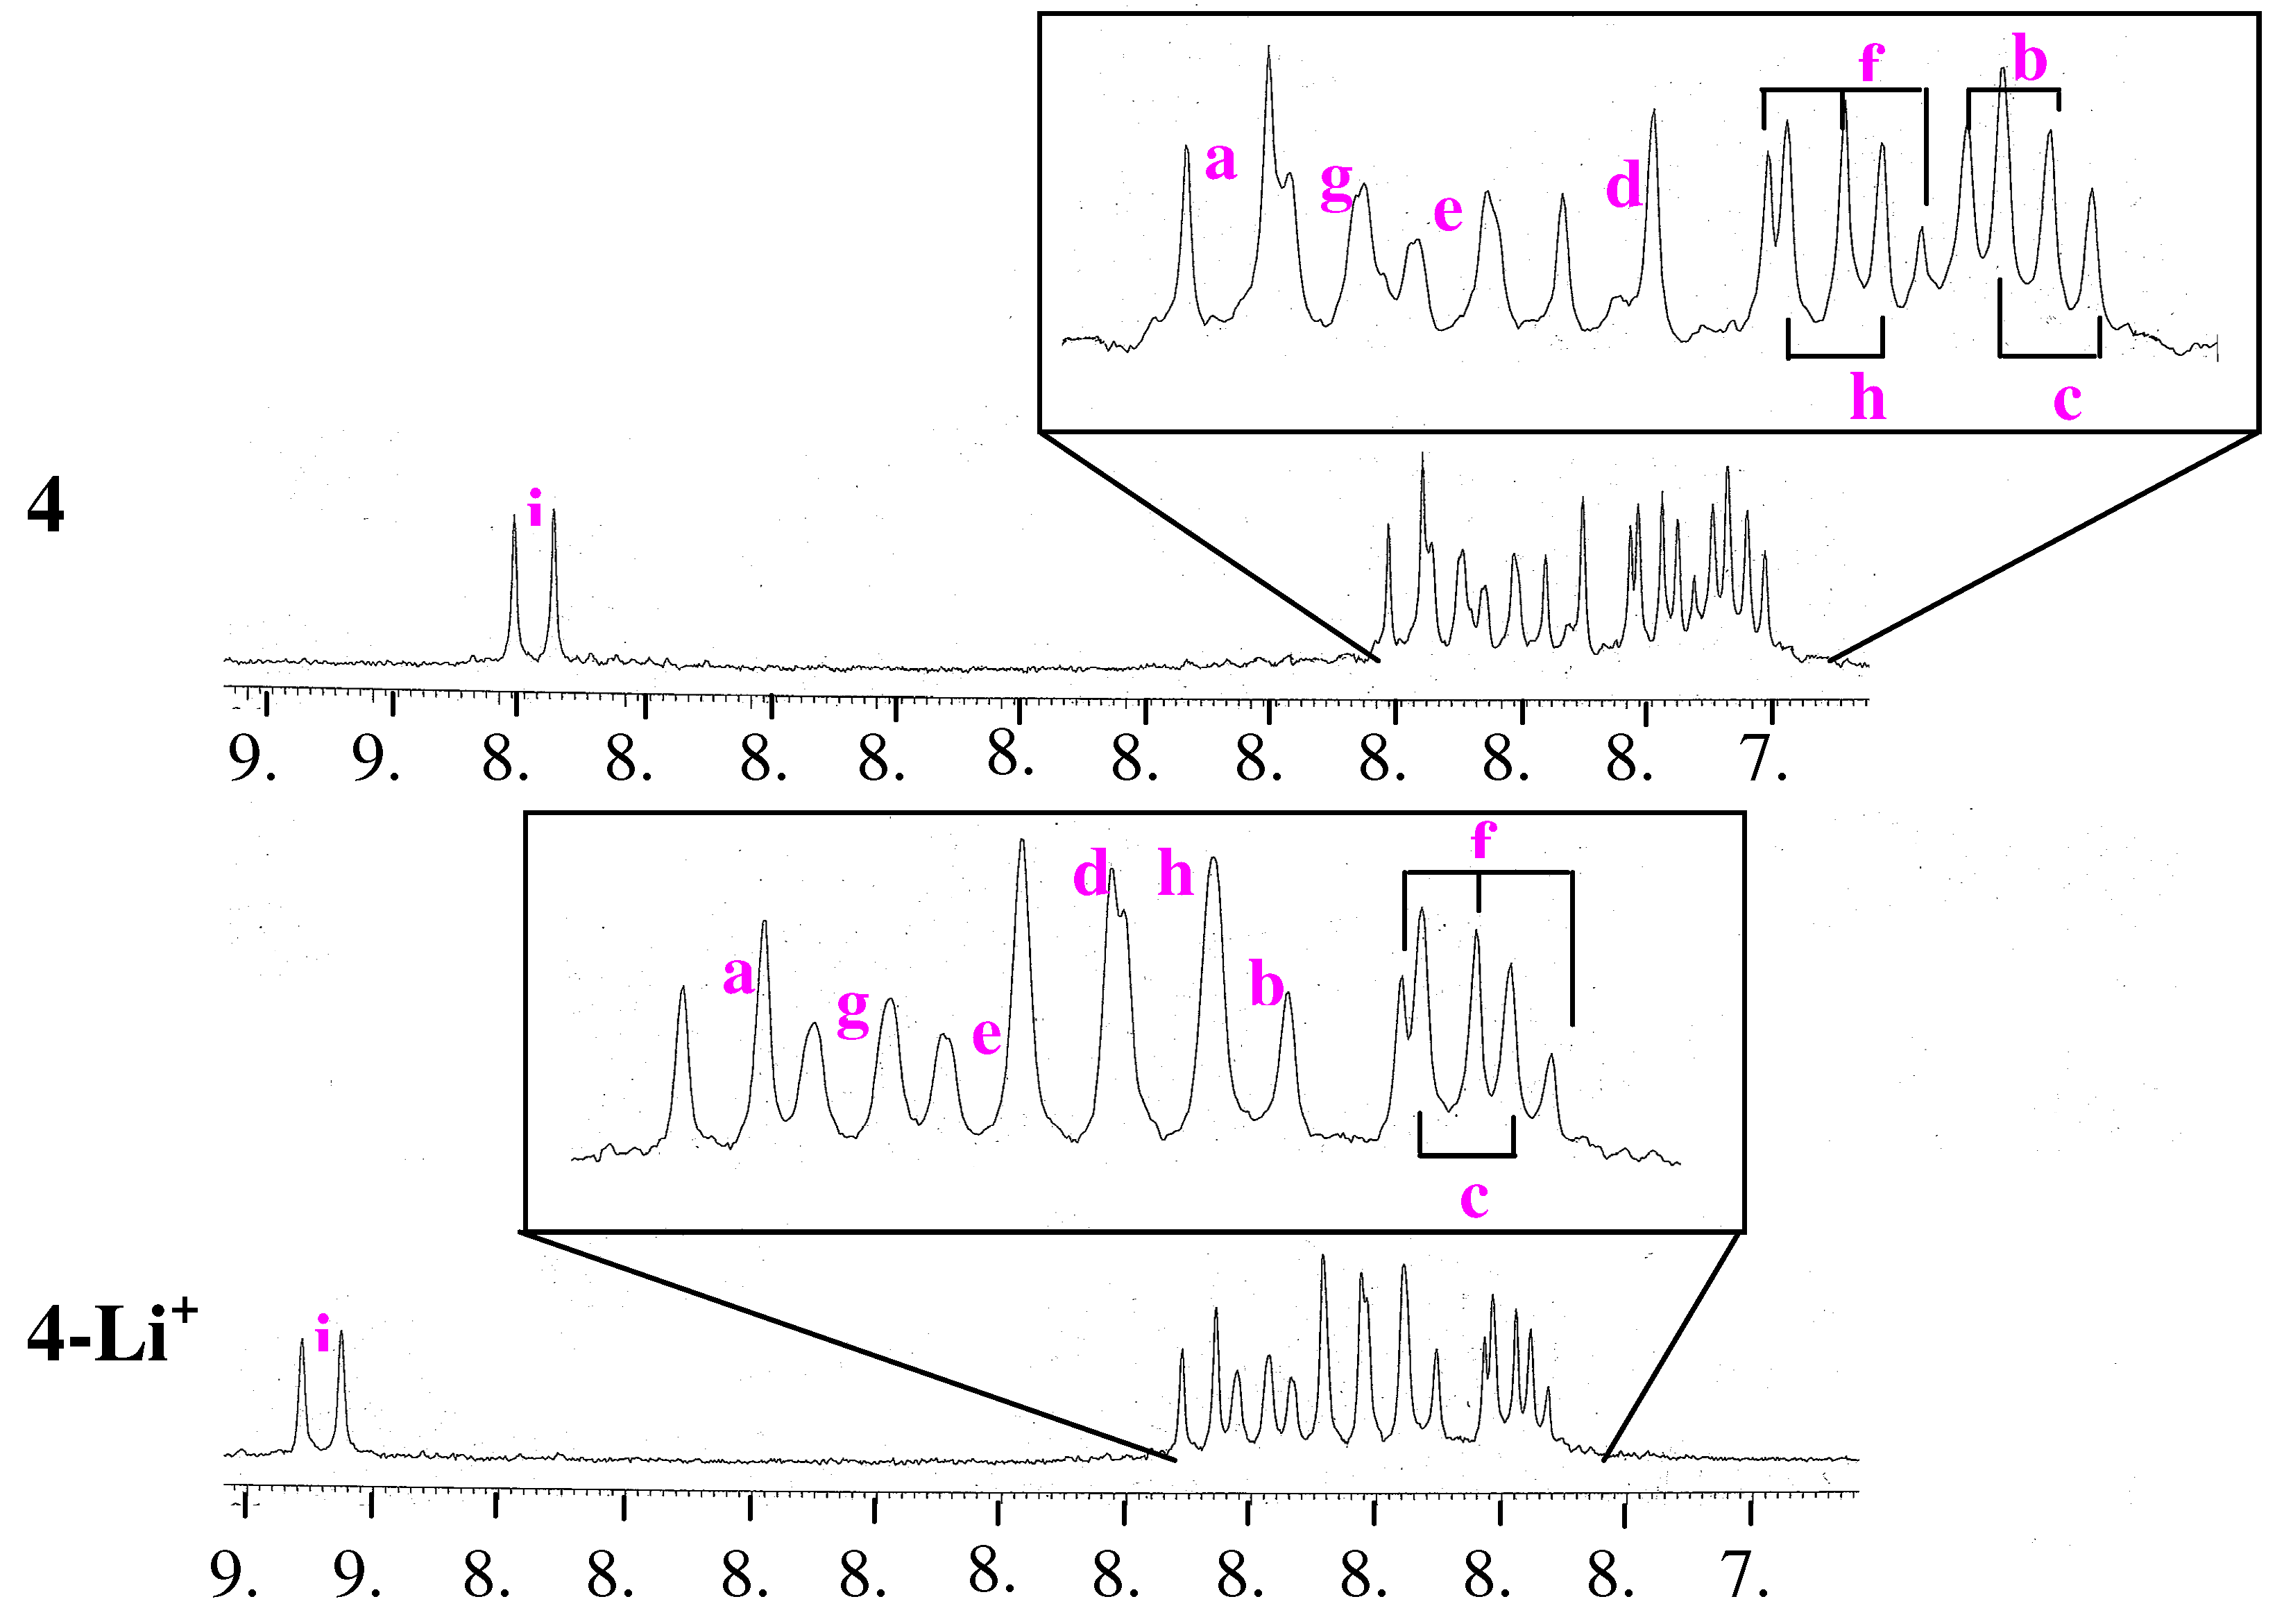
To confirm the conformational changes in compound
4 caused by the addition of Li
+, the chemical shifts of pyrene protons in compound
4 in the absence and presence of Li
+ were examined in CDCl
3-CD
3CN (97:3, v/v) by
1H-NMR spectroscopy [
7,
25]. The spectra of the pyrene units in
4 in the absence (
4) and presence (
4-Li+) of Li
+ are shown in
Figure 8. The chemical shifts (δ) and induced shifts (Δδ) of pyrene protons are listed in
Table 2. The signals for pyrene protons in
4-Li+ showed downfield shifts relative to the corresponding protons in
4. These results indicate that the π–π stacking interaction between the two pyrene units in
4 is weakened by the addition of Li
+.
Figure 7.
Changes in fluorescence spectra of a 1.0 μM solution of 10 in chloroform-acetonitrile (97:3, v/v) upon addition of LiClO4. Excitation wavelength: 360 nm.
Figure 7.
Changes in fluorescence spectra of a 1.0 μM solution of 10 in chloroform-acetonitrile (97:3, v/v) upon addition of LiClO4. Excitation wavelength: 360 nm.
Figure 8.
1H-NMR spectra of a 0.10 mM solution of 4 in CDCl3-CD3CN (97:3, v/v) in the absence (4) and presence (4-Li+) of Li+ (0.03 M).
Figure 8.
1H-NMR spectra of a 0.10 mM solution of 4 in CDCl3-CD3CN (97:3, v/v) in the absence (4) and presence (4-Li+) of Li+ (0.03 M).
Table 2.
Chemical shifts values (δ) of pyrene protons in 4 and 4-Li+, and the induced shifts (Δδ) between the pyrene protons in 4 and 4-Li+.
Table 2.
Chemical shifts values (δ) of pyrene protons in 4 and 4-Li+, and the induced shifts (Δδ) between the pyrene protons in 4 and 4-Li+.
| Protons (δ: ppm) |
|---|
| Compound | A | B | C | D | E | F | G | H | I |
|---|
| 4 | 8.18 | 7.92 | 7.90 | 8.05 | 8.10 | 7.97 | 8.14 | 7.98 | 8.87 |
| 4-Li+ | 8.34 | 8.17 | 8.09 | 8.23 | 8.26 | 8.09 | 8.30 | 8.19 | 9.04 |
| Δδ(4-4-Li+) | −0.16 | −0.25 | −0.19 | −0.18 | −0.16 | −0.12 | −0.16 | −0.21 | −0.17 |
The fluorophotometric and NMR spectroscopic studies described above indicate that the two pyrene units in compound
4 would be well separated in the presence of Li
+ compared to their location in the absence of Li
+. Therefore, the pyrene monomer emission is expected to increase and excimer emission is expected to decrease with increasing Li
+ concentration. However, the pyrene excimer emission in
4 changed slightly with the addition of Li
+, as shown in
Figure 6. This is believed to be due to the small fluorescence intensity ratio (I
e/I
m) for compound
4 (1.32). In general, pyrene-functionalized fluoroionophores having a large fluorescence intensity ratio (I
e/I
m) before the addition of metal ions show a great decrease in pyrene excimer emission with increasing metal ion concentration. For example, two pyrene-functionalized calix[4]arenes having an (I
e/I
m) ratio of about 4.16, as reported by Jin et al., showed a great decrease in pyrene excimer emission with increasing Na
+ concentration [
26]. Even compound
2, with an (I
e/I
m) ratio of 2.91, as we reported, showed a gradual decrease in pyrene excimer emission with increasing Na
+ concentration [
10].
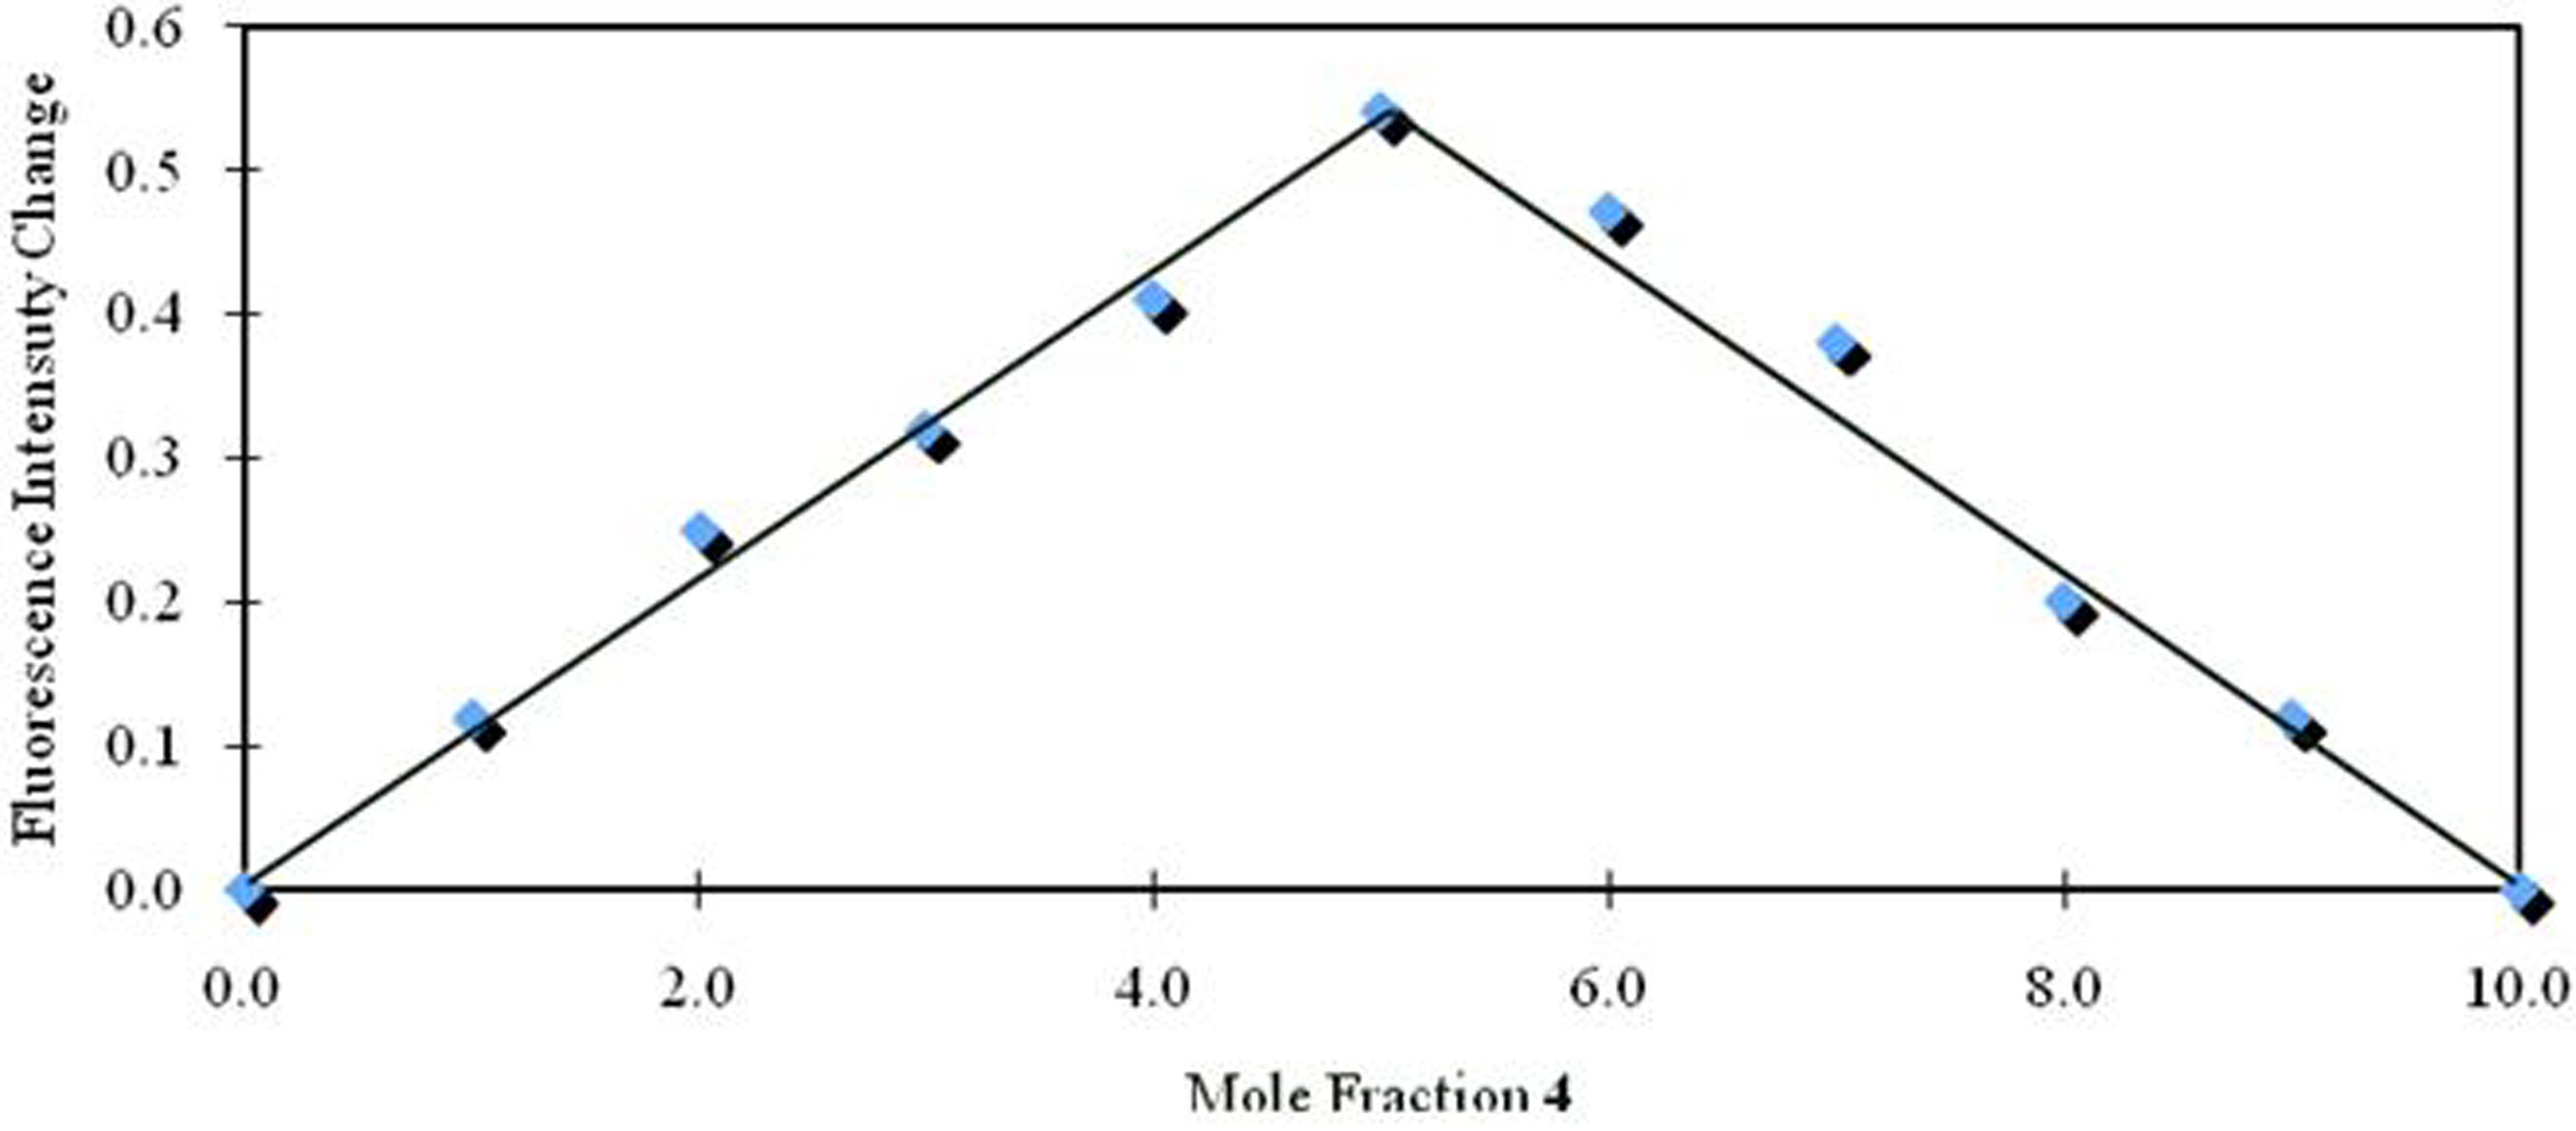
The stoichiometry of compound
4 and Li
+ was confirmed by a Job plot (
Figure 9) using fluorescent titrations of 1.0 μM chloroform-acetonitrile (97:3, v/v) solutions of
4 with 1.0 μM chloroform-acetonitrile (97:3, v/v) solutions of lithium perchlorate. Consequently, the Job plot represented the formation of a 1:1 complex.
Figure 9.
Job plot for the binding of Li+ with 4.
Figure 9.
Job plot for the binding of Li+ with 4.
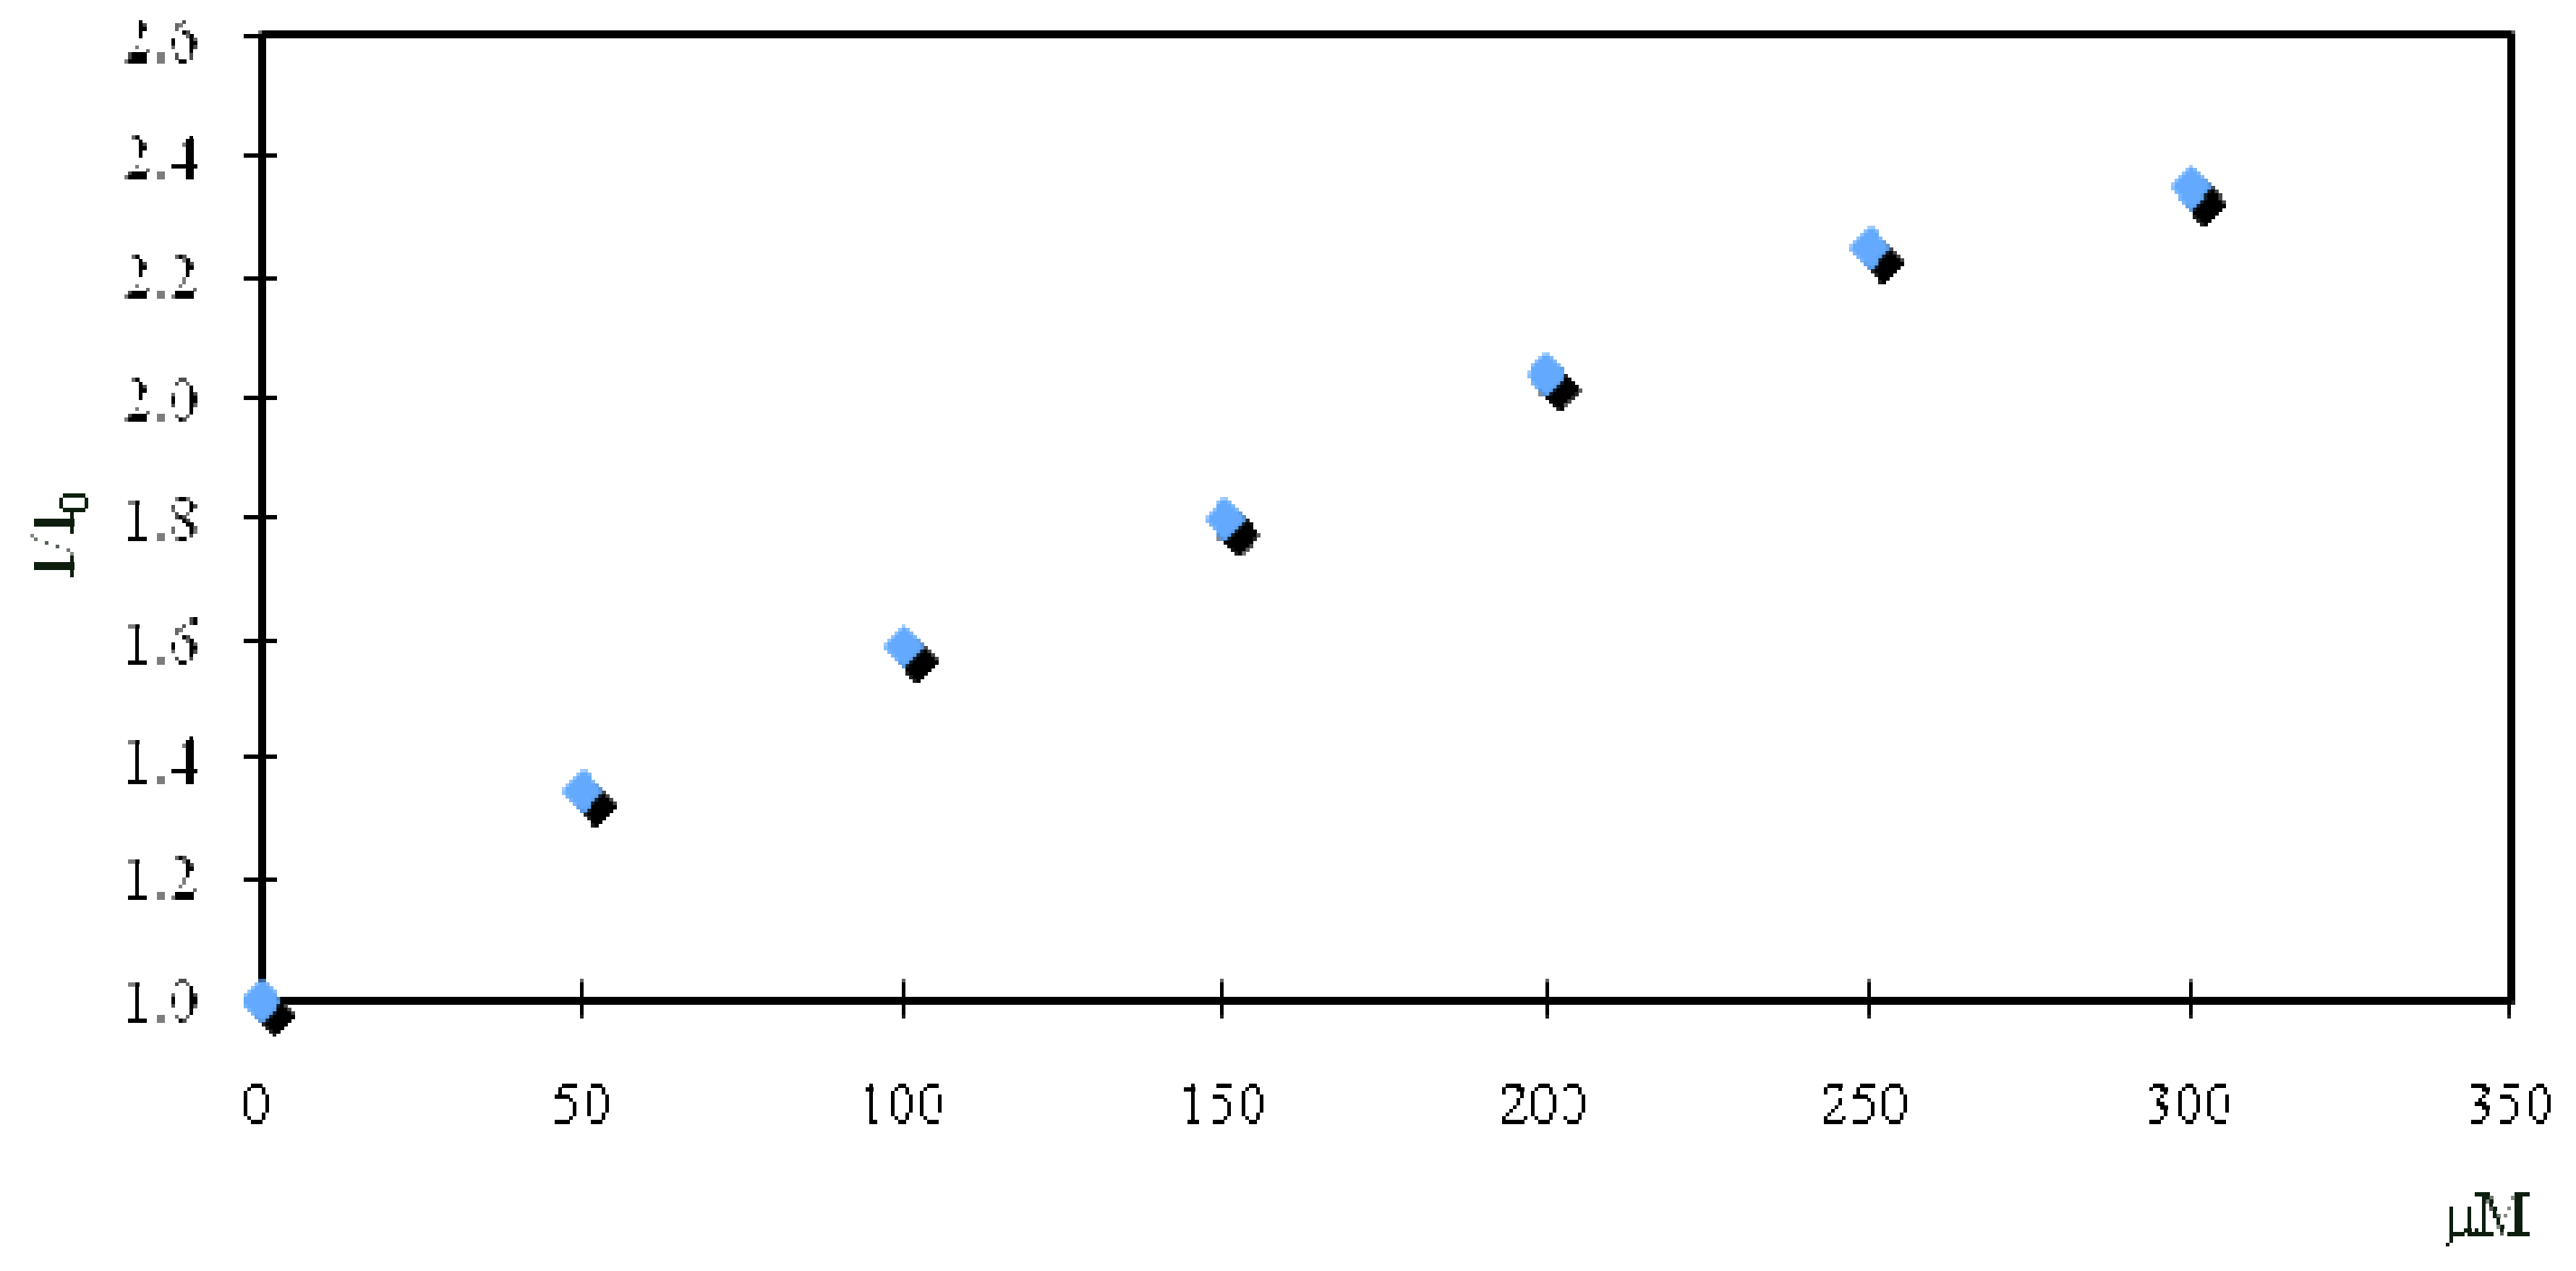
Figure 10 shows plots of the relative fluorescence intensity (I/I
0) for
4 at 438 nm against the added Li
+ concentration. The association constant of compound
4 for Li
+ was calculated to be 1.14 × 10
3 M
−1 on the basis of the Benesi–Hildebrand method by plotting 1/(F–F
0) against 1/[Li
+], where F
0 and F are the fluorescence intensities in the absence and presence, respectively, of Li
+. By the same method, the association constant of compound
5 for Li
+ was calculated to be 2.83 × 10
2 M
−1.
Figure 10.
Relative fluorescence intensity (I/I0) of compound 4 (1 μM) in the absence and presence (0–300 μM) of Li+. The fluorescence intensities were monitored at 438 nm by excitation at 360 nm. I0 and I are the fluorescence intensity of 4 in the absence and presence, respectively, of Li+.
Figure 10.
Relative fluorescence intensity (I/I0) of compound 4 (1 μM) in the absence and presence (0–300 μM) of Li+. The fluorescence intensities were monitored at 438 nm by excitation at 360 nm. I0 and I are the fluorescence intensity of 4 in the absence and presence, respectively, of Li+.


