Article

An Improved Method for Removal of Azo Dye Orange II from Textile Effluent Using Albumin as Sorbent

by
Tadashi Ohashi
1,2,
Alícia M. T. Jara
2,3,
Anabelle C. L. Batista
2,3,
Luciana O. Franco
2,4,
Marcos A. Barbosa Lima
2,4,
Mohand Benachour
5,
Carlos A. Alves Da Silva
2 and
Galba M. Campos-Takaki
2,*
1
Technical School SENAI-Paulista, Paulista 53417-710, PE, Brazil
2
Nucleus of Research in Environmental Sciences-NPCIAMB, Catholic University of Pernambuco, UNICAP, 50050-590 Recife, PE, Brazil
3
Network of Biotechnology, Catholic University of Pernambuco, Recife 50050-900, PE, Brazil
4
Microbiology Department, Federal Rural University of Pernambuco, Recife 52171-900, PE, Brazil
5
Chemical Engineering Department, Federal University of Pernambuco, Recife 50670-901, PE, Brazil
*
Author to whom correspondence should be addressed.
Molecules 2012, 17(12), 14219-14229; https://doi.org/10.3390/molecules171214219
Submission received: 10 October 2012 / Revised: 24 November 2012 / Accepted: 27 November 2012 / Published: 30 November 2012
(This article belongs to the Section Natural Products Chemistry)

Abstract

:
Azo dyes are generally resistant to biodegradation due to their complex structures. Acid orange II is one of the most widely used dyes in the textile industry. The influence of bovine serum albumin (BSA) in different concentrations, pH, and time of contact on Orange II was investigated using kinetics and adsorption-isotherm experiments. The results showed that the maximum colour removed from dye/albumin was 99.50% and that a stable dye-protein complex had been formed at pH 3.5 and in a proportion of 1:3 (v/v), respectively. The synthetic effluent did not show toxicity to the microcrustacean Artemia salina, and showed a CL50 equal to 97 µg/mL to azo dye orange II. Additionally, the methodology was effective in removing the maximum of orange II using BSA by adsorption at pH 3.5 which mainly attracted ions to the azo dye during the adsorption process. This suggests that this form of treatment is economical and easy to use which potentially could lead to bovine serum albumin being used as a sorbent for azo dyes.

1. Introduction

The release of colored wastewaters from the textile industry is a current problem encountered in developed and under developed countries all over the World, and this phenomenon is particularly notable for toxic products such as azo dye pigments which are known for their efficiency in the dyeing process. Azo dyes, which mostly consist of aromatic moieties linked together by -N=N- bonding (a type of chromophore), represent the largest class among these pollutants which are water soluble. Their release into the natural environment, mainly in an aqueous medium, is undesirable because of the adverse effect of these toxic and carcinogenic compounds on aquatic life that thus causes the destruction of ecosystems [1,2,3,4].
Currently, the textile industry uses more than 10,000 ± types of dyes, and 6,000 of these pigments are mono-azo or polyazoic azo dyes. In Brazil the textile industry accounts for 2.6% of the global demand for these azo dyes [5,6]. However, the literature reports that a significant amount of these dyes (10 to 35%) is not fixed to the fibres and the pigment can be lost, and released into the environment, which can lead to the inhibition of photosynthesis [7,8,9,10].
Various physical-chemical processes and biological methods (filtration, coagulation, precipitation, adsorption, ion exchange, and oxidation) were used in the past to remove dye coloration from wastewater. However, a lack of efficiency was observed in this process because the pollution is simply transferred from one phase to another which leads to the treatment of textile effluents being costly. The presence of heavy metals associated with the dyes may also cause chronic toxicity and human health problems [11,12,13,14,15].
Previous studies describing the use of proteins for adsorption processes focused on the physico-chemical process. Additionally, the process of membrane filtration was investigated in biomedical research using a physico-chemical process to adsorb proteins, and for their subsequent separation [16]. One must first understand the serum binding ability of the small molecules of interest, as described in detail in the literature with regard to the extraction of dyes. The diffusion of dye molecules is directly related to their size and colloidal properties [17].
Studies on filtration membranes are often applied to the movement of extracorporeal and macromolecules, such as polysaccharides or proteins, and this phenomenon has been observed in haemodialysis studies, when considering the interaction between heparin and plasmatic proteins [18,19]. Bovine serum albumin-BSA is the most abundant protein in blood plasma, and works as a transport protein for several substances, and has properties such as pH-dependent binding and interaction considering the efficiency and economic viability [20,21,22,23]. The method of vacuum filtration for the retention of synthetic dyes is described by the literature as being poor, its success being related to the extent of membrane porosity and the molecular size of synthetic dyes as prerequisites for adsorption and vacuum filtration [24,25,26].
This paper investigates the effect of pH on the adsorption process of the azo dye Orange II using bovine serum albumin (BSA), focusing on the possible interactions associated with the decolorization process, given the principle of the interaction between the dye molecules (cationic system) and albumin. The physical process of vacuum filtration was used to evaluate the decolourization of the effluent, and the complex albumin-Orange II formed, followed by evaluation of the toxicity of the decolorized effluent using the microcrustacean Artemia salina.

2. Results and Discussion

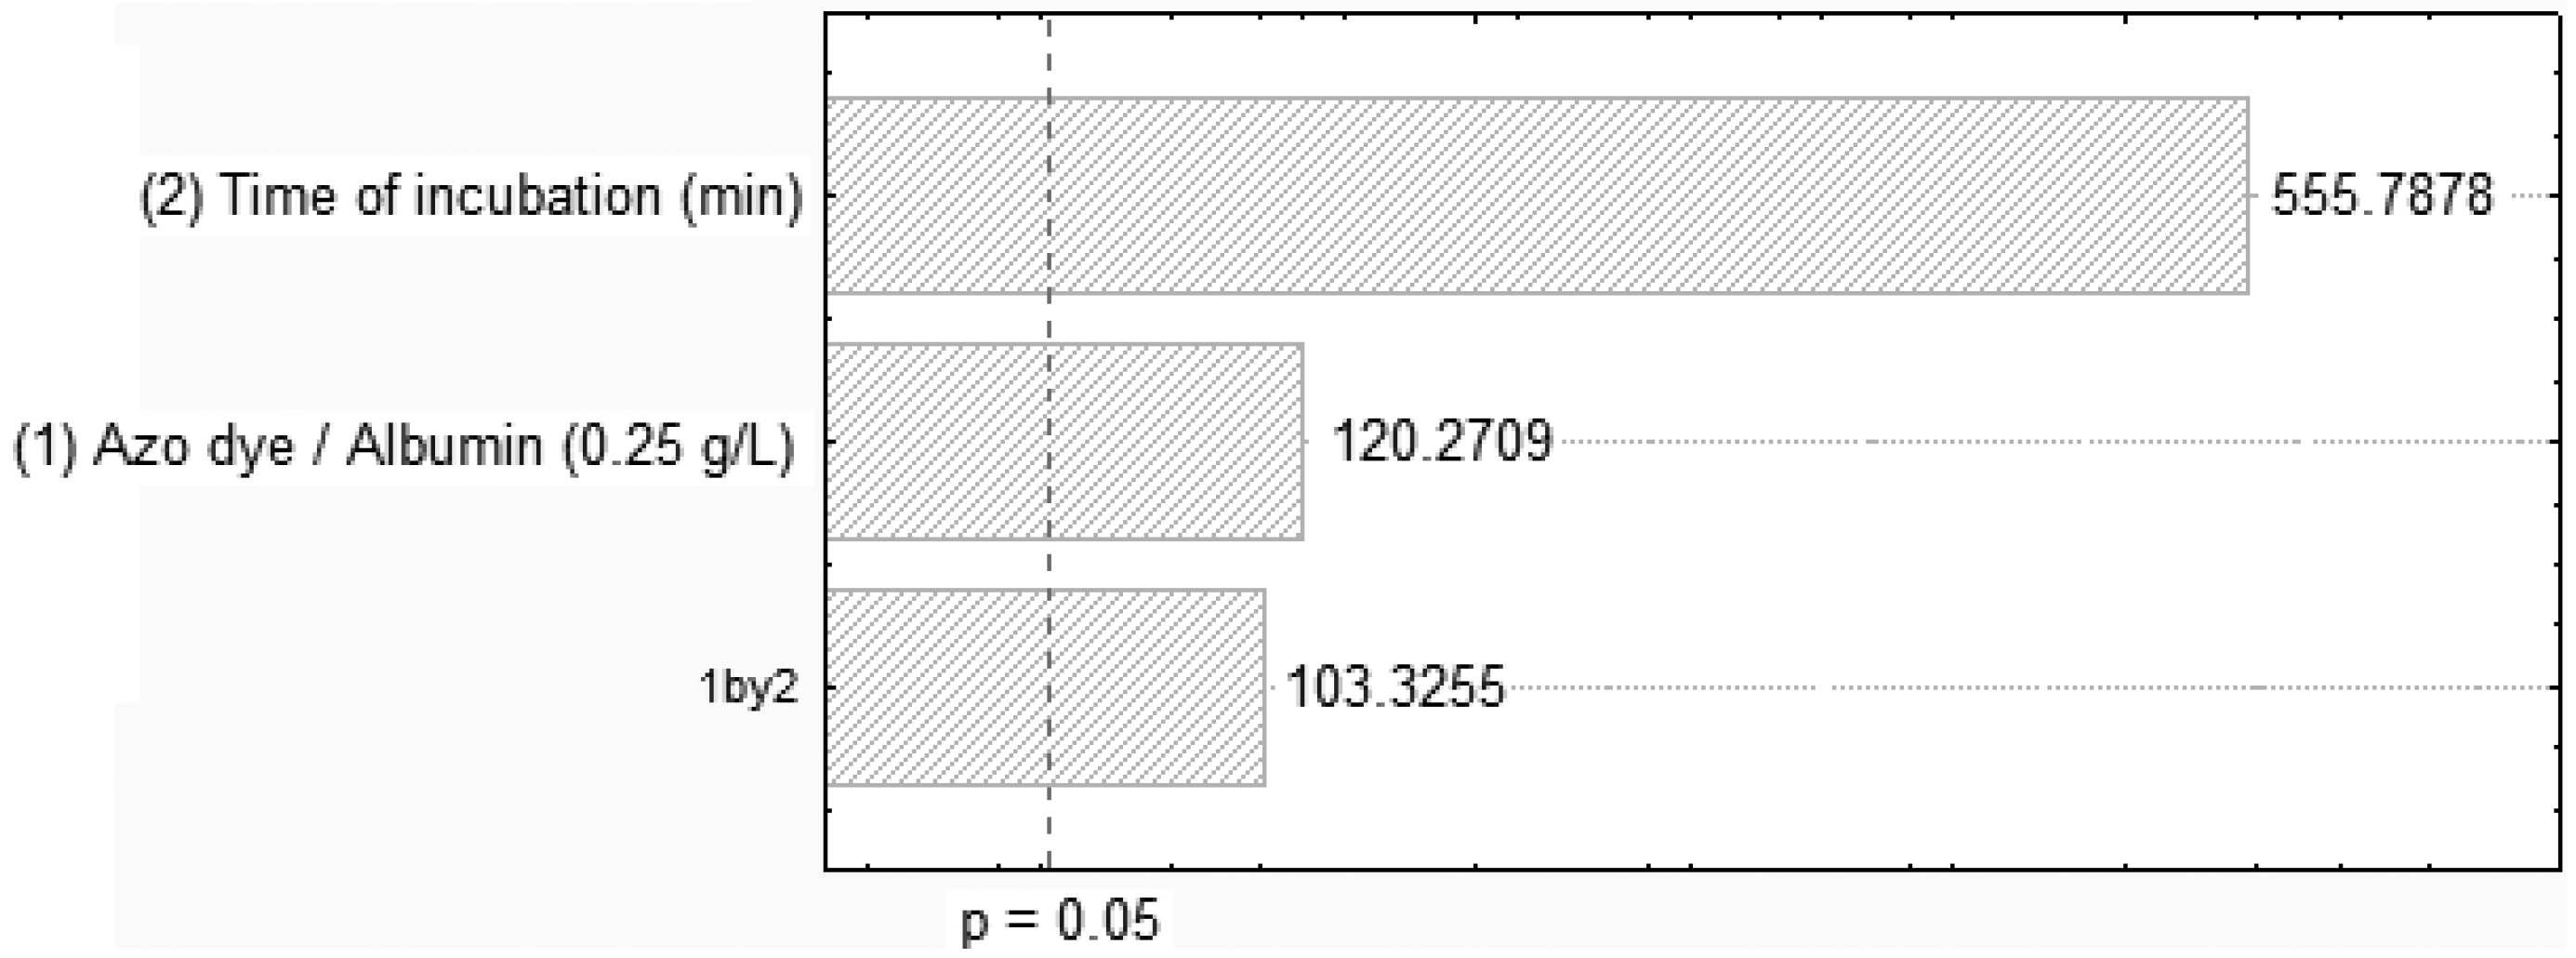
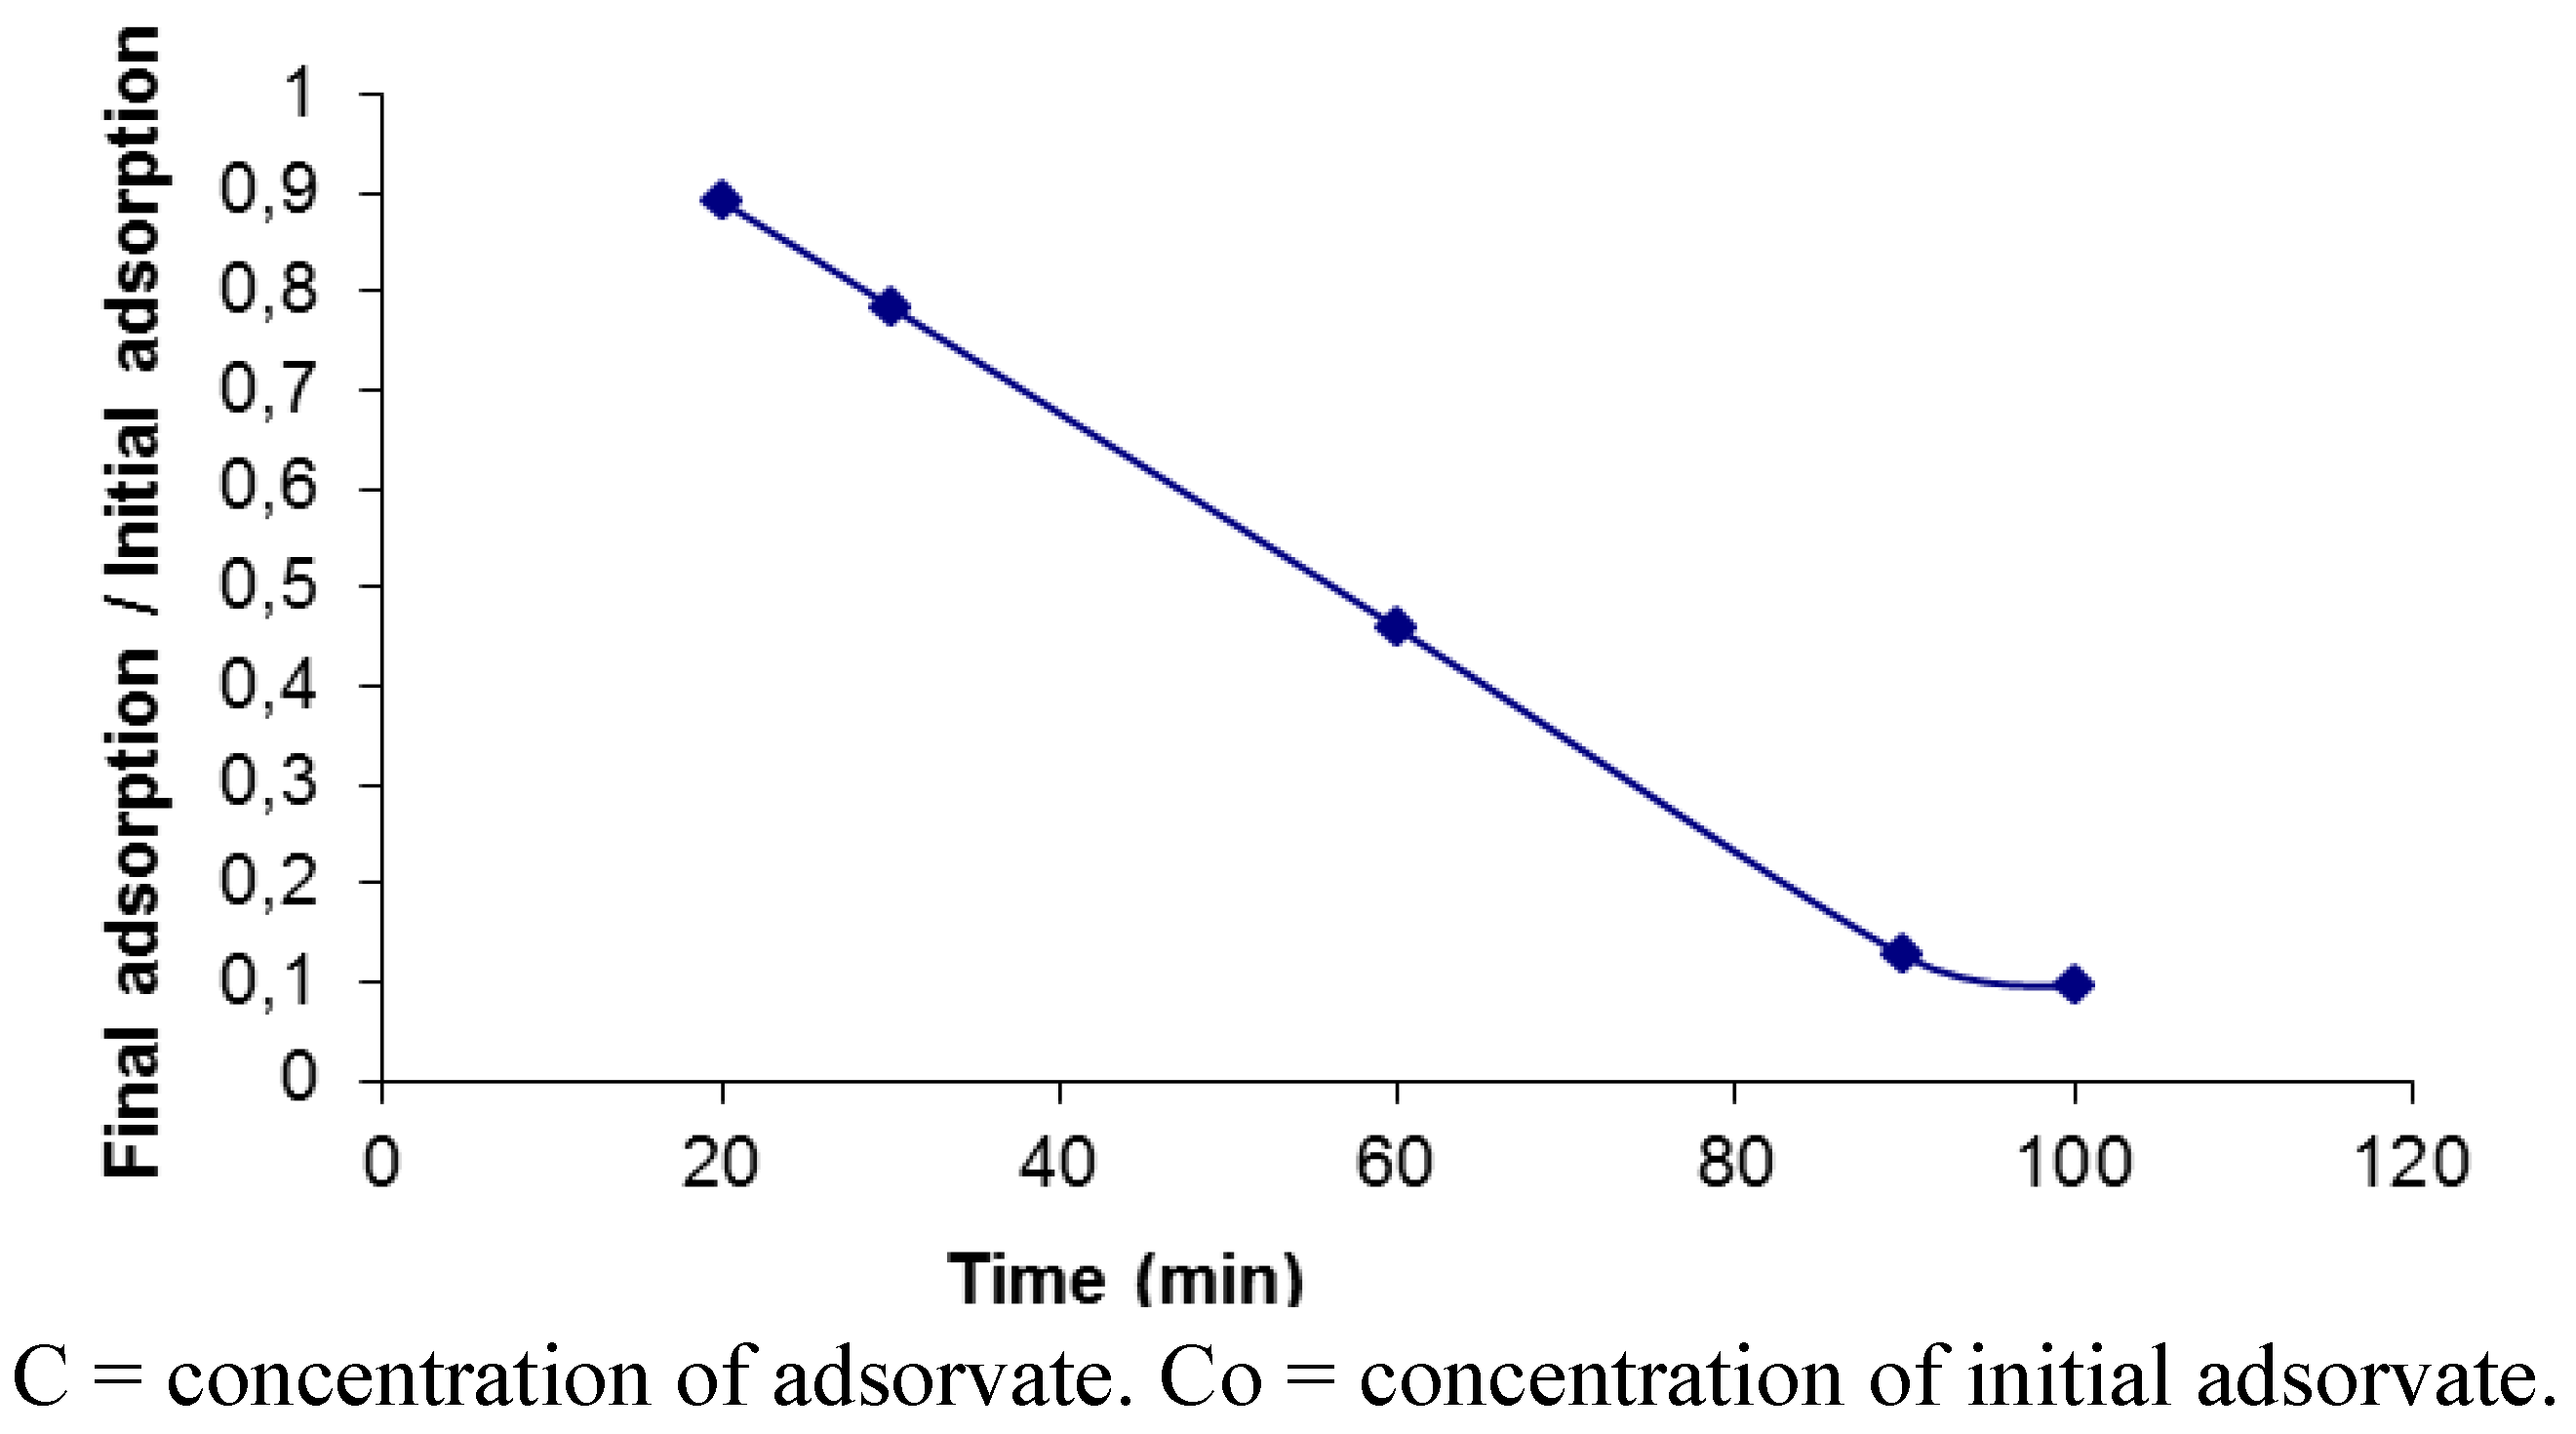
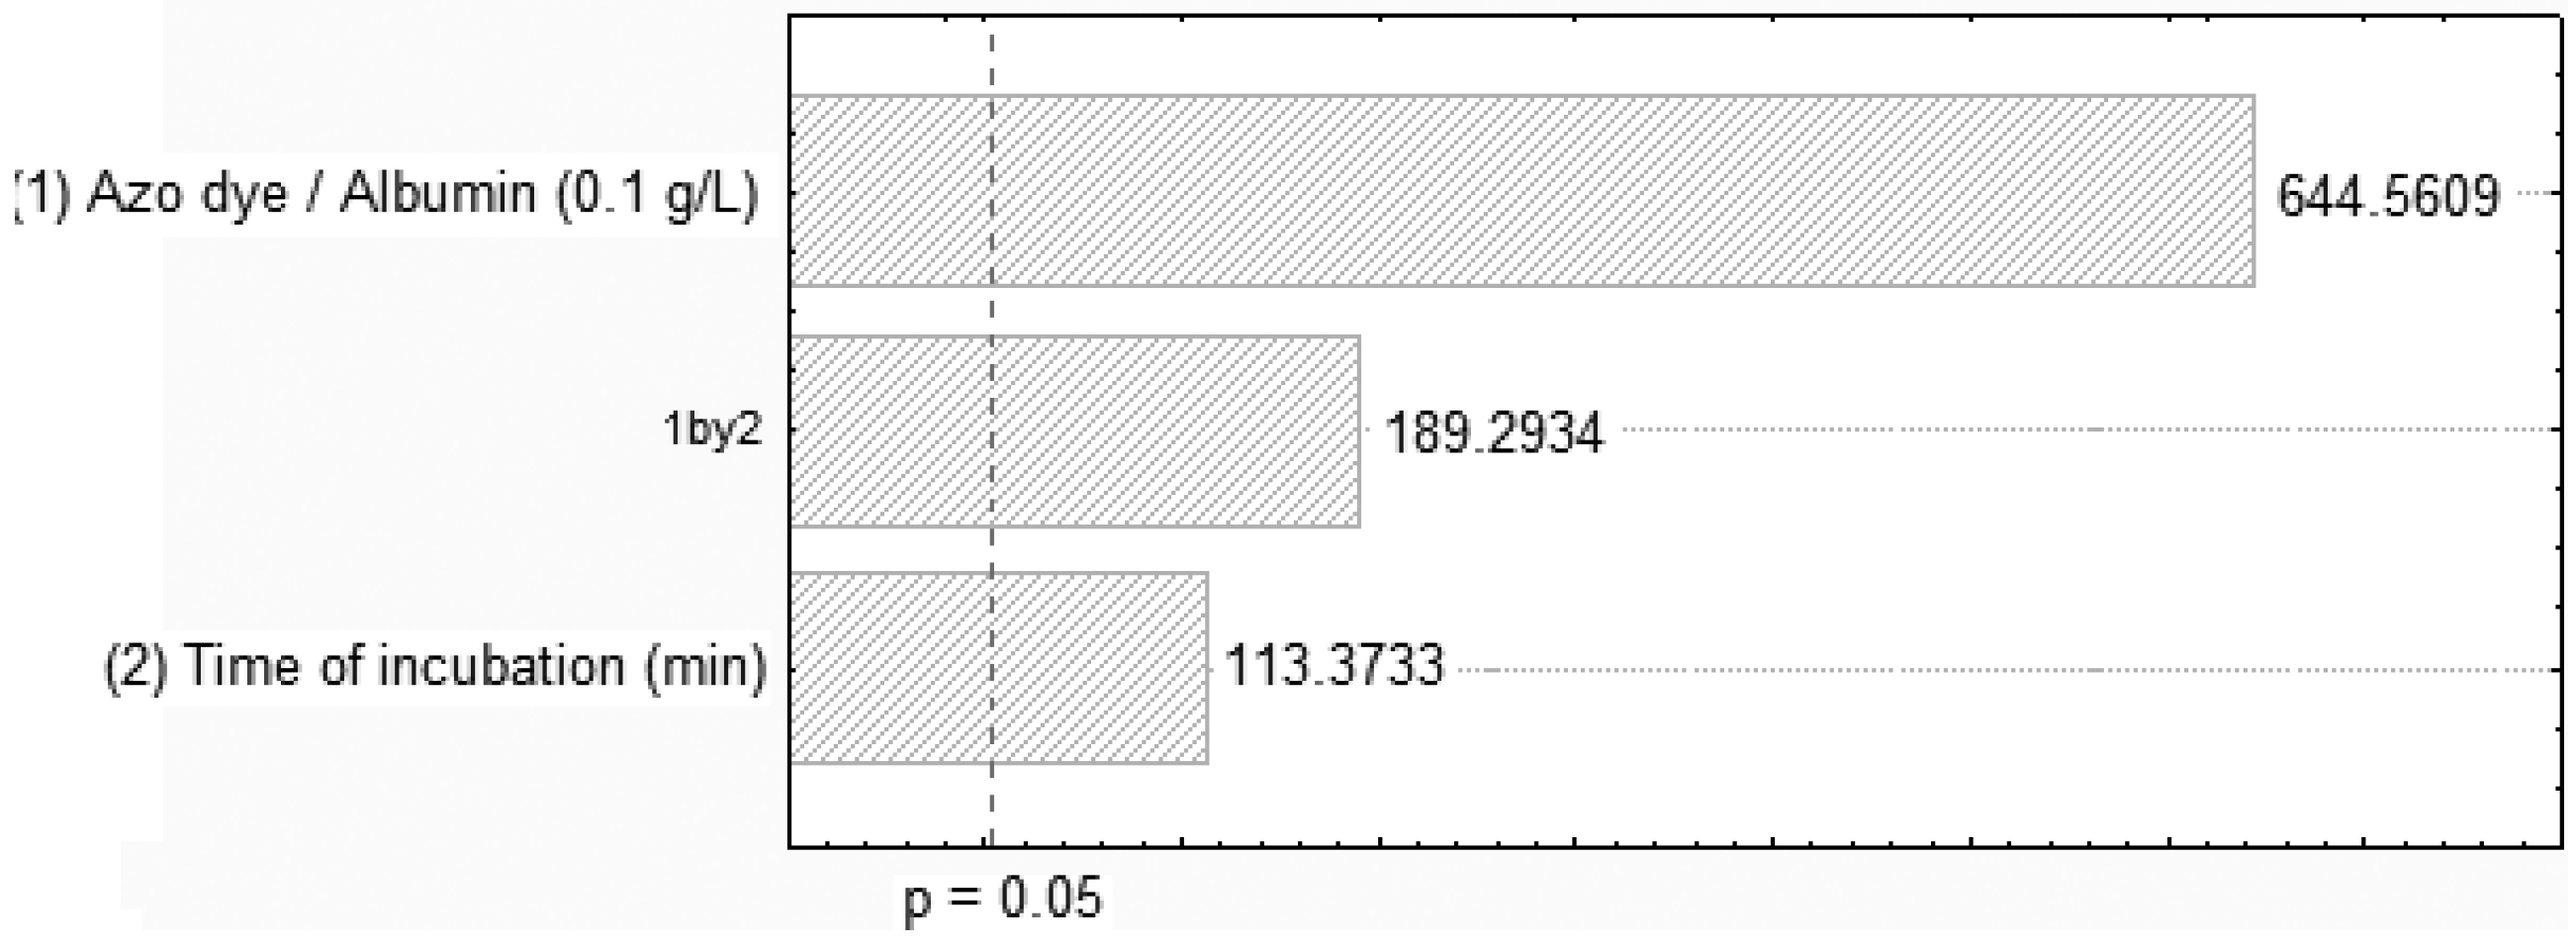
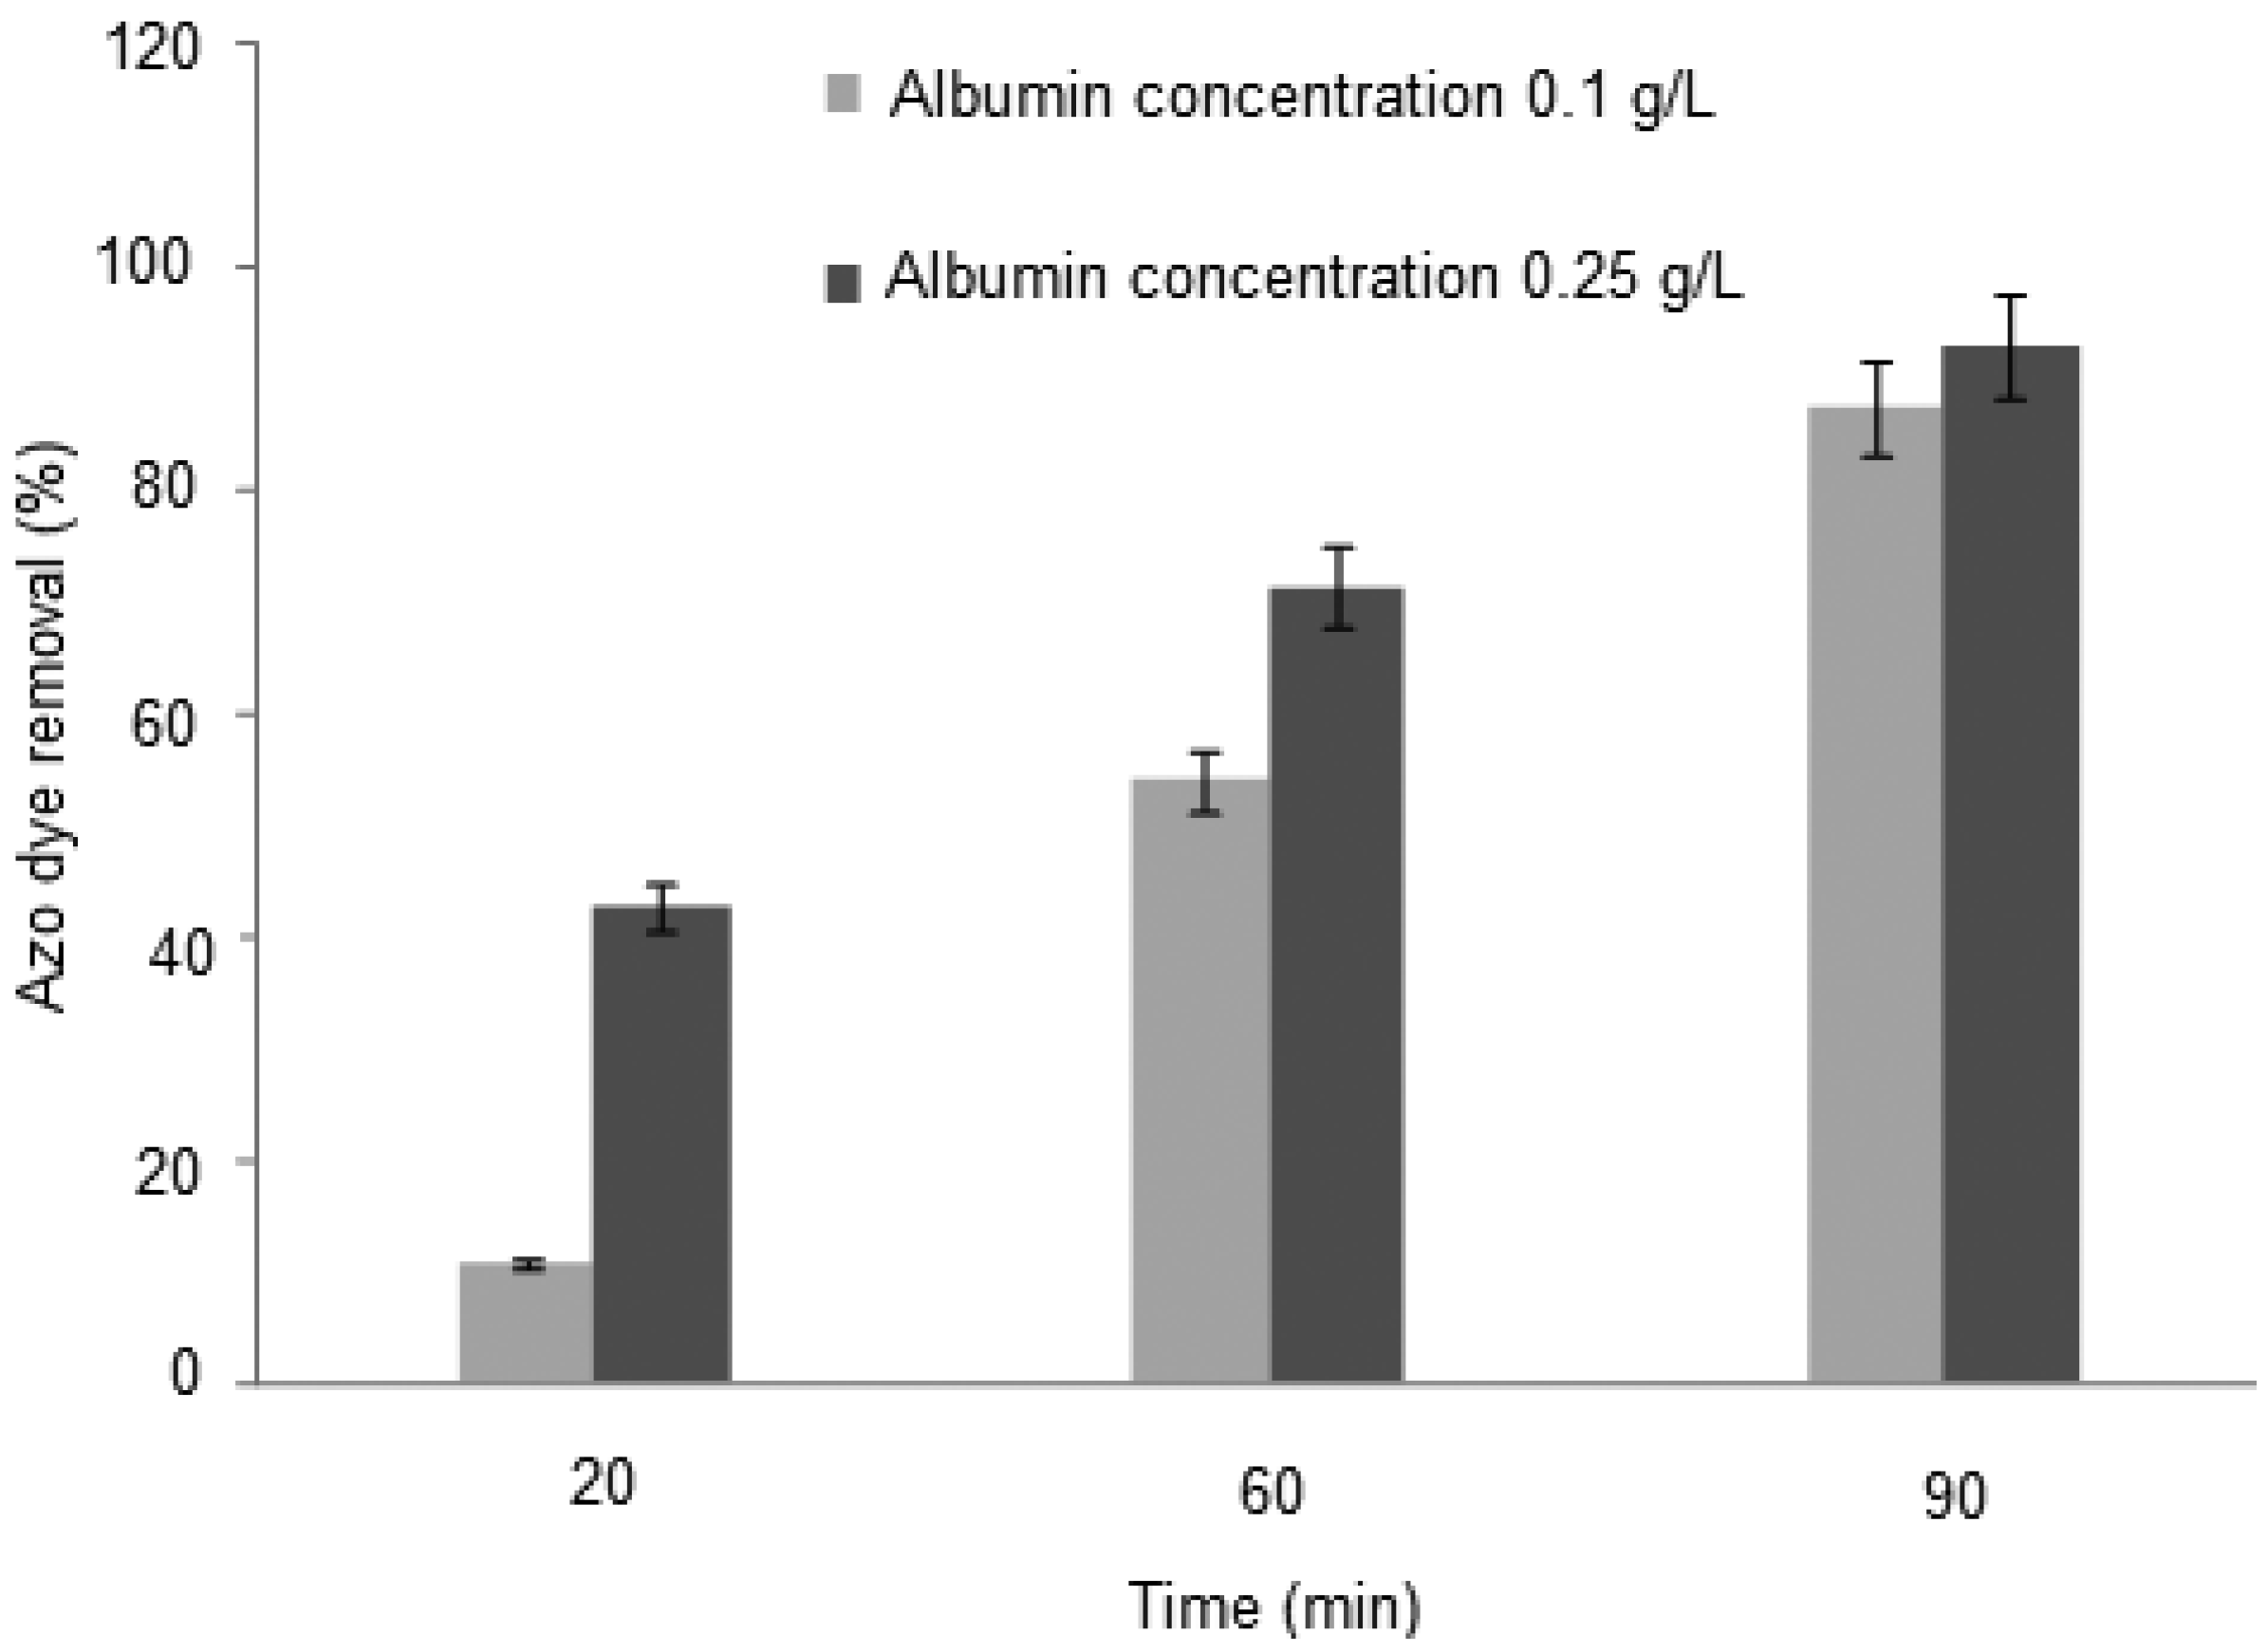
2.1. Influence of the Time Interaction, pH and Adsorption

In order to find the optimal contact time and albumin (BSA) concentrations, the experiments were conducted at a pH of 3.0. The relative proportions of dye to albumin were maintained (at 1:3 v/v). The results indicated that the highest contact time (90 min) of dye and albumin led to the removal of Orange II (Table 1).
Table 1. Removal of Orange II related to volume (azo dye/albumin) pH and time of incubation.
AssayAzo dye/albumin concentration (g/L)Time of incubation (min.)pHOrange II removal (%)
010.10203.010.72
020.10303.021.49
030.1060.3.054.06
040.1090.3.087.28
050.10603.278.95
060.10603.584.20
070.10603.863.40
080.10604.055.71
Parameters: Azo dye/albumin ratio (1:3 v/v); vortex at 200 r.p.m.
The effects of dye and BSA on decolorization, as well as the interaction between them, in the first 22 full factorial designs are shown in Figure 1 and Figure 2. The Pareto chart clearly shows a positive correlation of the dye/albumin and the contact time on the decolorization process. Higher interaction was observed on the dye Orange II and BSA concentrations of 0.1 g/L and 0.25 g/L at 90 min of contact and pH of 3.0, respectively. The low error (0.093667) obtained from the standardised effects of adsorption by BSA validated the experimental procedure using azo dye/albumin (0.25 g/L). On the other hand, the Orange II-BSA interaction contributes in a statistically significant way to the increase in the decolorization of the effluent.
Figure 1. Pareto chart of standardized effects of removing Orange II related to azo dye/albumin (0.1 g/L) concentrations and time of incubation.
Molecules 17 14219 g001
Figure 2. Pareto chart of standardized effects of removing Orange II related to azo dye/albumin (0.25 g/L) concentrations and time of incubation.
Molecules 17 14219 g002
In addition, the results of our experiments show that BSA adsorption is superior to non-conventional methods, such as tangential flow filtration with membranes and bioelectrochemical systems, for the removal of azo dye with a view to totally removing the dye [27,28].
The initial parameters obtained from the phenomenon of chemical precipitation of Orange II-BSA observed at both the beginning and the end by separation of and the end of separating the membrane filter are shown. For this, the interaction time was set to 20 to 90 min, the dye/albumin ratio was 1:3, and the pH was varied from 3.0 to 4.0. The pH value with the highest decolorization (92.91%) was pH 3.0 (Figure 3). The results suggest the influence of the interaction time is a very important property on the adsorption capabilities of albumin. These results are corroborated by reports in the literature that indicate that increasing the molecular volume of albumin enables more Orange II to be adsorbed [20,22,26,29]. The kinetic for adsorption of Orange II on BSA at pH 3.0 (cationic form) can be explained taking into account that the ionic attraction contributes to increasing the BSA interaction phenomena, and leads to maximizing the dye decolorization process (Figure 4).
Figure 3. Efficiency of removing azo dye Orange II using albumin in different concentrations (0.10 and 0.25 g/L, v/v) in pH 3.0 and incubation time.
Molecules 17 14219 g003
Figure 4. Adsorption of the azo dye Orange II using albumin.
Molecules 17 14219 g004

2.2. Removal of Orange II in the Azo Dye/Albumin (v/v) System, and Time of Interaction

The data obtained from the experiments were analysed to evaluate the efficiency of the method (ability of BSA to remove Orange II). The effects of pH, contact time and albumin/Orange II volume ratio on Orange II removal are presented (Table 2).
Table 2. Interaction of the dye Orange II and albumin proportions related to concentrations maintained in the pH 3 and, contact time of 90 min.
AssayAzo dye/albumin proportions (mL)Orange II removal (%)
011:1 (25 + 25)27.48
021:2 (25 + 50)56.21
031:3 (25 + 75)84.20
041:4 (25 + 100)33.33
051:5 (25 + 125)27.85
Parameters such as pH, agitation and the v/v relationship of the dye/albumin may be affected by the interaction (Table 3 and Figure 5). The efficiency of separation is independent of the average porosity of the membrane, thus providing additional support for the use of this method of adsorption. The condition that provided the greatest removal was an interaction time of 90 min, an albumin concentration of 0.25% g/L (ratio 1:3) and a pH of 3.0. Under these conditions 92.50% removal of Orange II was achieved. The methodology demonstrated here provides more effective removal of Orange II than that provided by tangential filtration process membranes or unconventional methods, such as microfiltration and ultra-filtration. The literature reports efficiency above 80% for removing azo dyes using these methods [30,31,32]. The results from this study confirmed that the semi-permeable membrane retains solutes [33,34,35].
Table 3. Complete assays for removing Orange II related to the proportion of azo dye and albumin bath, contact time, pH before and after filtration.
AssayRelation dye/albumin v/v (mL)Contact time (min)pH before filtrationpH after filtrationRetention time %
150/50603.53.227.84
250/100603.53.233.83
350/150603.53.285.00
450/200603.53.269.57
550/250603.53.277.28
625/75203.53.946.81
725/100203.53.666.67
825/125203.53.713.34
925/75203.03.046.16
1025/75203.13.121.96
1125/75203.23.221.43
1225/75203.33.324.45
1325/75803.63.654.77
148.5/34803.53.590.33
1512/48603.53.597.15
1625/75603.53.599.50
Azo dye/albumin concentration 0.10 g/L.
Figure 5. Isotherm of adsorption of azo dye orange II and albumin.
Molecules 17 14219 g005
The Langmuir isotherm has an equilibrium concentration area between the concentrations of the dye (0.1 g/L), depending on the adsorbed mass, and the mass of adsorbent in relation to the concentration in the adsorbed system. These results described the concentration of the azo dye remaining in the water at the adsorption equilibrium point depends on a variety of factors, such as efficiency of interaction of the sorbent and the pH. The literature data are essentially corroborated with the results obtained with the decolorization process [20,21,36].
A chronic toxicity bioassay was conducted with the microcrustacean Artemia salina as the test organism for the toxic azo dye Orange II in order to determine if the species is an appropriate indicator of pollution in aquatic environments.The filtrates that achieved 99.50% and 90.33% removal of azo dye by albumin, in both pH conditions was similar at the start and end of the process. On the other hand, the results showed a higher removal (99.50%) of the proportion of azo dye and albumin 1:3 (v/v). All of these results were attributed mainly to the ionic attraction of albumin associated with Orange II pH [22,23,37,38,39,40] (Figure 6). The microcrustacean Artemia salina remained viable when it was exposed to all filtrates after colour removal, and suggests an absence of toxicity. The results indicated that a lethal concentration (LC50) is equal to 79 µg/mL of the azo dye Orange II.
Figure 6. Residual complex formed of Orange II adsorped to albumin using vacuum filtration [Assay 16]. A = residue on cellulose acetate membrane obtained from maximum removal of azo dye/albumin 0.10 g/L (1:3 v/v) at 90 min of incubation, pH 3.0; B = Filtrate of azo dye (0.10 g/L)/water on cellulose acetate membrane; C = Filtrate obtained from azo dye 0.10 g/L cellulose acetate membrane.
Molecules 17 14219 g006

3. Experimental

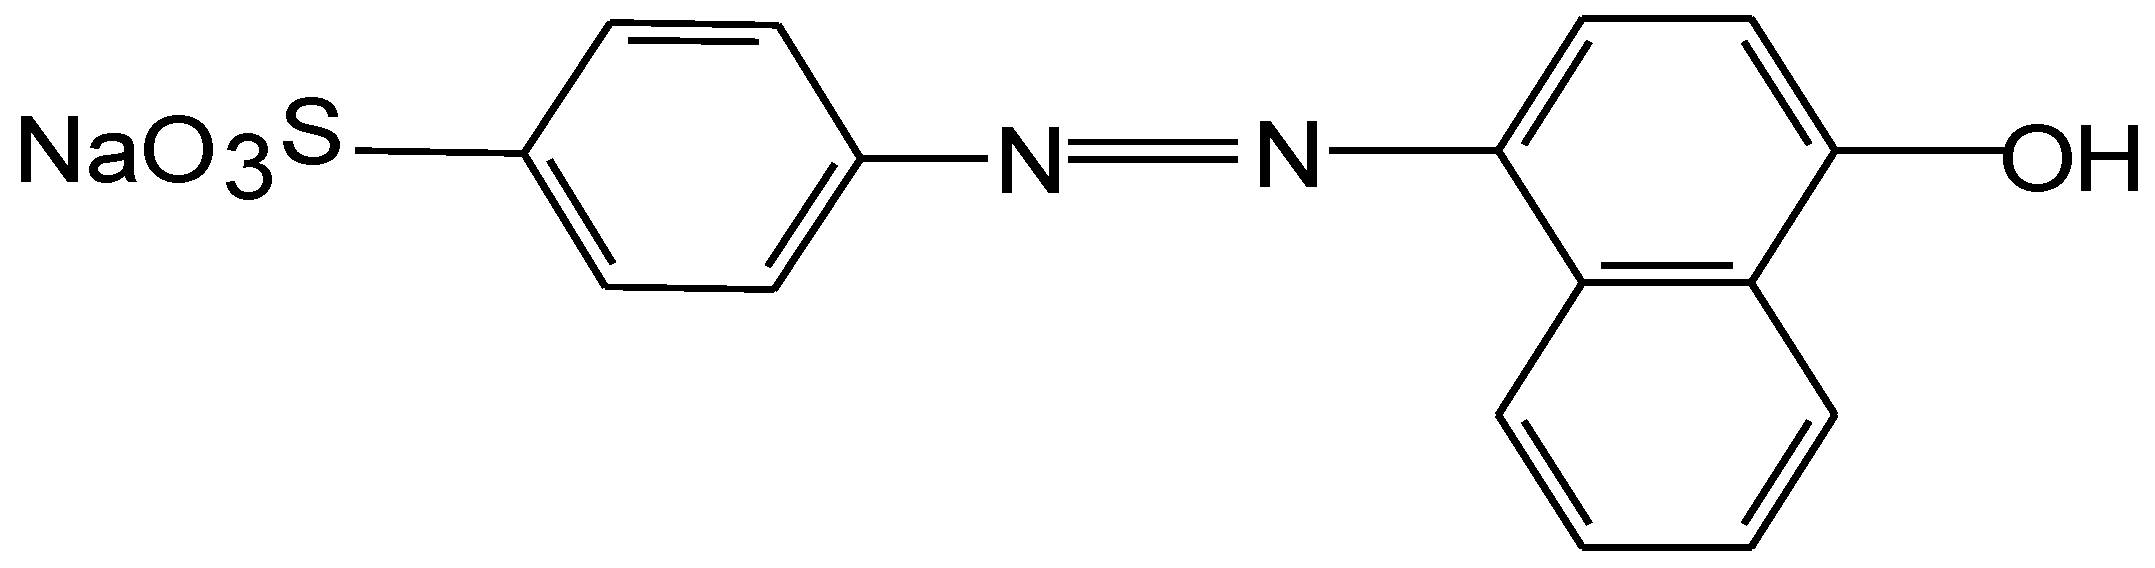
3.1. Dye, Effluent, Albumin and Membrane

Class II Orange monoazo dye was obtained from Sigma-Aldrich. The molecular mass of Orange II is 350 Da (g/mol), and the polyamide wavelength maximum absorption (−lmax) is 485 nm. A schematic of the chemical structure of the anionic monoazo species is shown in Figure 7.
Figure 7. Chemical structure of the azo dye Orange II.
Molecules 17 14219 g007
The effluent used in this study was simulated in the laboratory using protocols that are typically used in the textile industry when dyeing wool. The purified Orange II was prepared using 0.1 g/L concentration of adsorbate based on the efficiency of dye fixation in the fibre being 80% (source: industrial information).
The protein solution used in the experiment was bovine serum albumin (BSA, Sigma-Aldrich), which was used in a concentration of 0.1 g/L and 0.25 g/L diluted in ultrapure water, pH 11 and was maintained at 5 °C. The membrane used for vacuum filtration was cellulose acetate, which was supplied by Millipore (47 mm diameter; 9.6 cm2 area of filtration; 0.2 µm porosity) [41].

3.2. Vacuum Filtration Procedure

The tests were performed in batches with distilled water, using the effluent prepared in laboratory with Orange II. The filtration unit consisted of the Millipore kit for vacuum filtration, the membrane filter and a CIENTEC vacuum pump with negative pressure flow of 28 inches of Hg. The interaction between the dye and the albumin was promoted by stirring using a magnetic stir plate (FANEM model 258) at 220 rpm. The experimental processes of separation using the vacuum filtration unit were performed at room temperature (30 °C). The tests were performed using various concentration of albumin to determine the best conditions for adsorption regarding the pH, incubation time for the formation of electrostatic complex and the formation of the permeate.

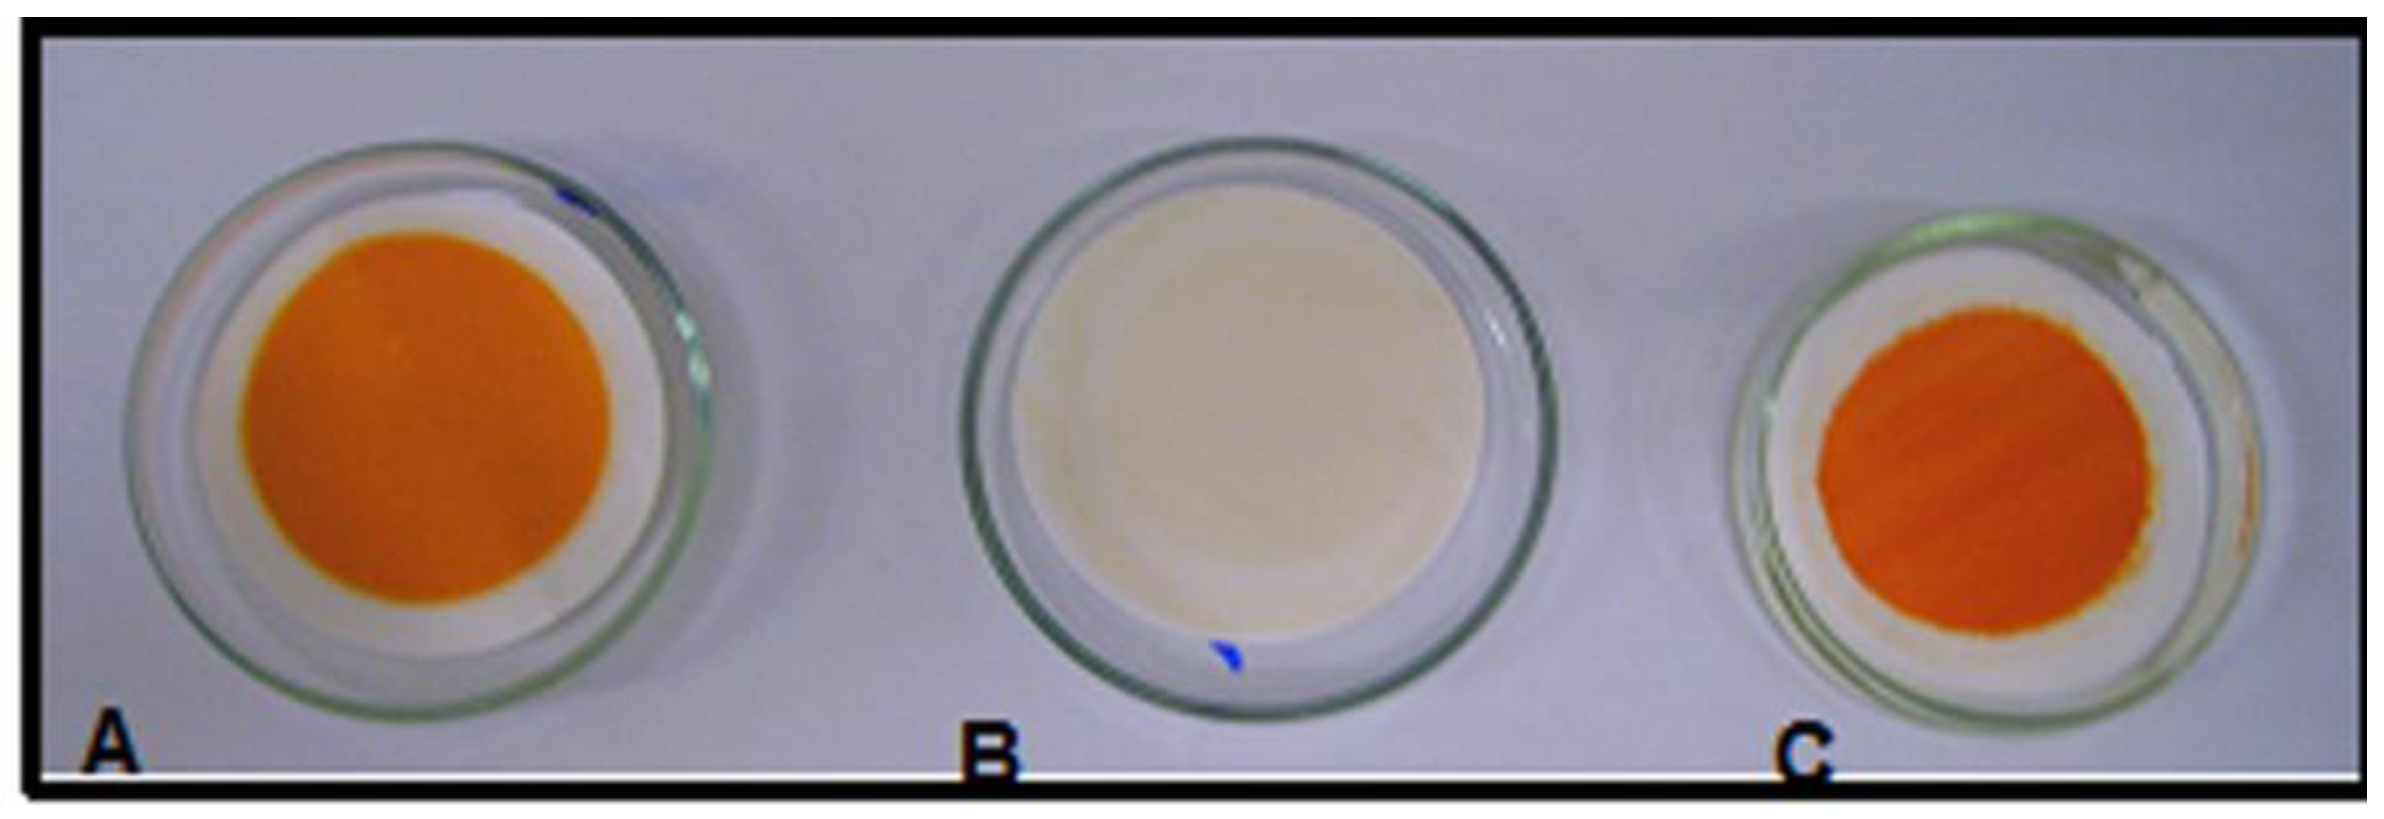
3.3. Colour Reduction Measurement

Colours measurements were performed with a Spectronic Genesis, model 2 UV-visible spectrophotometer. The wavelengths for the measurements were set at the values of the azo dye concentrations and were calculated using an absorbance at 485 nm as per the calibration curve. The percentage of the solute retention time of the membrane was calculated from the readings taken for the samples before and after filtration.

3.4. Albumin Determination

The albumin concentration was determined using biuret reagent (Labstest) and was measured on a spectrophotometer (λ = 545 nm).

3.5. Experimental Factorial Design

To determine the effects of the azo dye and albumin decolorization, an analysis of variance (ANOVA), with 95% confidence limits was conducted; the results are shown in Table 4. The effects of the variables are graphically illustrated using Pareto charts. A Pareto chart consists of bars with a length proportional to the absolute value of the estimated effects, divided by the standard error. When using the Pareto chart to analyse the effect of variance, estimates are sorted from the highest to the lowest absolute value. The chart includes a vertical line at critical t value for an alpha of 0.05. Effects, for which the bars are smaller than the critical t-value, are not considered to be significant nor do they affect the response variables. The effects may be positive or negative. Statistica® software version 7.0 was used to conduct the ANOVA so as to determine the regression coefficients and produce the graphs [42].

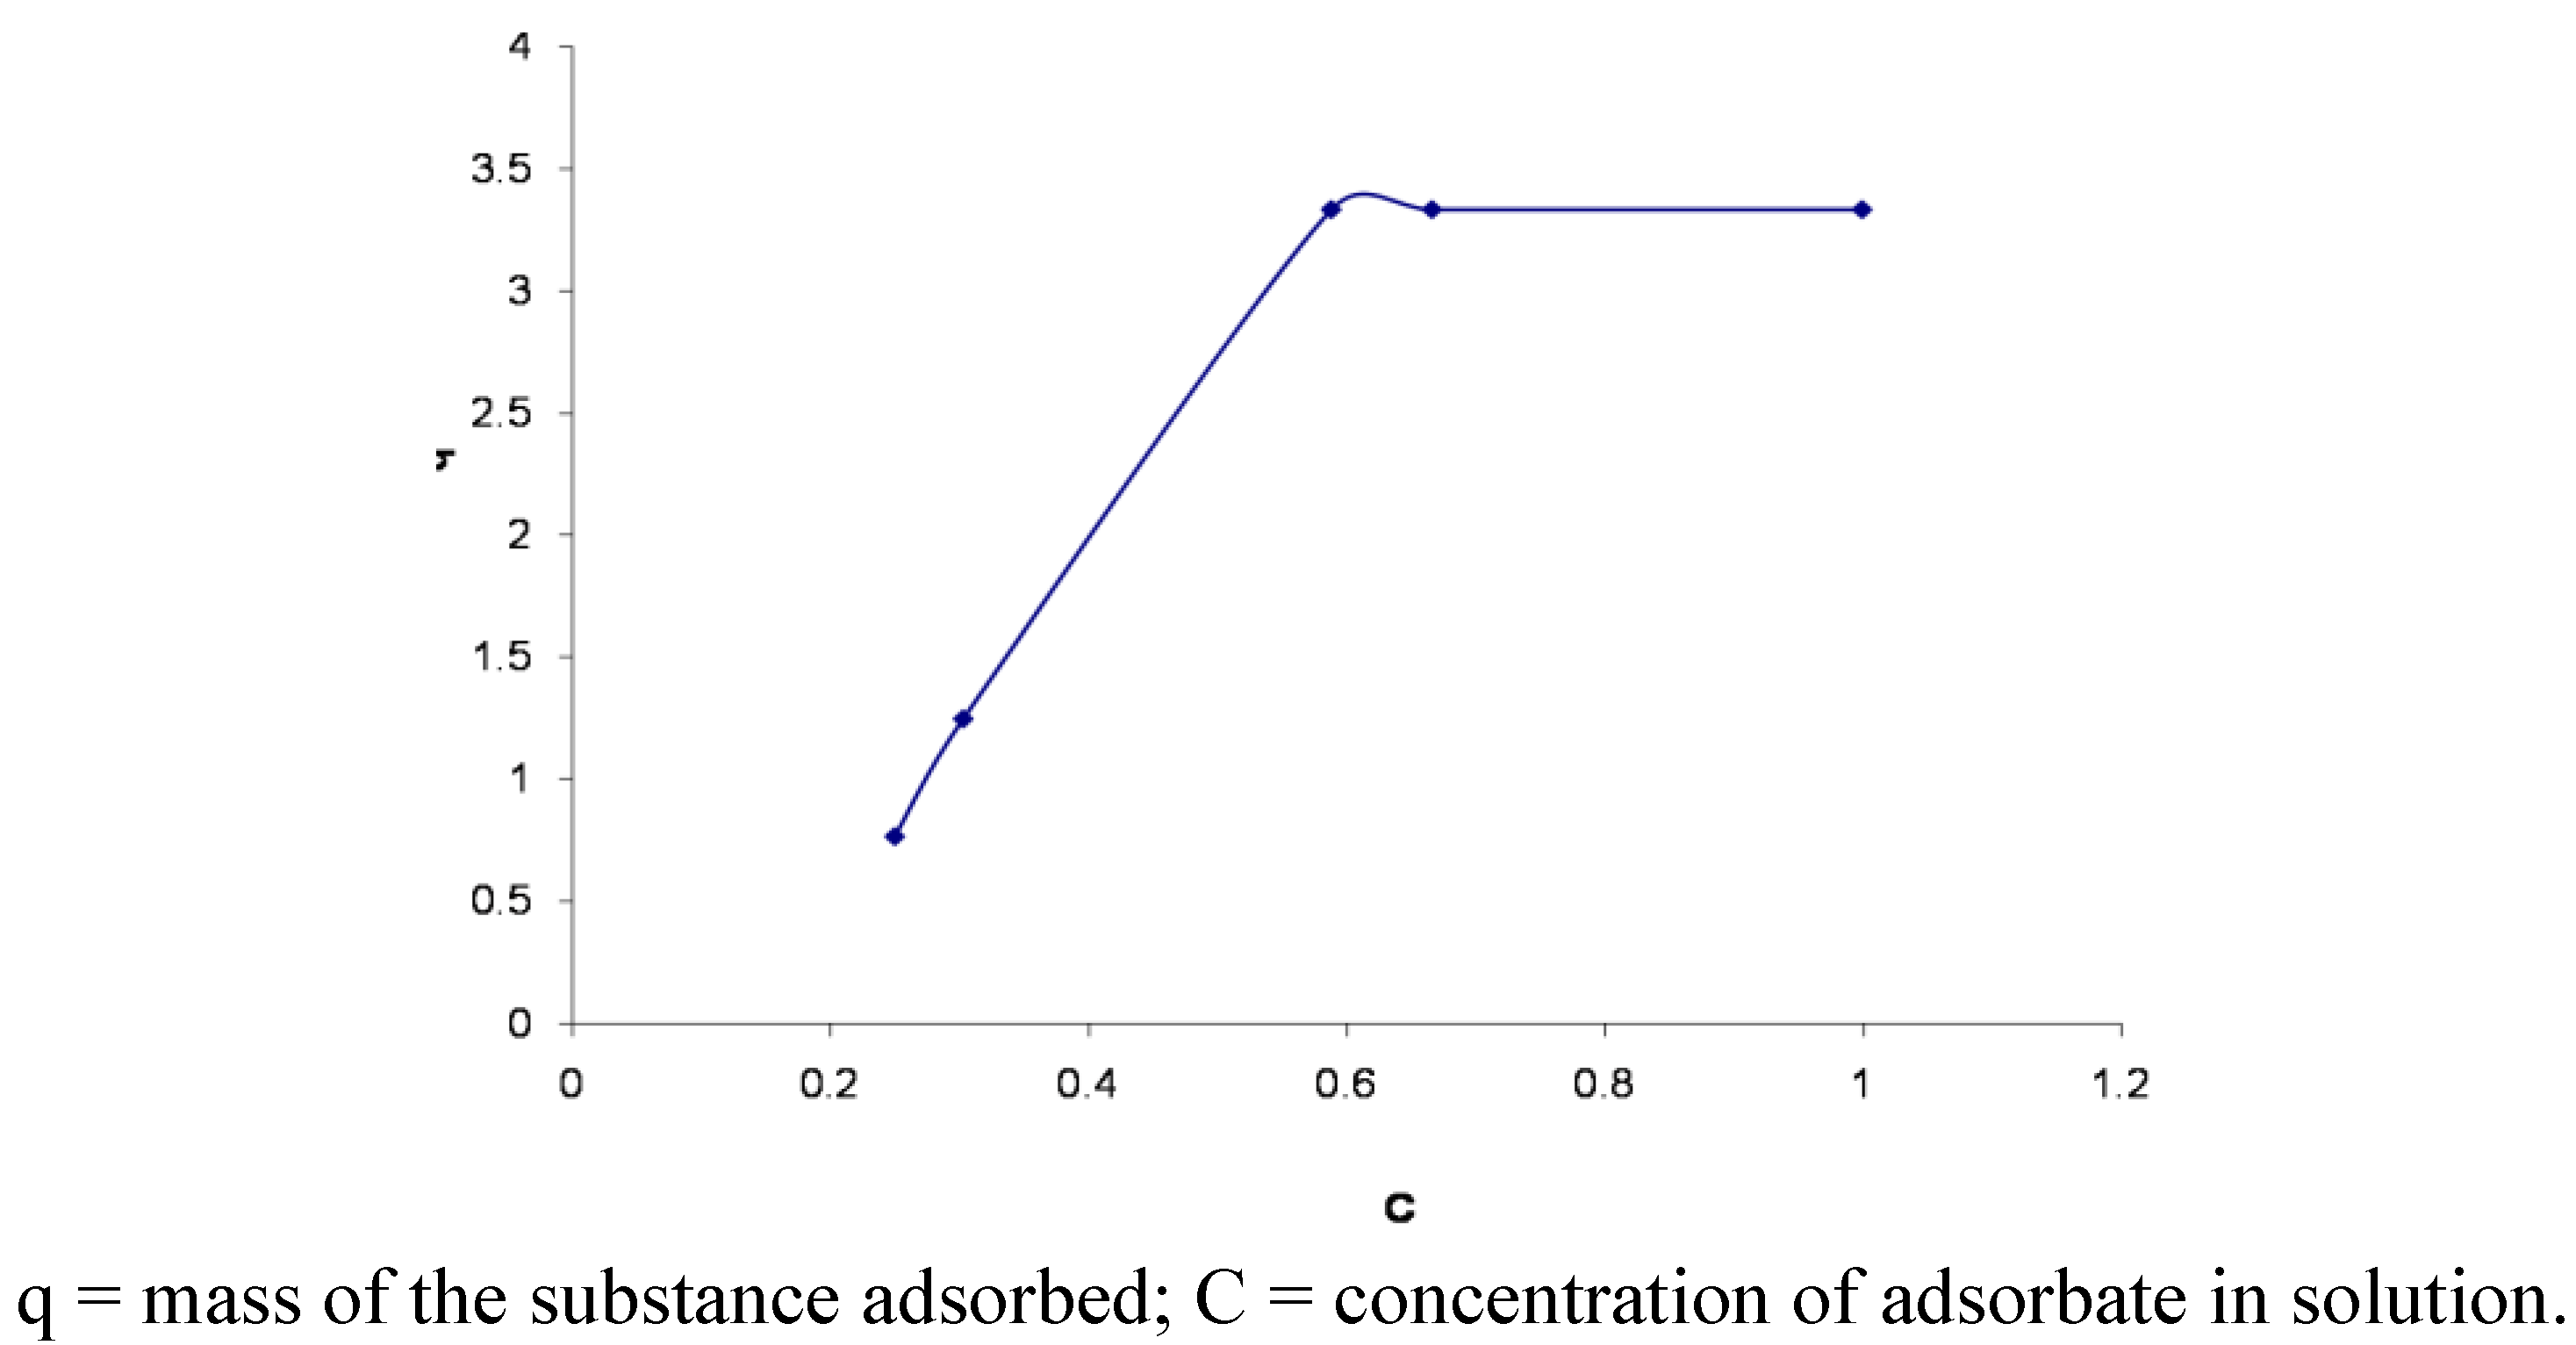
3.6. Adsorption Isotherms

The experiments were conducted on a vortexer (200 Hz) at 28 °C. The samples were collected after addition of azo dye albumin over a period of 90 min [41,42,43]. The uptake of the Orange II in the solution was determined by absorbance at 485 nm. All experiments were performed in triplicate.
Table 4. Levels of 22 full factorial designs.
First full factorial design
FactorLevel
−10+1
Azo dye/Albumin0.10 g/L (v/v)1:3 1:21:1
Time of incubation (min)306090
Second full factorial design
FactorLevel
−10+1
Azo dye/Albumin0.25 g/L (v/v)1:3 1:21:1
Time of incubation (min)306090

4. Conclusions

The new methodology that was investigated in this study proved to be an innovative and promising adsorption process for removing recalcitrant azo dyes from textile industry wastewater. The high removal rates achieved suggest that the treated effluent may be reused. Furthermore, the new process was reproducible, effective, and low cost and should be considered as a method for treating dyes.

Acknowledgments

G.M. Campos-Takaki is grateful to CNPq, Brazil for a scholarship under the Scientific Produtivity Scheme. The authors are grateful for financial support received from the Brazilian agencies CNPq, FACEPE, PROCAD-CAPES, SENAI Paulista, PE, Brazil, and UNICAP.

References

  1. Ambrosio, S.T.; Campos-Takaki, G.M. Decolorization of reactive azo dyes by Cunninghamella elegans UCP 542 under co-metabolism conditions. Bioresour. Technol. 2004, 91, 69–75. [Google Scholar] [CrossRef]
  2. Zollinger, H. Color Chemistry, 2nd ed; VCH Publishers: New York, NY, USA, 1991. [Google Scholar]
  3. Guaratini, C.I.; Zanoni, M.V. Textile Dyes. Quím. Nova 2000, 23, 71–78. [Google Scholar] [CrossRef]
  4. Zamora, P.; Kunz, A.P.; Moraes, S.G.; Duran, N. New tendencies on textile effluent treatment. Quím. Nova 2002, 25, 78–82. [Google Scholar] [CrossRef]
  5. Zanoni, M.V.B.; Sousa, W.R.; Lima, J.P.; Carneiro, P.A.; Fogg, A.G. Application of voltammetric technique to the analysis of indanthrene dye in alckaline solution. Dyes Pigm. 2006, 68, 19–25. [Google Scholar] [CrossRef]
  6. Allinger, N.L.; Cava, M.P.; de Jongh, D.C.; Johnson, C.R.; Lebel, N.A.; Stevens, C.L. Organic Chemistry; Worth Publishers: New York, NY, USA, 1976. [Google Scholar]
  7. Araújo, M.; Castro, E.M.M. Manual de Engenharia Têxtil; Fundação Calouste Gulbenkian: Lisbon, Portugal, 1984. [Google Scholar]
  8. Daltin, D.; Alcantra, M.R. Textile Chemistry. Quim. Nova 1996, 19, 320–330. [Google Scholar]
  9. Gogate, P.R.; Pandit, A.B. A review of imperative technologies for wastewater treatment I: Oxidation technologies at ambient conditions. Adv. Environ. Res. 2004, 8, 501–551. [Google Scholar] [CrossRef]
  10. Erdal, S.; Taskin, M. Uptake of textile dye Reactive Black-5 by PenicilliumchrysogenumMT-6 isolated from cement-contaminated soil. Afr. J. Microbiol. Res. 2010, 4, 618–625. [Google Scholar]
  11. Anliker, R. Organic Colorants—Interpretation of Mammalian, Genus and Ecotoxicity Data in Terms of Potential Risks; The Royal Society of Chemistry: London, UK, 1986. [Google Scholar]
  12. Correia, V.M.; Stephenson, T.; Judd, S.J. Characterization of textile wastewaters. Environ. Technol. 1994, 15, 917–929. [Google Scholar] [CrossRef]
  13. Bielska, M.; Prochasca, K.J. Dyes separation by means of cross-flow ultrafiltration of micellar solution. Dyes Pigm. 2007, 74, 410–415. [Google Scholar] [CrossRef]
  14. Anjaneyulu, Y.; Chary, N.; Raj, D.; Samuel, S. Decolorization of industrial effluents—Available methods and emerging Technologies—A review. Rev. Environ. Sci. Biotechnol. 2005, 4, 245–273. [Google Scholar]
  15. Beck, J.V. Nonlinear estimation applied to the nonlinear heat conduction. J. Heat Transfer 1988, 13, 1046–1058. [Google Scholar] [CrossRef]
  16. Al-Malack, M.H.; Anderson, G.K. Coagulation—Cross flow micro filtration of domestic waste water. J. Memb. Sci. 1996, 121, 59–65. [Google Scholar]
  17. Dogan, M.; Alkan, M. Adsorption kinetics of methyl violet onto perlite. Chemosphere 2003, 50, 517–528. [Google Scholar] [CrossRef]
  18. Haan, J. The renal function as judged by the excretion of vital dye-stuffs. J. Physiol. 1922, 56, 444–450. [Google Scholar]
  19. Pond, S.M. Extracorporeal techniques in the treatment of poisoned patients. Med. J. Aust. 1991, 154, 617–622. [Google Scholar]
  20. Holm, N. Aggregation and fibrillation of bovine serum albumin. Biochim. Biophys. Acta 2007, 1774, 1128–1138. [Google Scholar]
  21. Vetri, V.; Librizzi, L.; Leone, L.; Militello, V. Thermal aggregation of bovine serum albumin at different pH: Comparison with human serum albumin. Eur. Biophys. J. 2007, 36, 717–725. [Google Scholar] [CrossRef]
  22. Gao, D.; Tian, Y.; Liang, F.; Jim, D.; Chen, Y.; Zhang, H.; Yu, A. Investigation on the pH-dependent binding of EosinY and bovine serum albumin by spectral methods. J. Lumin. 2007, 127, 515–522. [Google Scholar] [CrossRef]
  23. Jayabharathi, J.; Thamikachalam, M.P. Mechanistic investigation on binding of bioactive imidazole with protein bovine serum albumin—A biophysical study. Spectrochim. Acta A 2011, 79, 502–507. [Google Scholar] [CrossRef]
  24. Doyen, W. Latest developments in ultrafiltration for large-scale drinking water applications. Desalination 1997, 113, 165–177. [Google Scholar]
  25. Hamza, A.; Pham, V.A.; Matsuura, T.; Santerre, J.P. Development of membranes with low surface energy to reduce the fouling in filtration application. J. Memb. Sci 1997, 131, 217–227. [Google Scholar] [CrossRef]
  26. Bhattacharyya, K.G.; Sharma, A. Adsorption characteristics of the dye, Brilliant Green, on Neem leaf powder. Dyes Pigm. 2003, 57, 211–222. [Google Scholar] [CrossRef]
  27. Bader, M.S.H.; Veenstra, J.N. Analysis of concentration polarization phenomenon in ultrafiltration under turbulent flux conditions. J. Memb. Sci. 1996, 114, 139–148. [Google Scholar] [CrossRef]
  28. Darup, J.; Bleese, N.; Kalmar, P.; Lutz, G.; Pokar, H. Hemofiltration during extracorporeal circulation (ECC). J. Thorac. Cardiovasc. Surg. 1979, 27, 227–330. [Google Scholar] [CrossRef]
  29. Laurence, J.D.R. A study of the adsorption of dyes on bovine serum albumin by the method of polarization of fluorescence. Biochem. J. 1952, 51, 168–180. [Google Scholar]
  30. Nicolaisen, B. Developments in membrane technology for water treatment. Desalination 2002, 153, 355–360. [Google Scholar] [CrossRef]
  31. Shu, H.Y.; Shang, M. Pilot scale annular plug flow photoreactor by UV/H2O2 for the decolorization of azo dye wastewater. J. Hazard. Mater. 2005, 125, 244–251. [Google Scholar] [CrossRef]
  32. Shu, H.Y.; Shang, M.C. Decolorization and mineralization of a phthalocyanine dye C.I. Direct Blue 199 using UV/H2O2 process. J. Hazard. Mater. 2005, 125, 96–101. [Google Scholar] [CrossRef]
  33. Mu, Y.; Rabaey, K.; Rozendal, R.A.; Yuan, Z.; Keller, J. Decolorization of azo dyes in bioelectrochemical systems. Environ. Sci. Technol. 2009, 43, 5137–5143. [Google Scholar] [CrossRef]
  34. Sereikaite, J.; Bumelis, V. Interaction of serum albumin with vinyl sulfonate azo dye. Cent. Eur. J. Chem. 2008, 6, 509–512. [Google Scholar] [CrossRef]
  35. Woei-Jye, L.; Ismail, A.F. Polymeric nanofiltration membranes for textile dye wastewater treatment: Preparation, performance evaluation, transport modelling, and fouling control—A review. Desalination 2009, 245, 321–348. [Google Scholar] [CrossRef]
  36. Namasivayan, C.; Kavitha, D. Removal of Congo Red from water by adsorption onto activated carbon prepared from coir pith, an agricultural solid waste. Dyes Pigm. 2002, 54, 47–58. [Google Scholar] [CrossRef]
  37. Robinson, T.; Chandran, B.; Nigam, P. Removal of dyes from an artificial textile dye effluent by two agricultural waste residues. Environ. Int. 2002, 28, 29–33. [Google Scholar] [CrossRef]
  38. Zhang, M.M.; Chang, C.T.; Ding, Y.; Lin, K.L.; Chiou, C.S.; Hsueh, C.C.; Xu, H. Assessment upon azo dye decolorization and bioelectricity generation by Proteus hauseri. Bioresour. Technol. 2010, 101, 4737–4741. [Google Scholar]
  39. Zhao, J.; Chen, J.; Gao, J. Decolorization of Azo Dyes C.I. Acid Yellow 17 and C.I.Direct Red 31 by Dielectric-Barrier Discharge Air Plasma. Plasma Sci. 2010, 8, 488–495. [Google Scholar]
  40. Mclaughlin, J.L.; Saizarbitori, T.-C.; Anderson, J.E. Trés bioensayos simples para quimicos de productos naturales. Rev. Soc. Venez. Quim. 1995, 18, 13–18. [Google Scholar]
  41. Crini, G. Non-conventional low-cost adsorbents for dye removal: A review. Bioresour. Technol. 2005, 97, 1061–1085. [Google Scholar] [CrossRef]
  42. Kumar, K.V.; Sivanesan, S. Equilibrium data, isotherm parameters and process design for partial and complete isotherm of methylene blue onto activated carbon. J. Hazard. Mater. 2006, 134, 237–244. [Google Scholar] [CrossRef]
  43. StatSoft, Inc. Statistica, version 7.1; Data analysis software system. Tulsa, OK, USA, 2005.
  • Sample Availability: Not available.

