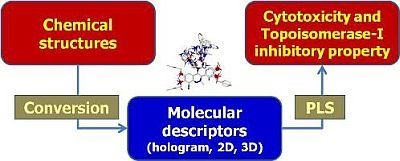
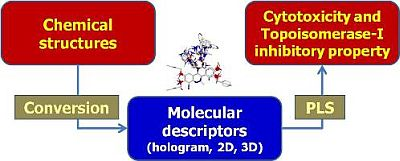
QSAR Modeling on Benzo[c]phenanthridine Analogues as Topoisomerase I Inhibitors and Anti-cancer Agents

Abstract
:
1. Introduction
2. Result and Discussion
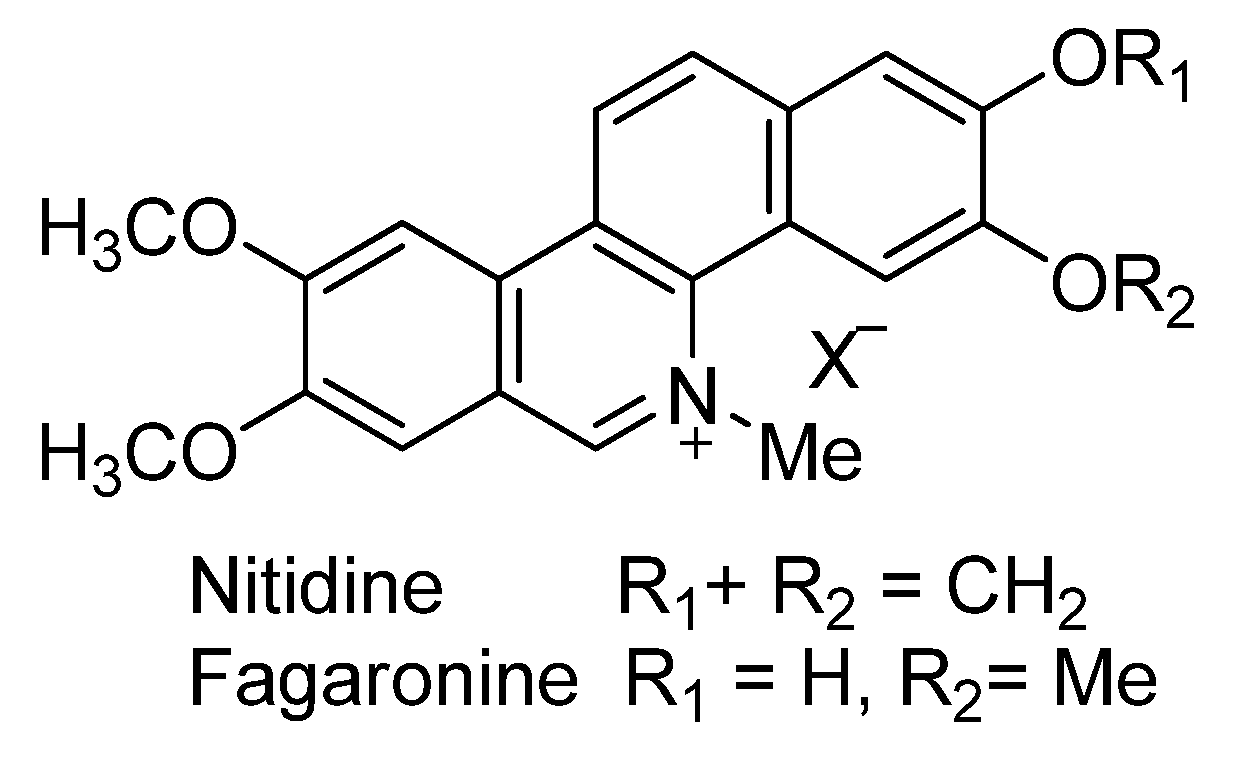
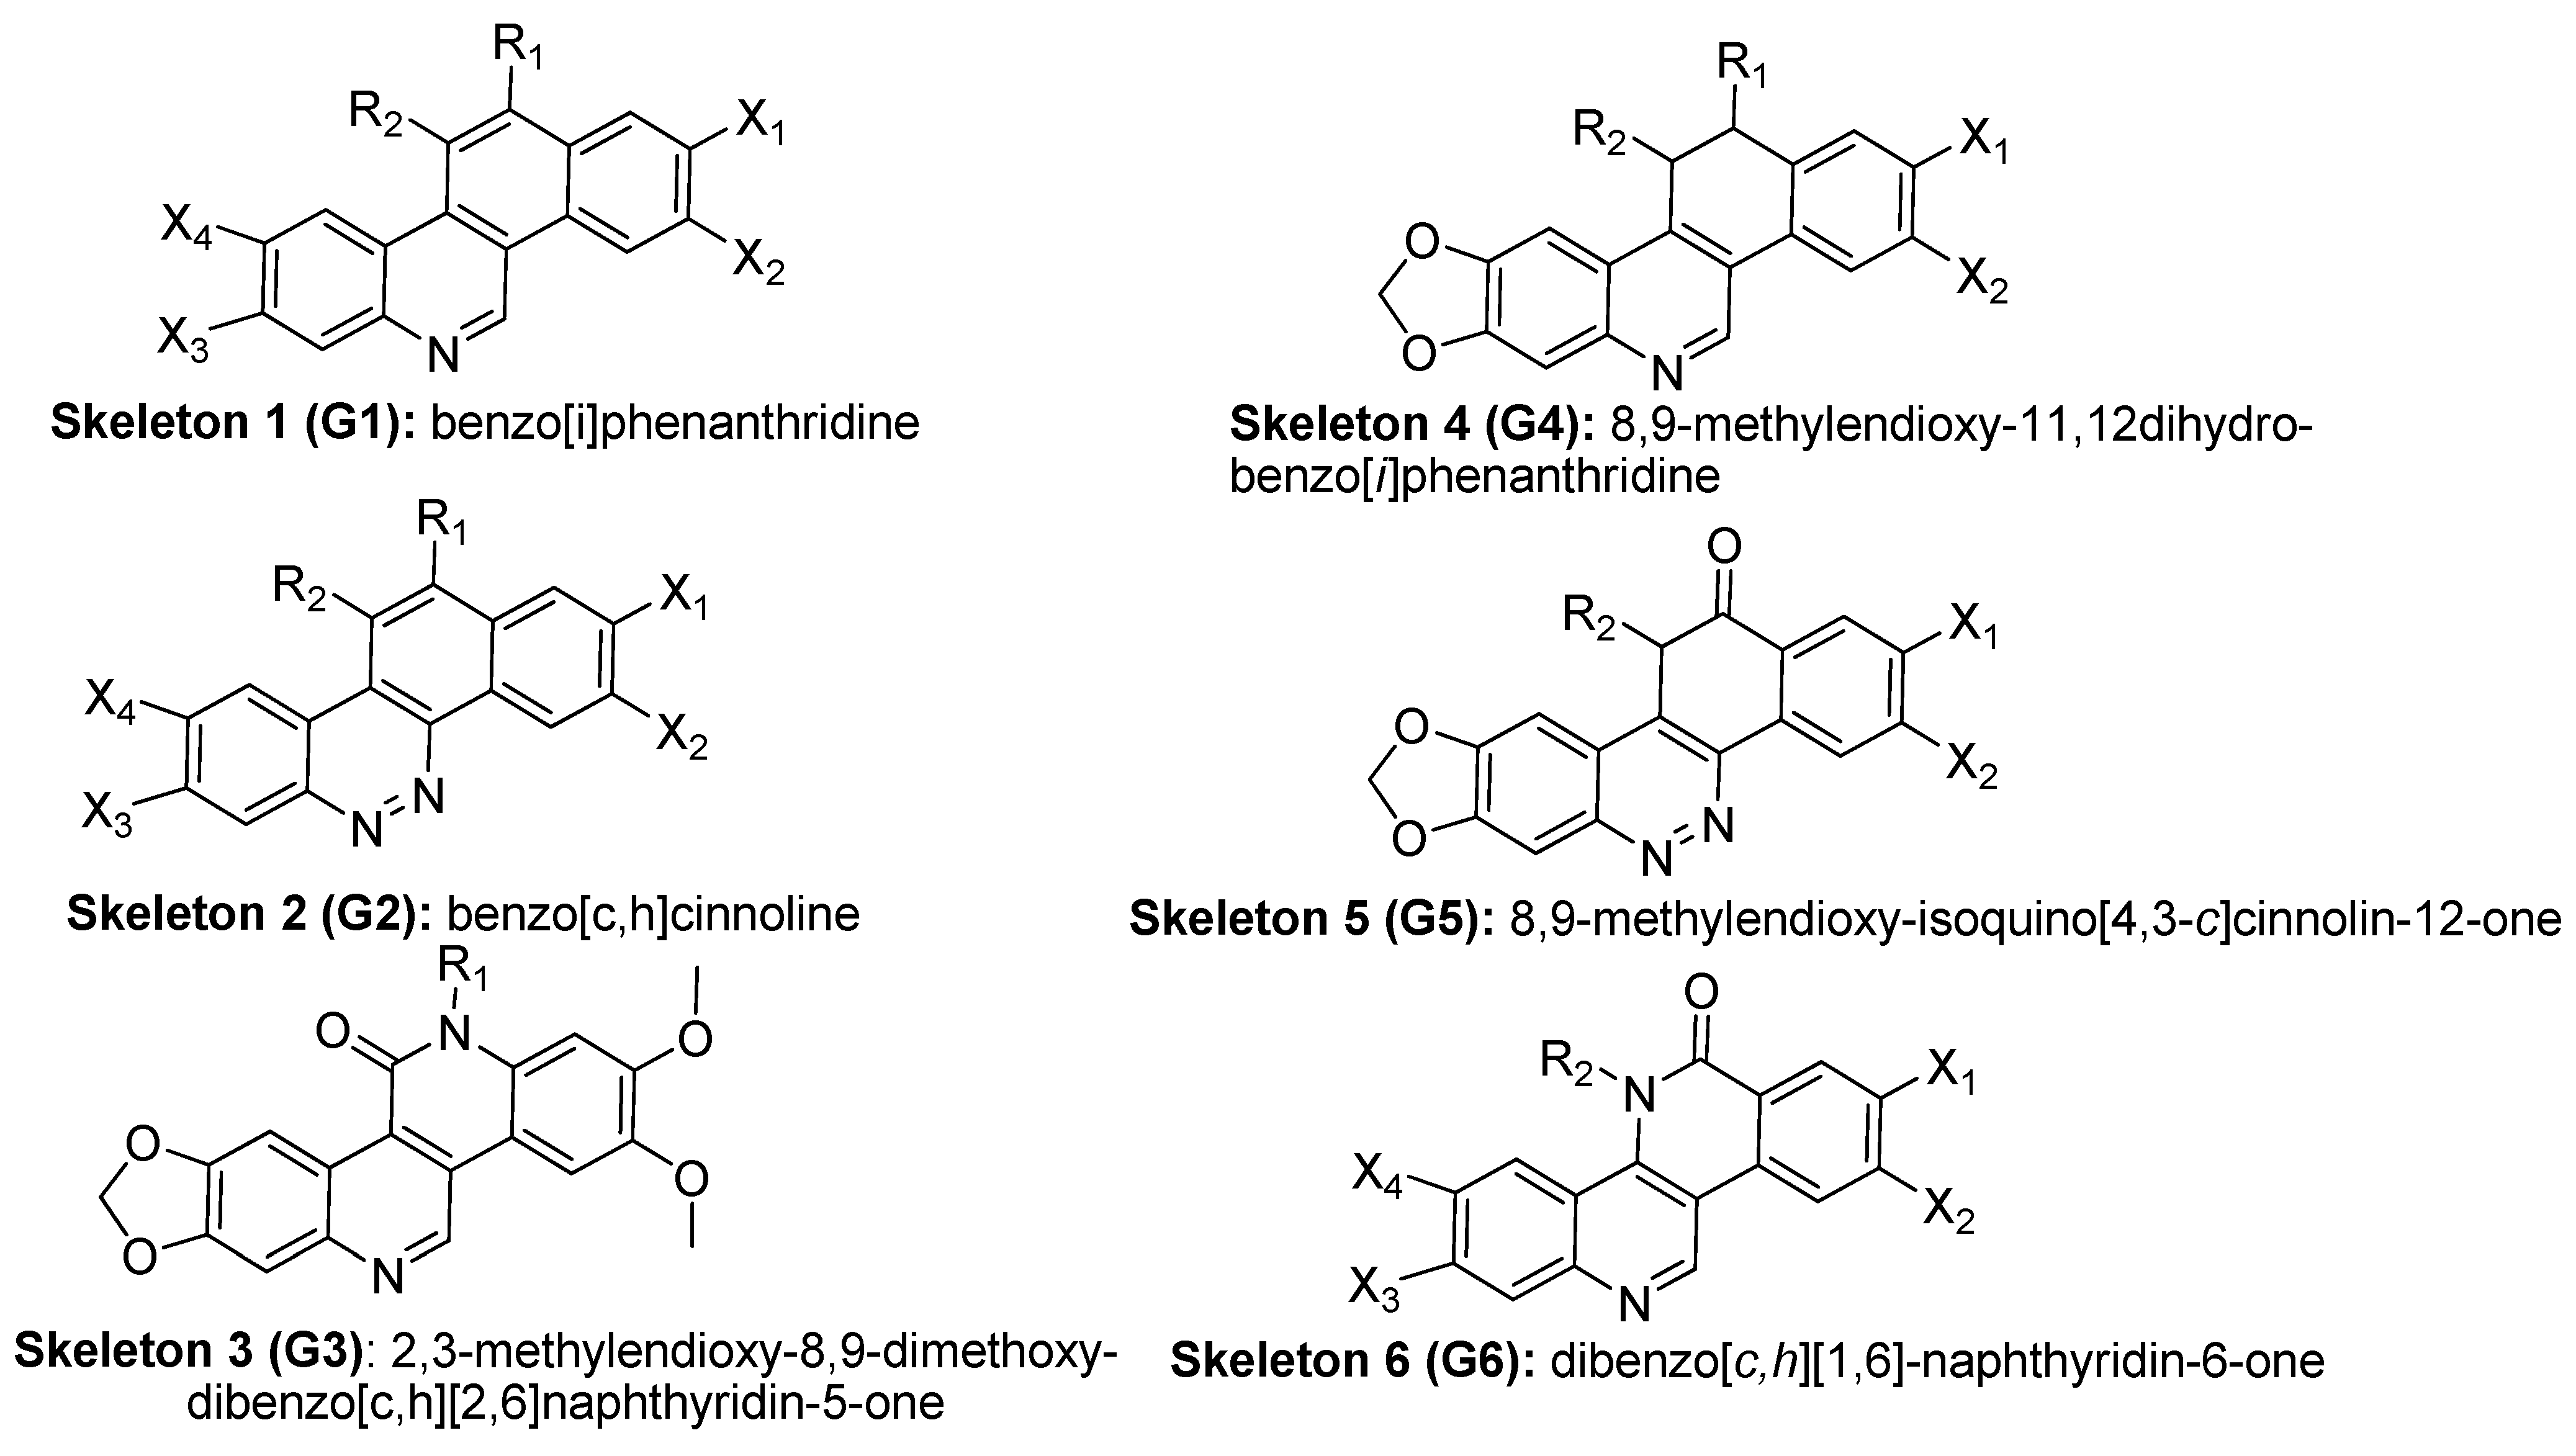
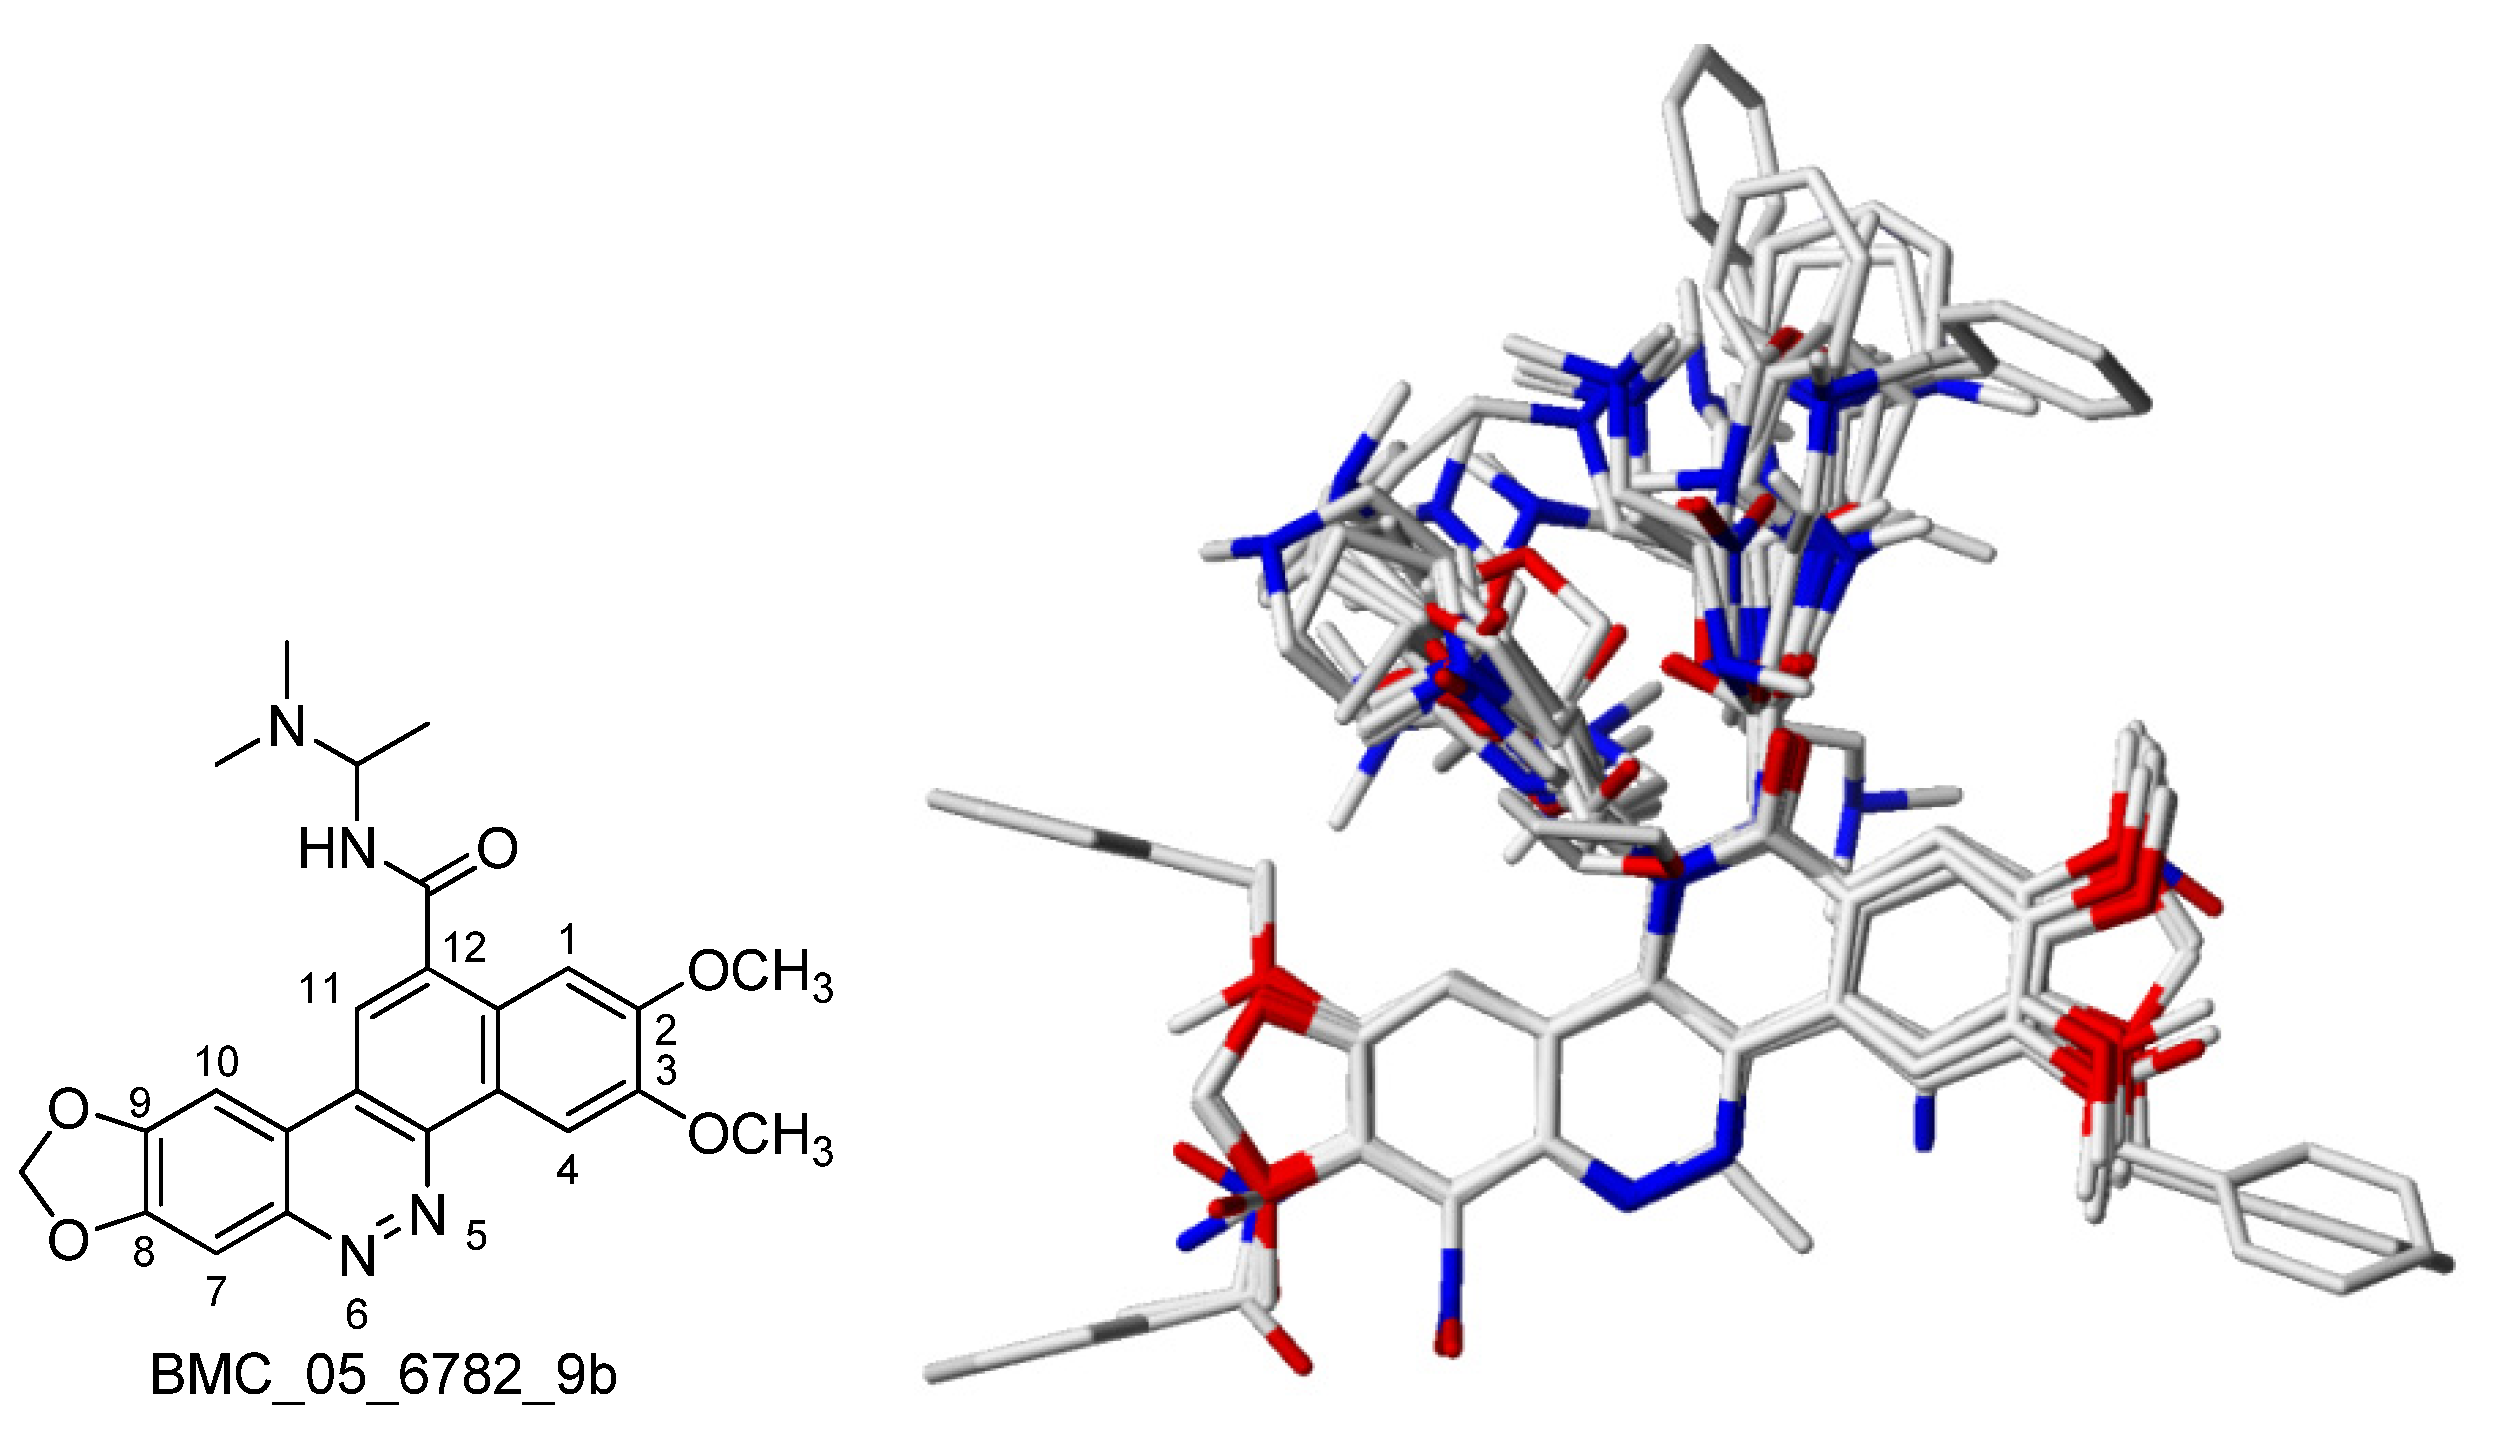
2.1. The Benzo[c]phenanthridins and Their Biological Activity Data
2.2. Over-fitting Problem
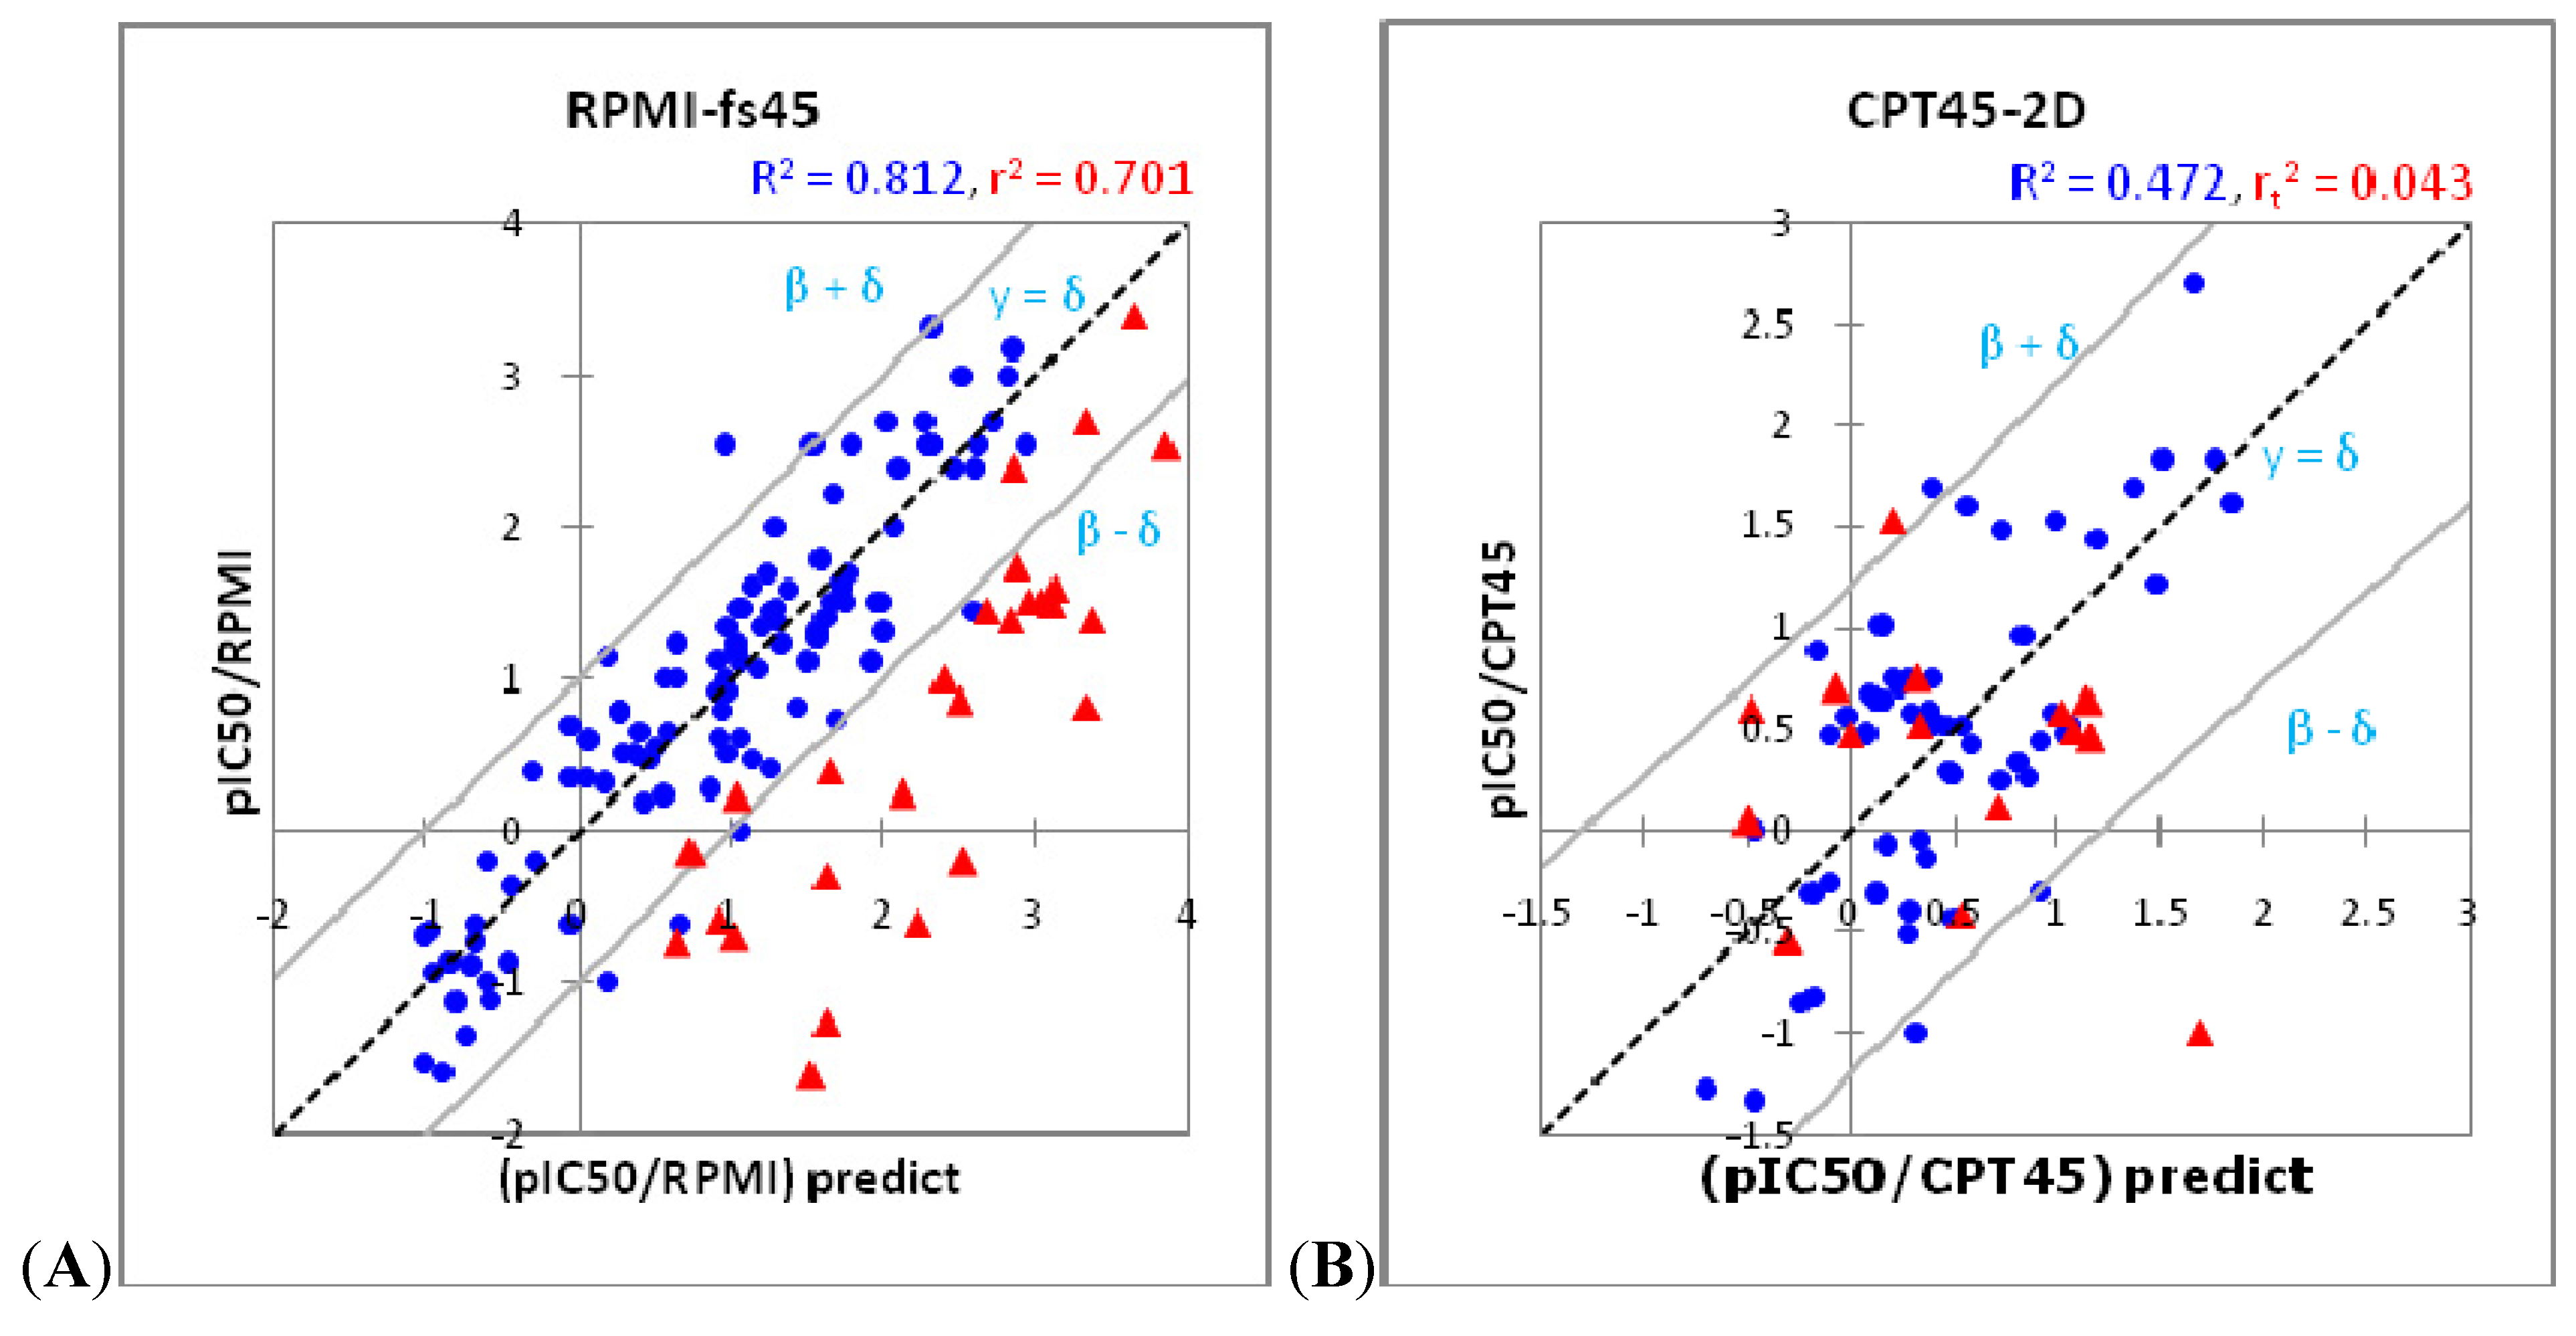
2.3. Model Assessment Method
2.4. Hologram, 2D and 3D QSAR Modeling
- (1).
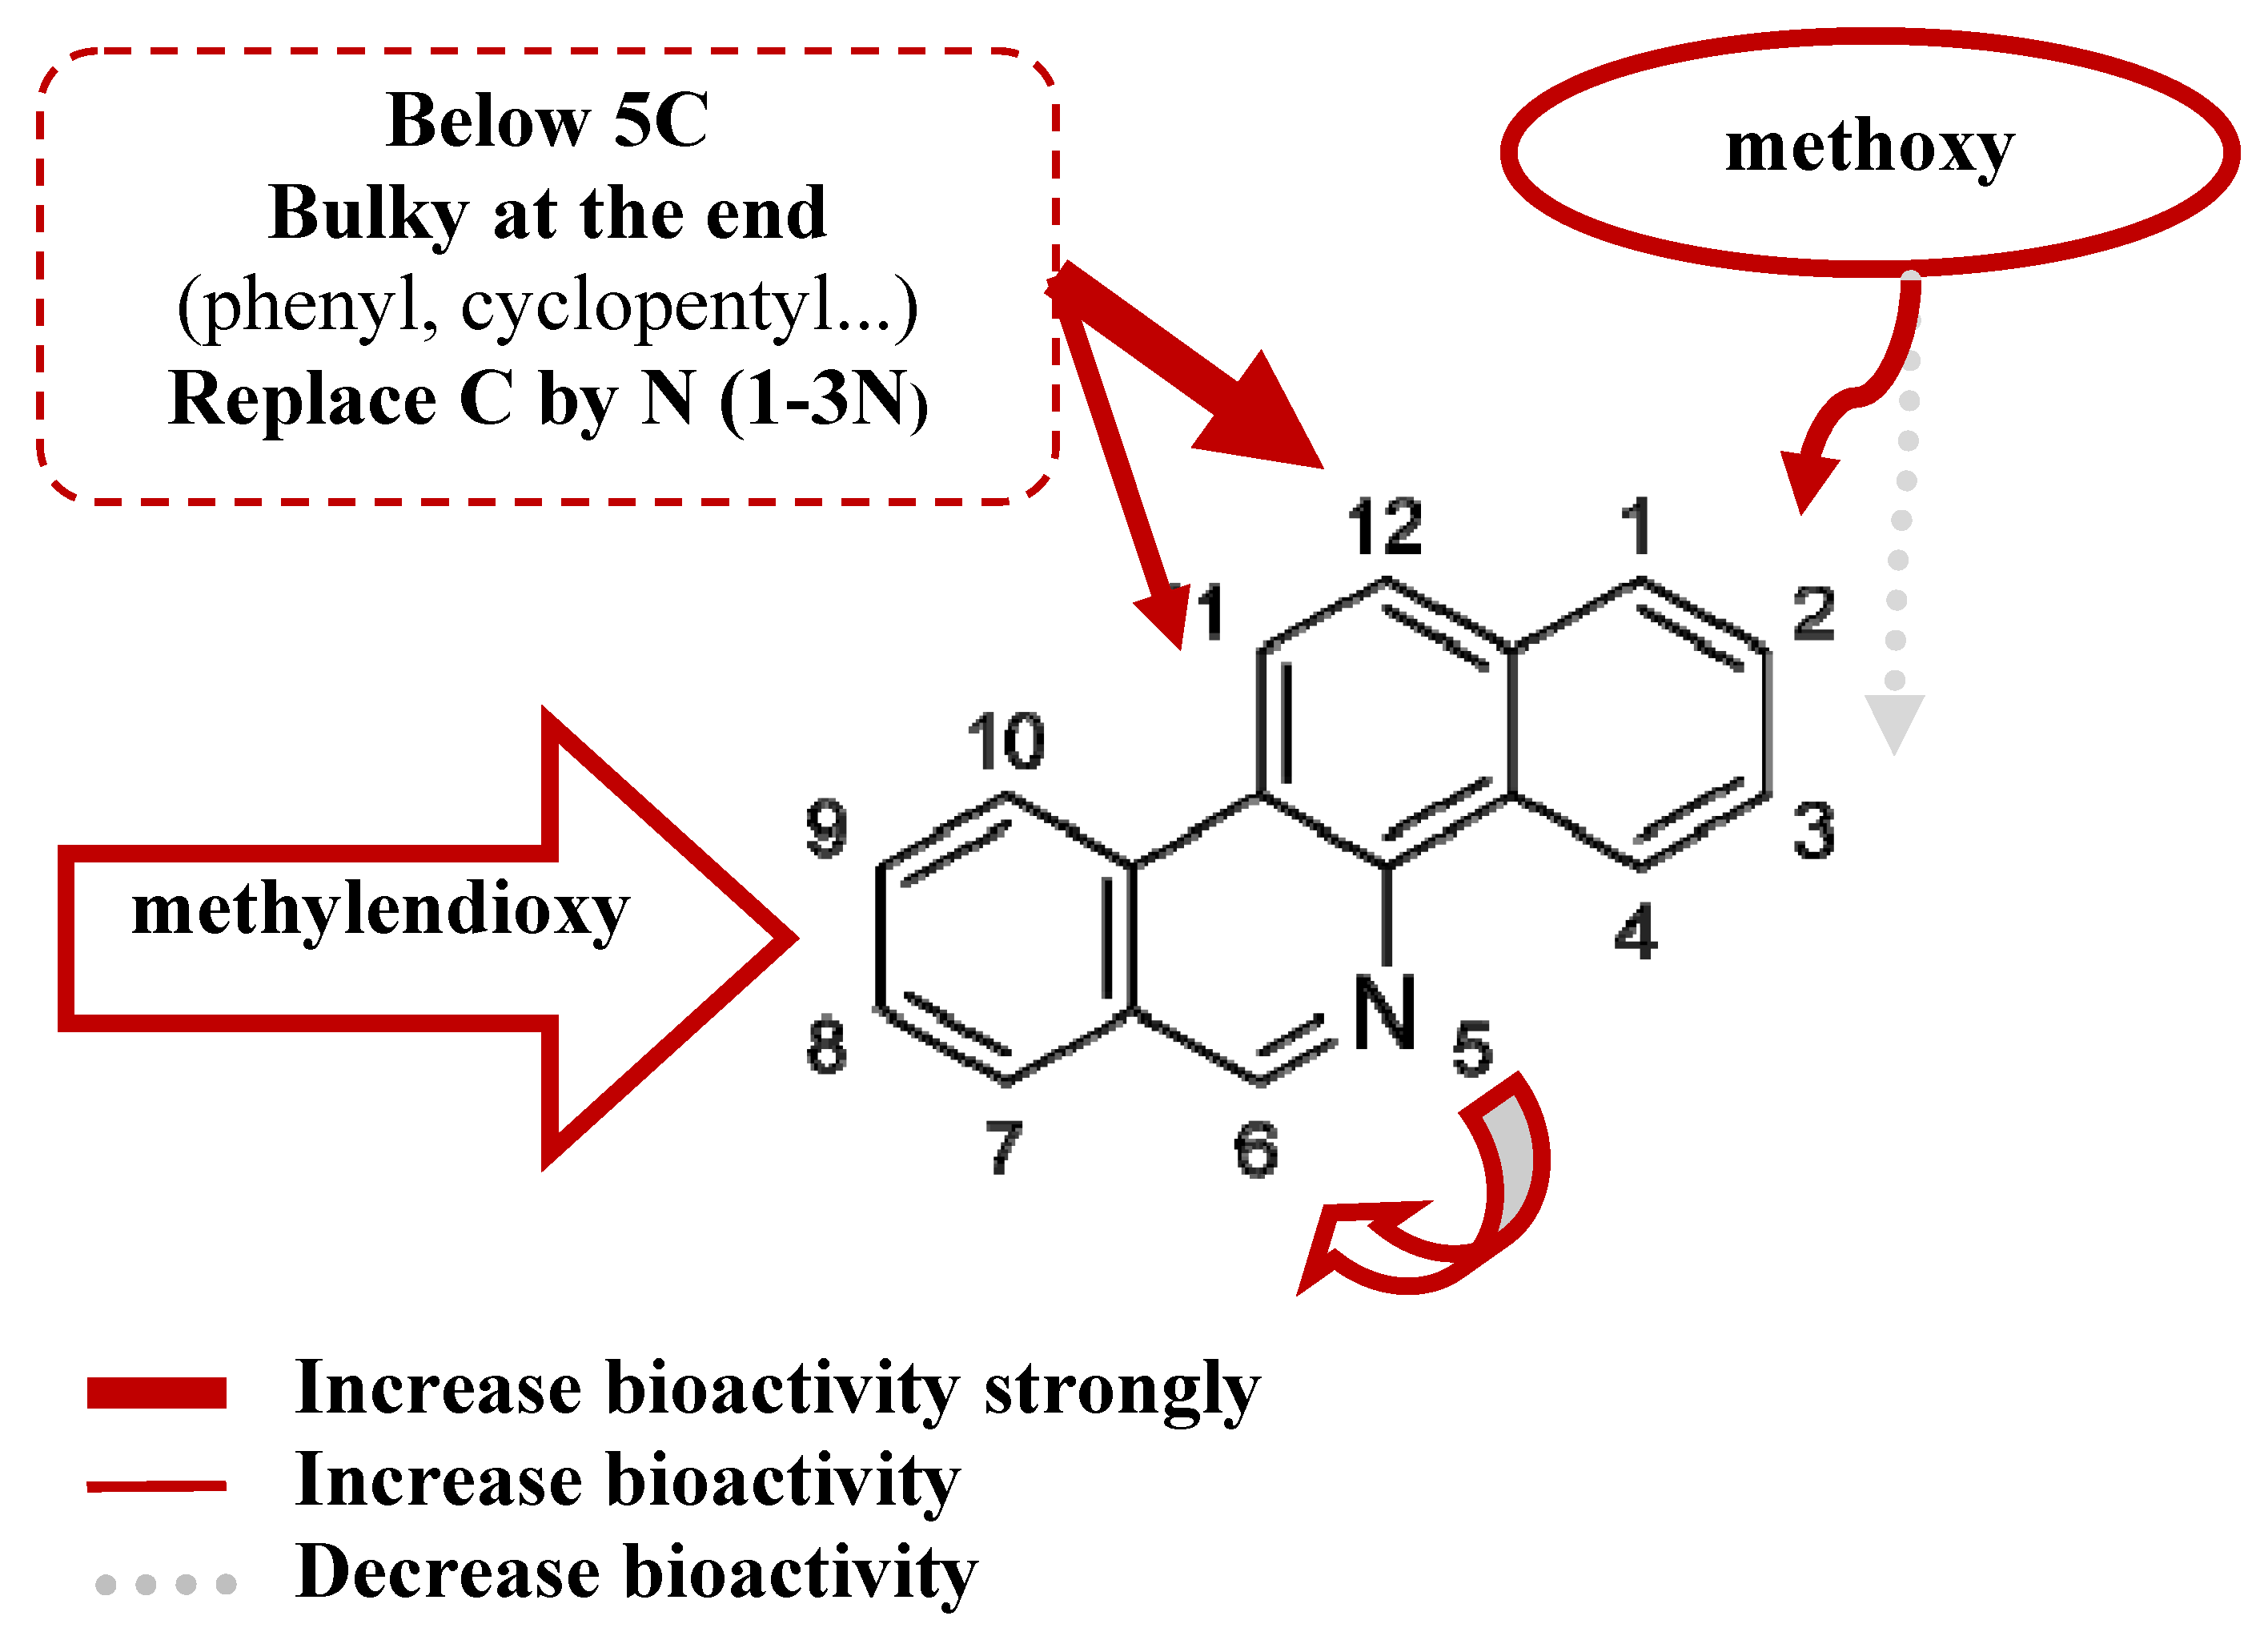
- The steric interaction plays an important role in determining the bioactivities of the BCP against many tumor cell lines, including cytotoxicity and TOP-I inhibitory ability. Substituents at 8,9-dimethoxy position on the skeletons are necessary for the biological effects. The results have shown that methoxy group at position 2 is essential for bioactivity while position 3 is not essential. The substituents at position 11, 12 affect the activity and should have a length of 4-5 carbons or lower, be straight up with the bulky end groups.
- (2).
- Reducing the amount of nitrogen in the rings system and increasing the number of nitrogen atoms in the substituent can improve the bioactivity. Nitrogen in position 6 gave a better effect than position 5.
- (3).
- The substituents at two positions 11 and 12 could have a positive effect on cytotoxicity and TOP-I inhibitory activity. The substituent at position 12 gives a stronger effect on bioactivity than position 11.
3. Materials and Methods
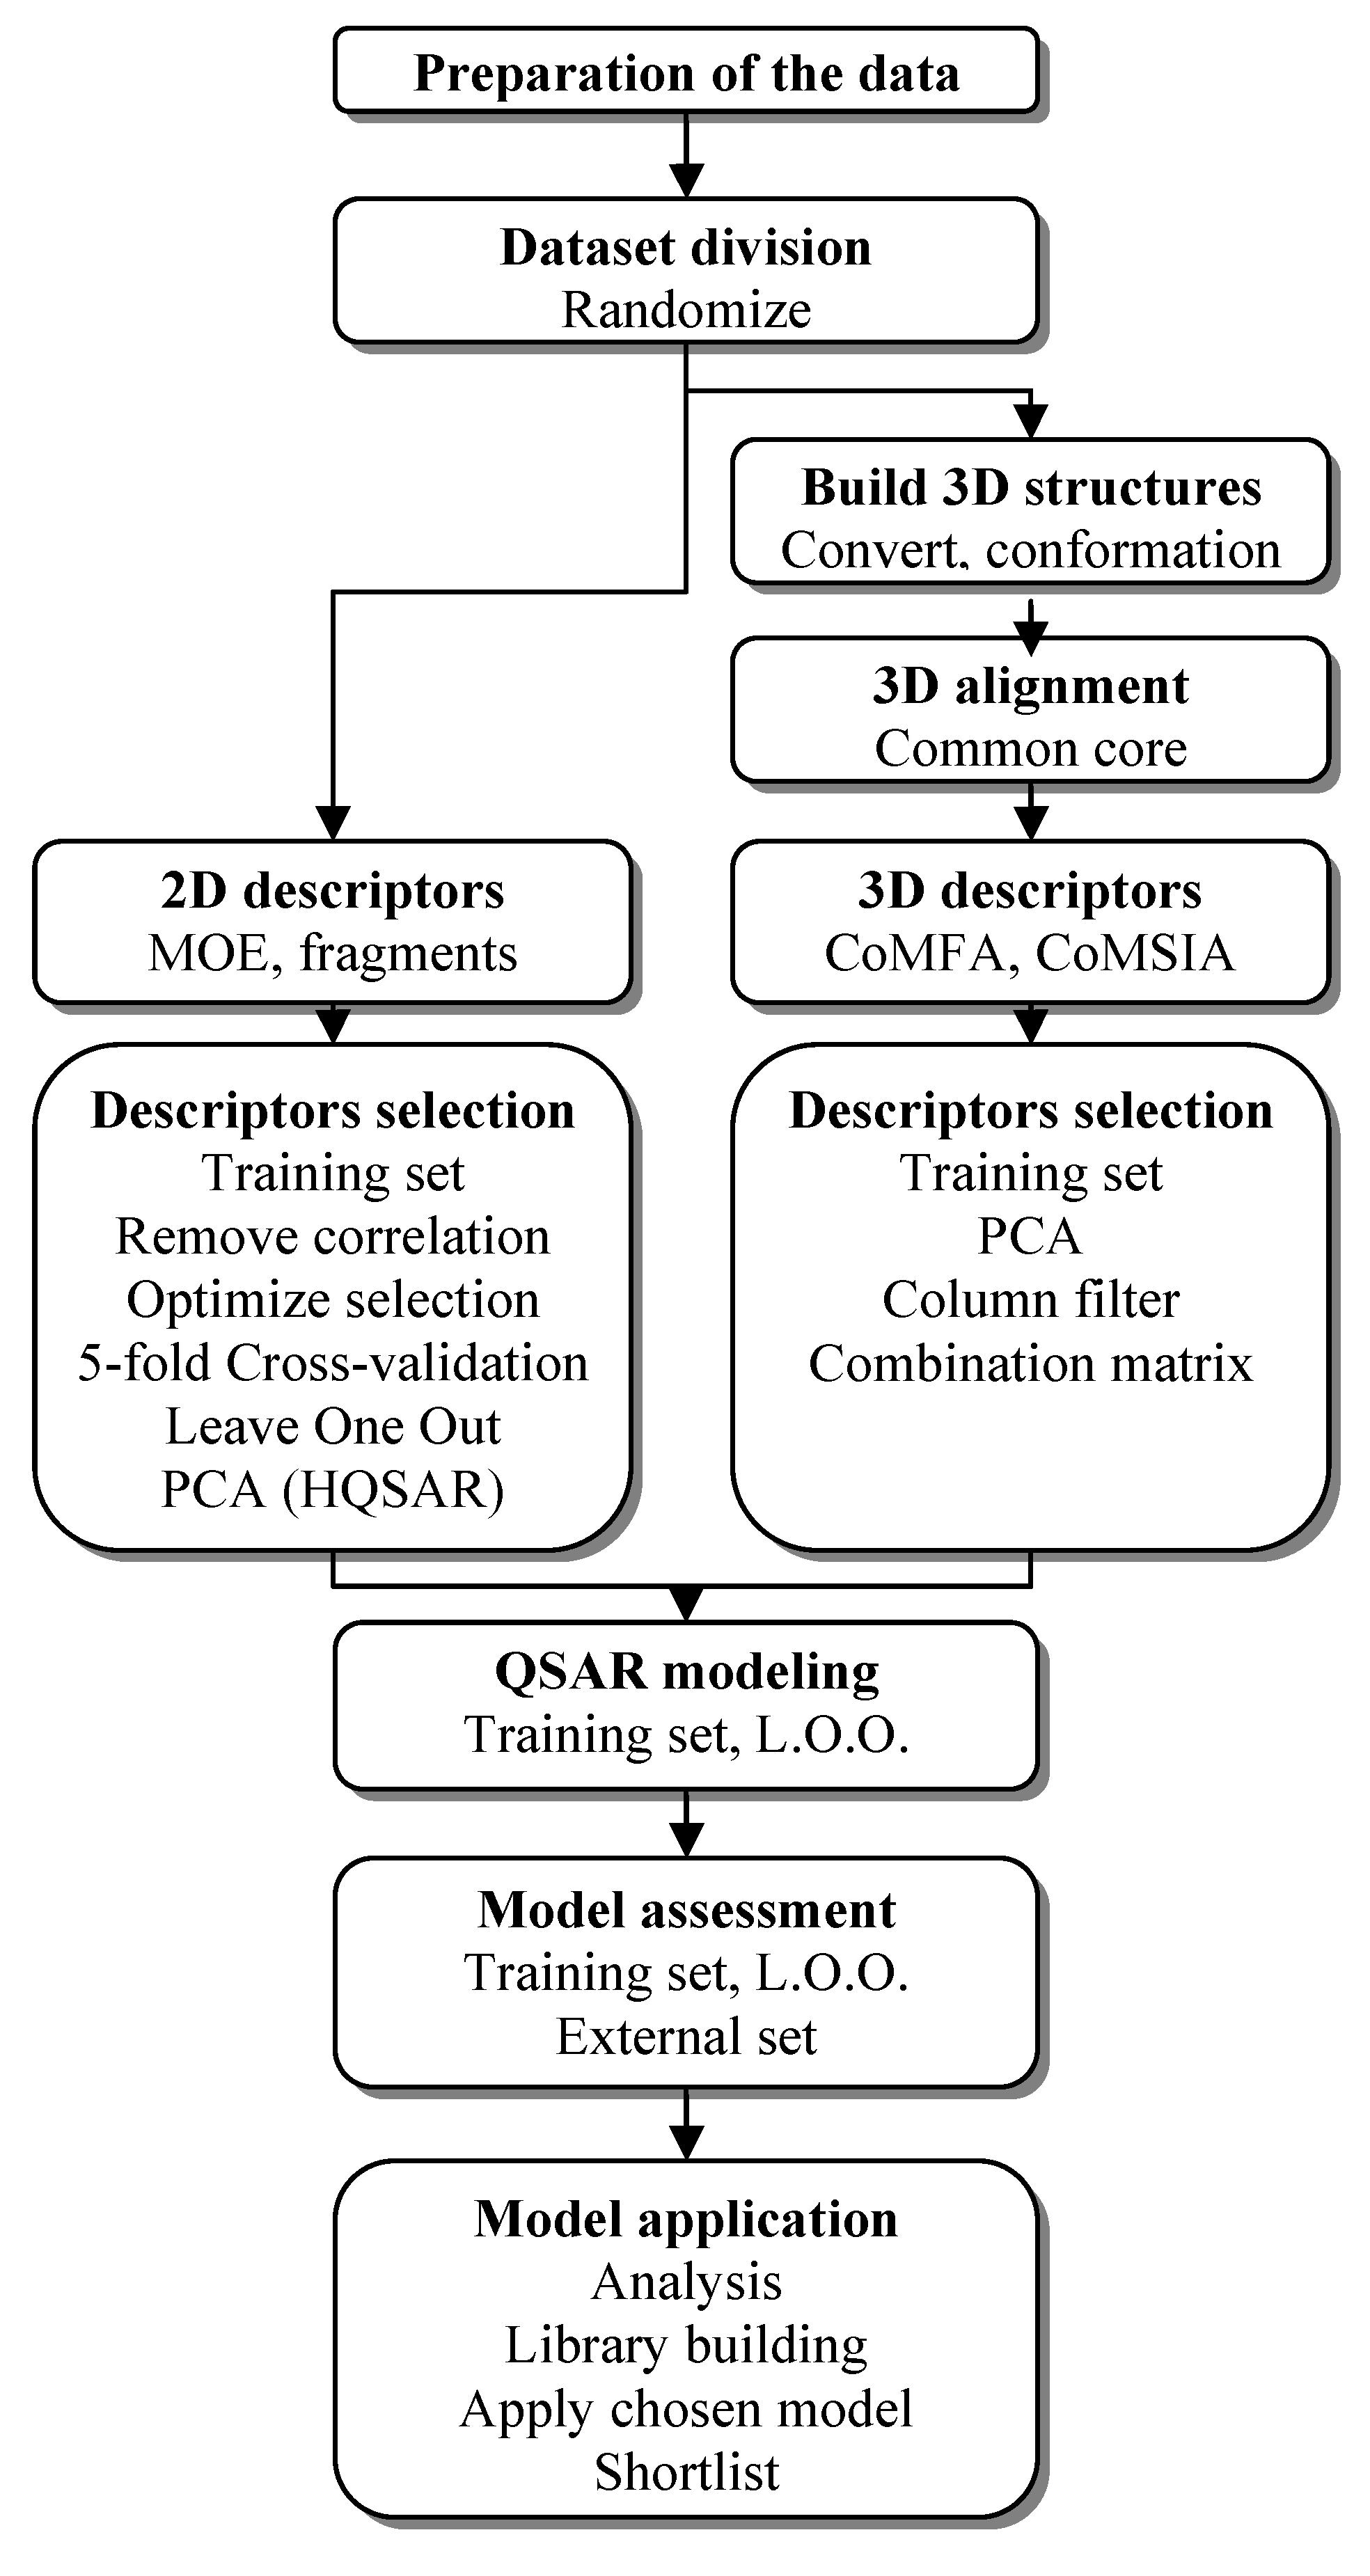
3.1. QSAR Study Process
3.2. Preparation of the Data Sets
3.3. Hologram-QSAR
3.3.1. Calculated Fragment Descriptors
3.3.2. Hologram-QSAR Process
3.4. 2D-QSAR
3.4.1. Calculated 2D-descriptors
3.4.2. 2D-QSAR Process
3.5. 3D-QSAR
3.5.1. Calculated 3D-descriptors
3.5.2. 3D-QSAR Process
4. Conclusions
Supplementary Materials
Acknowledgments
Conflict of Interest
References and Notes
- Li, T.-K.; Houghton, P.J.; Desai, S.D.; Daroui, P.; Liu, A.A.; Hars, E.S.; Ruchelman, A.L.; LaVoie, E.J.; Liu, L.-F. Characterization of ARC-111 as a novel topoisomerase I-targeting anticancer drug. Cancer Res. 2003, 63, 8400–8407. [Google Scholar] [PubMed]
- Pommier, Y. DNA topoisomerase I inhibitors: Chemistry, biology, and interfacial inhibition. Chem. Rev. 2009, 109, 2894–2902. [Google Scholar] [CrossRef] [PubMed]
- Li, D.; Zhao, B.; Sim, S.-P.; Li, T.-K.; Liu, A.; Liu, L.-F.; LaVoie, E.J. 2,3-Dimethoxy-benzo[i]phenanthridines: Topoisomerase I-targeting anticancer agents. Bioorg. Med. Chem. 2003, 11, 521–528. [Google Scholar] [CrossRef]
- Li, D.; Zhao, B.; Sim, S.-P.; Li, T.-K.; Liu, A.; Liu, L.-F.; LaVoie, E.J. 8,9-methylene-dioxybenzo[i]phenanthridines: topoisomerase I-targeting activity and cytotoxicity. Bioorg. Med. Chem. 2003, 11, 3795–3805. [Google Scholar] [CrossRef]
- Makhey, D.; Li, D.; Zhao, B.; Sim, S.-P.; Li, T.-K.; Liu, A.; Liu, L.-F.; LaVoie, E.J. Substituted benzo(i)phenanthridines as mammalian topoisomerase I-targeting anticancer agents. Bioorg. Med. Chem. 2003, 11, 1809–1820. [Google Scholar] [CrossRef]
- Ruchelman, A.L.; Kerrigan, J.E.; Li, T.-K.; Zhou, N.; Liu, A.; Liu, L.-F.; LaVoie, E.J. Nitro and amino substitution within the A-ring of 5H-8,9-dimethoxy-5-(2-N,N-dimethylamino-ethyl)dibenzo(c,h) (1,6) naph-thyridin-6-ones: influence on topoisomerase I-targeting activity and cytotoxicity. Bioorg. Med. Chem. 2004, 12, 3731–3742. [Google Scholar] [CrossRef] [PubMed]
- Zhu, S.; Ruchelman, A.L.; Zhou, N.; Liu, A.; Liu, L.F.; LaVoie, E.J. Esters and amides of 2,3-dime-thoxy-8,9-methylene-dioxybenzo(i)phenanthridine-12-carboxylic acid: potent topoisomerase I-targeting agents. Bioorg. Med. Chem. 2005, 13, 6782–6794. [Google Scholar] [CrossRef] [PubMed]
- Zhu, S.; Ruchelman, A.L.; Zhou, N.; Liu, A.; Liu, L.-F.; LaVoie, E.J. 6-Substituted 6H-dibenzo(c,h)(2,6)naph-thyridin-5-ones: reversed lactam analogues of ARC-111 with potent topoisomerase I-targeting activity and cytotoxicity. Bioorg. Med. Chem. 2006, 14, 3131–3143. [Google Scholar] [CrossRef] [PubMed]
- Feng, W.; Satyanarayana, M.; Tsai, Y.-C.; Liu, A.A.; Liu, L.-F.; LaVoie, E.J. 11-Substituted 2,3-dimethoxy- 8,9 -methylenedioxybenzo[i]phenanthridine derivatives as novel topoisomerase I-targeting agents. Bioorg. Med. Chem. 2008, 16, 8598–8606. [Google Scholar] [CrossRef] [PubMed]
- Sharma, L.; Tsai, Y.-C.; Liu, A.-A.; Liu, L.-F.; LaVoie, E.J. Cytotoxicity and TOP1-targeting activity of 8- and 9-amino derivatives of 5-butyl- and 5-(2-N,N-dimethylamino)ethyl-5H-dibenzo[c,h][1,6]naphthyridin-6-ones. Eur. J. Med. Chem. 2009, 44, 1471–1476. [Google Scholar] [CrossRef] [PubMed]
- Feng, W.; Satyanarayana, M.; Tsai, Y.-C.; Liu, A.-A.; Liu, L.-F.; LaVoie, E.J. 12-Substituted 2,3-dimethoxy-8,9-methylenedioxybenzo[i]phenanthridines as novel topoisomerase I-targeting antitumor agents. Bioorg. Med. Chem. 2009, 17, 2877–2885. [Google Scholar] [CrossRef] [PubMed]
- Liao, S.-Y.; Qian, L.; Lu, H.-L.; Shen, Y.; Zheng, K.-C. A Combined 2D- and 3D-QSAR Study on Analogues of ARC-111 with Antitumor Activity. QSAR Comb. Sci. 2008, 27, 740–749. [Google Scholar] [CrossRef]
- Verma, R.P. Understanding topoisomerase I and II in terms of QSAR. Bioorg. Med. Chem. 2005, 13, 1059–1067. [Google Scholar] [CrossRef] [PubMed]
- Bai, L.-P.; Zhao, Z.-Z.; Cai, Z.; Jiang, Z.-H. DNA-binding affinities and sequence selectivity of quaternary benzophenanthridine alkaloids sanguinarine, chelerythrine, and nitidine. Bioorg. Med. Chem. 2006, 14, 5439–5445. [Google Scholar] [CrossRef] [PubMed]
- Hastie, T.; Tibshirani, R.; Friedman, J. The Elements of Statistical Learning: Data Mining, Inference, and Prediction; Springer-Verlag: New York, NY, USA, 2008. [Google Scholar]
- Gramatica, P. Principles of QSAR models validation: internal and external. QSAR Comb. Sci. 2007, 26, 694–701. [Google Scholar] [CrossRef]
- Kubinyi, H. Validation and predictivity of QSAR models. In QSAR & Molecular Modelling in Rational Design of Bioactive Molecules, Proceedings of the 15th European Symposium on QSAR & Molecular Modelling, Istanbul, Turkey, 2004; Sener, E.A., Yalcin, I., Eds.; CADDD Society: Ankara, Turkey, 2006; pp. 30–33. [Google Scholar]
- Dietrich, S.W.; Dreyer, N.D.; Hansch, C.; Bentley, D.L. Confidence interval estimators for parameters associated with quantitative structure-activity relationships. J. Med. Chem. 1980, 23, 1201–1205. [Google Scholar] [CrossRef] [PubMed]
- Thai, K.-M.; Ecker, G.F. Classification models for hERG inhibitors by counter-propagation neural networks. Chem. Biol. Drug Des. 2008, 72, 279–289. [Google Scholar] [CrossRef] [PubMed]
- Thai, K.-M.; Ecker, G.F. Similarity-based SIBAR descriptors for classification of chemically diverse hERG blockers. Mol. Divers. 2009, 13, 321–336. [Google Scholar] [CrossRef] [PubMed]
- Roy, K.; Mitra, I.; Kar, S.; Ojha, P.K.; Das, R.N.; Kabir, H. Comparative Studies on Some Metrics for External Validation of QSPR Models. J. Chem. Inf. Model. 2012, 52, 396–408. [Google Scholar] [CrossRef] [PubMed]
- Ojha, P.K.; Mitra, I.; Das, R.N.; Roy, K. Further exploring rm2 metrics for validation of QSPR models. Chemometr. Intell. Lab. 2011, 107, 194–205. [Google Scholar] [CrossRef]
- Pratim Roy, P.; Paul, S.; Mitra, I.; Roy, K. On Two Novel Parameters for Validation of Predictive QSAR Models. Molecules 2009, 14, 1660–1701. [Google Scholar] [CrossRef] [PubMed]
- Khadka, D.B.; Cho, W.J. 3-Arylisoquinolines as novel topoisomerase I inhibitors. Bioorg. Med. Chem. 2011, 19, 724–734. [Google Scholar] [CrossRef] [PubMed]
- Clark, R.L.; Deane, F.M.; Anthony, N.G.; Johnston, B.F.; McCarthy, F.O.; Mackay, S.P. Exploring DNA topoisomerase I inhibition by the benzo[c]phenanthridines fagaronine and ethoxidine using steered molecular dynamics. Bioorg. Med. Chem. 2007, 15, 4741–4752. [Google Scholar] [CrossRef] [PubMed]
- Thai, K.-M.; Nguyen, T.-Q.; Ngo, T.-D.; Tran, T.-D.; Huynh, T.-N.-P. A Support Vector Machine Classification Model for Benzo[c]phenathridine Analogues with Topoisomerase-I Inhibitory Activity. Molecules 2012, 17, 4560–4582. [Google Scholar] [CrossRef] [PubMed]
- MOE 2007.02. Chemical Computing Group Inc.: Montreal, Canada. Available online: http://www.chemcomp.com (accessed on 26 December 2011).
- Sybyl 2007: Computational Informatics Software for Molecular Modelers. Tripos L.P.: St. Louis, MO, USA. Available online: http://tripos.com/ (accessed on 26 December 2011).
- Rapidminer Home Page. Available online: http://www.rapidminer.com (accessed on 5 November 2011).
Sample Availability: Not available. |


| Bioactivity | Number of compounds | Number of compounds on each skeleton | |||||
|---|---|---|---|---|---|---|---|
| G1 | G2 | G3 | G4 | G5 | G6 | ||
| RPMI | 133 | 65 | 9 | 13 | 6 | 10 | 30 |
| CPTk5 | 101 | 50 | 8 | 12 | 6 | 8 | 17 |
| P388 | 82 | 53 | 1 | 4 | 5 | 9 | 10 |
| CPT45 | 73 | 45 | 0 | 4 | 5 | 9 | 10 |
| U937 | 39 | 23 | 9 | 0 | 6 | 0 | 1 |
| U937rs | 33 | 20 | 7 | 0 | 5 | 0 | 1 |
| KB3-1 | 83 | 53 | 10 | 13 | 6 | 0 | 1 |
| KBV-1 | 81 | 52 | 9 | 13 | 6 | 0 | 1 |
| KBH | 60 | 46 | 0 | 13 | 0 | 0 | 1 |
| TOP-I | 94 | 52 | 8 | 12 | 5 | 9 | 8 |
| Bioactivity | RPMI 8402 | CPT-K5 | P388 | CPT45 | KB3-1 | KBV-1 | KBH5.0 | TOP-I |
|---|---|---|---|---|---|---|---|---|
| Number of compounds | 133 | 101 | 82 | 73 | 83 | 81 | 60 | 94 |
| Training set | 105 | 80 | 66 | 58 | 68 | 60 | 48 | 74 |
| External test set | 28 | 21 | 16 | 15 | 15 | 21 | 12 | 20 |
| Model | RPMI | CPTk5 | P388 | CPT45 | KB3-1 | KBV | KBH | TOP-I |
|---|---|---|---|---|---|---|---|---|
| Number compounds in training set | 105 | 80 | 66 | 58 | 68 | 60 | 48 | 74 |
| Number compounds in external test set | 28 | 21 | 16 | 15 | 15 | 21 | 12 | 20 |
| R2 (Training set) | 0.584 | 0.452 | 0.655 | 0.472 | 0.627 | 0.632 | 0.536 | 0.602 |
| Standard Error (Training set) | 0.543 | 0.400 | 0.271 | 0.338 | 0.414 | 0.248 | 0.218 | 0.355 |
| q2 (L.O.O.) | 0.511 | 0.302 | 0.417 | 0.230 | 0.537 | 0.474 | 0.394 | 0.475 |
| Standard Error (L.O.O.) | 0.641 | 0.522 | 0.489 | 0.527 | 0.520 | 0.364 | 0.29 | 0.477 |
| rt2 (External set) | 0.514 | 0.248 | 0.334 | 0.043 | 0.514 | 0.314 | 0.053 | 0.657 |
| Standard Error (External set) | 0.803 | 0.434 | 0.799 | 0.943 | 0.665 | 0.858 | 0.78 | 0.417 |
| p-value of model | 0.000 | 0.000 | 0.000 | 0.000 | 0.000 | 0.000 | 0.000 | 0.000 |
| Number of 2D molecular descriptor | 7 | 9 | 10 | 9 | 6 | 8 | 6 | 10 |
| Greates p-value of used descriptors | 0.039 | 0.018 | 0.014 | 0.000 | 0.026 | 0.002 | 0.026 | 0.008 |
| Model assessment | ||||||||
| δ | 1.45 | 1.30 | 1.10 | 1.20 | 1.25 | 1.00 | 1.00 | 1.25 |
| Assessment | + | + | + | + | + | + | + | + |
| Range of prediction | −1.5 2.2 | −1.2 1.4 | 0 2.3 | −0.5 1.25 | −0.5 2.2 | −1.2 1.5 | 0.5 1.7 | −2 0.5 |
| 0.584 | 0.452 | 0.655 | 0.472 | 0.627 | 0.632 | 0.536 | 0.602 | |
| 0.399 | 0.374 | 0.424 | 0.284 | 0.433 | 0.506 | 0.264 | 0.451 | |
| 0.491 | 0.413 | 0.540 | 0.378 | 0.530 | 0.569 | 0.400 | 0.527 | |
| 0.186 | 0.078 | 0.231 | 0.188 | 0.194 | 0.126 | 0.272 | 0.151 | |
| 0.514 | 0.248 | 0.256 | 0.018 | 0.591 | 0.278 | 0.035 | 0.588 | |
| 0.324 | 0.169 | 0.187 | 0.012 | 0.549 | 0.180 | −0.007 | 0.413 | |
| 0.419 | 0.208 | 0.222 | 0.015 | 0.570 | 0.229 | 0.014 | 0.501 | |
| 0.190 | 0.079 | 0.068 | 0.006 | 0.042 | 0.099 | 0.042 | 0.175 |
| Model | RPMI | CPTk5 | P388 | CPT45 | KB3-1 | KBV | KBH | TOP-I |
|---|---|---|---|---|---|---|---|---|
| Number compounds in training set | 105 | 80 | 66 | 58 | 68 | 60 | 48 | 74 |
| Number compounds in external test set | 28 | 21 | 16 | 15 | 15 | 21 | 12 | 20 |
| R2 (Training set) | 0.765 | 0.573 | 0.439 | 0.483 | 0.622 | 0.501 | 0.624 | 0.616 |
| Standard Error (Training set) | 0.489 | 0.428 | 0.675 | 0.586 | 0.658 | 0.418 | 0.439 | 0.594 |
| q2 (L.O.O.) | 0.568 | 0.320 | 0.182 | 0.123 | 0.514 | 0.328 | 0.482 | 0.406 |
| Standard Error (L.O.O.) | 0.777 | 0.733 | 0.828 | 0.777 | 0.757 | 0.697 | 0.516 | 0.754 |
| rt2 (External set) | 0.525 | 0.285 | 0.302 | 0.010 | 0.541 | 0.708 | 0.439 | 0.690 |
| Standard Error (External set) | 0.567 | 0.382 | 0.941 | 0.635 | 0.752 | 0.306 | 0.339 | 0.433 |
| Hologram lengths | 151 | 53 | 353 | 199 | 61 | 71 | 59 | 307 |
| Principal components | 6 | 5 | 6 | 3 | 3 | 3 | 3 | 4 |
| Limitation of atoms in each fragment | 5–10 | 5–10 | 5–8 | 5–6 | 2–8 | 5–6 | 5–7 | 1–7 |
| p-value | 0.000 | 0.000 | 0.000 | 0.000 | 0.000 | 0.000 | 0.000 | 0.000 |
| Model assessment | ||||||||
| δ | 1.10 | 1.20 | 1.30 | 1.20 | 1.35 | 1.2 | 0.80 | 1.20 |
| Assessment | + | + | + | + | + | + | + | + |
| Range of prediction | −1 3 | −1.5 0.2 | 0 1.2 | 0.2 1 | 0 2.5 | −0.5 1.7 | 0.5 2 | −2 0.5 |
| 0.765 | 0.572 | 0.439 | 0.482 | 0.621 | 0.500 | 0.624 | 0.616 | |
| 0.633 | 0.504 | 0.132 | 0.297 | 0.425 | 0.348 | 0.387 | 0.466 | |
| 0.699 | 0.538 | 0.286 | 0.389 | 0.523 | 0.424 | 0.506 | 0.541 | |
| 0.132 | 0.068 | 0.307 | 0.185 | 0.196 | 0.152 | 0.237 | 0.150 | |
| 0.507 | 0.276 | 0.289 | 0.006 | 0.503 | 0.645 | 0.367 | 0.569 | |
| 0.362 | 0.159 | −0.033 | 0.005 | 0.342 | 0.493 | −0.054 | 0.378 | |
| 0.435 | 0.217 | 0.128 | 0.005 | 0.422 | 0.569 | 0.154 | 0.473 | |
| 0.145 | 0.117 | 0.322 | 0.001 | 0.161 | 0.151 | 0.415 | 0.190 |
| Model | RPMI-fs43 | RPMI-fs45 | CPTk5-sh44 | P388-s15 | CPT45-s53 | KB3-s34 | KB3-e12 | KB3-h34 | KB3-eh32 | KBV-s34 | KBH-fs43 | TOP-I -s34 | TOP-I -h54 |
|---|---|---|---|---|---|---|---|---|---|---|---|---|---|
| Number compounds in training set | 105 | 105 | 80 | 66 | 58 | 68 | 68 | 68 | 68 | 60 | 48 | 74 | 74 |
| Number compounds in test set | 28 | 28 | 21 | 16 | 15 | 15 | 15 | 15 | 15 | 21 | 12 | 20 | 20 |
| R2 (Training set) | 0.734 | 0.812 | 0.650 | 0.667 | 0.496 | 0.721 | 0.698 | 0.768 | 0.731 | 0.629 | 0.696 | 0.701 | 0.700 |
| Standard Error (Training set) | 0.601 | 0.510 | 0.522 | 0.537 | 0.589 | 0.597 | 0.593 | 0.528 | 0.559 | 0.523 | 0.394 | 0.535 | 0.536 |
| q2 (L.O.O.) | 0.594 | 0.607 | 0.338 | 0.309 | 0.203 | 0.584 | 0.552 | 0.539 | 0.582 | 0.372 | 0.330 | 0.423 | 0.345 |
| Standard Error (L.O.O.) | 0.742 | 0.737 | 0.718 | 0.774 | 0.741 | 0.707 | 0.722 | 0.744 | 0.697 | 0.680 | 0.586 | 0.743 | 0.792 |
| rt2 (External set) | 0.685 | 0.701 | 0.471 | 0.570 | 0.202 | 0.661 | 0.496 | 0.636 | 0.620 | 0.436 | 0.282 | 0.795 | 0.836 |
| Standard Error (External set) | 0.742 | 0.724 | 0.545 | 0.739 | 0.570 | 0.647 | 0.789 | 0.670 | 0.686 | 0.857 | 0.796 | 0.518 | 0.338 |
| 3D-descriptor | Fs | fs | sh | S | S | S | e | h | eh | s | Fs | S | H |
| Column filter | 4 | 4 | 4 | 1 | 5 | 3 | 1 | 3 | 3 | 3 | 4 | 3 | 5 |
| Principal component | 3 | 5 | 4 | 5 | 3 | 4 | 2 | 4 | 2 | 4 | 3 | 4 | 4 |
| p-value | 0.000 | 0.000 | 0.000 | 0.000 | 0.000 | 0.000 | 0.000 | 0.000 | 0.000 | 0.000 | 0.000 | 0.000 | 0.000 |
| Model assessment | |||||||||||||
| δ | 1.10 | 1.00 | 1.05 | 1.05 | 1.20 | 1.15 | 1.20 | 1.10 | 1.15 | 1.00 | 0.75 | 1.10 | 1.2 |
| Assessment | + | - | + | + | + | + | + | + | + | +/− | + | + | + |
| Range of prediction | −1.5 2.5 | − − | −1.5 1 | −0.2 2 | −0.2 1 | −0.5 2 | 0 2 | −0.2 2.2 | −0.2 2 | 0 1.2 | −0.5 2 | −2.5 0.5 | −2.5 1 |
| 0.571 | 0.812 | 0.650 | 0.667 | 0.496 | 0.721 | 0.697 | 0.767 | 0.730 | 0.628 | 0.696 | 0.701 | 0.700 | |
| 0.530 | 0.703 | 0.592 | 0.442 | 0.312 | 0.565 | 0.531 | 0.634 | 0.579 | 0.501 | 0.494 | 0.578 | 0.577 | |
| 0.550 | 0.758 | 0.621 | 0.554 | 0.404 | 0.643 | 0.614 | 0.701 | 0.654 | 0.564 | 0.595 | 0.639 | 0.638 | |
| 0.041 | 0.109 | 0.058 | 0.225 | 0.183 | 0.156 | 0.166 | 0.133 | 0.151 | 0.127 | 0.202 | 0.123 | 0.123 | |
| 0.663 | 0.324 | 0.429 | 0.569 | 0.188 | 0.585 | 0.461 | 0.636 | 0.591 | 0.332 | 0.282 | 0.604 | 0.523 | |
| 0.568 | −0.451 | 0.294 | 0.332 | 0.063 | 0.546 | 0.162 | 0.409 | 0.349 | −0.014 | −0.009 | 0.431 | 0.318 | |
| 0.616 | 0.064 | 0.362 | 0.450 | 0.126 | 0.565 | 0.312 | 0.522 | 0.470 | 0.159 | 0.137 | 0.517 | 0.421 | |
| 0.095 | 0.775 | 0.135 | 0.237 | 0.125 | 0.039 | 0.299 | 0.278 | 0.242 | 0.346 | 0.291 | 0.173 | 0.206 |


| No | Molecular descriptor | Description |
|---|---|---|
| 1 | a_acc | Number of hydrogen bond acceptor atoms |
| 1 | a_acc | Number of hydrogen bond acceptor atoms |
| 2 | a_aro | Number of aromatic atoms |
| 3 | a_ICM | Atom information content (mean). This is the entropy of the element distribution in the molecule (including implicit hydrogens but not lone pair pseudo-atoms). |
| 4 | a_nN | Number of nitrogen atoms: #{Zi | Zi = 7}. |
| 5 | a_nO | Number of oxygen atoms: #{Zi | Zi = 8}. |
| 6 | b_1rotR | Fraction of rotatable single bonds: b_1rotN divided by b_heavy. |
| 7 | BCUT_PEOE_0 | The BCUT descriptors [Pearlman 1998] are calculated from the eigenvalues of a modified adjacency matrix. |
| 8 | BCUT_PEOE_1 | |
| 9 | BCUT_PEOE_2 | |
| 10 | chi1v_C | Carbon valence connectivity index (order 1). |
| 11 | density | Molecular mass density: Weight divided by vdw_vol (amu/Å3). |
| 12 | diameter | Largest value in the distance matrix |
| 13 | GCUT_PEOE_1 | The GCUT descriptors are calculated from the eigenvalues of a modified graph distance adjacency matrix. |
| 14 | GCUT_SLOGP_0 | The GCUT descriptors using atomic contribution to logP instead of partial charge. |
| 15 | GCUT_SLOGP_1 | |
| 16 | GCUT_SMR_0 | The GCUT descriptors using atomic contribution to molar refractivity instead of partial charge. |
| 17 | opr_leadlike | Atom Counts and Bond Counts: One if and only if opr_violation < 2 otherwise zero. |
| 18 | PEOE_VSA_FHYD | Fractional hydrophobic van der Waals surface area. |
| 19 | PEOE_VSA_FNEG | Fractional negative van der Waals surface area. |
| 20 | PEOE_VSA_NEG | Total negative van der Waals surface area. |
| 21 | PEOE_VSA+0 | Sum of vi where qi is in the range [0.00, 0.05). |
| 22 | PEOE_VSA+1 | PEOE: Sum of vi where qi is in the range [0.05, 0.10). |
| 23 | PEOE_VSA+2 | PEOE: Sum of vi where qi is in the range [0.10, 0.15). |
| 24 | PEOE_VSA+3 | PEOE: Sum of vi where qi is in the range [0.15, 0.20). |
| 25 | PEOE_VSA-0 | PEOE: Sum of vi where qi is in the range [−0.05, 0.00). |
| 26 | PEOE_VSA-1 | PEOE: Sum of vi where qi is in the range [−0.10, −0.05). |
| 27 | petitjean | Largest value in the distance matrix |
| 28 | SlogP | Log of the octanol/water partition coefficient (including implicit hydrogens). |
| 29 | SlogP_VSA1 | Subdivided Surface Areas: Sum of vi such that Li is in (−0.4, −0.2]. |
| 30 | SlogP_VSA5 | Subdivided Surface Areas: Sum of vi such that Li is in (0.15, 0.20]. |
| 31 | SlogP_VSA9 | Subdivided Surface Areas: Sum of vi such that Li > 0.40. |
| 32 | VDistMa | Adjacency and Distance Matrix Descriptors: If m is the sum of the distance matrix entries then VDistMa is defined to be the sum of log2 m - Dij log2 Dij / m over all i and j. |
| 33 | vsa_acc | Approximation to the sum of VDW surface areas (Å2) of pure hydrogen bond acceptors |
| 34 | vsa_other | Approximation to the sum of VDW surface areas (Å2) of atoms typed as “other”. |
| 35 | vsa_pol | Approximation to the sum of VDW surface areas (Å2) of polar atoms (atoms that are both hydrogen bond donors and acceptors), such as -OH. |
| 3D descriptor field | q2 for each column filter values | ||||
|---|---|---|---|---|---|
| 1 | 2 | 3 | 4 | 5 | |
| S | 0.583 | 0.583 | 0.584 | 0.579 | 0.575 |
| E | 0.552 | 0.551 | 0.553 | 0.540 | 0.542 |
| H | 0.542 | 0.541 | 0.539 | 0.509 | 0.485 |
| D | 0.014 | 0.013 | 0.004 | 0.000 | 0.000 |
| A | 0.414 | 0.415 | 0.417 | 0.423 | 0.429 |
| s.e | 0.580 | 0.580 | 0.580 | 0.576 | 0.576 |
| s.h | 0.551 | 0.555 | 0.555 | 0.545 | 0.536 |
| s.d | 0.448 | 0.446 | 0.473 | 0.485 | 0.502 |
| s.a | 0.498 | 0.507 | 0.501 | 0.503 | 0.505 |
| e.h | 0.582 | 0.581 | 0.582 | 0.571 | 0.560 |
| e.d | 0.560 | 0.562 | 0.568 | 0.545 | 0.534 |
| e.a | 0.561 | 0.558 | 0.552 | 0.550 | 0.547 |
| h.d | 0.437 | 0.438 | 0.438 | 0.411 | 0.406 |
| h.a | 0.466 | 0.465 | 0.465 | 0.463 | 0.467 |
| d.a | 0.409 | 0.412 | 0.417 | 0.423 | 0.427 |
| s.e.h | 0.585 | 0.581 | 0.584 | 0.579 | 0.570 |
| s.e.d | 0.578 | 0.578 | 0.586 | 0.584 | 0.575 |
| s.e.a | 0.563 | 0.564 | 0.562 | 0.561 | 0.558 |
| s.h.d | 0.514 | 0.527 | 0.533 | 0.528 | 0.516 |
| s.h.a | 0.511 | 0.515 | 0.511 | 0.510 | 0.511 |
| s.d.a | 0.499 | 0.507 | 0.514 | 0.530 | 0.509 |
| e.h.d | 0.563 | 0.565 | 0.573 | 0.560 | 0.552 |
| e.h.a | 0.560 | 0.557 | 0.551 | 0.546 | 0.540 |
| e.d.a | 0.526 | 0.528 | 0.533 | 0.531 | 0.520 |
| h.d.a | 0.444 | 0.446 | 0.445 | 0.443 | 0.449 |
| s.e.h.d | 0.572 | 0.574 | 0.579 | 0.571 | 0.562 |
| s.e.h.a | 0.569 | 0.569 | 0.565 | 0.561 | 0.555 |
| s.e.d.a | 0.548 | 0.551 | 0.555 | 0.558 | 0.544 |
| s.h.d.a | 0.493 | 0.507 | 0.515 | 0.518 | 0.501 |
| e.h.d.a | 0.528 | 0.529 | 0.530 | 0.523 | 0.513 |
| s.e.h.d.a | 0.545 | 0.547 | 0.543 | 0.540 | 0.537 |
| CoMFA | 0.549 | 0.549 | 0.546 | 0.547 | 0.551 |
© 2012 by the authors; licensee MDPI, Basel, Switzerland. This article is an open access article distributed under the terms and conditions of the Creative Commons Attribution license (http://creativecommons.org/licenses/by/3.0/).
Share and Cite
Thai, K.-M.; Bui, Q.-H.; Tran, T.-D.; Huynh, T.-N.-P. QSAR Modeling on Benzo[c]phenanthridine Analogues as Topoisomerase I Inhibitors and Anti-cancer Agents. Molecules 2012, 17, 5690-5712. https://doi.org/10.3390/molecules17055690
Thai K-M, Bui Q-H, Tran T-D, Huynh T-N-P. QSAR Modeling on Benzo[c]phenanthridine Analogues as Topoisomerase I Inhibitors and Anti-cancer Agents. Molecules. 2012; 17(5):5690-5712. https://doi.org/10.3390/molecules17055690
Chicago/Turabian StyleThai, Khac-Minh, Quang-Huynh Bui, Thanh-Dao Tran, and Thi-Ngoc-Phuong Huynh. 2012. "QSAR Modeling on Benzo[c]phenanthridine Analogues as Topoisomerase I Inhibitors and Anti-cancer Agents" Molecules 17, no. 5: 5690-5712. https://doi.org/10.3390/molecules17055690