1. Introduction
In recent years, more and more plant polysaccharides have been used in medicine and health-care food. Plant polysaccharides have various biological activities, such as antioxidant [
1,
2], free radical scavenging [
3], immunostimulatory [
4,
5], and anti-virus activity [
6]. At the same time, a growing amount of research has shown that polysaccharides could resist tumors by improving the immune system and inducing tumor apoptosis [
7,
8,
9,
10].
Capparis spionosa L., which cultivated in China and central Asia, is a traditional medicinal plant [
11,
12,
13,
14,
15]. Abundant research suggests that
Capparis spionosa L. contains a variety of active ingredients, such as volatile oil, sugar ligands, glucose isothiocyanates, alkaloids, and so on [
16].
Response surface methodology (RSM) that applies to optimizing conditions in food and pharmaceutical research is an effective tool for optimizing extraction processes [
17,
18,
19]. As one type of RSM, Box-Behnken design (BBD) is popularly use, principally to optimize technical parameters. BBD is prevalent to other approaches required in optimizing a process, such as saving materials, decreasing expenses, reducing time, and so on [
20].
Up to now, no detailed investigation has been conducted on optimization of polysaccharide extraction from the fruit of Capparis spionosa L. In addition, there are no experiments to explore the anti-tumor activity of CSPS. Therefore, the purpose of the study was to employ a BBD (four factors and three levels) to optimize the effects of extraction temperature, extraction time, ratio of water to sample, and extraction cycles on the yield of polysaccharides obtained from the fruit of Capparis spionosa L. (CSPS). Furthermore, the anti-tumor activity of CSPS was evaluated in the search for high quality biological functional principles for use in the pharmaceutical industry.
2. Results and Discussion
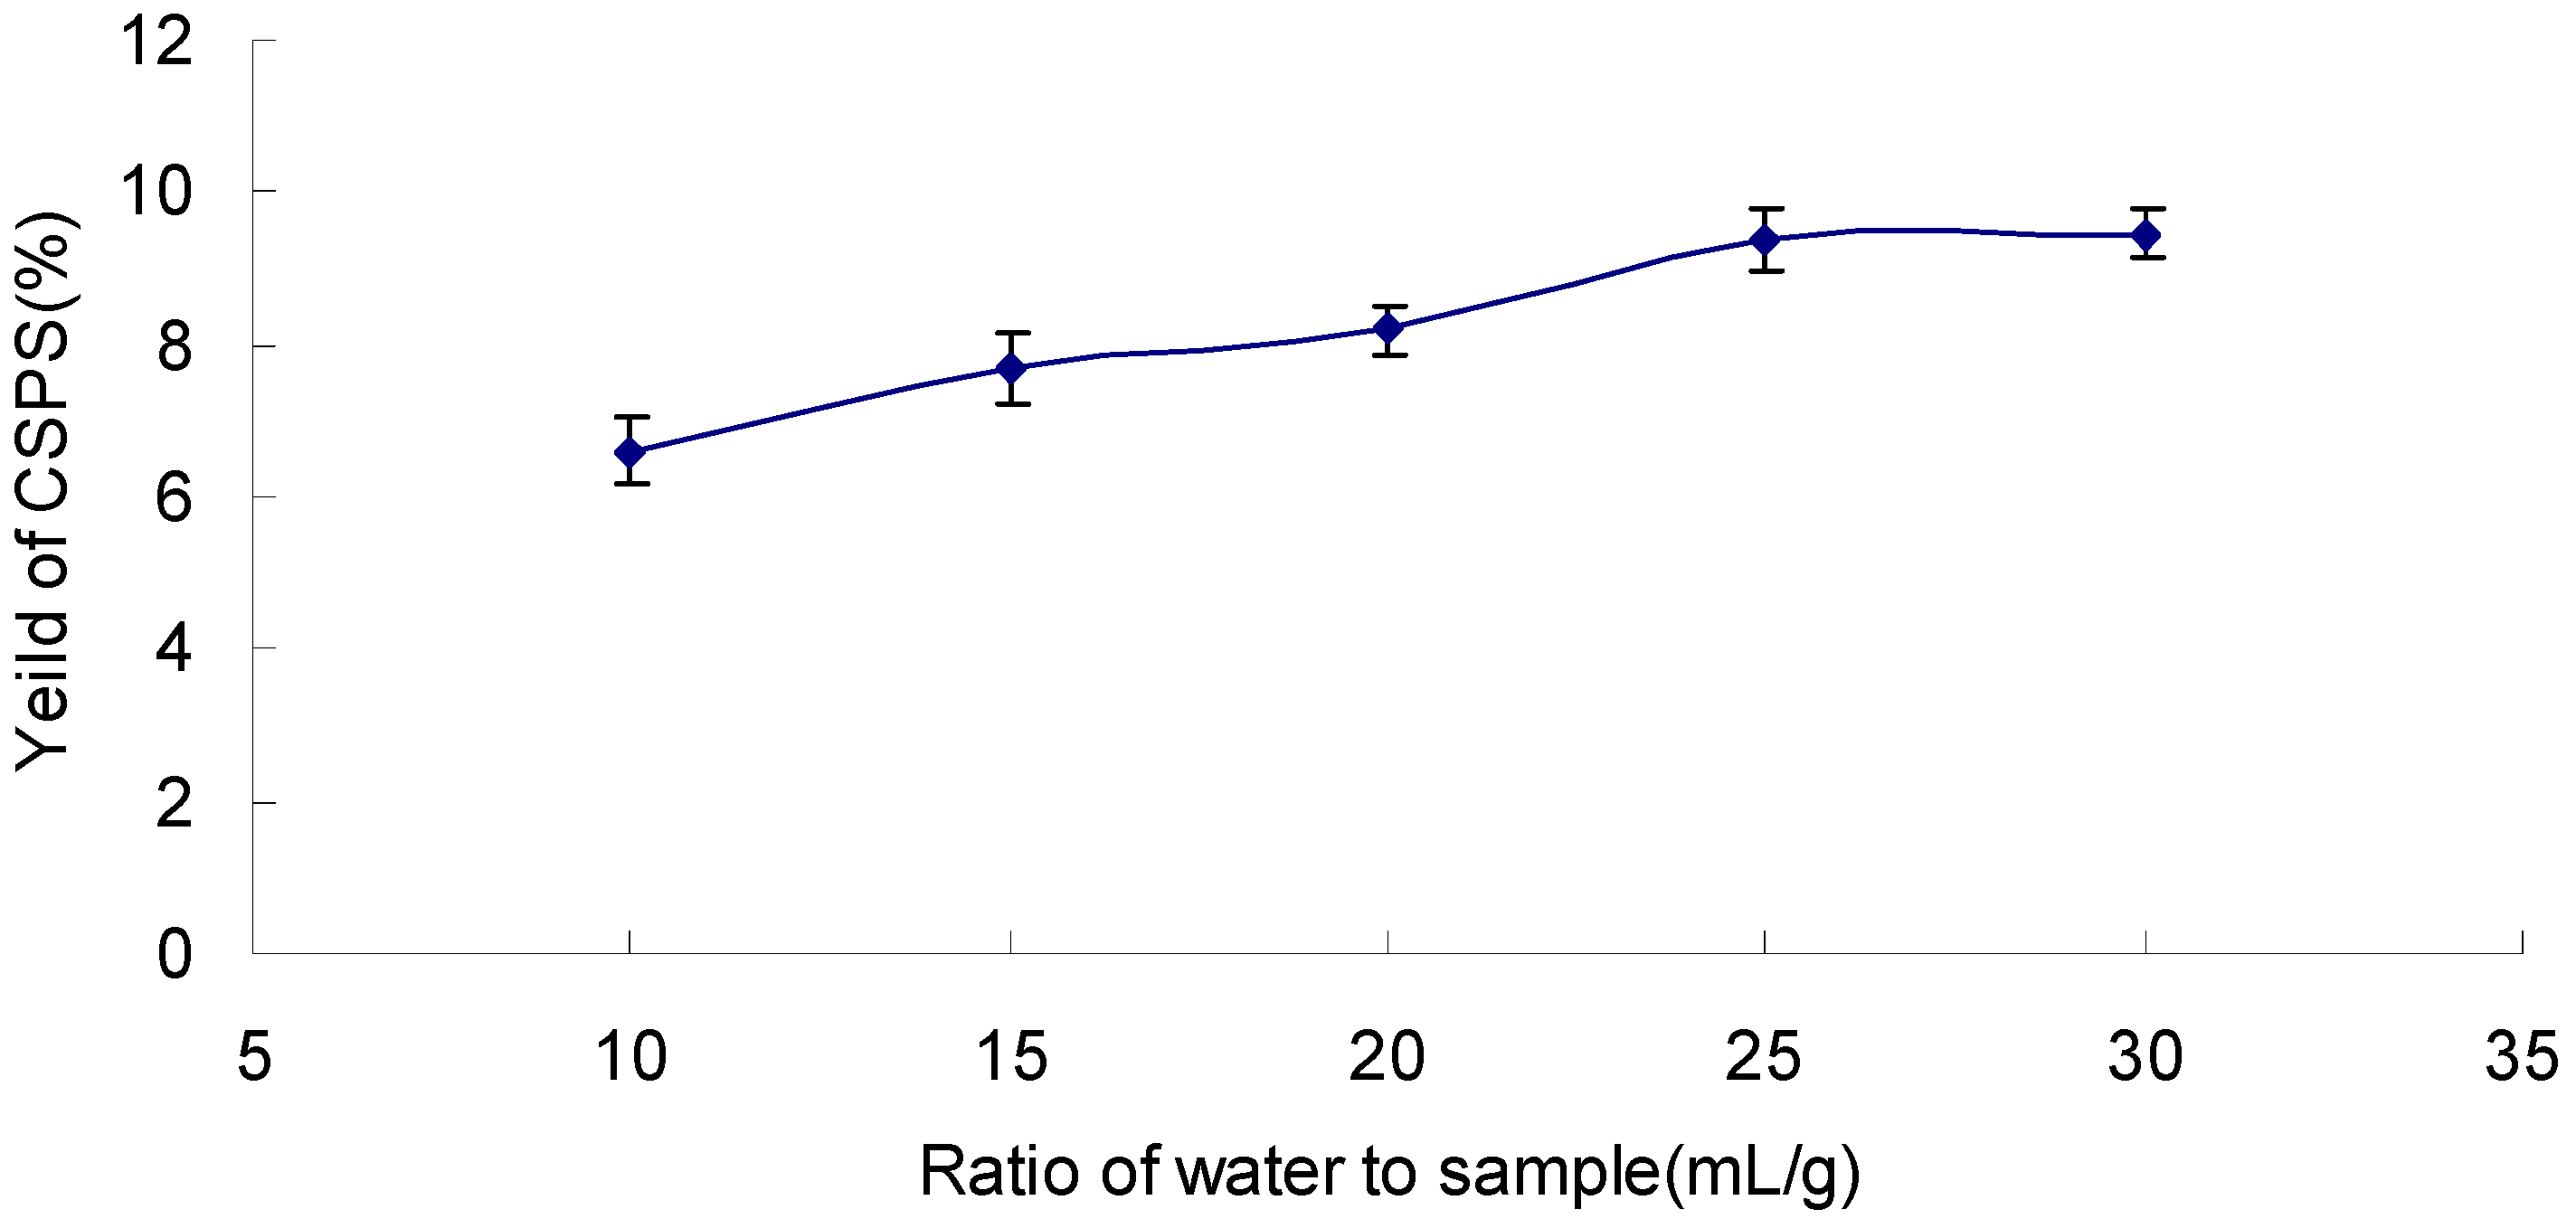
2.3. Effect of Ratio of Water to Sample on the Yield of CSPS
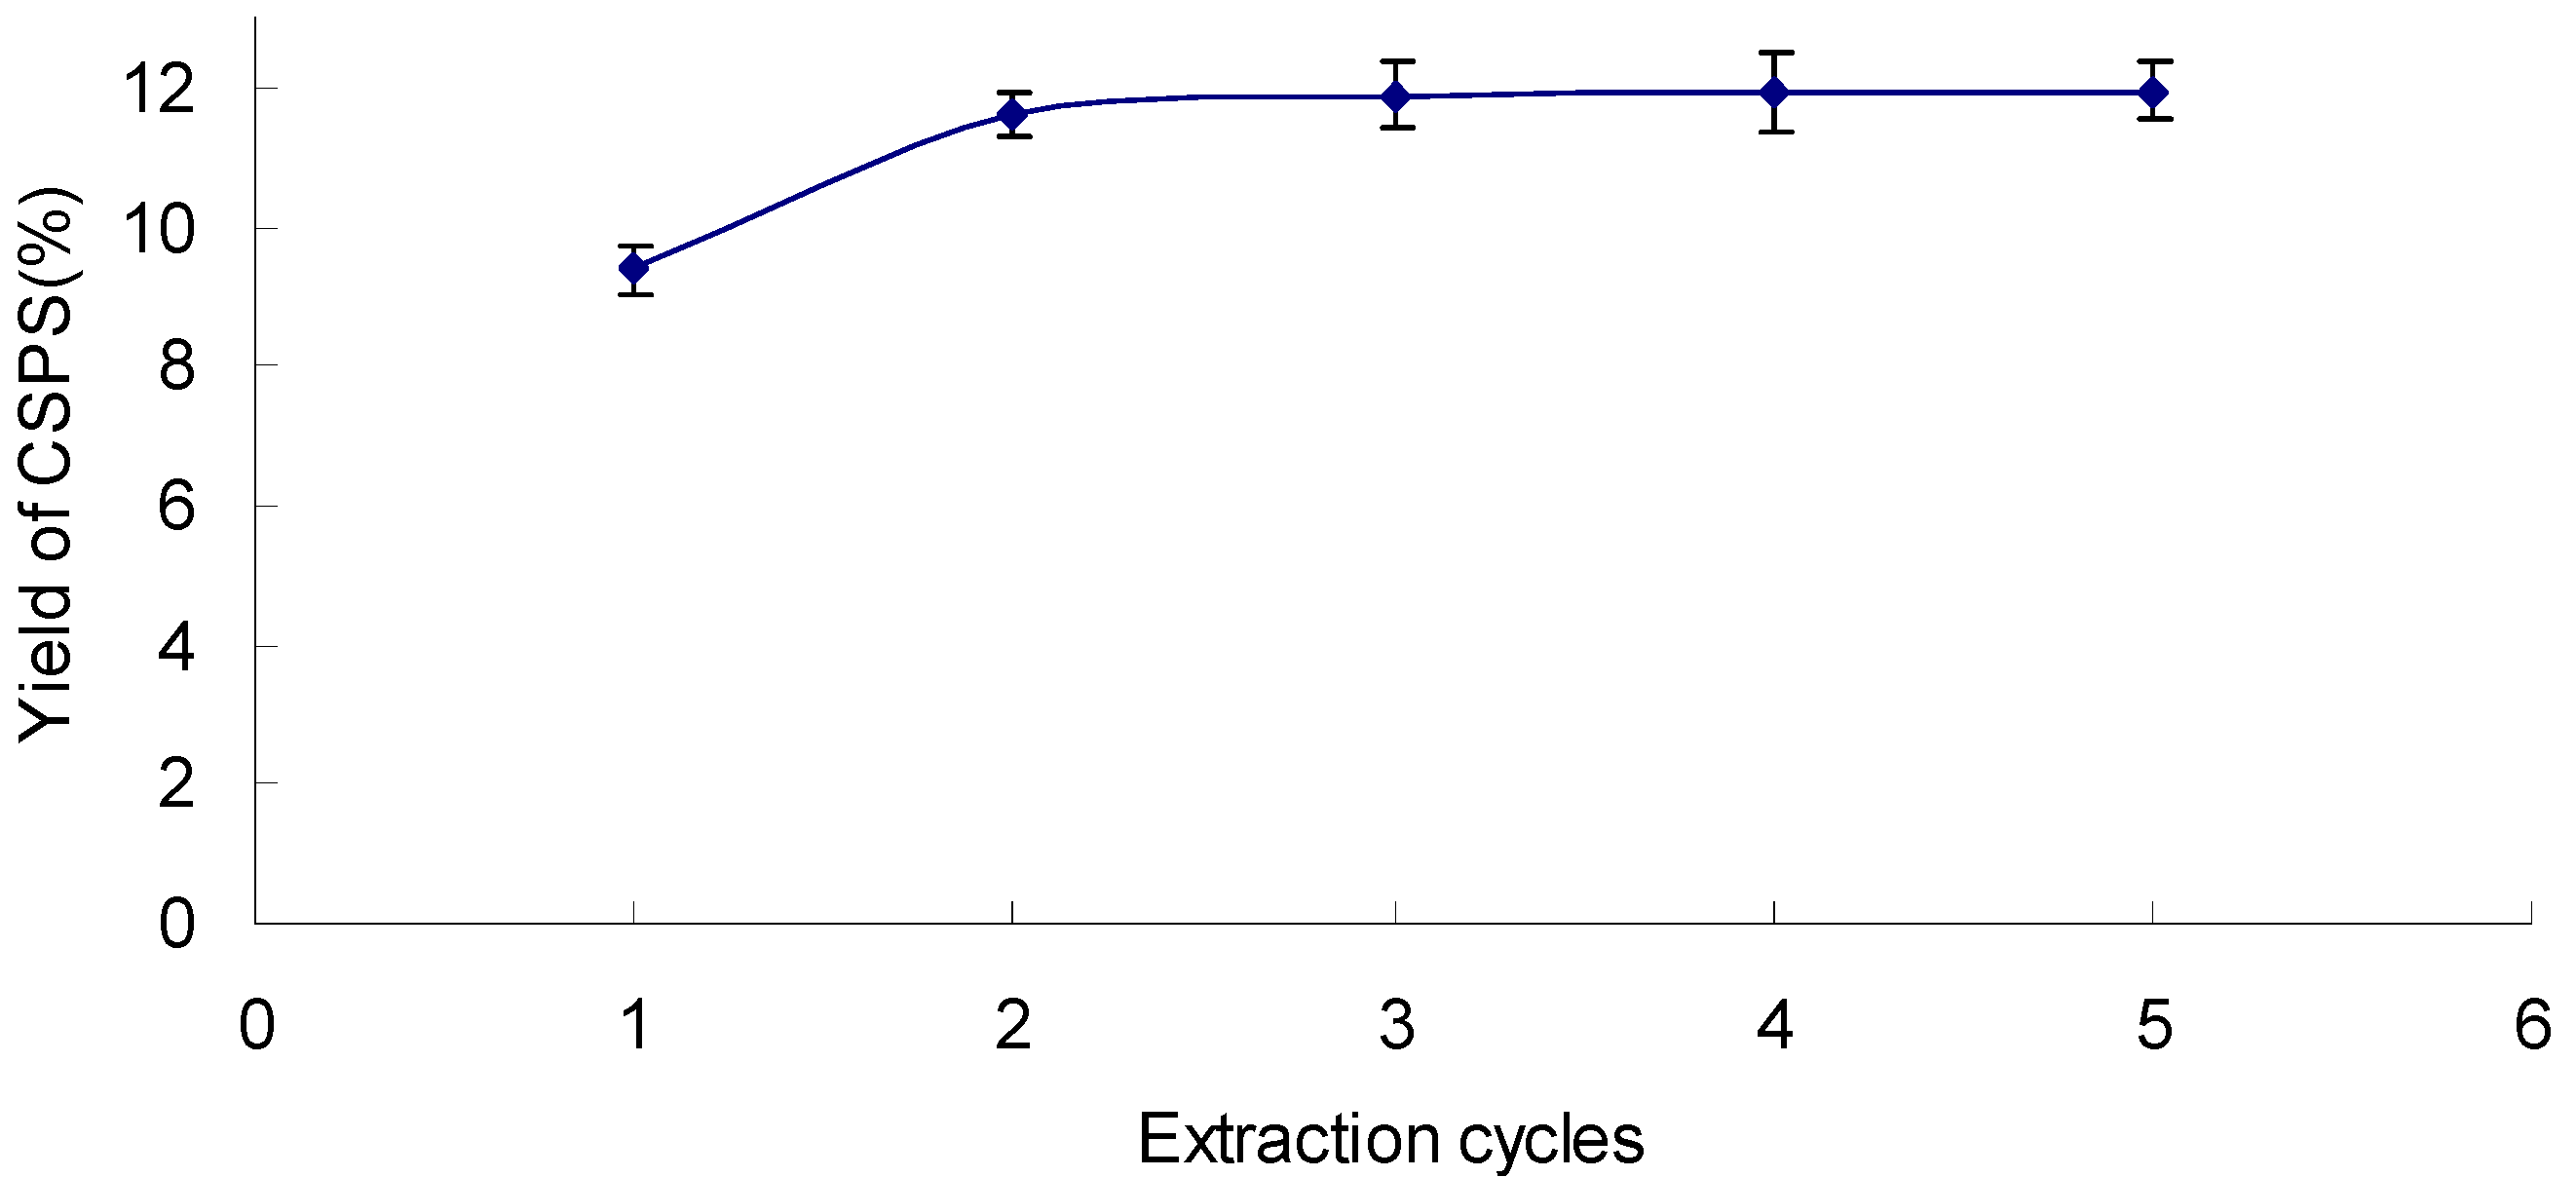
As seen from
Figure 3, the yield of CSPS reached the critical value 9.8 at the ratio of 25 mL/g, and then started to maintain a dynamic equilibrium. Therefore, the range of water to sample ratios of 20~30 mL/g was used in the present work.
Figure 3.
Effect of ratio of water to sample on the yield of CSPS under extraction temperature 90 °C, extraction time120 min, and extraction cycle 1.
Figure 3.
Effect of ratio of water to sample on the yield of CSPS under extraction temperature 90 °C, extraction time120 min, and extraction cycle 1.
2.5. Results of the Yield of CSPS of Optimization of the Procedure
The twenty nine experimental points for optimizing the four individual parameters in the BBD were shown in
Table 1. Five replicates (exp. No. 25~29) at the center of the design were used to allow for estimation of a pure error sum of squares. The response value in each trial was the average of triplicates.
Table 1.
Box-Behnken design matrix of four variables and the experimental observed responses.
Table 1.
Box-Behnken design matrix of four variables and the experimental observed responses.
| No. | X1/Extraction temperature (°C) | X2/Extraction time (min) | X3/Ratio of water to sample (mL/g) | X4/Extraction cycles | Yield of CSPS (%) |
|---|
| 1 | −1(80) | −1(90) | 0(25) | 0(2) | 9.028 |
| 2 | 1(100) | −1(90) | 0(25) | 0(2) | 11.584 |
| 3 | −1(80) | 1(150) | 0(25) | 0(2) | 11.370 |
| 4 | 1(100) | 1(150) | 0(25) | 0(2) | 11.458 |
| 5 | 0(90) | 0(120) | −1(20) | −1(1) | 8.206 |
| 6 | 0(90) | 0(120) | 1(30) | −1(1) | 9.466 |
| 7 | 0(90) | 0(120) | −1(20) | 1(3) | 10.962 |
| 8 | 0(90) | 0(120) | 1(30) | 1(3) | 12.190 |
| 9 | −1(80) | 0(120) | 0(25) | −1(1) | 7.052 |
| 10 | 1(100) | 0(120) | 0(25) | −1(1) | 9.150 |
| 11 | −1(80) | 0(120) | 0(25) | 1(3) | 10.214 |
| 12 | 1(100) | 0(120) | 0(25) | 1(3) | 11.792 |
| 13 | 0(90) | −1(90) | −1(20) | 0(2) | 8.566 |
| 14 | 0(90) | 1(150) | −1(20) | 0(2) | 10.826 |
| 15 | 0(90) | −1(90) | 1(30) | 0(2) | 10.250 |
| 16 | 0(90) | 1(150) | 1(30) | 0(2) | 11.090 |
| 17 | 0(80) | 0(120) | −1(20) | 0(2) | 9.722 |
| 18 | 1(100) | 0(120) | −1(20) | 0(2) | 10.968 |
| 19 | −1(80) | 0(120) | 1(30) | 0(2) | 10.202 |
| 20 | 1(100) | 0(120) | 1(30) | 0(2) | 11.560 |
| 21 | 0(90) | −1(90) | 0(25) | −1(1) | 8.426 |
| 22 | 0(90) | 1(150) | 0(25) | −1(1) | 8.568 |
| 23 | 0(90) | −1(90) | 0(25) | 1(3) | 11.002 |
| 24 | 0(90) | 1(150) | 0(25) | 1(3) | 12.49 |
| 25 | 0(90) | 0(120) | 0(25) | 0(2) | 11.702 |
| 26 | 0(90) | 0(120) | 0(25) | 0(2) | 11.547 |
| 27 | 0(90) | 0(120) | 0(25) | 0(2) | 11.626 |
| 28 | 0(90) | 0(120) | 0(25) | 0(2) | 11.315 |
| 29 | 0(90) | 0(120) | 0(25) | 0(2) | 11.918 |
2.6. Model Fitting and Statistical Significance Analysis
By applying multiple regression analysis on the experimental data, the response variable and the test variables were related by the following second-order polynomial equation:
The determination coefficient (R
2 = 0.9460) is shown in
Table 2, indicating that the model could explain 94.60% of the response value changes and only 5.40% of the total variations was not explained by the model. At the same time, a low value 0.0439 of coefficient of the variation (C.V.) indicated a high degree of precision and a good deal of reliability of the experimental value. This meant that the model could be used to analyze and predict polysaccharide extraction process results.
Table 2.
Test result of significance for regression coefficients.
Table 2.
Test result of significance for regression coefficients.
| Parameter | Estimate | df | Standard error | 95%CI | F-value | p-value |
|---|
| Low | High |
|---|
| intercept | 11.62 | 1 | 0.21 | 11.18 | 12.06 | | |
| X1 | 0.74 | 1 | 0.13 | 0.46 | 1.03 | 31.35 | <0.0001 |
| X2 | 0.58 | 1 | 0.13 | 0.29 | 0.86 | 19.00 | 0.0007 |
| X3 | 0.46 | 1 | 0.13 | 0.17 | 0.74 | 11.94 | 0.0039 |
| X4 | 1.84 | 1 | 0.13 | 1.20 | 1.77 | 124.09 | <0.0001 |
| X1X2 | −0.62 | 1 | 0.23 | −1.11 | −0.12 | 7.91 | 0.0179 |
| X1X3 | 0.028 | 1 | 0.23 | −0.47 | 0.52 | 0.015 | 0.9048 |
| X1X4 | −0.13 | 1 | 0.23 | −0.62 | 0.36 | 0.32 | 0.5809 |
| X2X3 | −0.35 | 1 | 0.23 | −0.85 | 0.14 | 2.83 | 0.1451 |
| X2X4 | 0.34 | 1 | 0.23 | −0.16 | 0.83 | 2.14 | 0.1656 |
| X3X4 | −0.008 | 1 | 0.23 | −0.50 | 0.49 | 0.005 | 0.9727 |
| X1X1 | −0.55 | 1 | 0.18 | −0.94 | −0.17 | 9.41 | 0.0083 |
| intercept | 11.62 | 1 | 0.21 | 11.18 | 12.06 | | |
| X2X2 | −0.48 | 1 | 0.18 | −0.87 | −0.097 | 7.19 | 0.0179 |
| X3X3 | −0.57 | 1 | 0.18 | −0.95 | −0.18 | 9.81 | 0.0074 |
| X4X4 | −1.13 | 1 | 0.18 | −1.51 | −0.74 | 38.92 | <0.0001 |
The
p-value is used as an important tool to check the significance of each coefficient, which in turn may indicate the pattern of the interactions between the variables. The smaller the value of the
p-value, the more significant the corresponding coefficient was. As seen from
Table 2, the linear coefficients (X
1, X
2, X
3, X
4), cross product coefficient (X
1X
2) and quadratic coefficients (X
12, X
22, X
32, X
42) of the model were significant, with a very small
p-value (
p < 0.05). The other term coefficients were not significant (
p > 0.05).At the same time,
F-value and
p-value (
F = 17.53,
p < 0.0001) of the model, which are shown in
Table 3, indicated that the regression model was very significant. Lack of fit (
F = 5.71,
p > 0.05) was not significant.
Table 3.
Analysis of variance for fitted quadratic polynomial model.
Table 3.
Analysis of variance for fitted quadratic polynomial model.
| Source | Sum of squares | df | Mean square | F-value | p-value | |
|---|
| Model | 51.94 | 14 | 3.71 | 17.53 | <0.0001 | significant |
| Residual | 2.96 | 14 | 0.21 | | | |
| Lack of fit | 2.77 | 10 | 0.28 | 5.71 | 0.0583 | |
| Pure error | 0.19 | 4 | 0.048 | | | |
| Cor total | 54.90 | 28 | | | | |
2.8. Verification of Predictive Model
It is desirable to test the accuracy and reliability of the model equation for predicting an optimum response. Taking fully into account the actual operating convenience, the confirmatory experimental verification was tested under the conditions: extraction temperature 92 °C, extraction time 140 min, the ratio of water to sample 26 mL/g, and extraction cycles 3. A mean value of (13.01 ± 0.08) % (n = 3) was obtained from the confirmatory experiment. The difference between the real value and the predicted value was not significant (
p > 0.05). It indicated that the model was adequate for the extraction process (
Table 4).
Table 4.
Predicted and experimental values of the responses at optimum conditions.
Table 4.
Predicted and experimental values of the responses at optimum conditions.
| | Extraction temperature (°C) | Extraction time (min) | Ratio of water to sample (mL/g) | Extraction cycles | Yield of CSPS (%) |
|---|
| Predicted optimum condition | 92.46 | 138 | 26.06 | 2.74 | 12.94 |
| Experimental optimum condition | 92 | 140 | 26 | 3 | 13.01 ± 0.08 *a |
2.9. Anti-Tumor Activity of CSPS in Vivo
Life prolonging experiments are used to detect whether a sample has anti-tumor activity [
23,
24]. The size of the values reflect the strength of any anti-tumor activity. As seen from
Table 5, the survival times of the CSPS groups were prolonged significantly in a dose-dependent manner and the rate of life prolongation of the mid-dose CSPS group was better than that of the positive group for the same dosing. The difference of survival time in mice between the low-dose CSPS group and control group was significant (
p < 0.05). The survival time in control group mice was significantly extremely lower than that of the mid-dose CSPS group (
p < 0.01,
Table 5), and the same happened between the control and high-dose CSPS groups. The results showed that CSPS had
in vivo anti-tumor activity by prolonging the survival time of H
22 bearing mice.
Table 5.
Effects of CSPS on survival time of tumor H22 bearing mice.
Table 5.
Effects of CSPS on survival time of tumor H22 bearing mice.
| Groups | Number | Dose (mg/kg) | Survival time (d) | Prolonging rate (%) |
|---|
| Control | 12 | Normal saline | 10.24 ± 2.97 | - |
| Low-CSPS | 12 | 50 | 12.66 ± 2.53 * | 23.63 |
| Mid-CSPS | 12 | 100 | 15.48 ± 3.15 ** | 51.17 |
| High-CSPS | 12 | 200 | 16.72 ± 2.31 ** | 63.28 |
| APS | 12 | 100 | 14.89 ± 2.35 ** | 45.41 |
3. Experimental
3.1. Materials
The fruit of Capparis spionosa L. was purchased from Xinjiang Wanbang Biotechnology Co. Ltd. (Urumqi, China) Ethanol, dehydrated alcohol, acetone and benzine (analytical grade) were purchased from Tianjin FuChen Chemical Reagent Factory (Tianjin, China). Normal saline was purchased from Harbin Triple Pharmaceutical Co., Ltd. (Harbin, China). Astragalus polysaccharide (APS) was obtained from the Institute of Pharmacology, Harbin University of Commerce (Harbin, China).
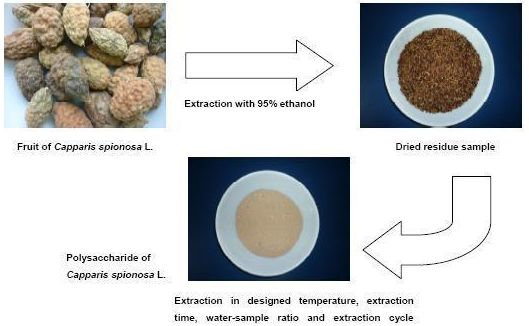
3.2. Extraction and Yield of CSPS
The dried fruit of Capparis spionosa L. (2,500 g) was ground in a blender to obtain a fine powder. The powder was extracted with 95% ethanol (5,000 mL, ×3 cycles) at 90 °C for 3 h, and filtered through nylon cloth (pore diameter 38 μm). The residue was dried under reduced pressure. Each dried residue sample (10 g) was extracted by a water bath under a set of designed temperature, extraction time, water-sample ratio and extraction cycle conditions. The extraction solution was separated from insoluble residue by centrifugation (4,000 × g for 5 min, at 20 °C), and then precipitated by dehydrated alcohol to a final concentration of 80% (v/v). The precipitate (CSPS) collected by centrifuge (4,000 × g for 10 min, at 20 °C) was washed with dehydrated alcohol, acetone and benzine, and vacuum dried. The yield of CSPS was calculated according to the following equation:
3.3. Optimization Design
On the basis of single-factor experiments for the polysaccharide production, suitable ranges of extraction temperature, extraction time, ratio of water to sample, extraction cycles were preliminarily determined. A BBD with four independent variables (X
1, extraction temperature; X
2, extraction time; X
3, ratio of water to sample; X
4, extraction cycles) at three levels was performed. The range of independent variables and their levels is shown in
Table 6. The yield of CSPS was the dependent variable.
Table 6.
Independent variables and their levels used in the response surface design.
Table 6.
Independent variables and their levels used in the response surface design.
| Independent variables | | Factor level | |
|---|
| −1 | 0 | 1 |
|---|
| X1 extraction temperature (°C) | 80 | 90 | 100 |
| X2 extraction time (min) | 90 | 120 | 150 |
| X3 ratio of water to sample (mL/g) | 20 | 25 | 30 |
| X4 extraction cycles | 1 | 2 | 3 |
3.4. In Vivo Life Prolonging Experiments
Experimental animal models: Kun ming mice were transplanted ascites tumor H22 0.2 mL (4 × 10⁶ cells/mL) in the abdominal cavity.
Groups: The weighed mice after inoculation were randomly divided into six groups (n = 12), half male and half female. Control group: Mice were treated with normal saline [100 mg/(kg·d)]. Positive group: mice were treated with Astragalus polysaccharide (APS) at a dosage of 100 mg/(kg·d). CSPS groups: Mice of low, middle, high-dose groups were treated with CSPS at a dosage of 50, 100, 200 mg/(kg·d), respectively.
After 24 h of inoculation, the mice bearing tumor H22 were treated in gavage (i.g.) according to the above groups for 7 days. Then, the survival time of mice was recorded. The extension rate was calculated by the following formula:
3.5. Statistical Analysis
Design-Expert (Version 7.0) software was used to analyze the experimental data. Statistical comparison within groups was carried out by one way ANOVA. A p-value of less than 0.05 was considered to be significant statistically. All determinations were carried out in triplicate.
4. Conclusions
In this paper, the extraction conditions for CSPS were optimized by BBD, and a quadratic polynomial model was obtained from RMS. The confirmatory experimental optimum conditions of CSPS were as follows: extraction temperature 92 °C, extraction time 140 min, the ratio of water to sample 26 mL/g, and extraction cycles 3. The optimal yield of (13.01 ± 0.09) % which was obtained from confirmatory experiments closely matched the predicted yield of 12.94%. Additionally, CSPS could prolong the survival time of H22 bearing mice in a dose-dependent manner.
Simultaneously, our previous research has indicated that CSPS could inhibit the proliferation of human hepatoma HepG2 cells (IC
50 = 471.53 μg/mL) and induce HepG2 cells to apoptosis
in vitro. Under the laser scanning confocal microscope, we observed that the cytoplasm was leaked from un-intact HepG2 cells and the cells stained with AO/EB were disrupted to pieces in mid-CSPS and high-CSPS group [
25]. This data, combined with that of the present experiments, shows that CSPS has potential anti-tumor capacity. Further research on the chemical structure and anti-tumor mechanism of CSPS will be carried out in the future.
Acknowledgments
This work was supported financially by National Natural Science Foundation, China (30902013) and Natural Science Foundation for Young Scientists of Heilongjiang Province, China (QC2010020).
Conflict of Interest
The authors declare no conflict of interest.
References
- Wang, C.; Chen, Y.; Hu, M.; Ding, J.; Xu, C.; Wang, R. In vitro antioxidant activities of the polysaccharides from Tricholoma lobayense. Int. J. Biol. Macromol. 2012, 50, 534–539. [Google Scholar] [CrossRef]
- Kong, F.; Zhang, M.; Liao, S.; Yu, S.; Chi, J.; Wei, Z. Antioxidant activity of polysaccharide-enriched fractions extracted from pulp tissue of Litchi Chinensis Sonn. Molecules 2010, 15, 2152–2165. [Google Scholar] [CrossRef]
- Liu, Z.F.; Dong, F.; Ji, Y.B.; Miao, J.; Jin, L.N. A study on process of pharmacology of selenium polysaccharide. J. Beijing Union Univ. 2011, 25, 36–40. [Google Scholar]
- Tincer, G.; Yerlikaya, S.; Yagci, F.C.; Kahraman, T.; Atanur, O.M.; Erbatur, O.; Gursel, I. Immunostimulatory activity of polysaccharide-poly(I:C) nanoparticles. Biomaterials 2011, 32, 4275–4282. [Google Scholar] [CrossRef]
- Yi, Y.; Liao, S.T.; Zhang, M.W.; Shi, J.; Zhang, R.F.; Deng, Y.Y.; Wei, Z.C. Physicochemical characteristics and immunomodulatory activities of three polysaccharide-protein complexes of longan pulp. Molecules 2011, 16, 6148–6164. [Google Scholar] [CrossRef]
- Men, X.Y.; Wang, Y.F.; Zheng, W.J.; Zhu, Y.M.; Zhang, M.Y.; Jiang, X. The synthesis of selenium nanoparticles with polysaccharides from Undaria Pinnatifida (Charv.) Suringer and its antivirus effects on CVB3 in vitro. Chin. J. Health Lab. Technol. 2005, 15, 1153–1155. [Google Scholar]
- Li, R.Y.; Gao, J.P. Primary study of pharmacological action in vivo with abdominal cavity S180 tumor bearing mice of the radix codonopsis coarse polysaccharides. J. Changzhi Med. Coll. 2011, 2, 94–96. [Google Scholar]
- Lan, M.B.; Guo, J.; Zhao, H.L.; Yuan, H.H. Antioxidant and anti-tumor activities of purified polysaccharides with low molecular weights from Magnolia officinalis. J. Med. Plan. Res. 2012, 6, 1025–1034. [Google Scholar]
- Tang, Y.L.; Luo, Q.; Ding, W.; Ding, X.; Yang, Z.R. Anti-tumor activity of polysaccharides extracted from two wild amanitas. J. Sichuan Univ. 2011, 42, 792–796. [Google Scholar]
- Ye, C.L.; Hu, W.L.; Dai, D.H. Extraction of polysaccharides and the antioxidant activity from the seeds of Plantago asiatica L. Int. J. Biol. Macromol. 2011, 49, 466–470. [Google Scholar] [CrossRef]
- Rhizopoulou, S.; Psaras, G.K. Development and Structure of Drought-tolerant Leaves of the Mediterranean Shrub Capparis spinosa L. Ann. Bot. 2003, 92, 377–383. [Google Scholar] [CrossRef]
- Adel, M. Screening of some indigenous qatari medicinal plants for antimicrobial activity. Phytother. Res. 2002, 16, 751–753. [Google Scholar] [CrossRef]
- Angelo, D.; Catania, S. Evaluation of extracts and isolated fraction from Capparis spinosa L. buds as an antioxidant source. J. Agric. Food Chem. 2002, 50, 1168–1171. [Google Scholar] [CrossRef]
- Gadgoli, C.; Mishra, S.H. Antihepatotoxic activity of p-methoxy benzoic acid from Capparis spinosa. J. Ethnopharmacol. 1999, 66, 187–192. [Google Scholar] [CrossRef]
- Jacobson, R.L.; Schlein, Y. Phlebotomus papatasi and Leishmania major parasites express alpha-amylase and alpha-glucosidase. Acta Trop. 2001, 78, 41–49. [Google Scholar] [CrossRef]
- Ji, Y.B.; Guo, S.D.; Ji, C.F. Progress of study on Capparis spinosa L. J. Harbin Univ. Commerce 2006, 22, 5–10. [Google Scholar]
- Liu, J.C.; Miao, S.; Wen, X.C.; Sun, Y.X. Optimization of polysaccharides (ABP) extraction from the fruiting bodies of Agaricus blazei Murill. using response surface methodology (RSM). Carbohydr. Polym. 2009, 78, 704–709. [Google Scholar] [CrossRef]
- Varnalis, A.I.; Brennan, J.G.; MacDougall, D.B.; Gilmour, S.G. Optimisation of high temperature puffing potato cubes using response surface methodology. J. Food Eng. 2004, 61, 153–163. [Google Scholar] [CrossRef]
- Muralidhar, R.V.; Chirumamil, R.R.; Marchant, R.; Nigam, P. A response surface approach for the comparison of lipase production by Candida cylindracea using two different carbon sources. Biochem. Eng. 2001, 9, 17–23. [Google Scholar] [CrossRef]
- Sun, Y.X.; Liu, J.C.; Kennedyb, J.F. Extraction optimization of antioxidant polysaccharides from the fruiting bodies of Chroogomphis rutilus (Schaeff.: Fr.) O.K. Miller by Box-Behnken statistical design. Carbohydr. Polym. 2010, 82, 209–214. [Google Scholar] [CrossRef]
- Wang, Y.X.; Lv, F.X.; Lu, Z.X. Optimization of cultivation conditions for exopolysaccharide and mycelial biomass by Clitocybe sp. using Box-Behnken Design. Sci. Agric. Sin. 2005, 1, 145–150. [Google Scholar]
- Muralidhar, R.V.; Chirumamila, R.R.; Marchant, R. Response surface approach for the comparison of lipase production by Candida cylindracea using two different carbon sources. Biochem. Eng. 2001, 9, 17–23. [Google Scholar] [CrossRef]
- Lu, D.X.; Cui, J.; Liu, Y.X.; Jin, Y.L.; Fan, X.Y. Effects of Schisandrin B combined with cisplatin on the survival time of H22 mice with tumor. Heilongjiang Med. Pharm. 2008, 31, 9–10. [Google Scholar]
- Han, X.; Liu, A.J.; Zhao, X.H.; Li, Y.D.; Zheng, G.Q.; Zha, G.R. Immunizing effects of cocultures of H22 hepatocarcinoma cells and cartilage polysaccharide on murine H22 hepatocarcinoma. J. Food Sci. 2010, 75, 265–273. [Google Scholar] [CrossRef]
- Ji, Y.B.; Dong, F.; Gao, S.Y.; Zou, X. Apoptosis induced by Capparis spionosa polysaccharide in human HepG2. Chin. Tradit. Herb. Drugs 2008, 9, 1364–1367. [Google Scholar]
© 2012 by the authors; licensee MDPI, Basel, Switzerland. This article is an open-access article distributed under the terms and conditions of the Creative Commons Attribution license (http://creativecommons.org/licenses/by/3.0/).


