2.2.Determining the Origin of G. elata and R. glutinosa Using Unsupervised Statistical Analysis
The most popular unsupervised statistical method, PCA, was applied to the metabolomics data obtained from the four analytical methods (
Figure 1). All the data tables were pre-processed with centering and scaling by unit variance, which corrected the variables by calculating the base weight of each variable as 1/standard deviation. R
2X (cum) and Q
2 (cum) values as the validation parameters of statistical models were displayed in
Table 4.
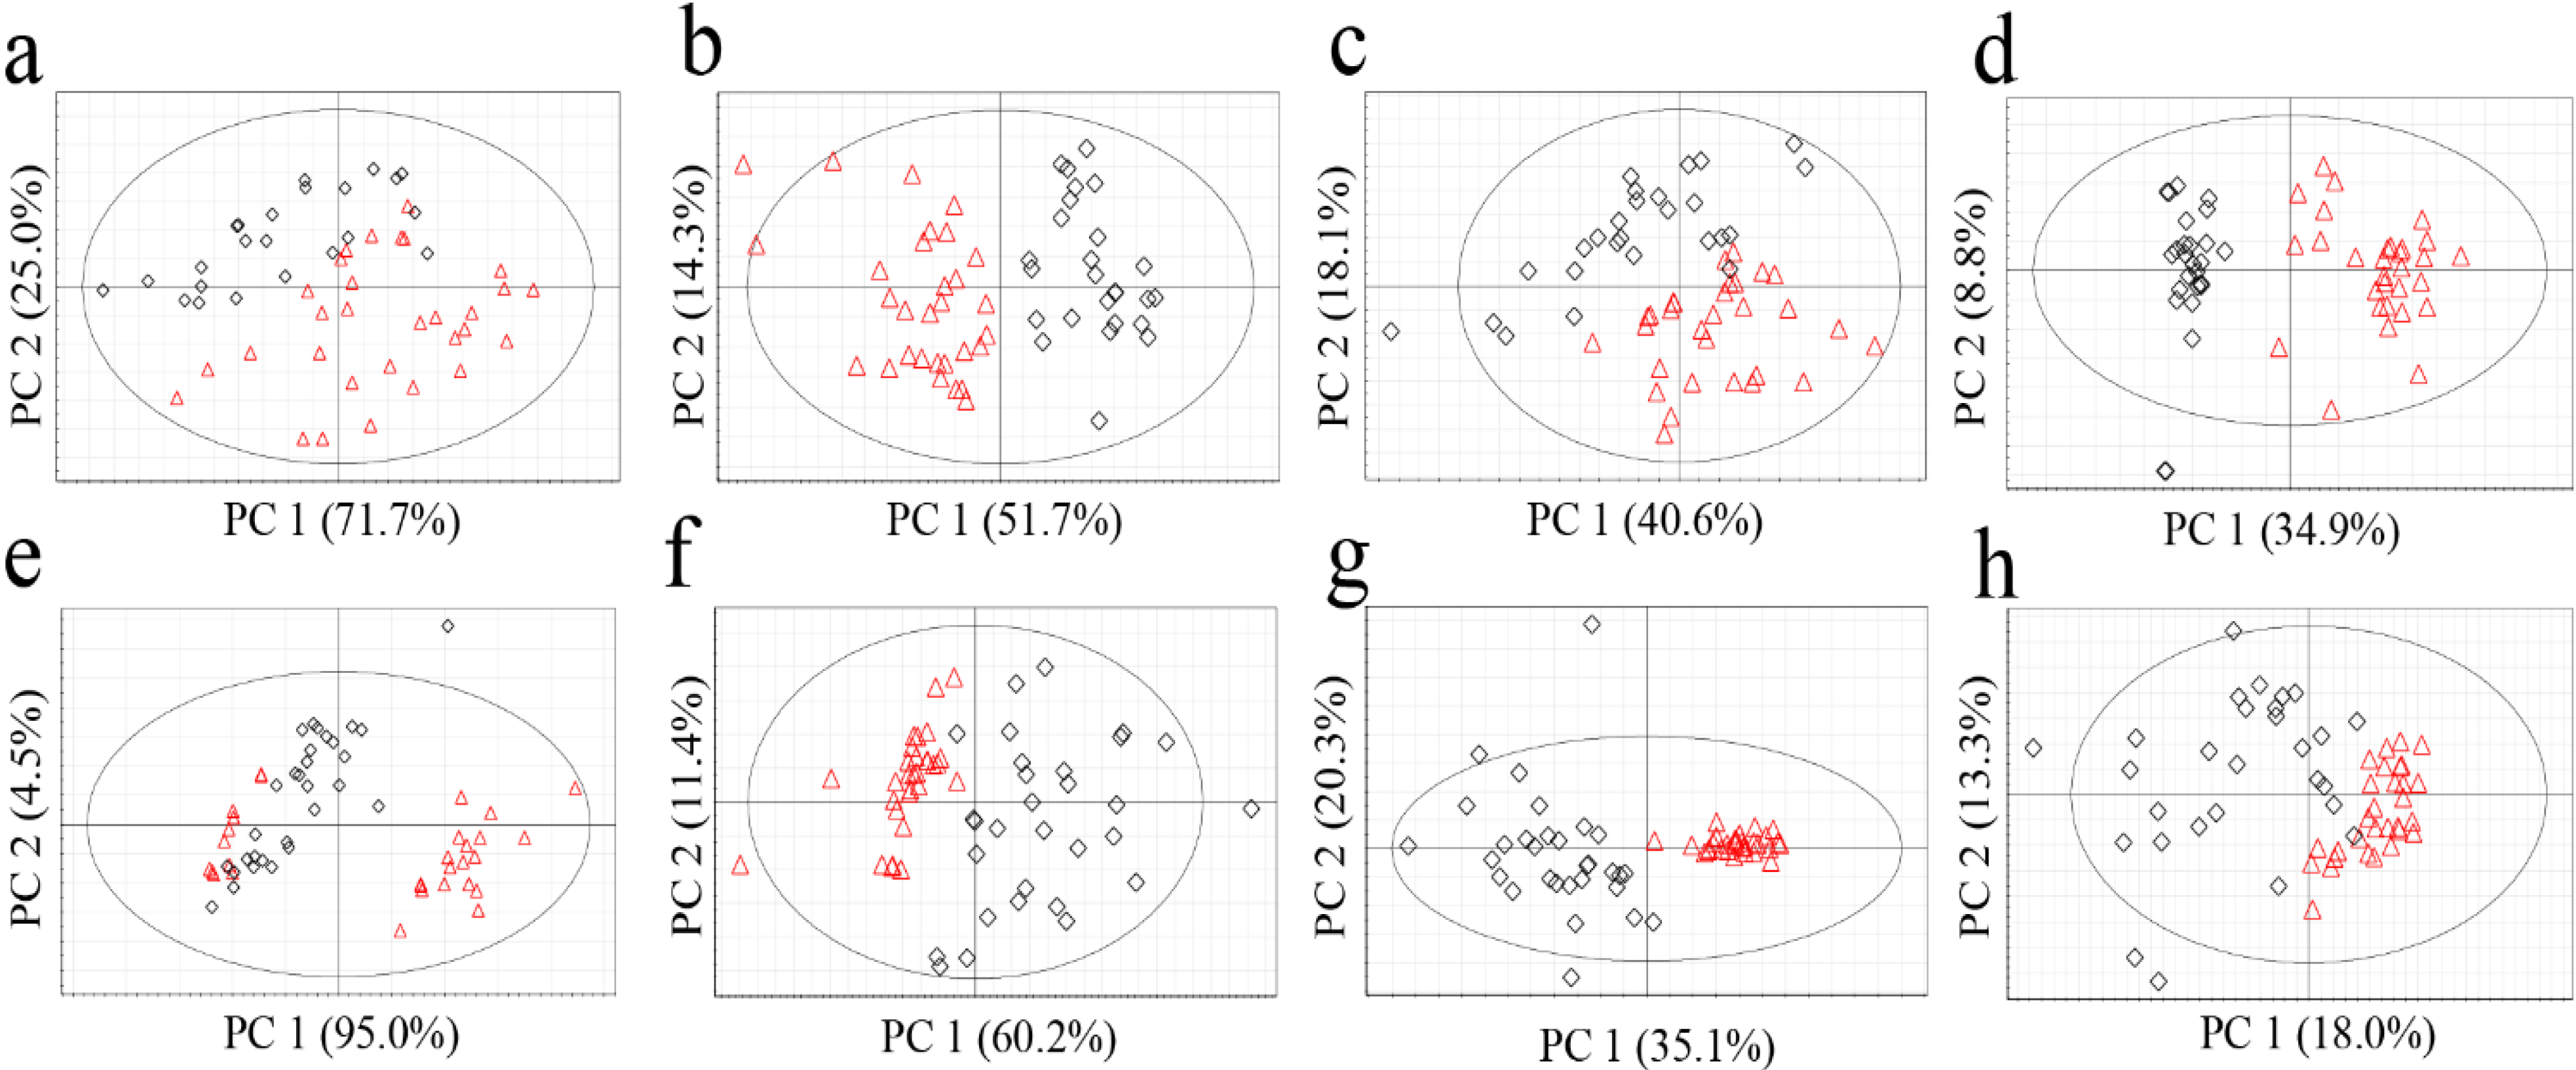
Figure 1.
PCA score plots of G. elata (a, FT-NIR; b, 1H-NMR; c, GC-MS; d, LC-MS) and R. glutinosa (e, FT-NIR; f, 1H-NMR; g, GC-MS; h, LC-MS). Red triangles for Chinese samples; black diamonds for Korean samples.
Figure 1.
PCA score plots of G. elata (a, FT-NIR; b, 1H-NMR; c, GC-MS; d, LC-MS) and R. glutinosa (e, FT-NIR; f, 1H-NMR; g, GC-MS; h, LC-MS). Red triangles for Chinese samples; black diamonds for Korean samples.
Table 4.
Validation of the PCA models.
Table 4.
Validation of the PCA models.
| Plants | Approaches | R2X (cum) | Q2 (cum) |
|---|
| R. glutinosa | FT-NIR | 0.951 | 0.948 |
| 1H-NMR | 0.960 | 0.878 |
| GC-MS | 0.869 | 0.734 |
| LC-MS | 0.661 | 0.380 |
| G. elata | FT-NIR | 0.999 | 0.998 |
| 1H-NMR | 0.887 | 0.812 |
| GC-MS | 0.795 | 0.697 |
| LC-MS | 0.695 | 0.469 |
No clear classification of the origin (Korea or China) could be found from FT-NIR data (
Figure 1a,e). Classification abilities of the statistical models were evaluated as a misclassification rate. The misclassification rate was calculated from the PC1 column plots (
Figure 2), given that PC1 of all the models was the key component sufficient for the origin discrimination in the two plants as in
Figure 1. The resulting misclassification rates for
G. elata were 27% (8/30) and 30% (7/23) for Chinese and Korean samples, respectively. The overall rate was 28% (15/53) (
Figure 2a). The misclassification rates for
R. glutinosa were 37% (11/30) for Chinese and 17% (5/30) for Korean samples, and the overall rate was 27% (16/60) (
Figure 2e). Though FT-NIR has been reported to be useful for discriminating the quality and geographical origin of green tea [
24,
25], its high misclassification rates in our study suggest that analysis using FT-NIR and PCA was not useful for discriminating the origin of the two medicinal plants tested, despite its simplicity and speed.
Figure 2.
PCA column plots and misclassification rates of G. elata (a, FT-NIR; b, 1H-NMR; c, GC-MS; d, LC-MS) and R. glutinosa (e, FT-NIR; f, 1H-NMR; g, GC-MS; h, LC-MS). Red for Chinese samples; black for Korean samples.
Figure 2.
PCA column plots and misclassification rates of G. elata (a, FT-NIR; b, 1H-NMR; c, GC-MS; d, LC-MS) and R. glutinosa (e, FT-NIR; f, 1H-NMR; g, GC-MS; h, LC-MS). Red for Chinese samples; black for Korean samples.
1H-NMR had much lower misclassification rates for both plants than FT-NIR (
Figure 2b,f). For
G. elata, no misclassifications were found, while two misclassifications were found for Korean
R. glutinosa (13%; 4/30), making the overall rate 6.7% (4/60). These results imply that metabolites present at concentrations high enough to be detected by a relatively insensitive technique, such as
1H‑NMR, can be used to authenticate their origins.
In the GC-MS analysis (
Figure 2c,g), the misclassification rates were inconsistent within the two species. That is, the misclassification rates were quite high (China, 37%, 11/30; Korea, 35%, 9/26) for
G. elata, while there was only one misclassification for
R. glutinosa (China, 0.0%, 0/30; Korea, 3.3%, 1/30). The overall misclassification rates from the LC-MS analysis were 1.8% (1/56) for
G. elata and 10% (6/60) for
R. glutinosa (
Figure 2d,h).
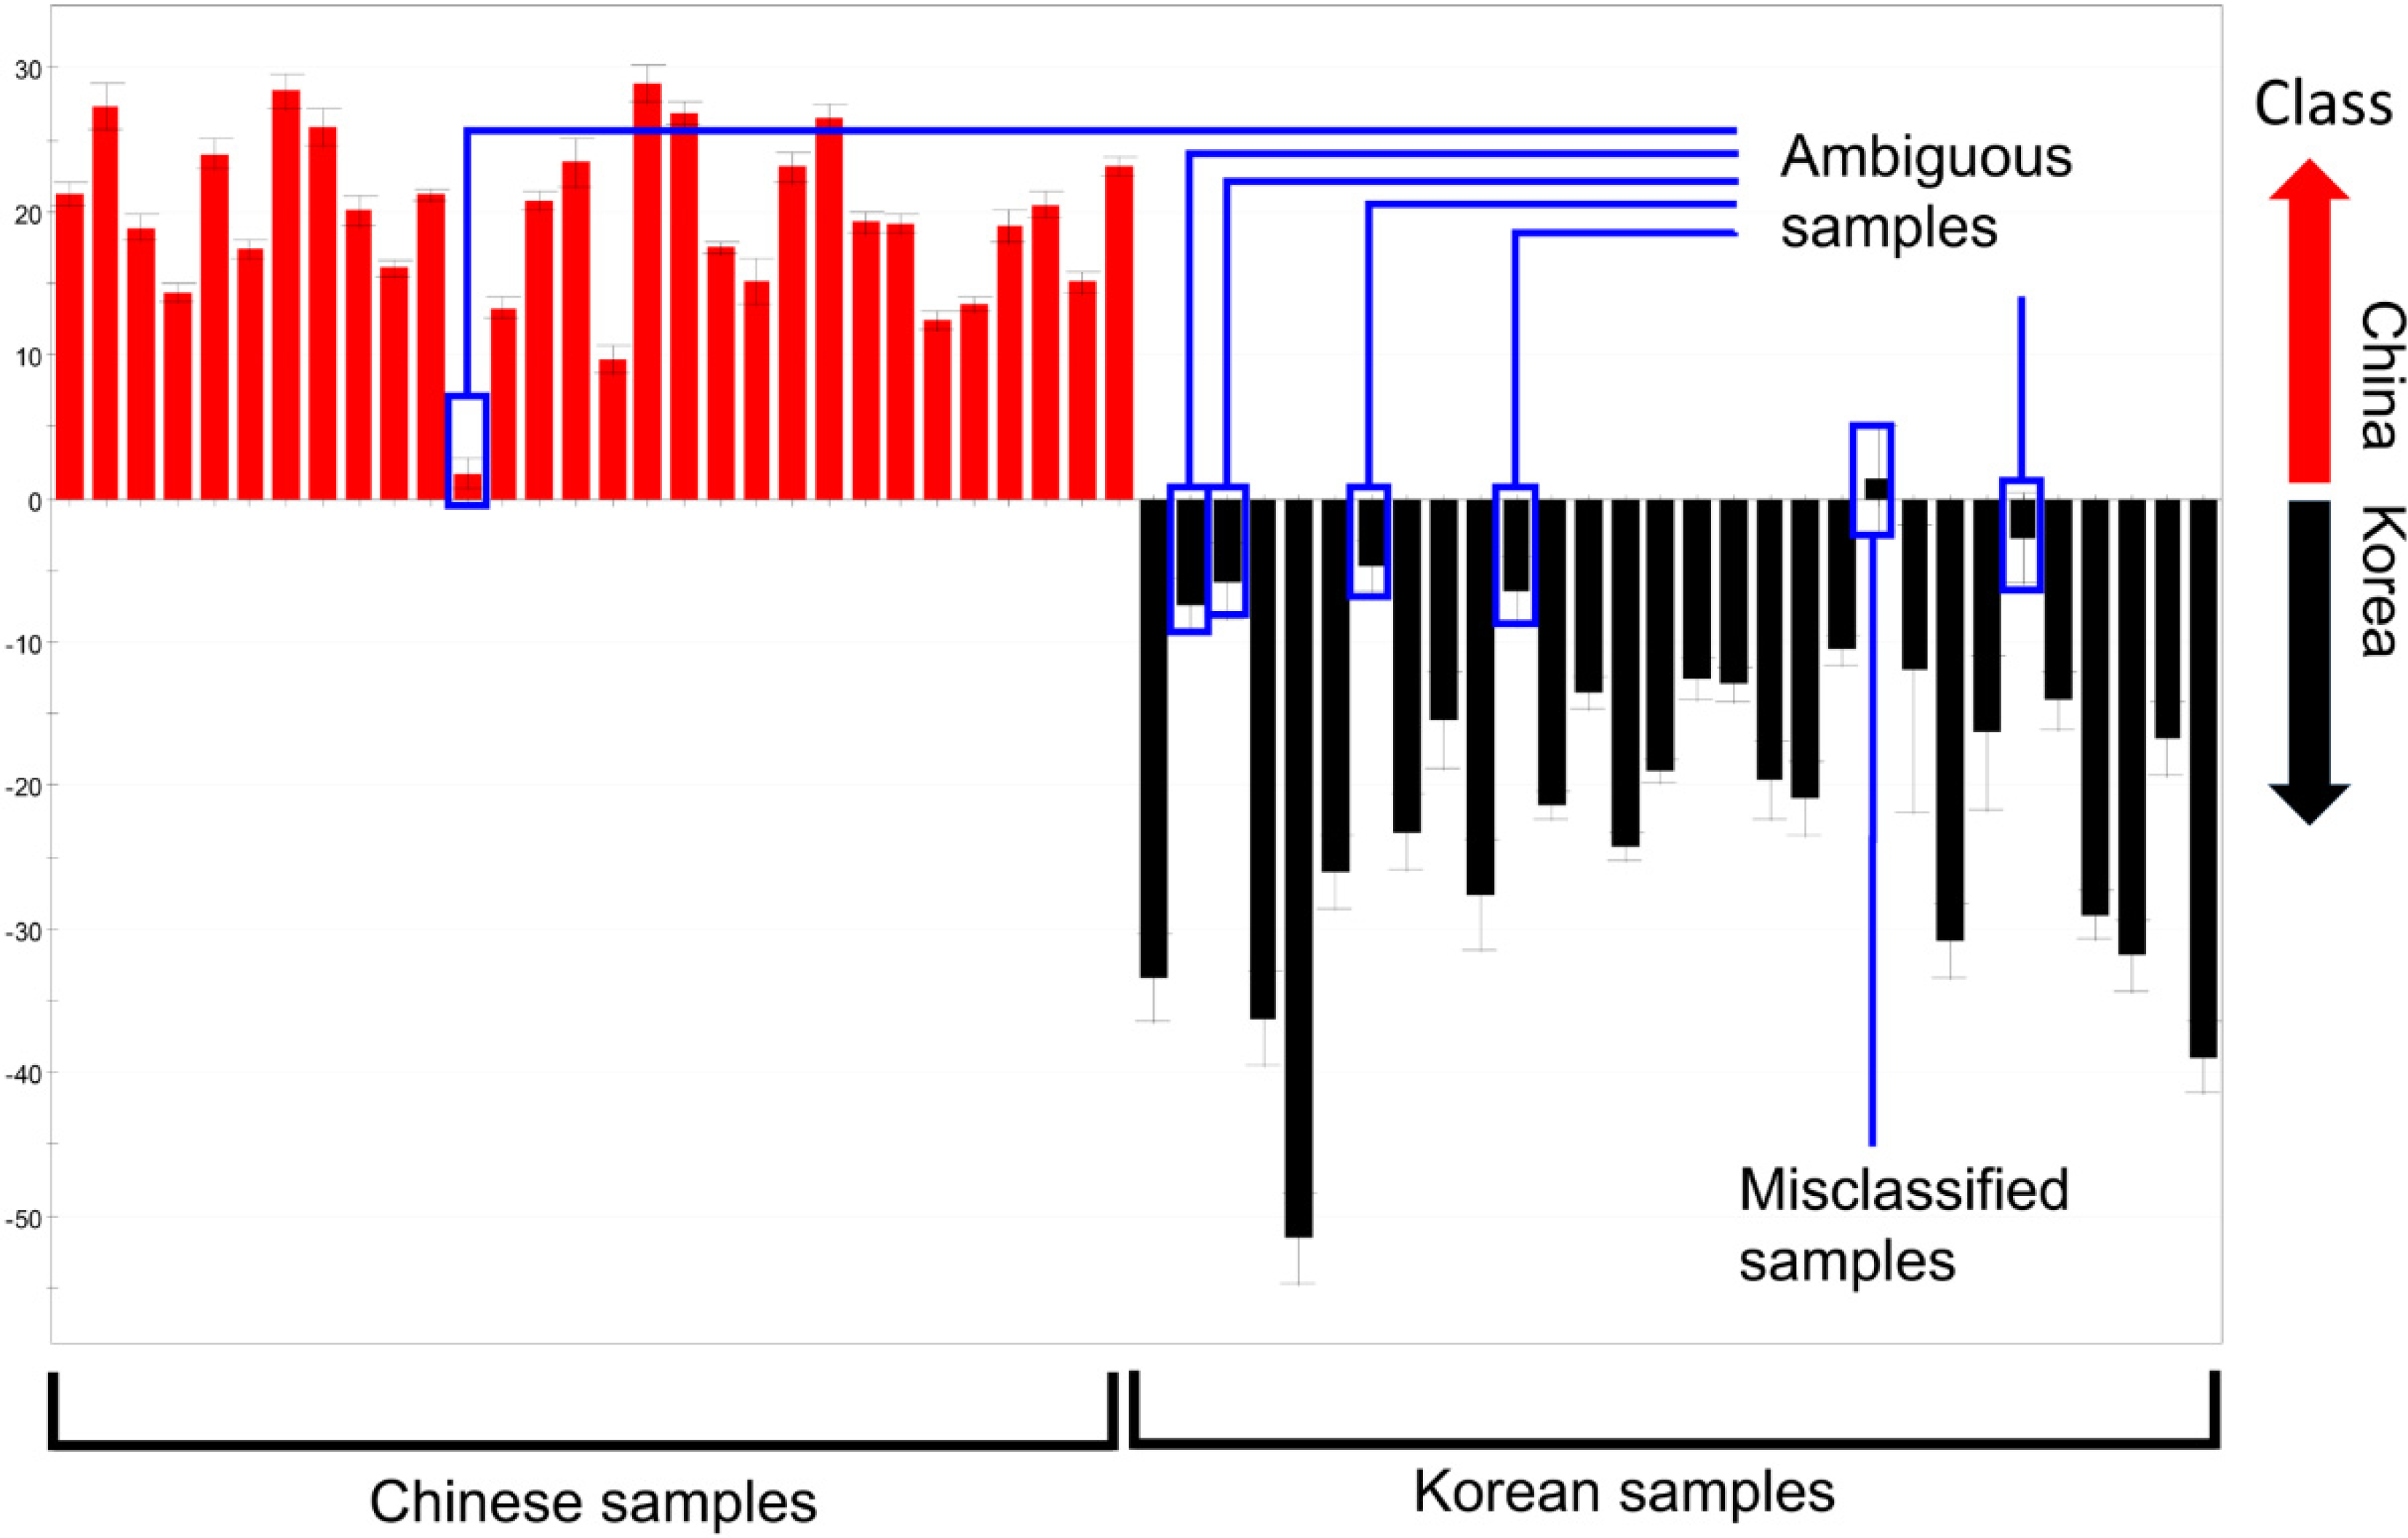
The distance in each discriminant model was not considered when calculating the misclassification rates above because of the inherent property of PCA. Samples of which relative distance to the maximum distance within a group was below 15% were correctly classified. Therefore, these “ambiguous” samples contributed to the low misclassification rate, despite their short distances in the discriminant model (
Figure 3). For example, Chinese sample No. 12 was categorized as Chinese in the plot, but was quite close to the Korean samples, and, therefore, could introduce some uncertainty. As a result, the supervised method described below was used to further evaluate the discriminative ability of the four methods.
Figure 3.
PC1 column plots of
R. glutinosa analyzed by GC-MS (enlarged version of
Figure 2g). Ambiguous samples and misclassified samples are indicated.
Figure 3.
PC1 column plots of
R. glutinosa analyzed by GC-MS (enlarged version of
Figure 2g). Ambiguous samples and misclassified samples are indicated.
2.3.Determination of the Origin of G. elata and R. glutinosa Using Supervised Statistical Analysis
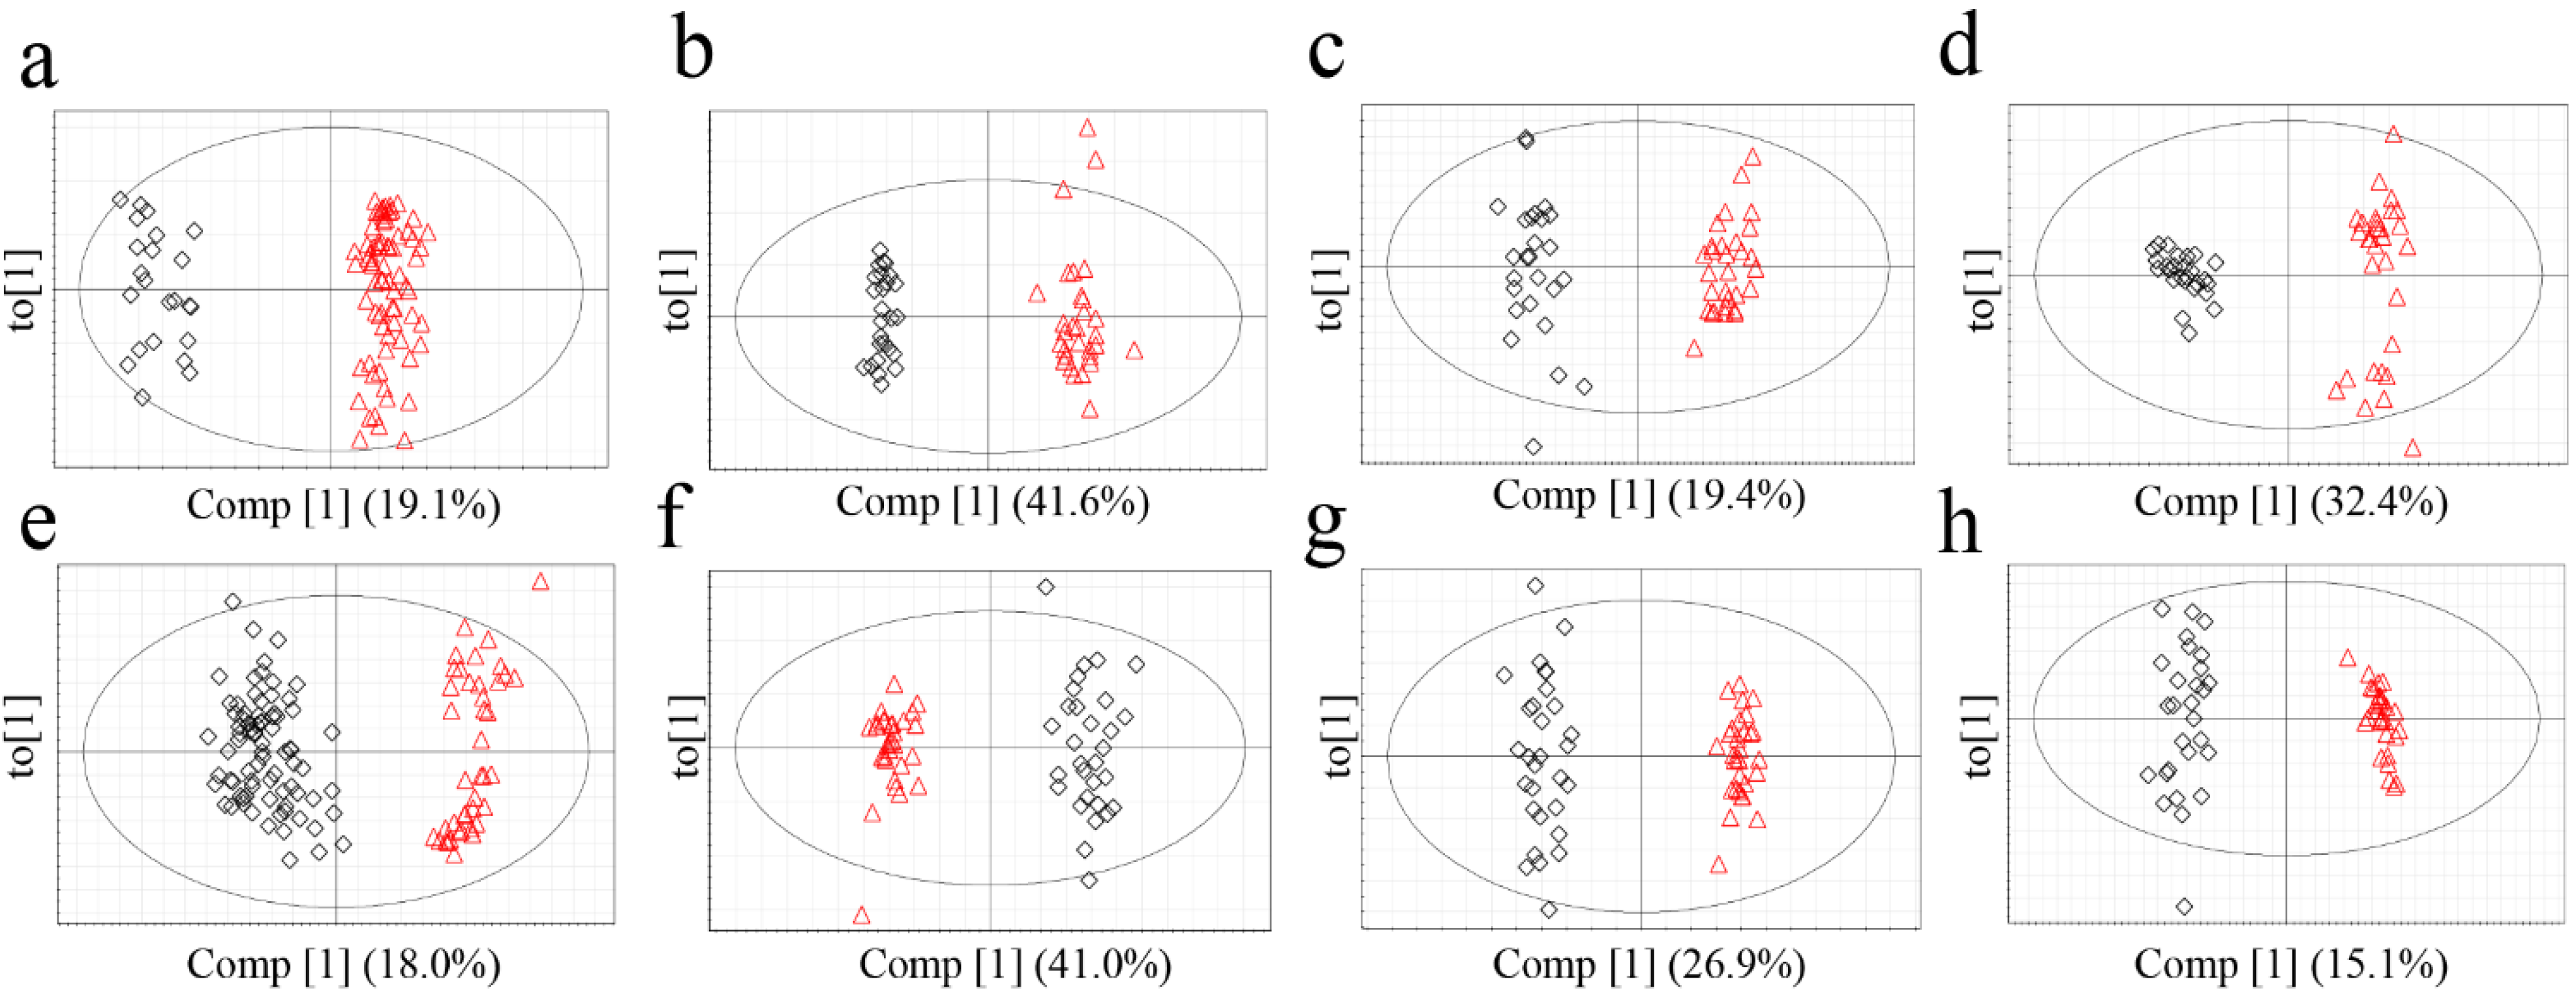
The metabolomics data were subjected to a supervised statistical analysis method, OPLS-DA, to measure the classifications of each model (
Figure 4). All of the models exhibited high-quality parameters as summarized in
Table 5, with overall values of R
2Y (cum) and Q
2 (cum) close to 1.0.
p‑value from cross validated-analysis of variation (CV-ANOVA) as a way of verification of model validity indicated that the models were statistically significant (
Table 5) [
26].
Figure 4.
OPLS-DA score plots of G. elata (FT-NIR; a, 1H-NMR; b, GC-MS; c, LC-MS; d) and R. glutinosa (FT-NIR; e, 1H-NMR; f, GC-MS; g, LC-MS; h). Red triangles for Chinese samples; black diamonds for Korean samples.
Figure 4.
OPLS-DA score plots of G. elata (FT-NIR; a, 1H-NMR; b, GC-MS; c, LC-MS; d) and R. glutinosa (FT-NIR; e, 1H-NMR; f, GC-MS; g, LC-MS; h). Red triangles for Chinese samples; black diamonds for Korean samples.
Table 5.
Validation of the OPLS-DA models and CV-ANOVA values of each model to manifest the model’s regression.
Table 5.
Validation of the OPLS-DA models and CV-ANOVA values of each model to manifest the model’s regression.
| Plants | Approaches | R2Y (cum) | Q2 (cum) | p-value of CV-ANOVA |
|---|
| R. glutinosa | FT-NIR | 0.933 | 0.937 | 7.06 × 10⁻¹¹ |
| 1H-NMR | 0.969 | 0.937 | 7.98 × 10⁻²⁸ |
| GC-MS | 0.971 | 0.904 | 3.33 × 10⁻²³ |
| LC-MS | 0.967 | 0.952 | 2.74 × 10⁻³⁴ |
| G. elata | FT-NIR | 0.966 | 0.944 | 0 |
| 1H-NMR | 0.982 | 0.973 | 1.13 × 10−36 |
| GC-MS | 0.969 | 0.924 | 1.11 × 10⁻²³ |
| LC-MS | 0.970 | 0.951 | 1.25 × 10⁻³² |
Based on Q
2 (cum) value of the OPLS-DA models, which is indicative of classification ability of model [
27], applicability of each model for origin discrimination was evaluated. The most suitable analytical techniques for discriminating between the origin of
G. elata and
R. glutinosa were
1H-NMR and LC-MS, respectively. In the analysis of
G. elata,
1H-NMR had the highest discriminative ability followed by LC-MS. This result is consistent with the misclassification rates calculated from PCA, which were lowest in
1H-NMR (0.0%) followed by LC-MS (1.8%). These observations indicate that
1H-NMR and LC-MS-based approaches were appropriate for discrimination. On the other hand, for
R. glutinosa, the Q
2 value of the GC-MS analysis was lower than those of LC-MS and
1H-NMR, and GC‑MS had the lowest misclassification rate. Compared to the other techniques, GC-MS required much longer and more complicated sample preparation, including the derivatization steps, which could have lowered the reproducibility and possibly Q
2. It is also conceivable that the unsupervised PCA performed better in analyzing the GC-MS data than the supervised OPLS-DA that is presumed to overfit the data by using class information in dimension reduction. The FT-NIR method, which had the shortest and most convenient sample preparation and analysis, was acceptable for determining the origin of
G. elata and
R. glutinosa based on OPLS-DA, though it was somewhat disqualified by PCA.
Upon integrating the results from the two statistical analyses, the best discrimination method differed for each plant species, which suggests that metabolomics approaches should be investigated on a case-by-case basis. Nonetheless, 1H-NMR and LC-MS were preferable for discriminating the origin of the two plants over the others.


