Article

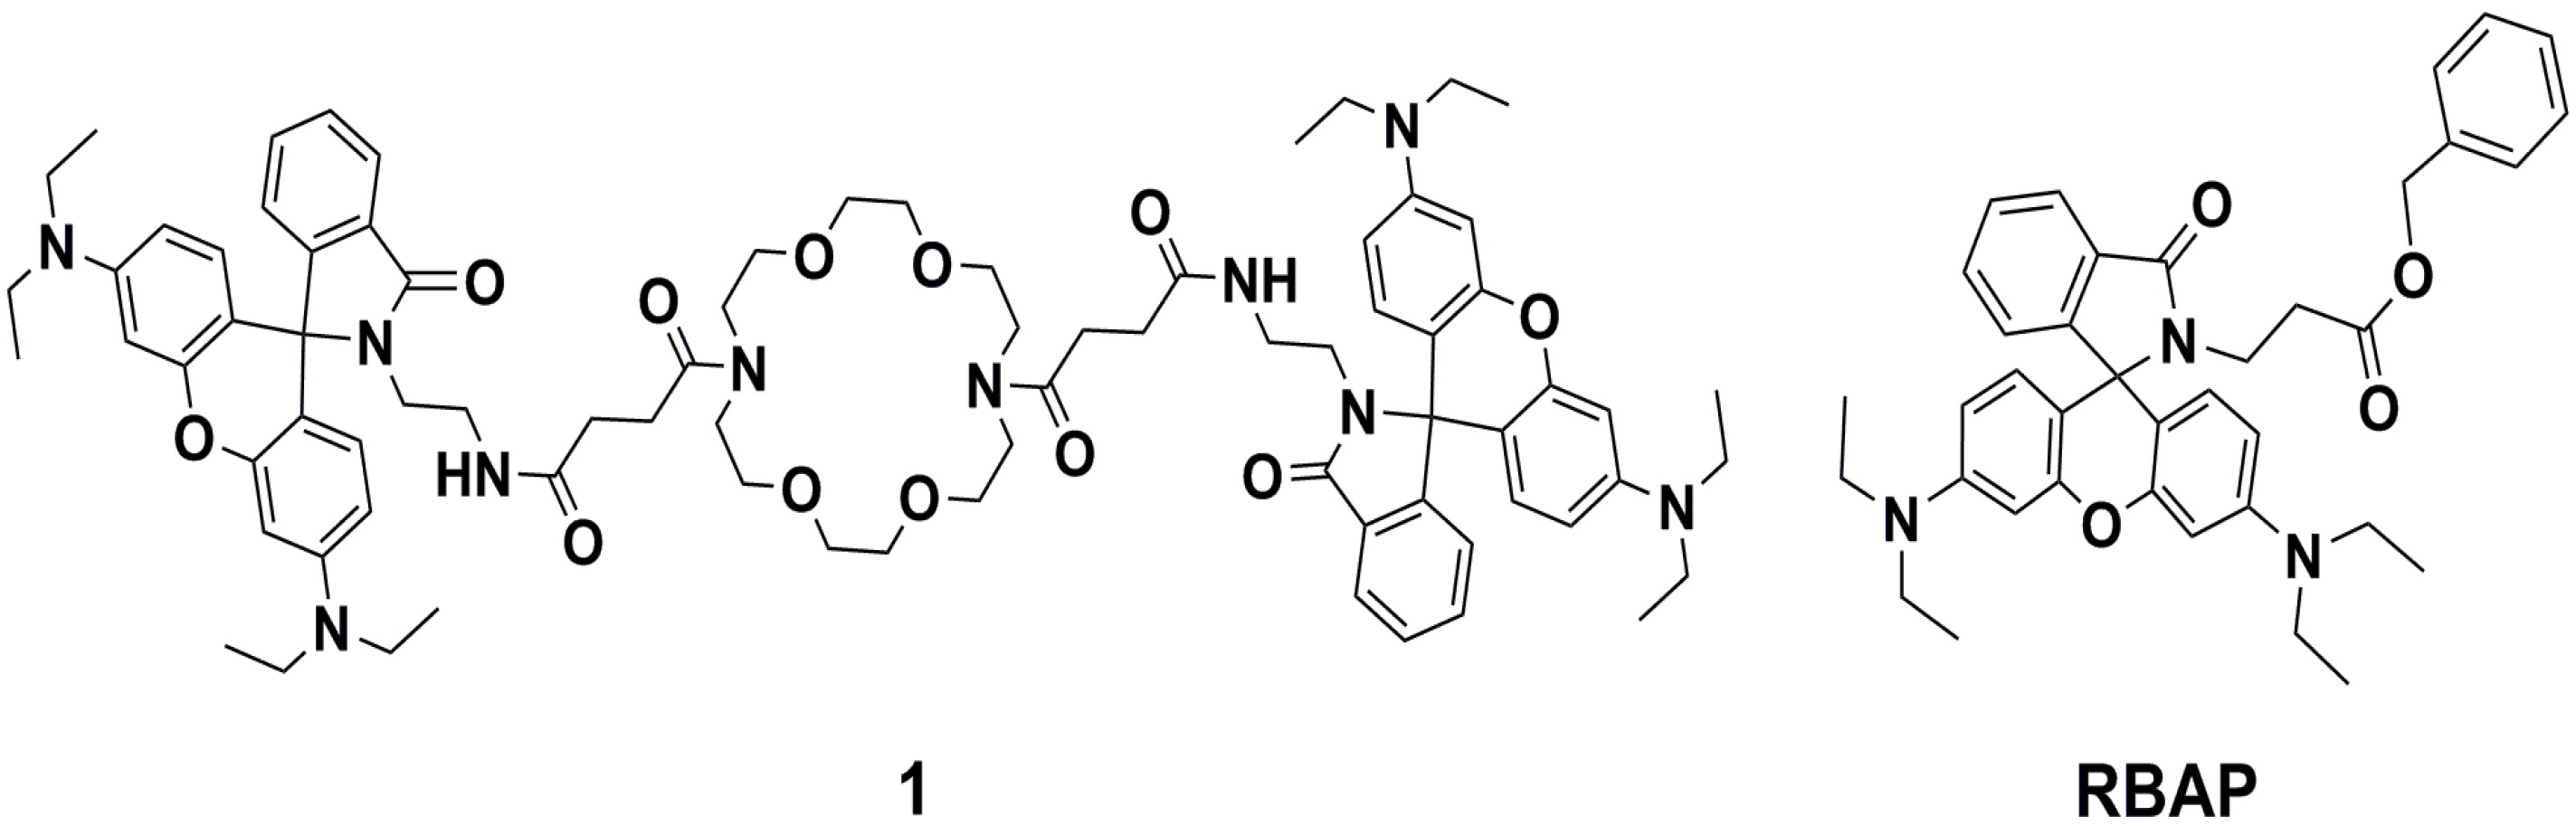
RBAP, a Rhodamine B-Based Derivative: Synthesis, Crystal Structure Analysis, Molecular Simulation, and Its Application as a Selective Fluorescent Chemical Sensor for Sn2+

1
Department of Biochemical Engineering, Nanjing University of Science & Technology, Chemical Engineering Building B308, 200 Xiaolinwei, Nanjing 210094, China
2
Department of Chemistry, School of Chemical Engineering, Nanjing University of Science & Technology, Nanjing 210094, China
*
Author to whom correspondence should be addressed.
Molecules 2014, 19(6), 7817-7831; https://doi.org/10.3390/molecules19067817
Submission received: 18 April 2014 / Revised: 28 May 2014 / Accepted: 3 June 2014 / Published: 11 June 2014
(This article belongs to the Section Organic Chemistry)

Abstract

:
A new fluorescent chemosensor based on a Rhodamine B and a benzyl 3-aminopropanoate conjugate (RBAP) was designed, synthesized, and structurally characterized. Its single crystal structure was obtained and analyzed by X-ray analysis. In a MeOH/H2O (2:3, v/v, pH 5.95) solution RBAP exhibits a high selectivity and excellent sensitivity for Sn2+ ions in the presence of many other metal cations. The binding analysis using the Job’s plot suggested the RBAP formed a 1:1 complex with Sn2+.

Graphical Abstract

1. Introduction

Selective and sensitive fluorescent sensors for the detection and quantification of transition-metal ions are widely attractive to current researchers because of their simplicity, high sensitivity and instantaneous response [1,2,3,4,5,6,7]. Conventional methods used to detect metal ions usually require large and expensive instruments and include atomic absorption/emission spectrometry [8,9,10], ion-coupled plasma emission-mass spectrometry [11] and X-ray fluorescence spectroscopy [12,13]. These instrumentally intensive methods often also require extensive sample preparation prior to analysis and sophisticated experimental procedures [14]. Thus, a simple and inexpensive method for detecting and quantifying metal ions is essential for real-time monitoring in biological samples. Ions of tin (Sn), a type of heavy metal, are usually found in the environment at low levels. Humans are usually exposed to organic tin complexes through packaged foods, soft drinks, biocides, and dentifrices [15]. Little attention has been paid to the toxicity of Sn2+ as an environmental pollutant in natural waters. Although tin is not a highly toxic element [16], at high concentrations of approximately 0.1–1.0 g/L, Sn2+ may affect water flavor and cause diarrhea. Recent literature reports have revealed that, in forms such as SnCl2, Sn2+ can be readily taken up by human white blood cells and cause DNA damage [17,18]. Thus, it is desirable to develop a reliable and sensitive analytical method to qualitatively and quantitatively evaluate the level of Sn(II) ions present in environmental and biological systems. Rhodamine B derivatives are extensively employed as molecular probes in the study of complex biological systems due to their high absorption coefficients, high fluorescence quantum yields, and long-wavelength absorptions and emissions [19,20]. On the basis of the spirolactam/ring-opened amide equilibrium of rhodamine, several fluorescence-based sensing systems for metal ions have been developed. Most of the reported sensors based on rhodamine B derivatives are fluorescent chemosensors for the detection of Pb2+, Cd2+, Cu2+, Fe3+ and Hg2+ ions [21,22,23,24,25,26,27,28,29]. Unfortunately, to the best of our knowledge, only a few rhodamine B-based chemosensors have been reported for tin ions [30]. Therefore, a rhodamine B architecture was selected for the development of a new chemosensor that can selectively detect Sn2+. Recently, we reported rhodamine B-based sensor 1 (Figure 1), which consists of two rhodamine B moieties linked through the two amines of a 4,13-diaza-18-crown-6 ether as a highly sensitive fluorescent probe for monitoring Cr3+ in a MeOH/H2O (3:2, v/v, pH 7.2) solution and in living cells [31]. Unfortunately, single crystals of sensor 1 could not be grown in the presence or absence of Cr3+ and were not analyzed by X-ray diffraction. In this paper, we report the design and synthesis of a rhodamine B–based derivative bearing a benzyl 3-aminopropanoate group (RBAP) that selectively displays a colorimetric response and a fluorescence “turn-on” response at 583 nm via a rhodamine ring-opening process with Sn2+ in the presence of many other metal ions. We also report the single crystal X-ray analysis of RBAP, which further confirms its structure in the absence of Sn2+. Additionally, a DFT computational study was carried out for better understanding of the formation of a complex between RBAP and Sn2+. To the best of our knowledge, RBAP is the first rhodamine B-based sensor for the Sn2+ ion utilizing the rhodamine ring-opening equilibrium approach.
Figure 1. Chemical structures of 1 and RBAP.
Molecules 19 07817 g001

2. Results and Discussion

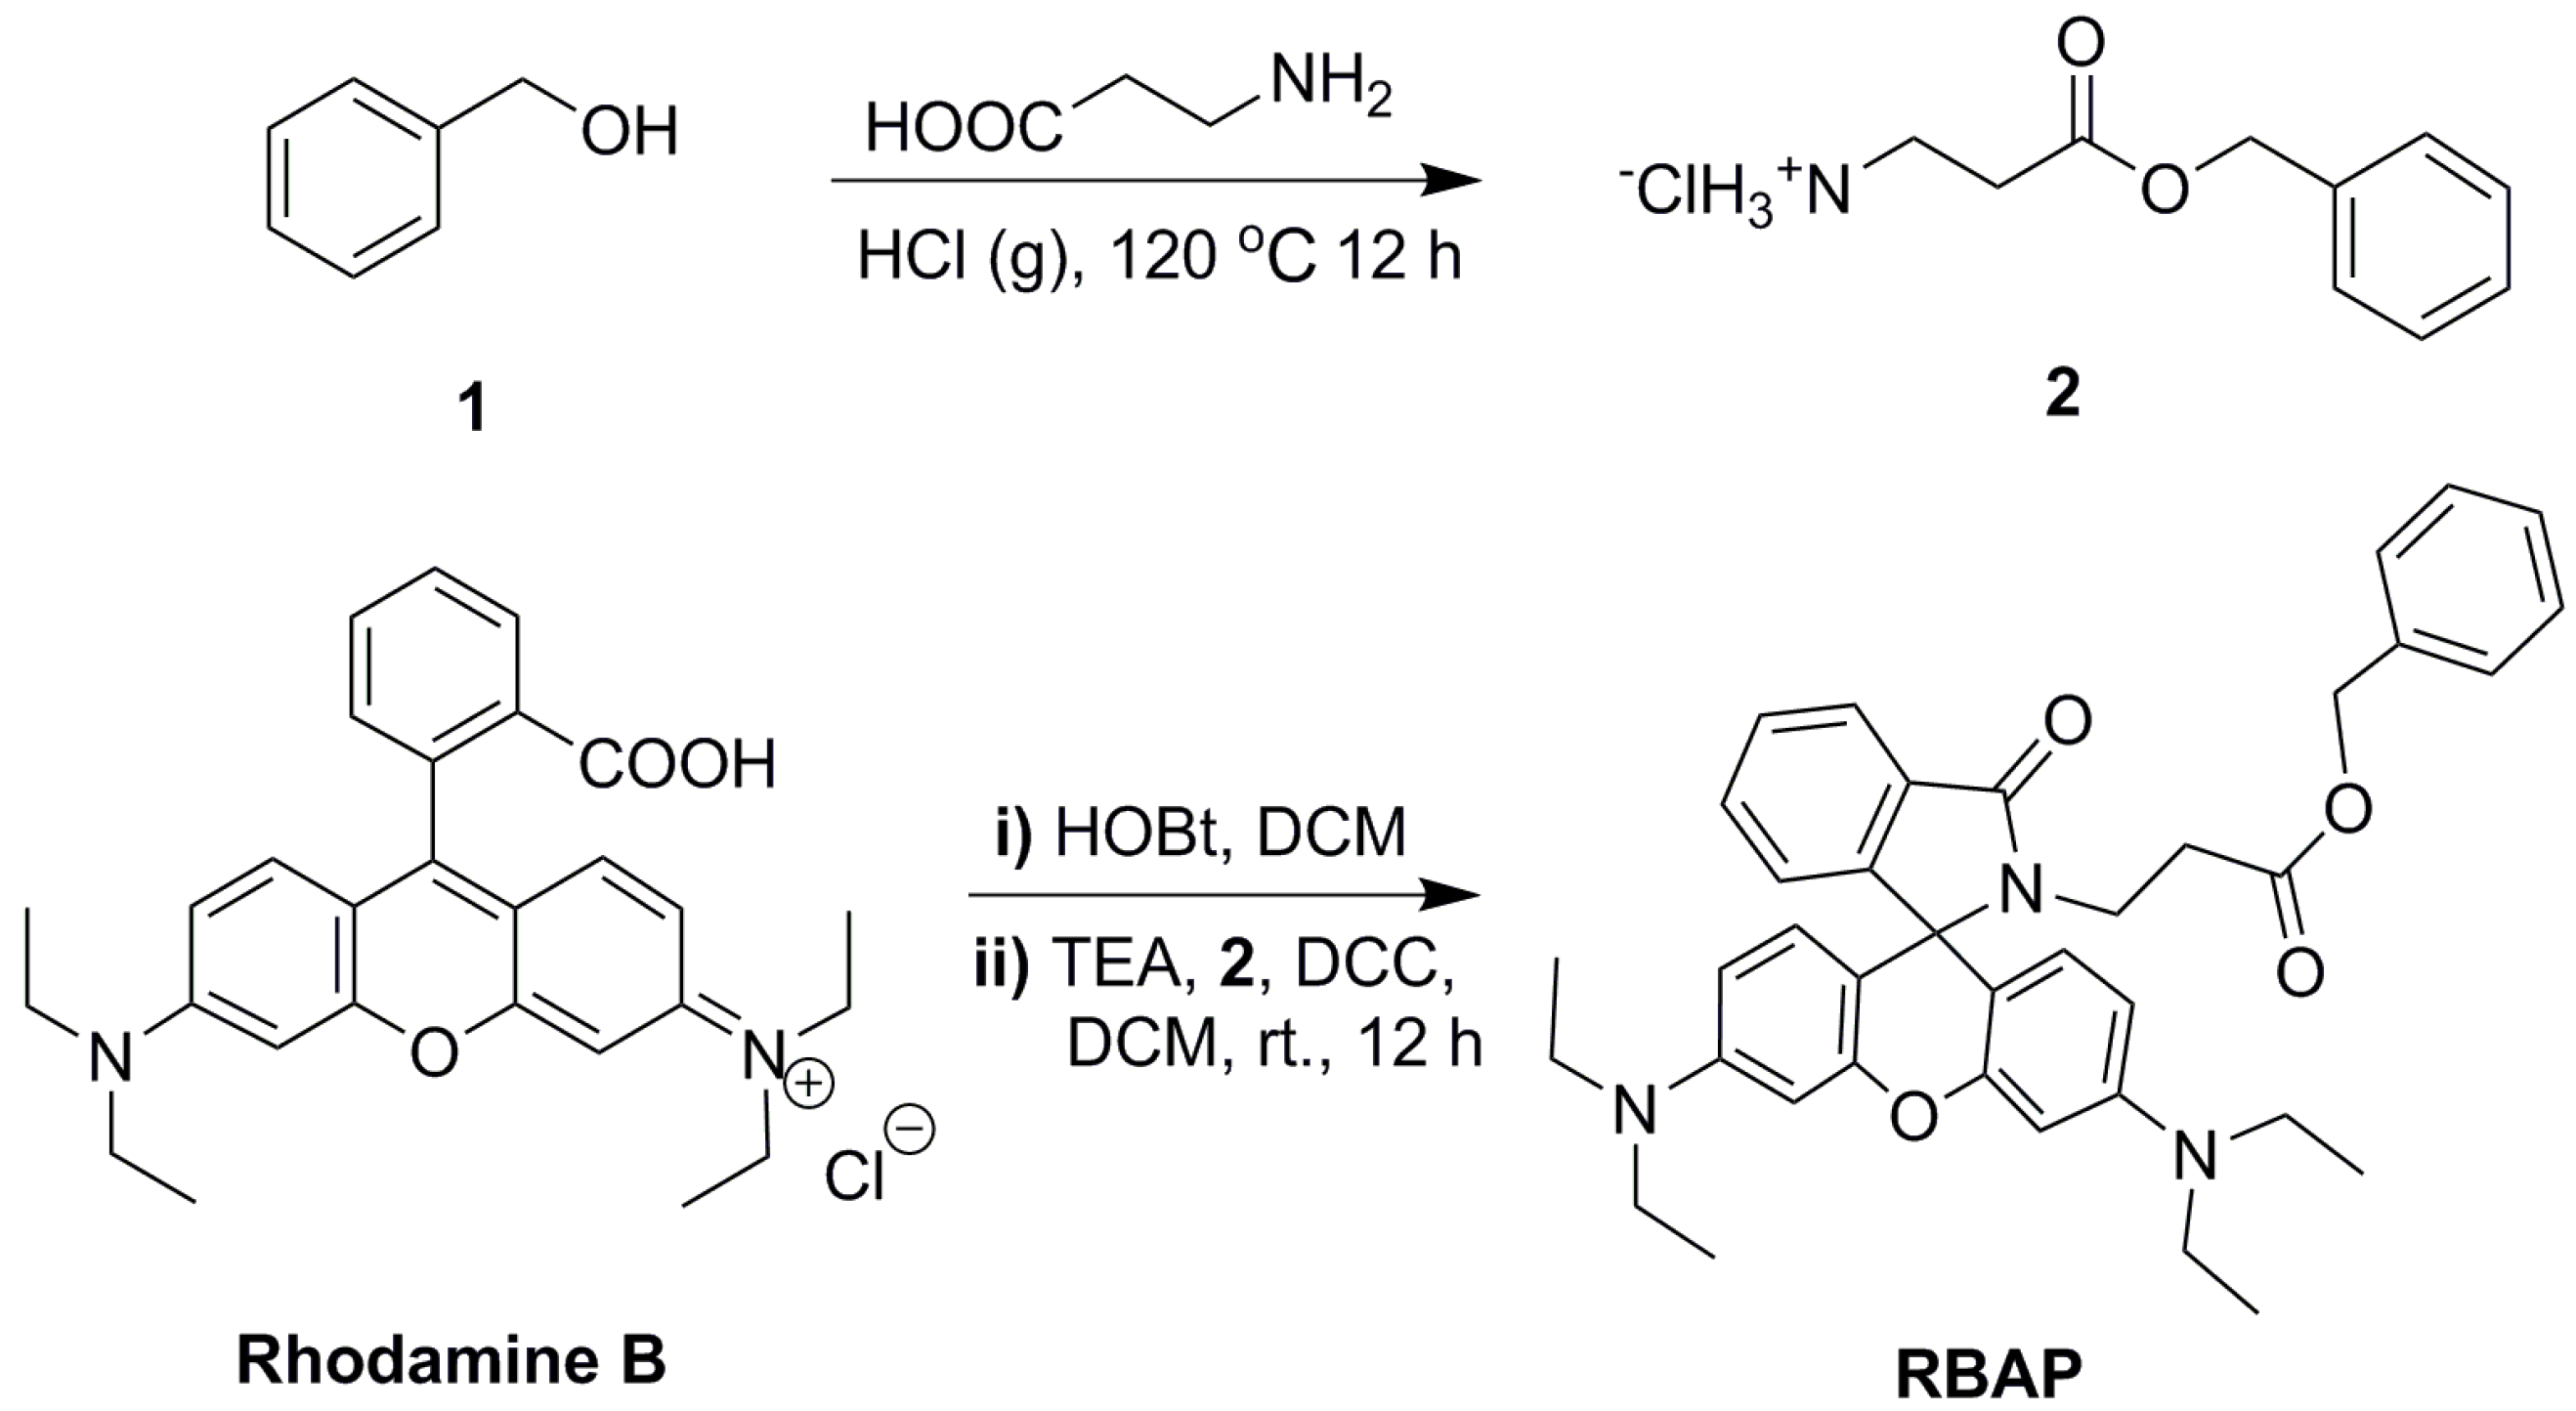
2.1. Synthesis of RBAP

RBAP was synthesized according to the procedure published in the literature [31] (Scheme 1). Specifically, compound 2 was prepared in a 92% yield by treating 1 with 3-aminopropanoic acid and HCl gas at 120 °C for 12 h, which was followed by coupling with rhodamine B in the presence of DCC (1 eq.), HOBt (1 eq.), and TEA (3 eq.) in CH2Cl2 at room temperature for 12 h to give RBAP in a 90% yield.
Scheme 1. Synthesis of RBAP.
Molecules 19 07817 g013

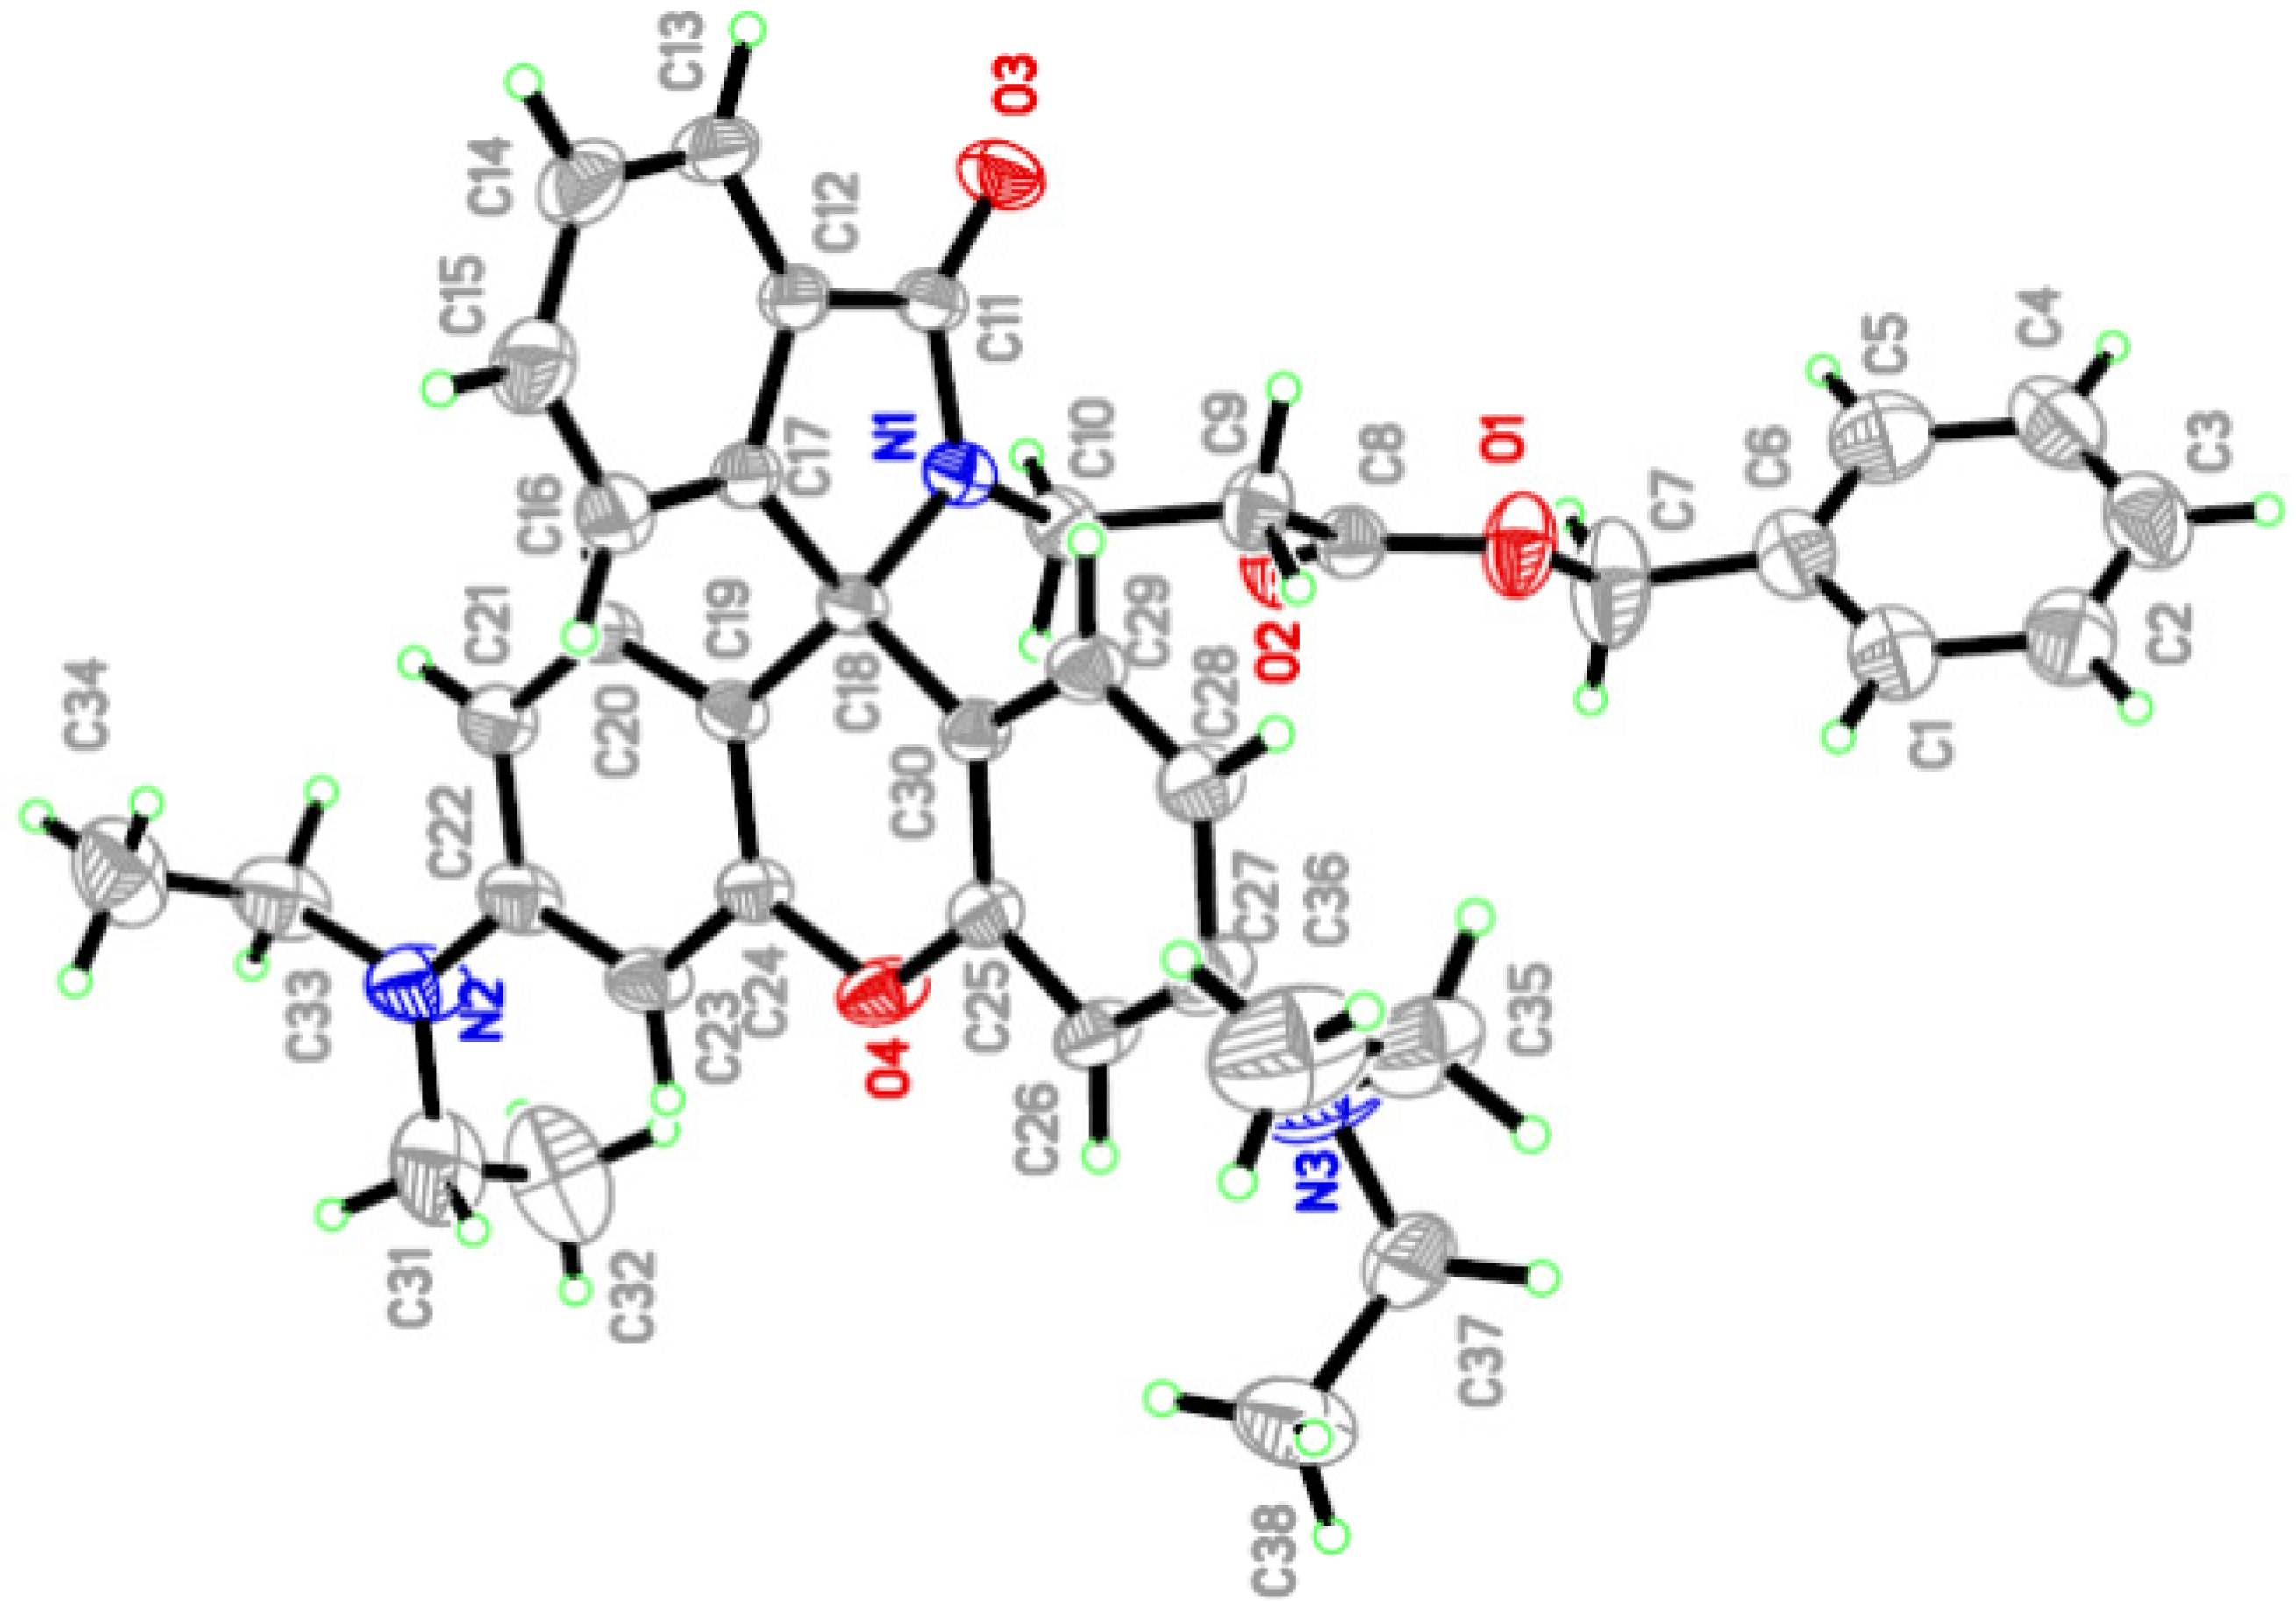
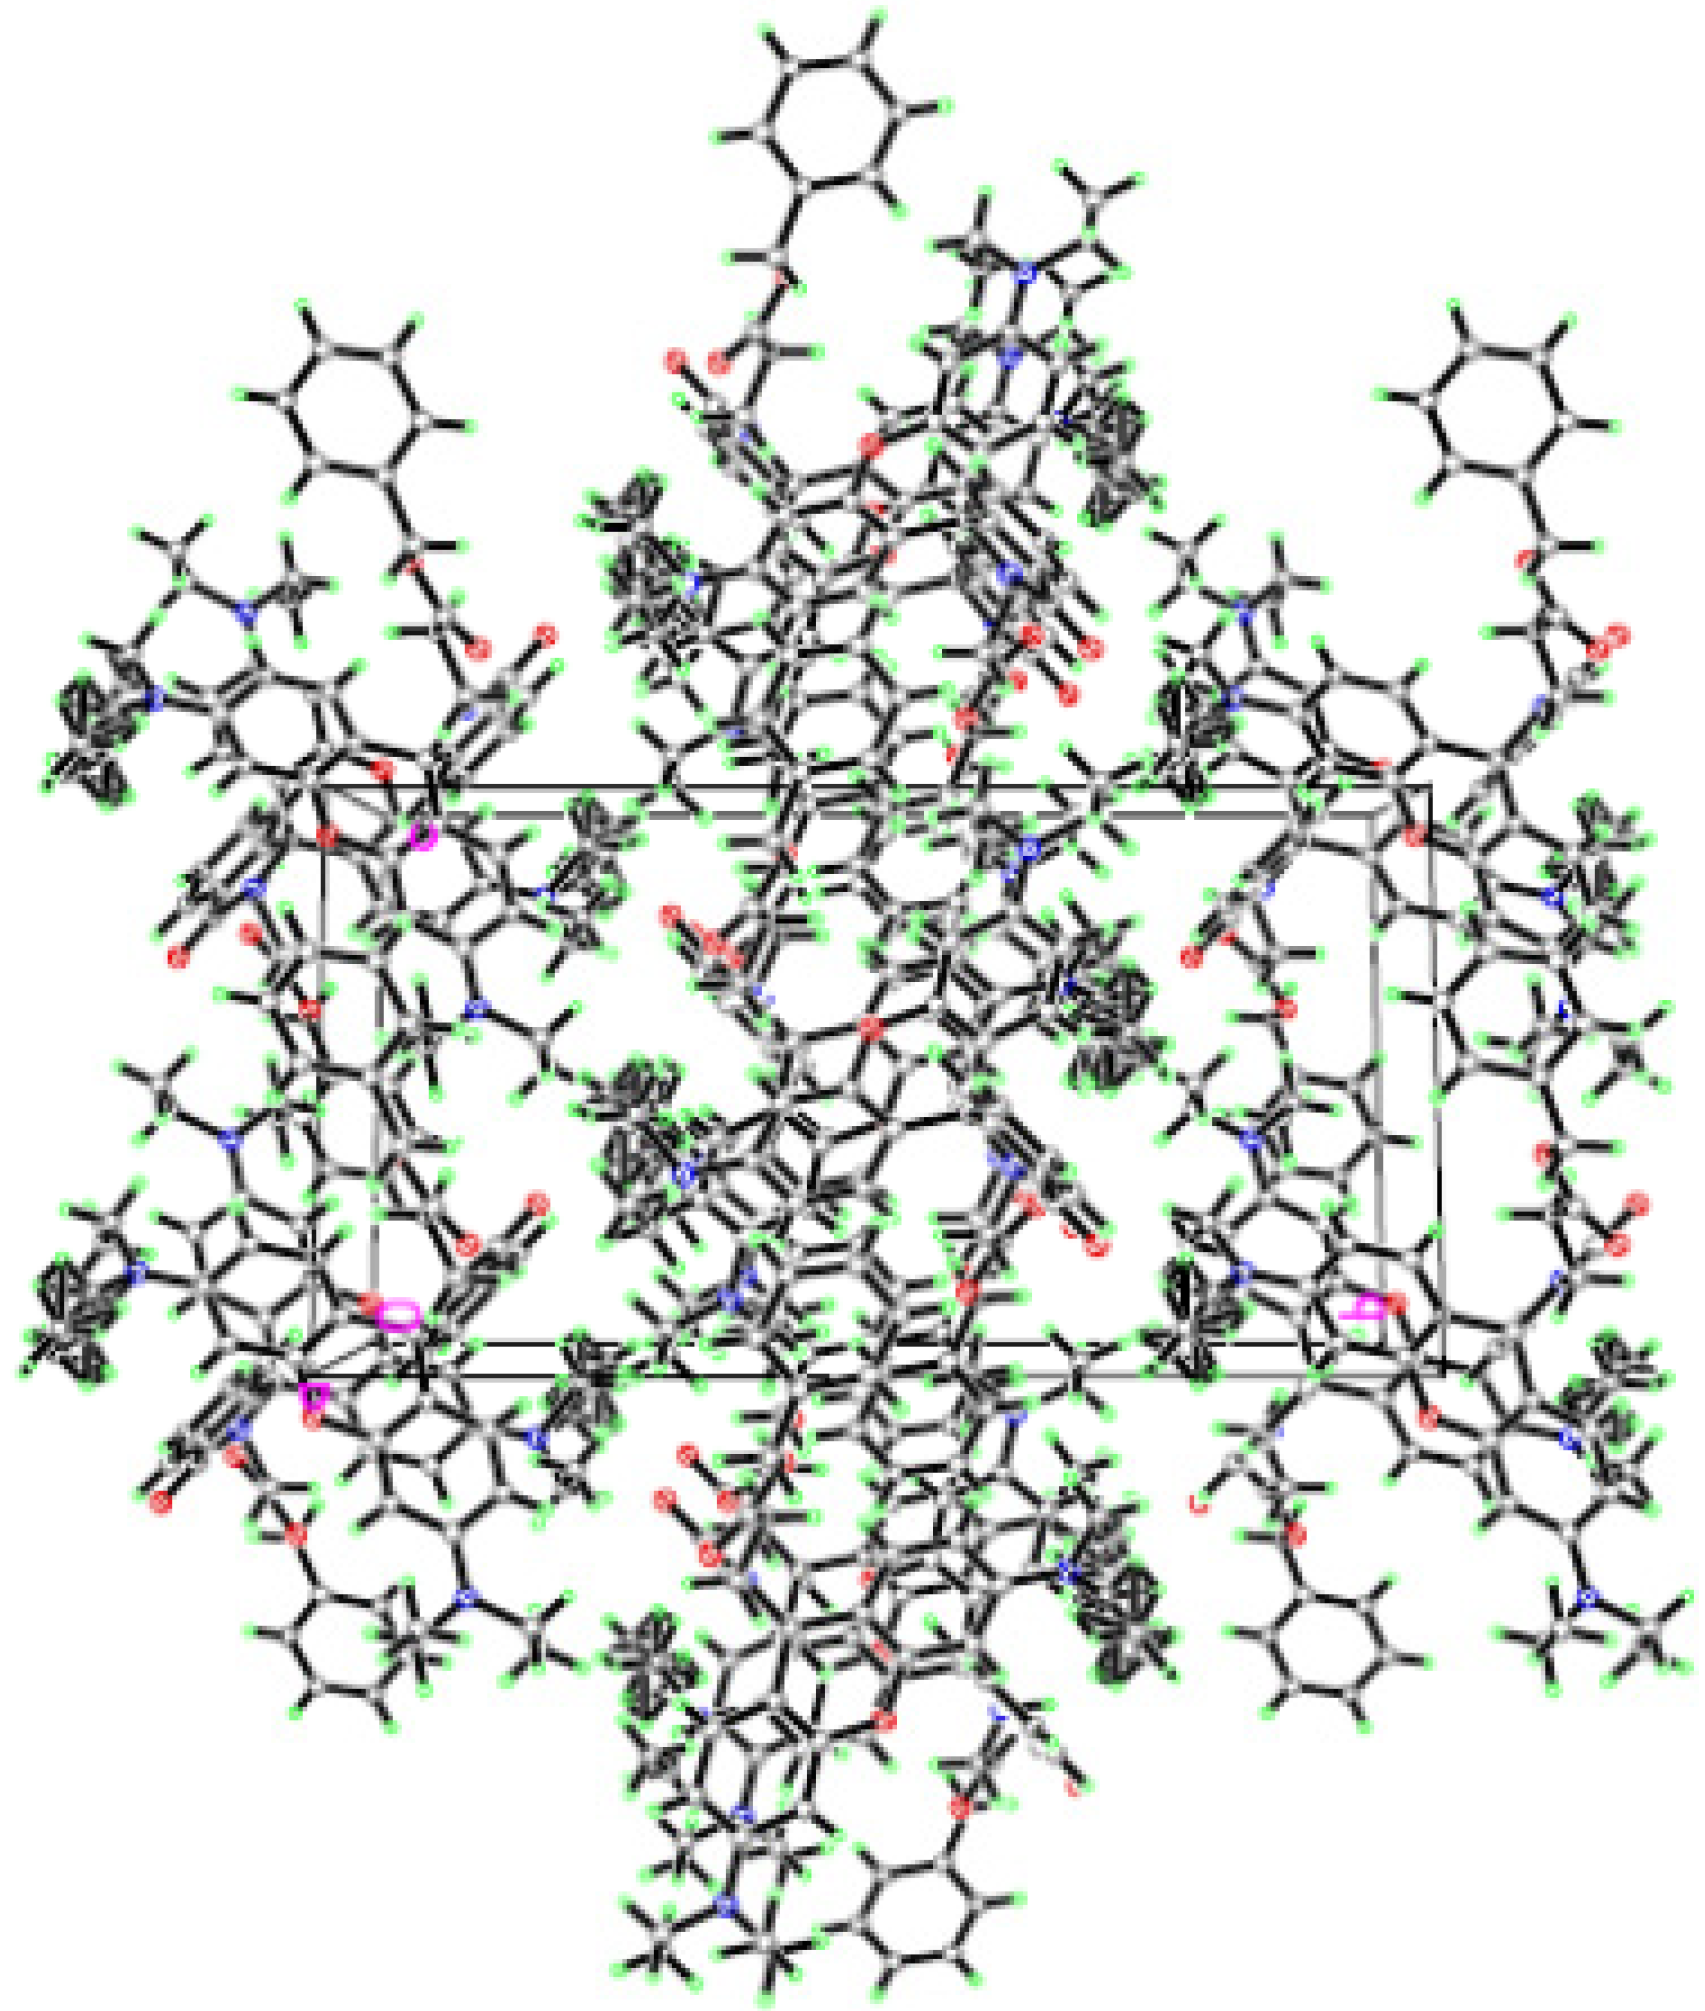
2.2. X-ray Crystallographic Analysis

A single crystal of RBAP suitable for X-ray diffraction studies was grown by vapor diffusion of a CH2Cl2 solution of RBAP. The chemical structure of RBAP was further confirmed by X-ray analysis as shown in Figure 2, and the two-dimensional network structure of RBAP is shown in Figure 3.
Figure 2. Crystal structure of RBAP.
Molecules 19 07817 g002
Figure 3. Network structure of RBAP.
Molecules 19 07817 g003

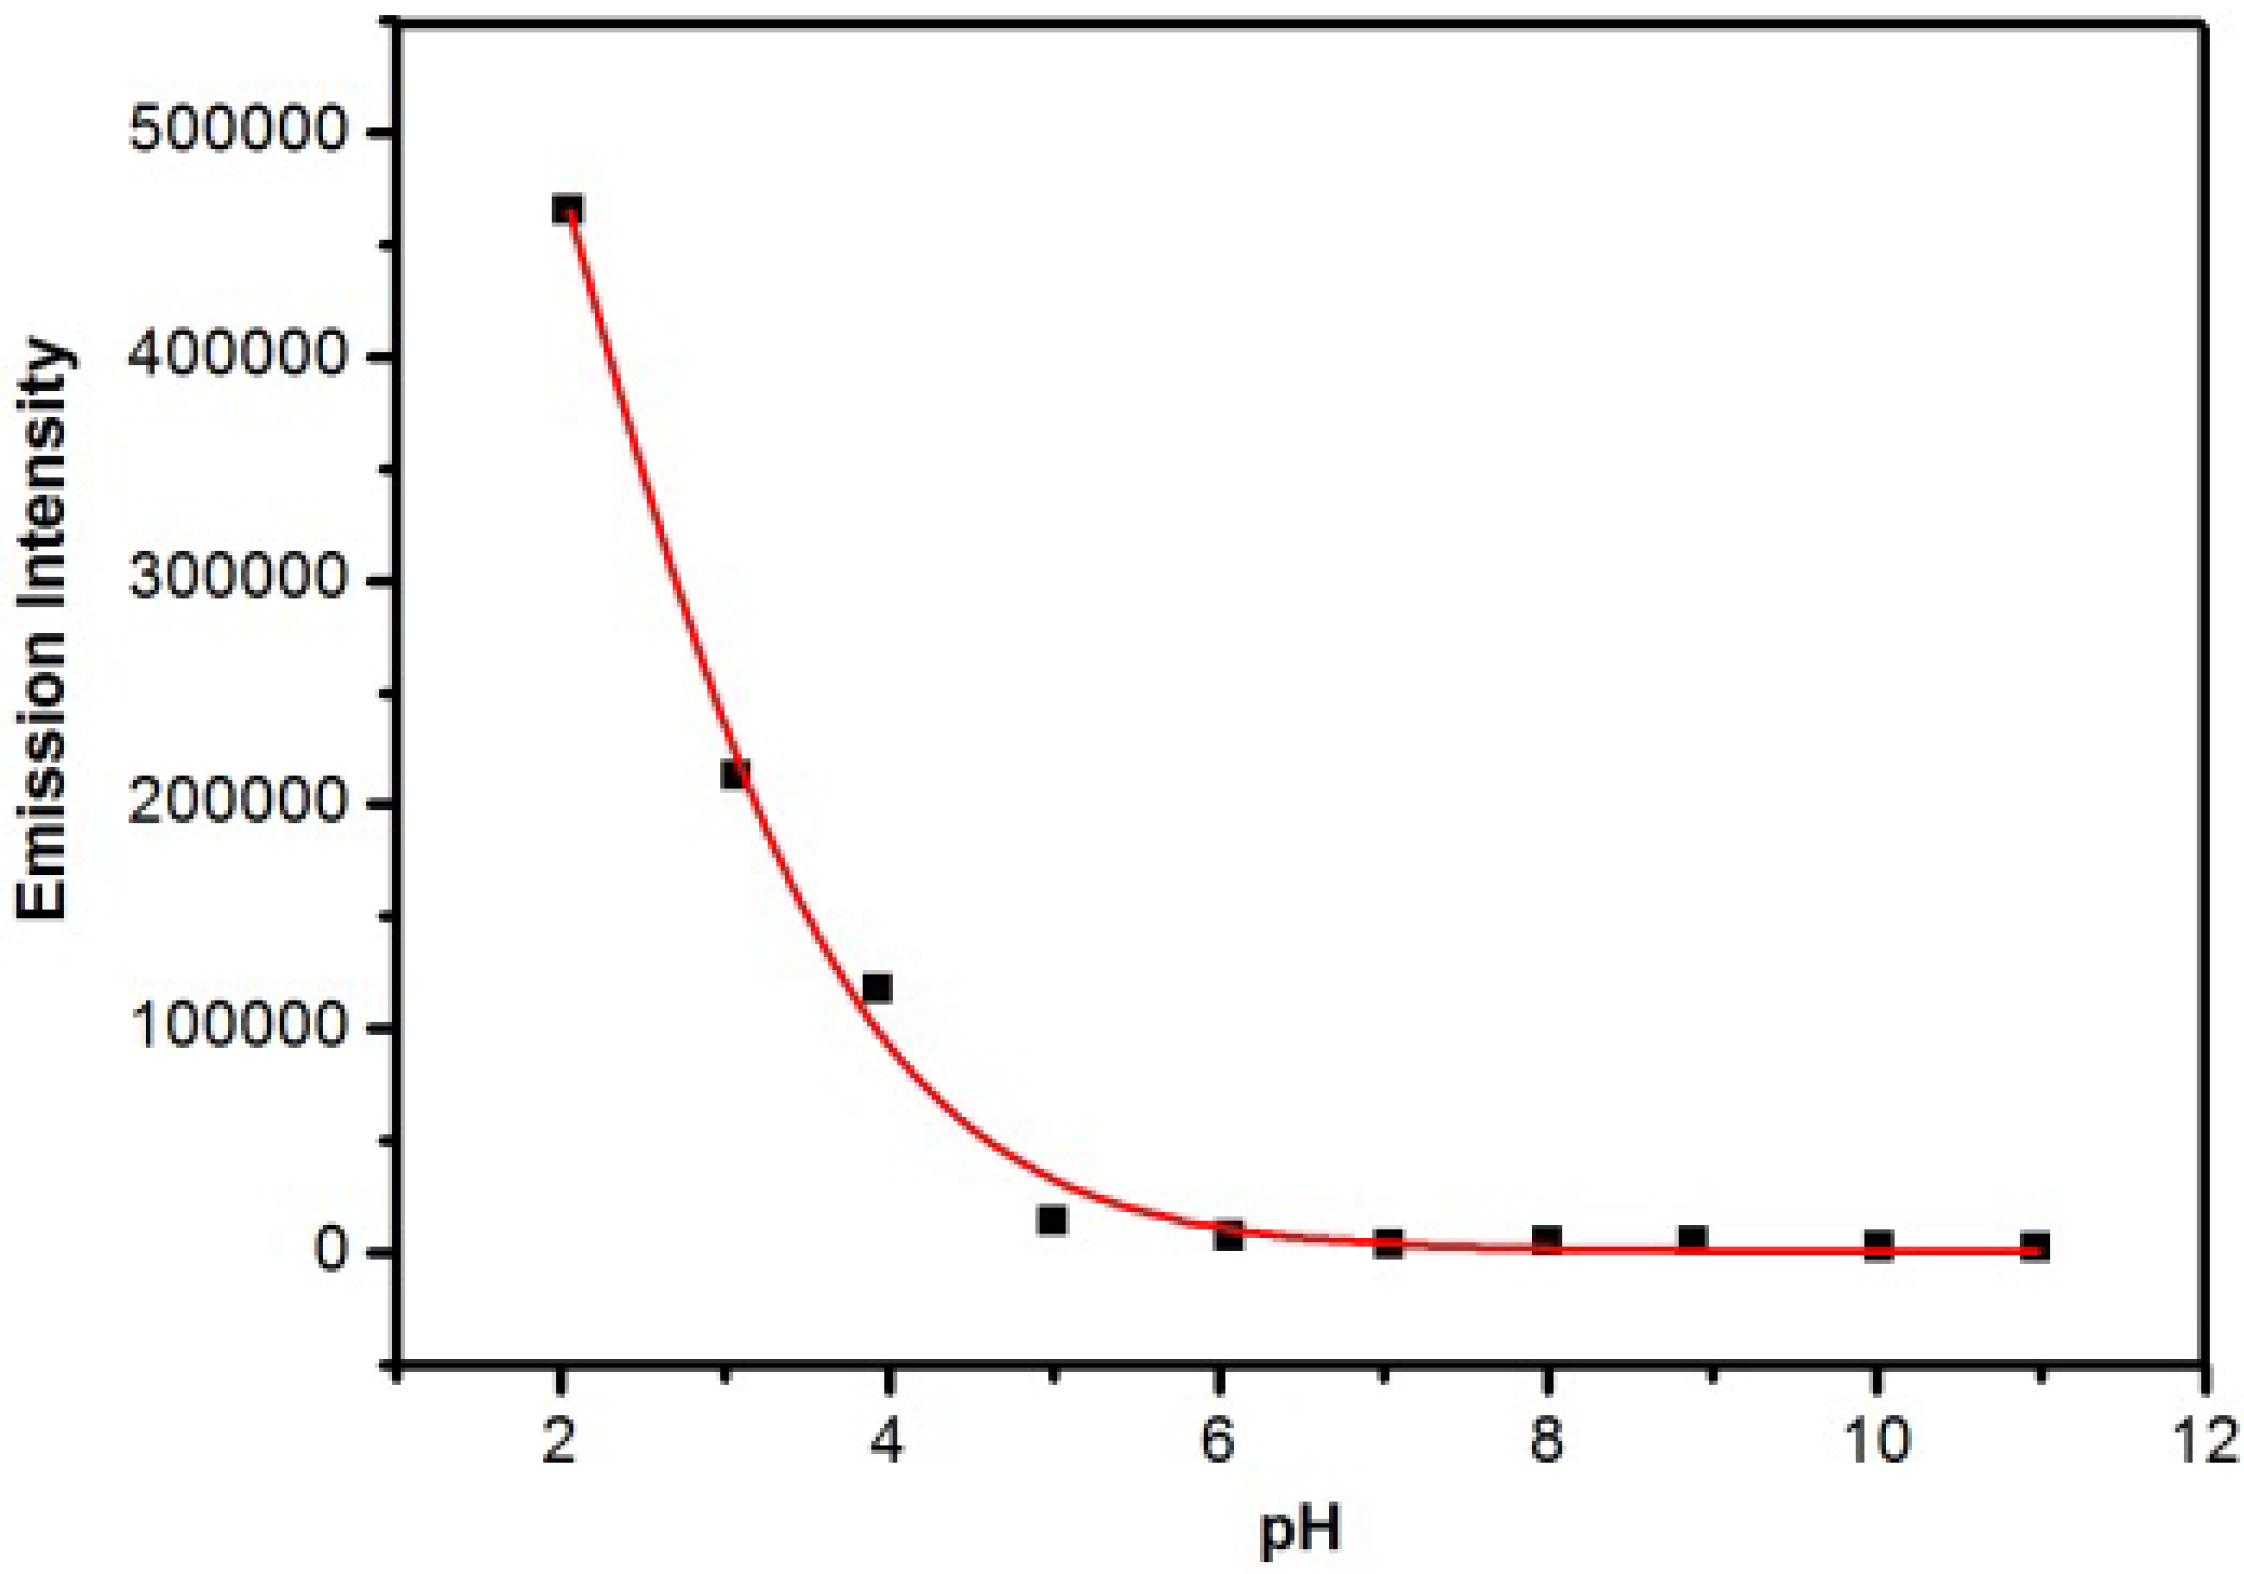
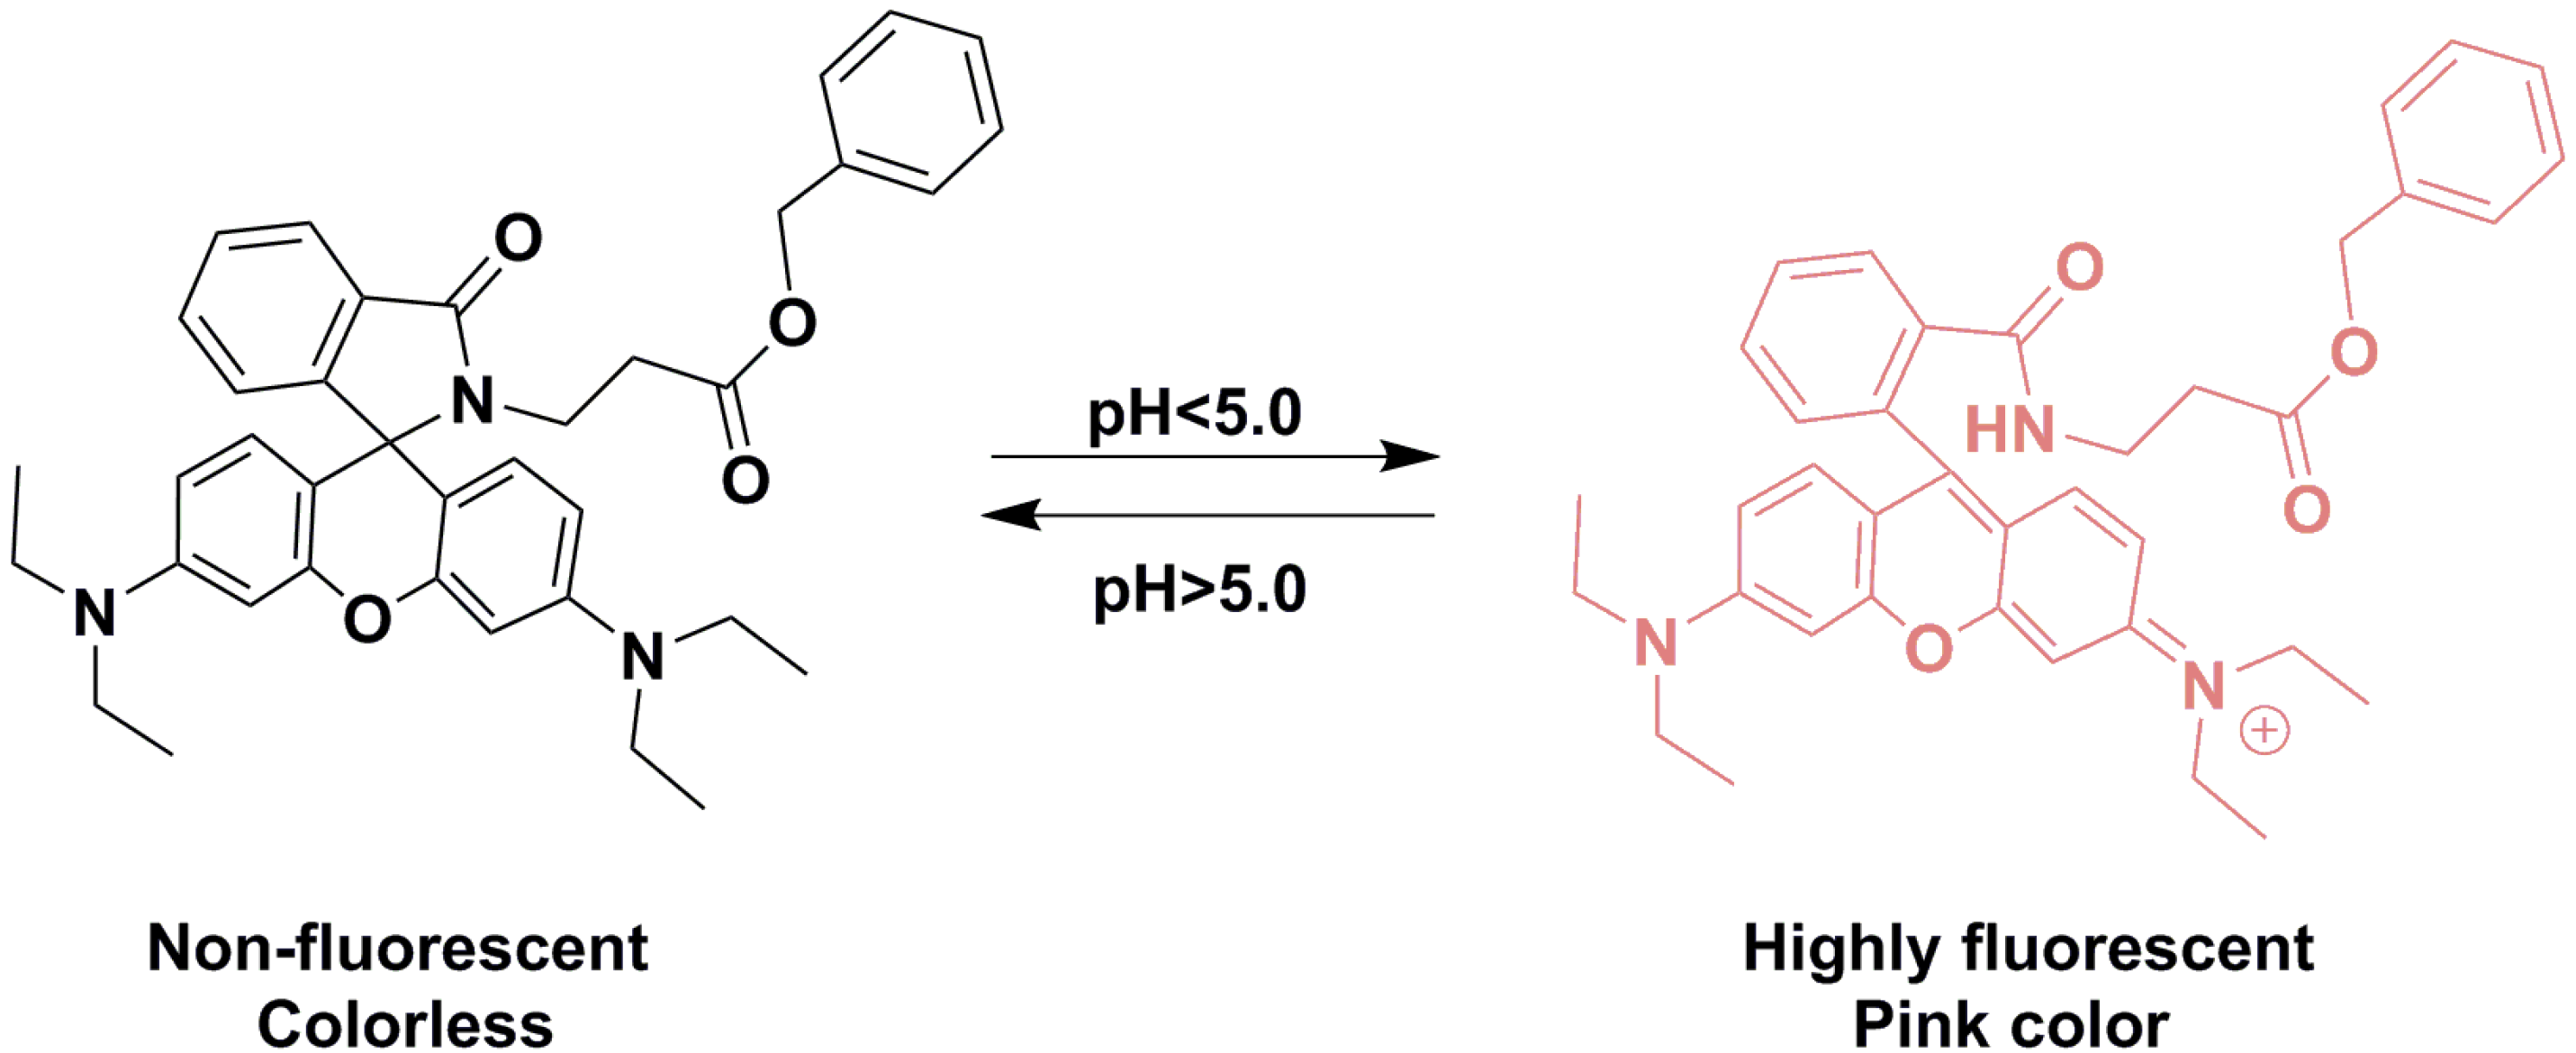
2.3. pH Response of RBAP

To evaluate the pH response of RBAP, acid-base titration experiments were performed in a MeOH/H2O (2:3, v/v, pH 5.95) solution. The fluorescence intensities of RBAP at 583 nm in solutions at different pH levels were recorded. As shown in Figure 4, RBAP did not emit any obvious and characteristic fluorescence (excitation at 561 nm) in the pH range of 5.0 to 12.0. However, the fluorescence intensity at 583 nm was obviously enhanced at pH levels below 5.0 due to the ring-opening mechanism of the spirocyclic moiety of rhodamine B (Scheme 2). These results suggested that RBAP was insensitive to pH from 5.0 to 12.0 and may have been able to sense Sn2+ under approximate physiological conditions with very low background fluorescence. Therefore, further UV-Vis and fluorescence studies were carried out in a MeOH/H2O (2:3, v/v, pH 5.95) solution.
Figure 4. The influence of pH on the fluorescence of RBAP in MeOH/H2O solutions (2:3, v/v), pH was modified by adding 10% HCl or 10% NaOH.
Molecules 19 07817 g004
Scheme 2. Mechanism of RBAP response to pH.
Molecules 19 07817 g014

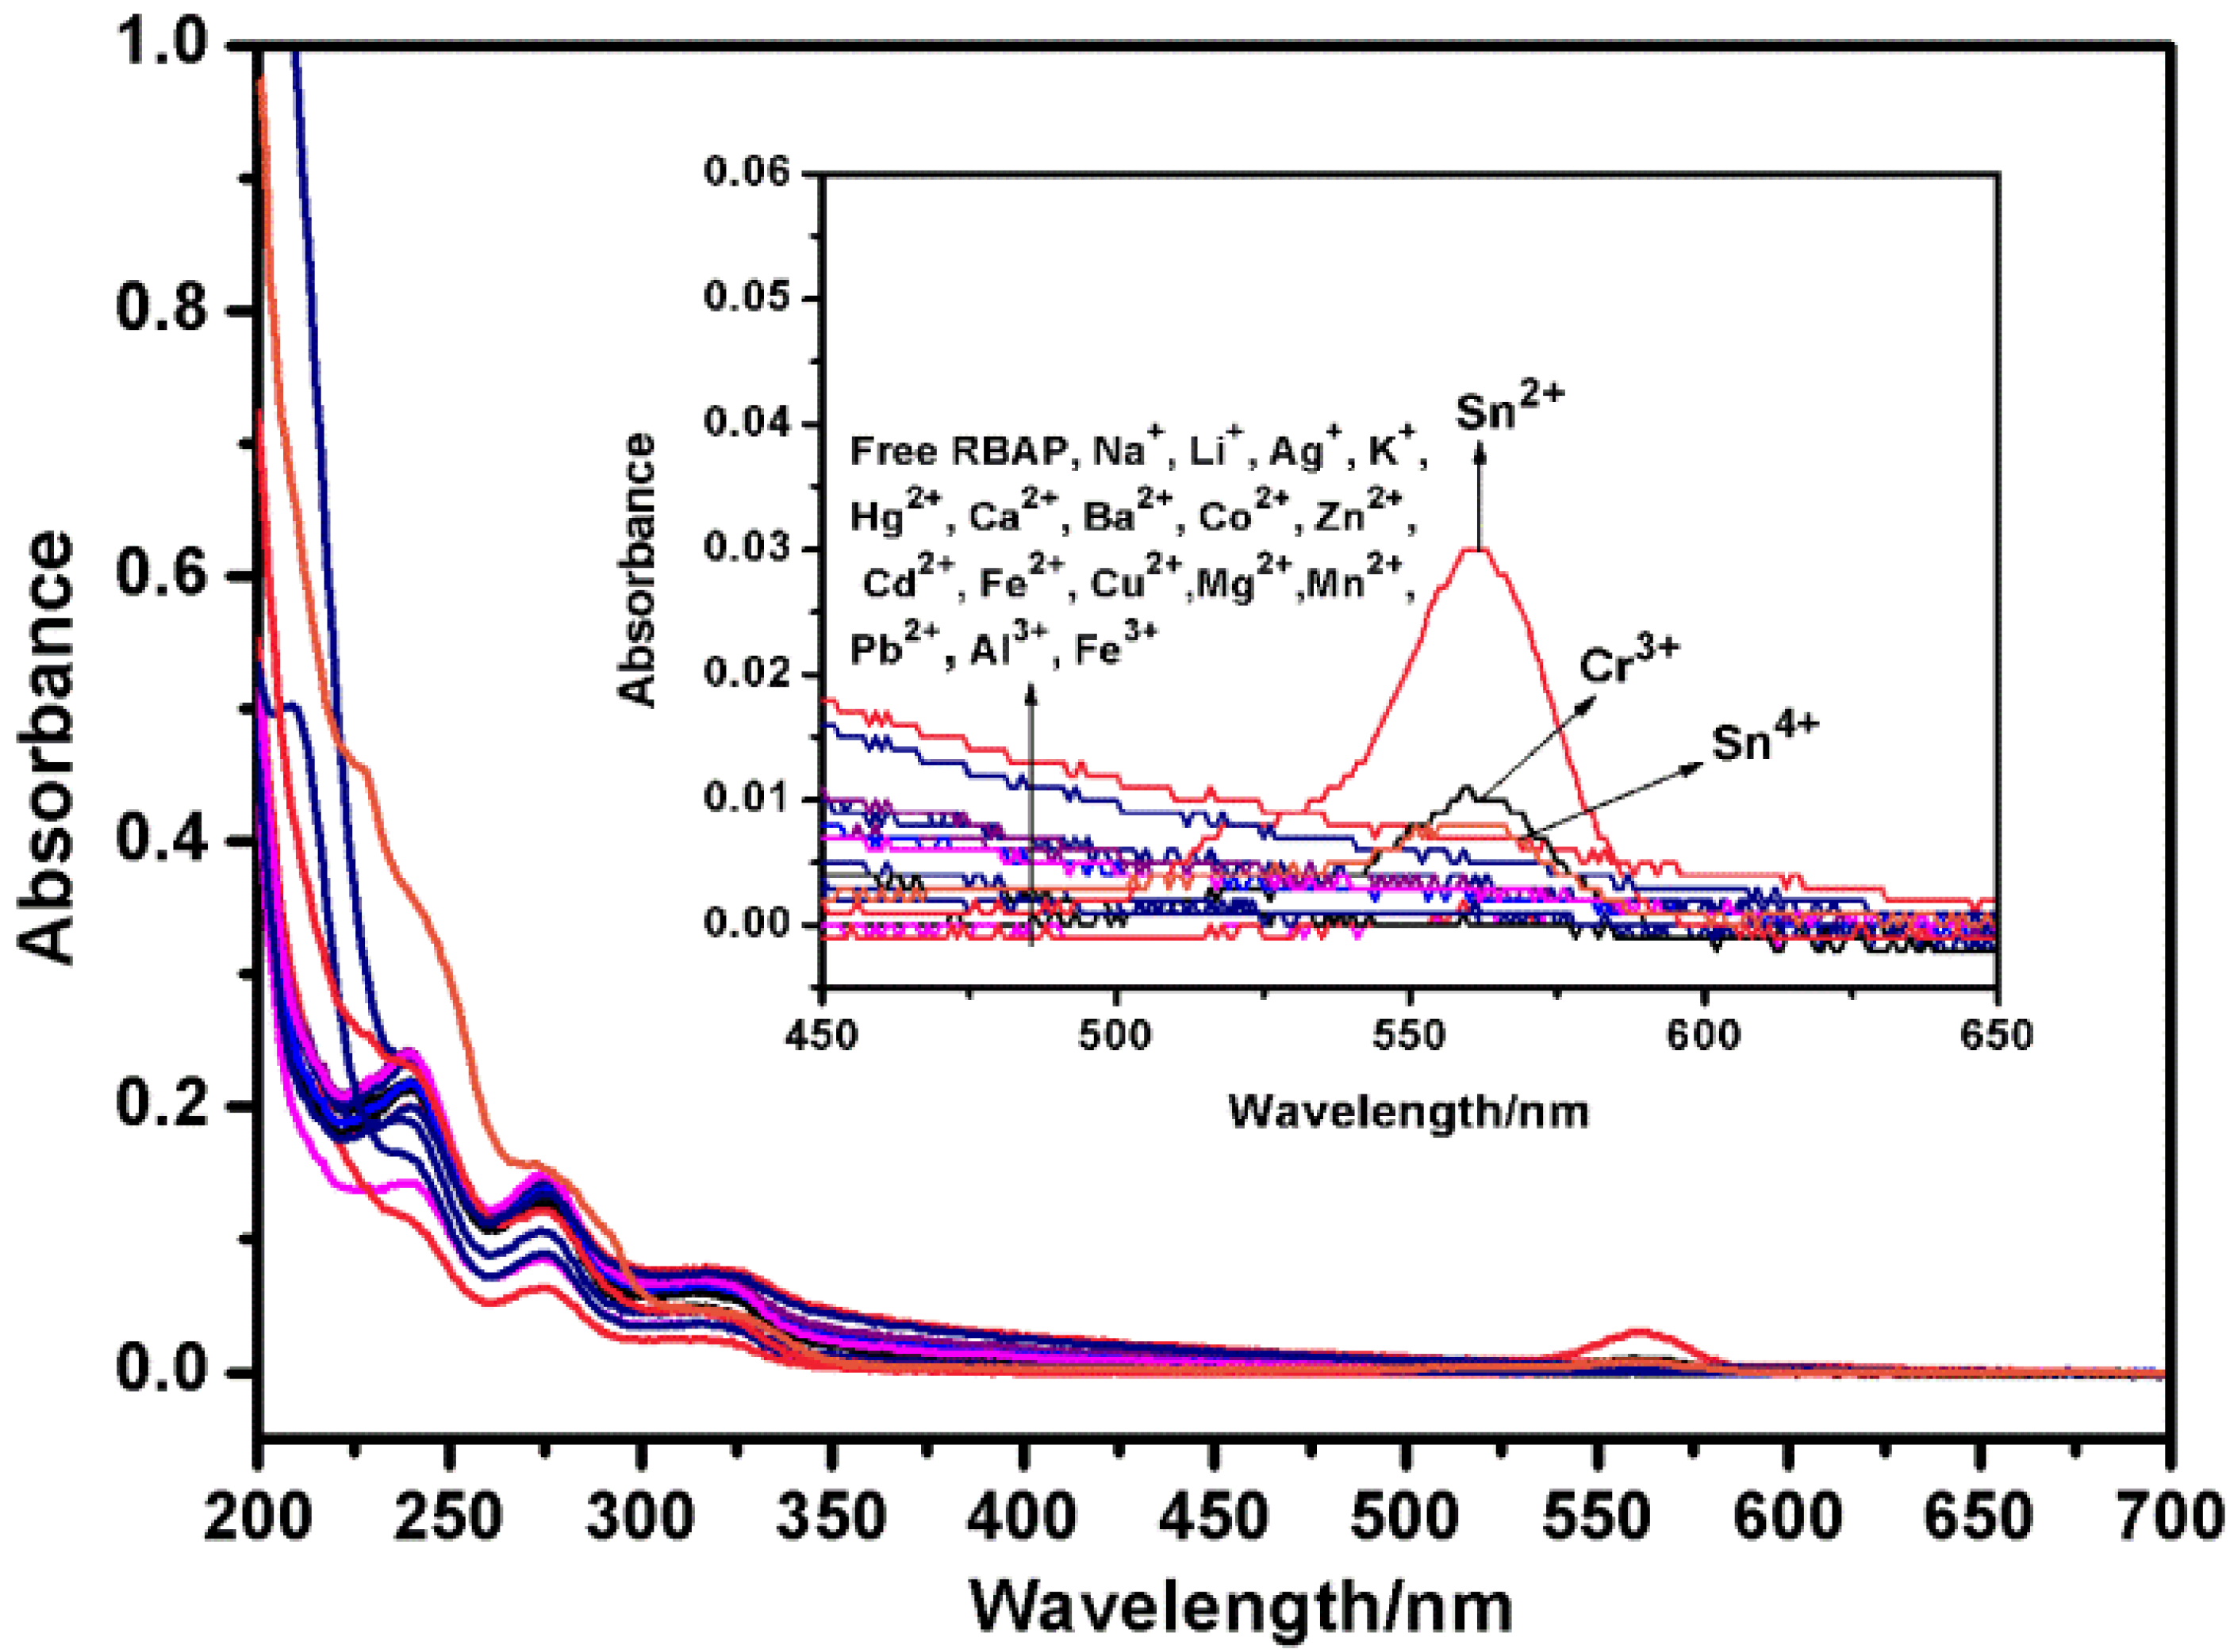
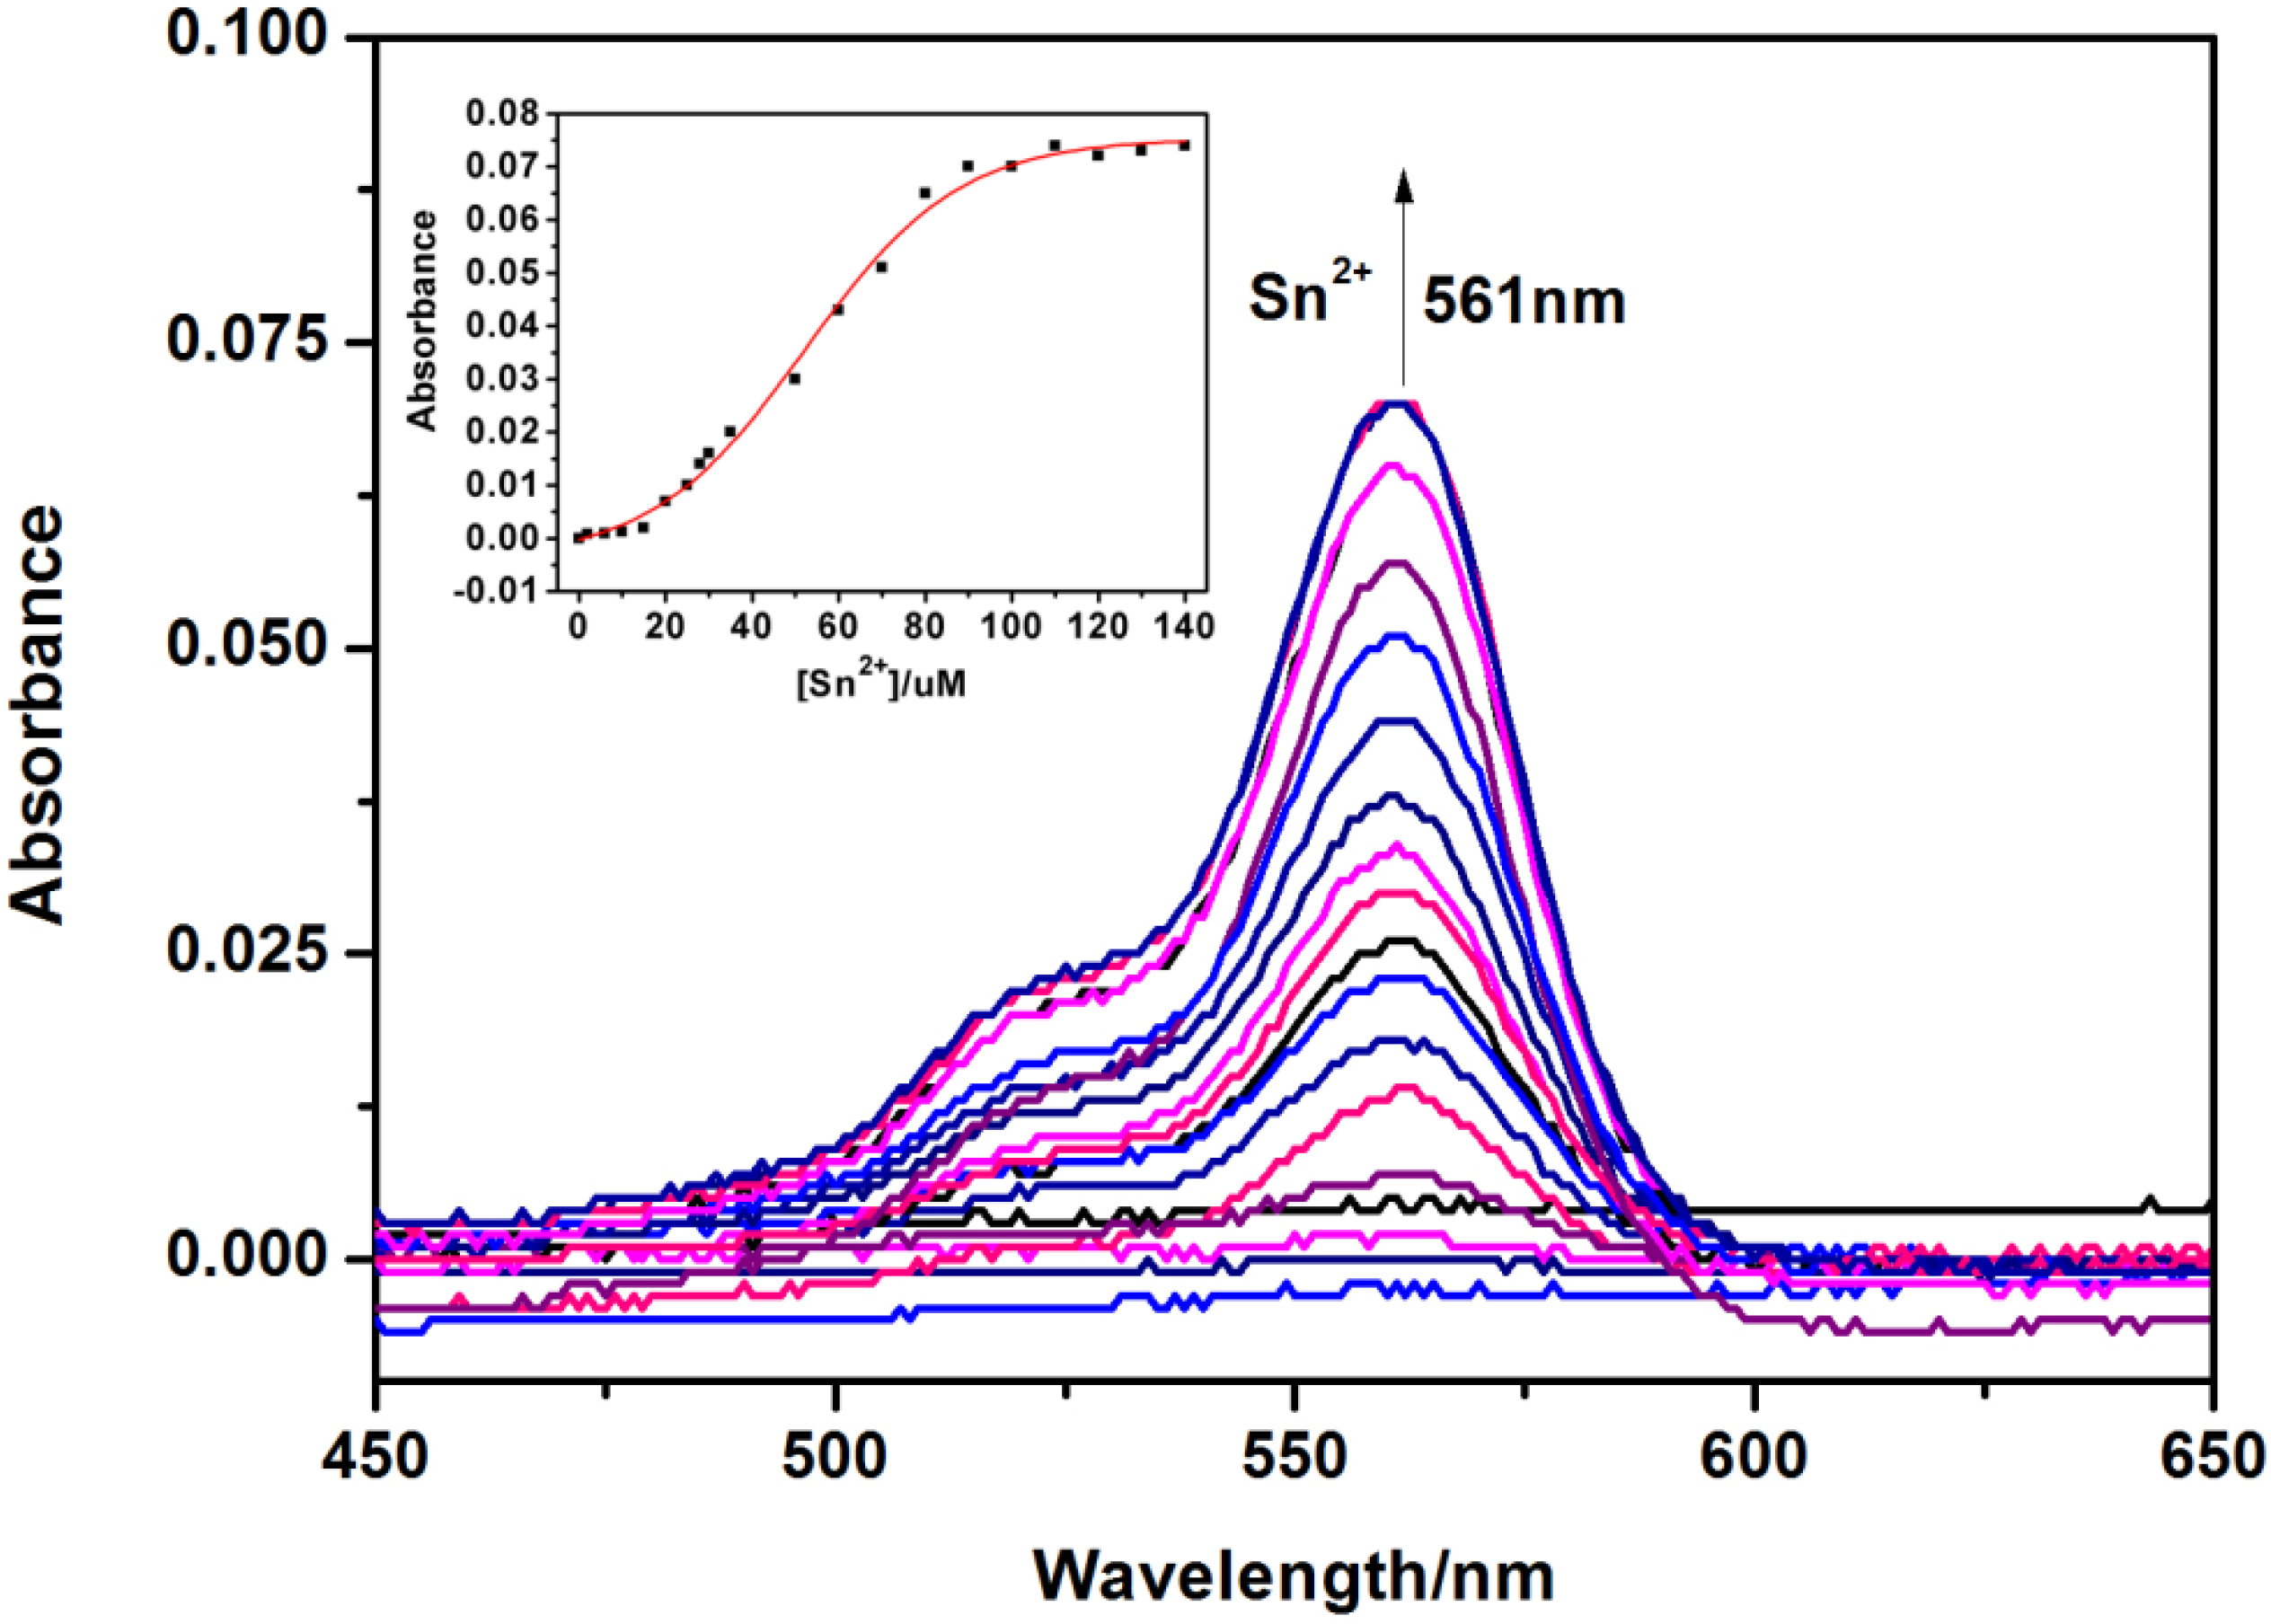
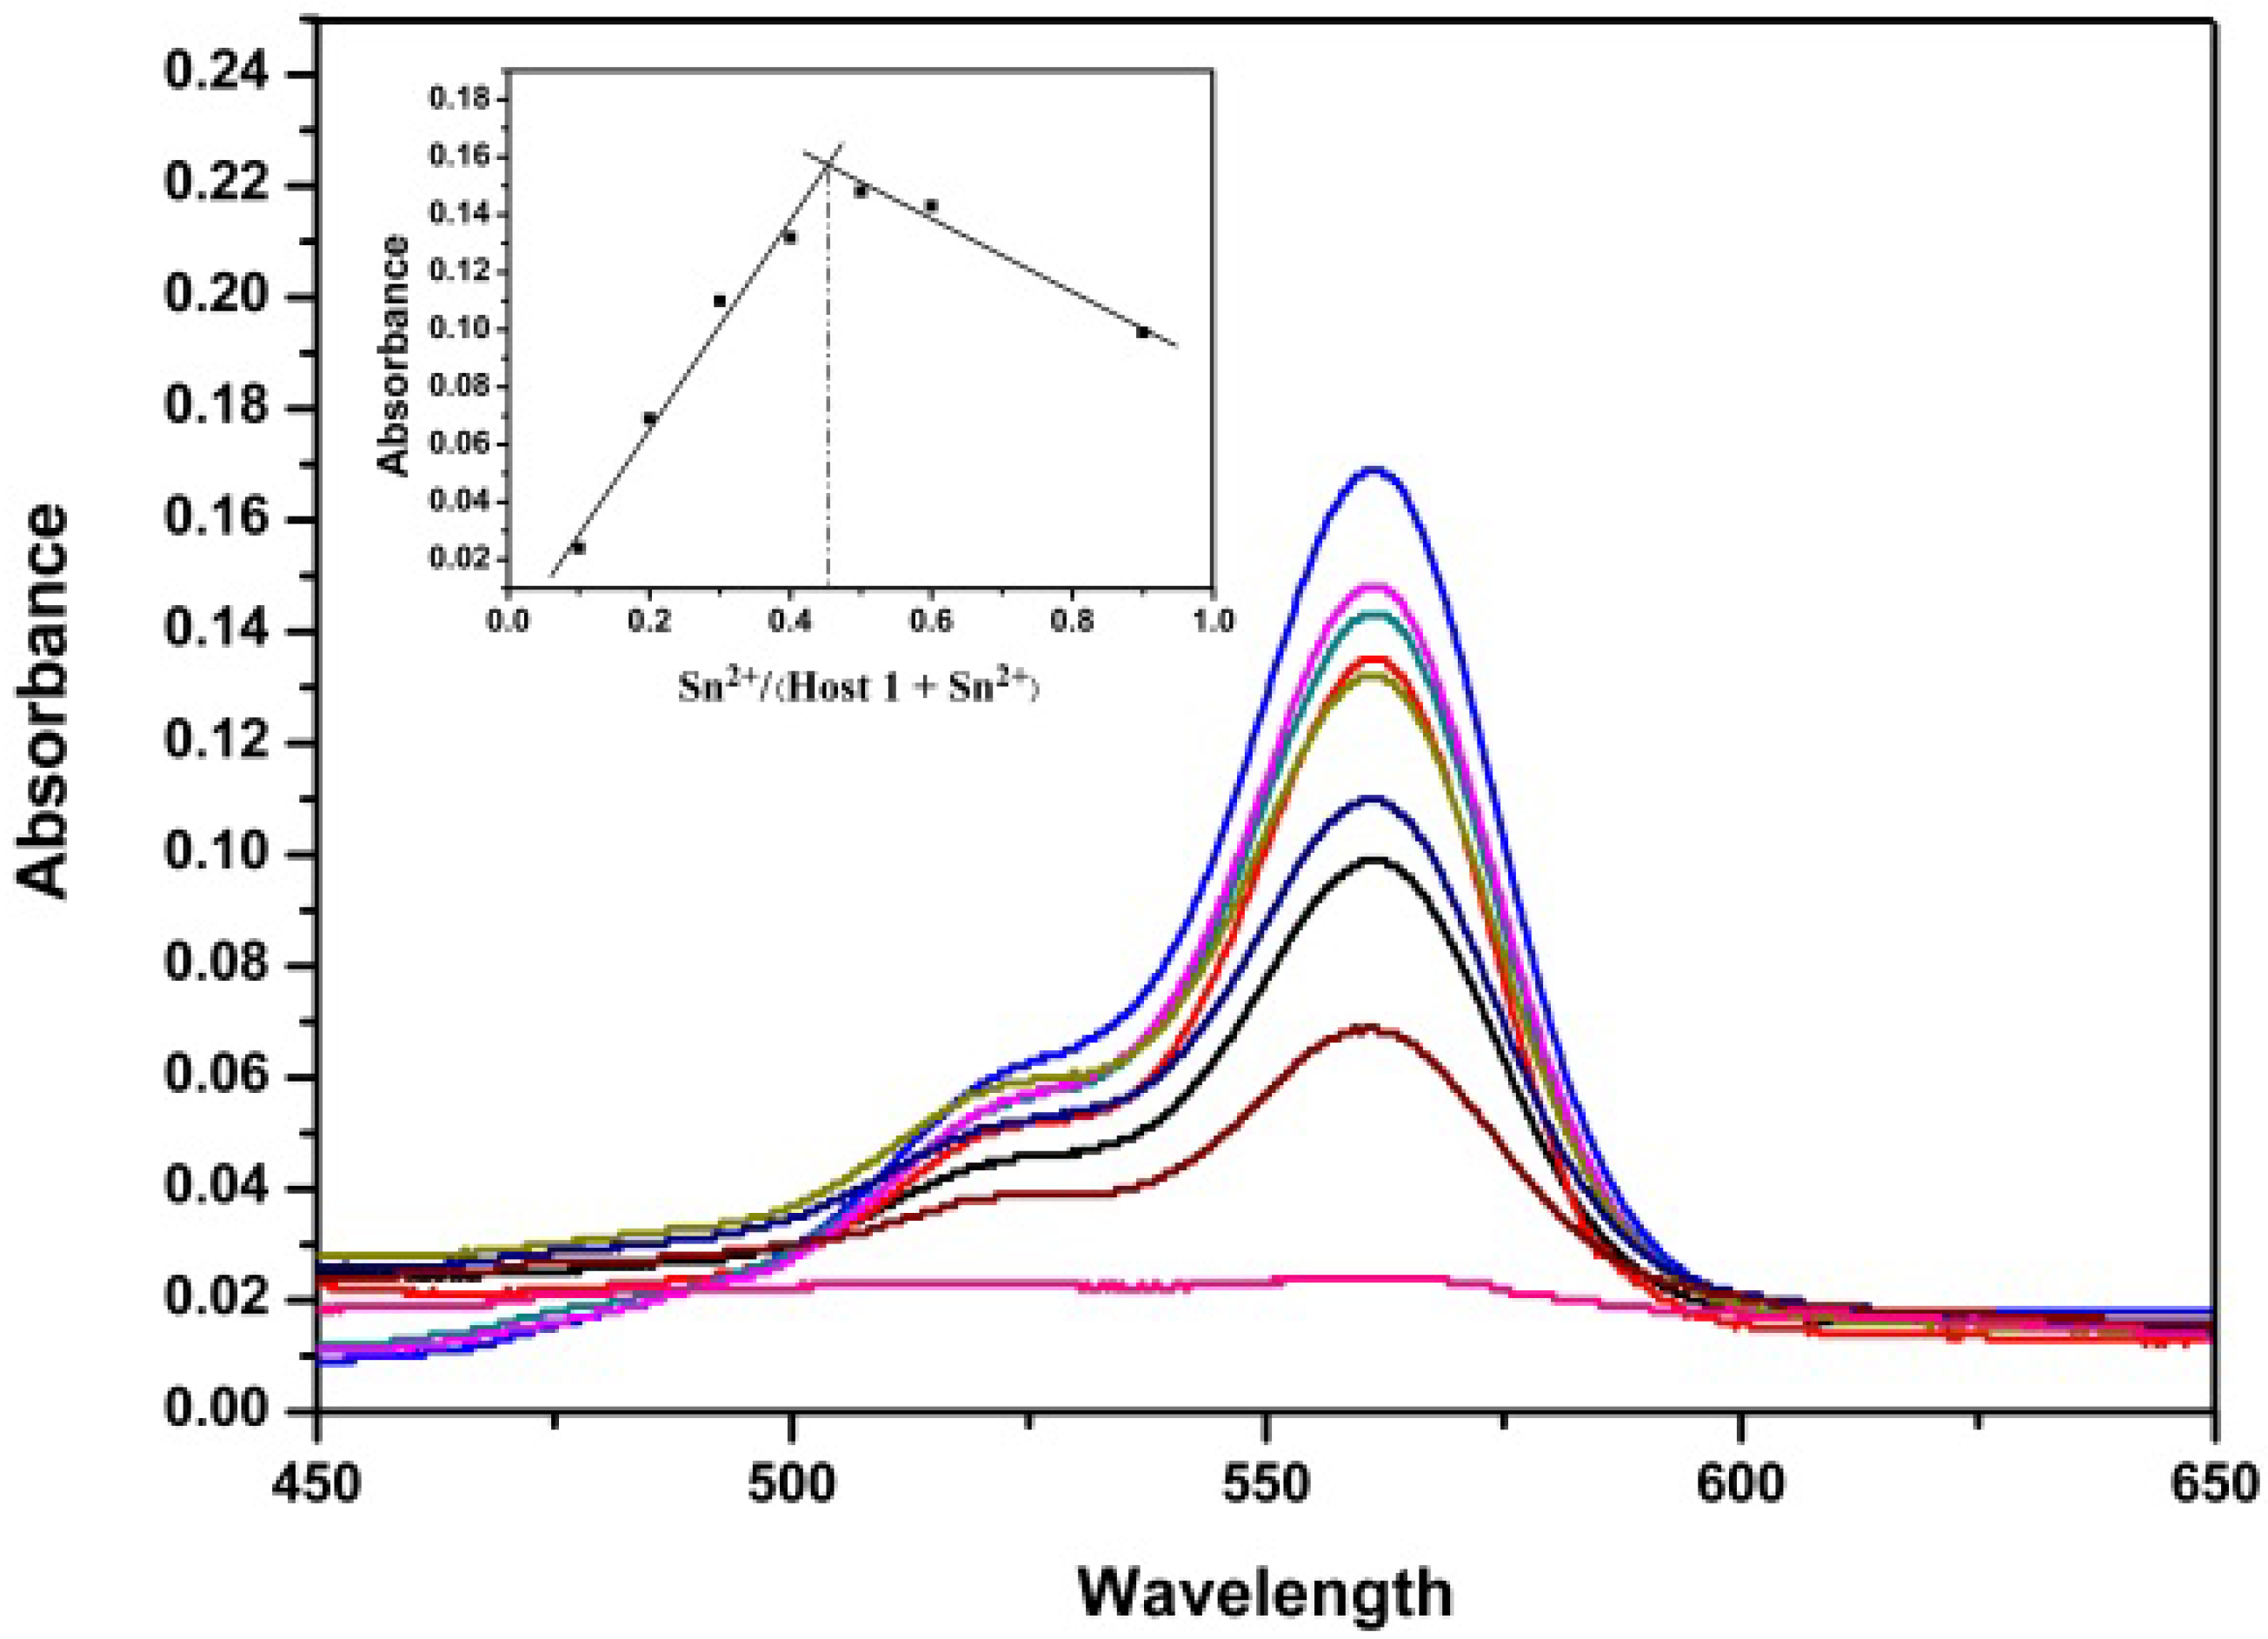
2.4. UV-Vis Titration of RBAP with Metal Ions

To evaluate the selectivity of RBAP for the Sn2+ ion, the binding behavior of RBAP toward different metal cations (Mg2+, Sn2+, Cr3+, Ag+, Ca2+, Na+, Pb2+, K+, Mn2+, Zn2+, Cu2+, Cd2+, Li+, Ba2+, Fe2+, Co2+, Fe3+, Hg2+, Al3+, Sn4+) was studied by UV-Vis spectroscopy. All measurements were made according to the following procedure. Test samples were prepared by placing five equivalents of a metal ion stock solution into 10 μM RBAP in MeOH/H2O (2:3, v/v, pH 5.95) (3 mL) and UV absorption spectra were measured 30 min after metal ion addition. All titration experiments were recorded at room temperature. The absorption wavelength for RBAP was 561 nm. Of the various metal cations examined, RBAP showed a highly selective “off-on” absorption enhancement with Sn2+ at 561 nm. Cr3+ also resulted in a small absorbance at 561 nm, but at a 3-fold lower intensity than Sn2+. All other metal cations yielded very little absorbance at 561 nm (Figure 5).
Figure 5. UV-Vis spectra of RBAP (10 μM) in MeOH/H2O (2:3, v/v, pH 5.95) in the presence and absence of metal cations (50 μM, 5.0 equiv.): Mg2+, Sn2+, Cr3+, Ag+, Ca2+, Na+, Pb2+, K+, Mn2+, Zn2+, Cu2+, Cd2+, Li+, Ba2+, Fe2+, Co2+, Fe3+, Hg2+, Al3+ and Sn4+.
Molecules 19 07817 g005
The absorption spectra of RBAP upon titration with Sn2+ in MeOH/H2O (2:3, v/v, pH 5.95) solution were recorded to gain further insight into the binding of RBAP and Sn2+. When no Sn2+ ions were added to the solution of RBAP, the free RBAP remained colorless and did not exhibit any apparent absorption above 400 nm in MeOH/H2O (2:3, v/v, pH 5.95) solution, indicating that the spirolactam form of RBAP was the predominant species. Upon addition of the Sn2+ ion, a new and strong absorption band centered at 561 nm was observed (Figure 6), resulting in the color change from colorless to pink. This indicated that the ring-opened form of RBAP exists in a significant concentration in the examined solution (Scheme 2).
Figure 6. Changes in the UV-Vis absorption spectra of RBAP (10 μM) in MeOH/H2O (2:3, v/v, pH 5.95) solutions containing various amounts of Sn2+ ions (0–15 eq.). Inset: Absorbance of RBAP at 561 nm as a function of Sn2+ concentration.
Molecules 19 07817 g006
Figure 7. Job’s plot of RBAP in a MeOH/H2O (2:3, v/v) solution, with a total concentration of [RBAP] + Sn2+ = 100 μM and a detection wavelength of 561 nm.
Molecules 19 07817 g007
Next, a Job’s plot was generated by continuously varying the mole fraction of Sn2+ from 0 to 1 in a solution of [Sn2+] + [RBAP] with a total concentration of 100 μM. The Job’s plot analysis exhibited a maximum at approximately 0.5 mole fraction, indicating a 1:1 stoichiometry for the RBAP-Sn2+ complex (Figure 7 inset).

2.5. Fluorescence Titration of RBAP with Metal Ions

To further evaluate the selectivity of RBAP for Sn2+, the change in fluorescence intensity upon the addition of various metal ions under the same conditions was also investigated. The fluorescence spectra of RBAP (10 μM) in MeOH/H2O (2:3, v/v, pH 5.95) displayed a very weak fluorescence at 583 nm (λex = 561 nm), indicating that the predominant form of RBAP was the spirolactam form. When Sn2+ (50 μM, 5 equiv.) was added to the RBAP solution, a fluorescence enhancement of greater than 300-fold was observed (Figure 8), indicating that the Sn2+ ion induced the formation of the ring-opened RBAP-Sn2+ complex, which exhibited strong fluorescence (Scheme 3) The solution changed from colorless to pink. (Figure 8 inset) other various metal ions (Mg2+, Sn2+, Cr3+, Ag+, Ca2+, Na+, Pb2+, K+, Mn2+, Zn2+, Cu2+, Cd2+, Li+, Ba2+, Fe2+, Co2+, Fe3+, Hg2+, Al3+ and Sn4+) did not induce any apparent fluorescence enhancement after the addition of five equiv. of the metal ions.
Figure 8. Fluorescence emission changes of RBAP (10 μM) with metal cations (50 μM, 5.0 equiv.) in MeOH/H2O (2:3, v/v, pH 5.95) at 583 nm, Black bars represent the fluorescence intensity of RBAP with: 1-none; 2-Sn2+; 3-Cr3+; 4-Ca2+; 5-Ag+; 6-Mg2+; 7-K+; 8-Ba2+; 9-Co2+; 10-Zn2+; 11-Li+; 12-Cd2+; 13-Fe2+; 14-Cu2+; 15-Mn2+; 16-Pb2+; 17-Na+, 18-Fe3+, 19-Hg2+, 20-Al3+, 21-Sn4+.
Molecules 19 07817 g008
Scheme 3. Proposed complexation mechanism of RBAP with Sn2+.
Molecules 19 07817 g015

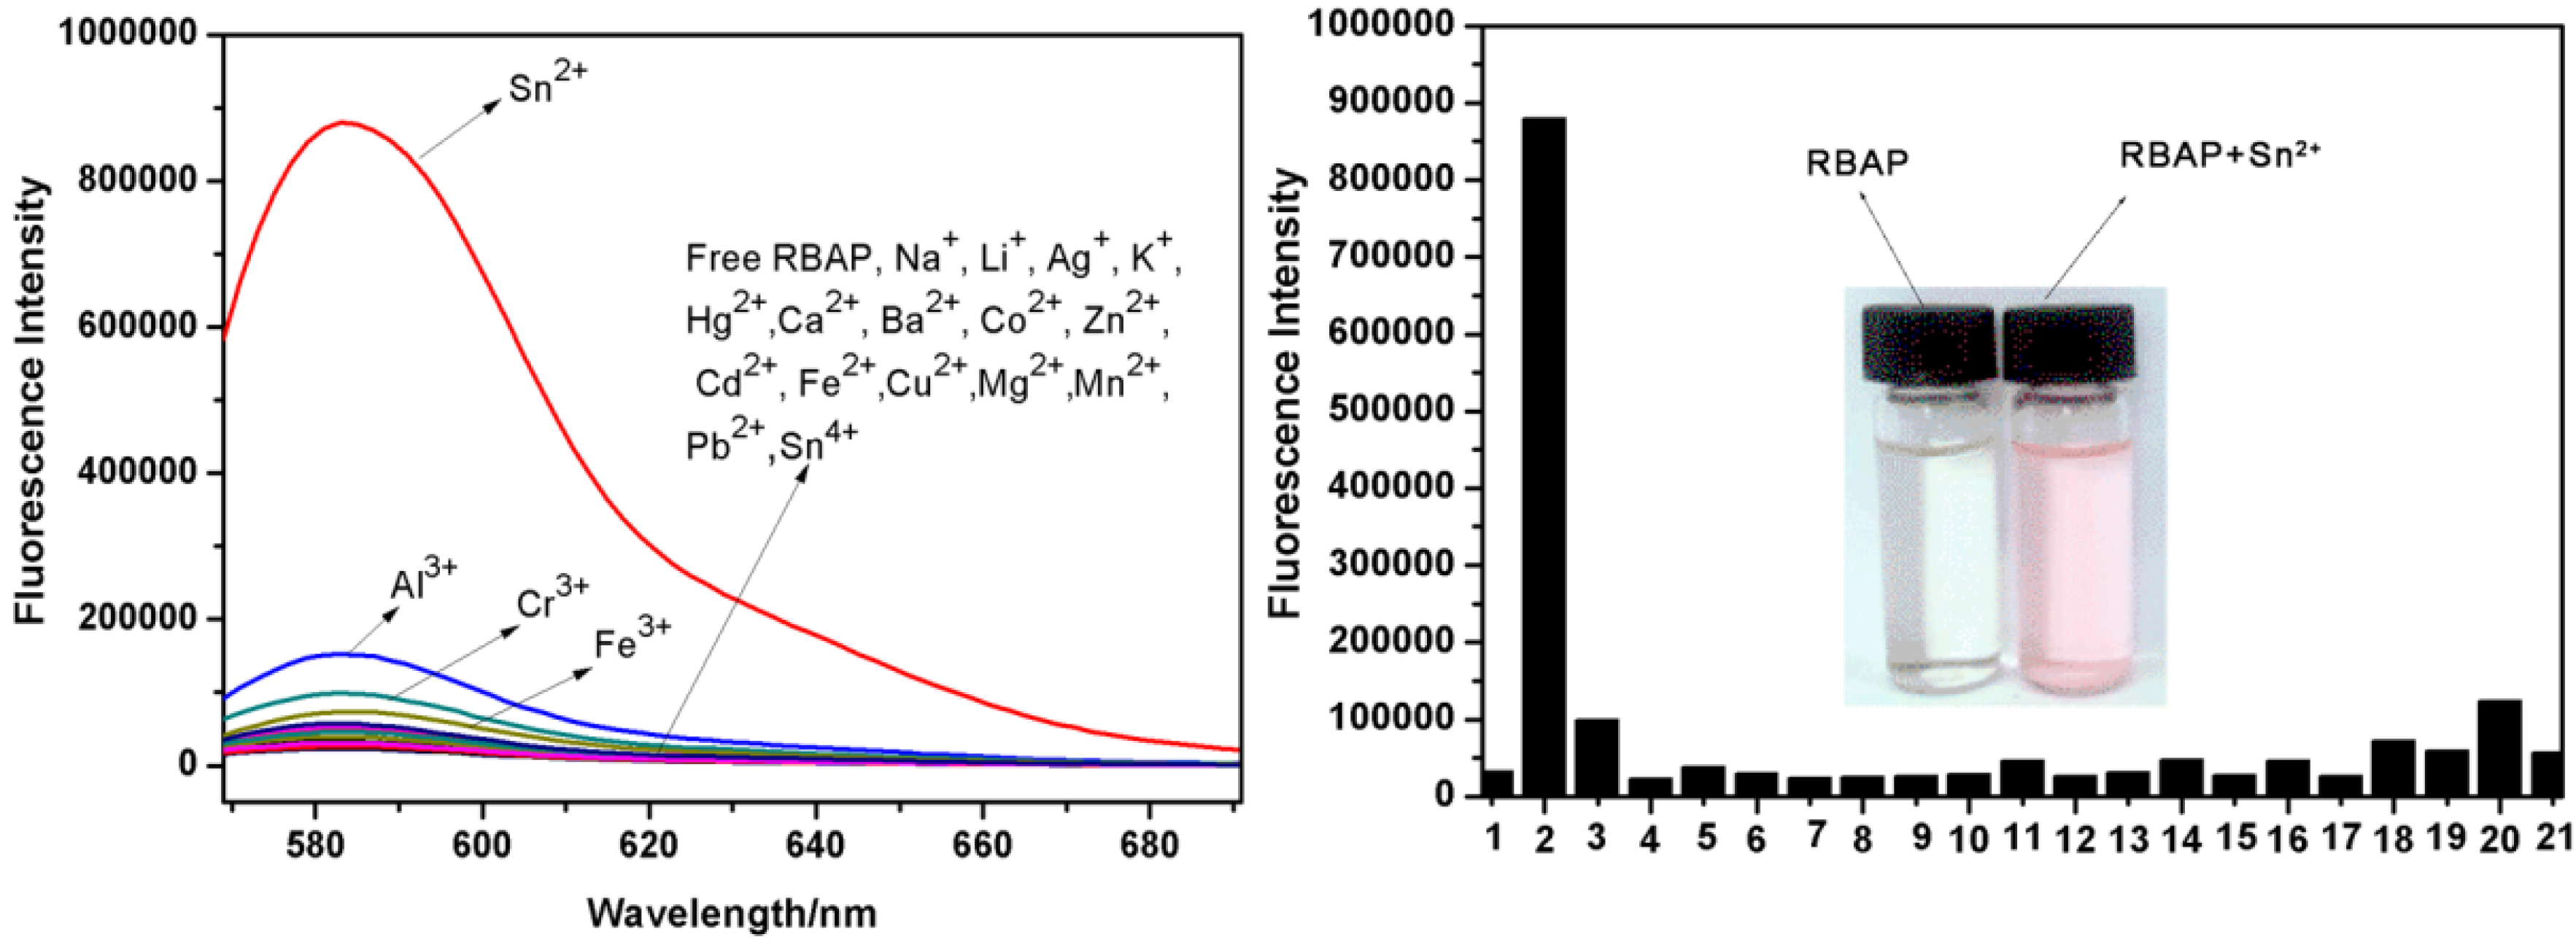
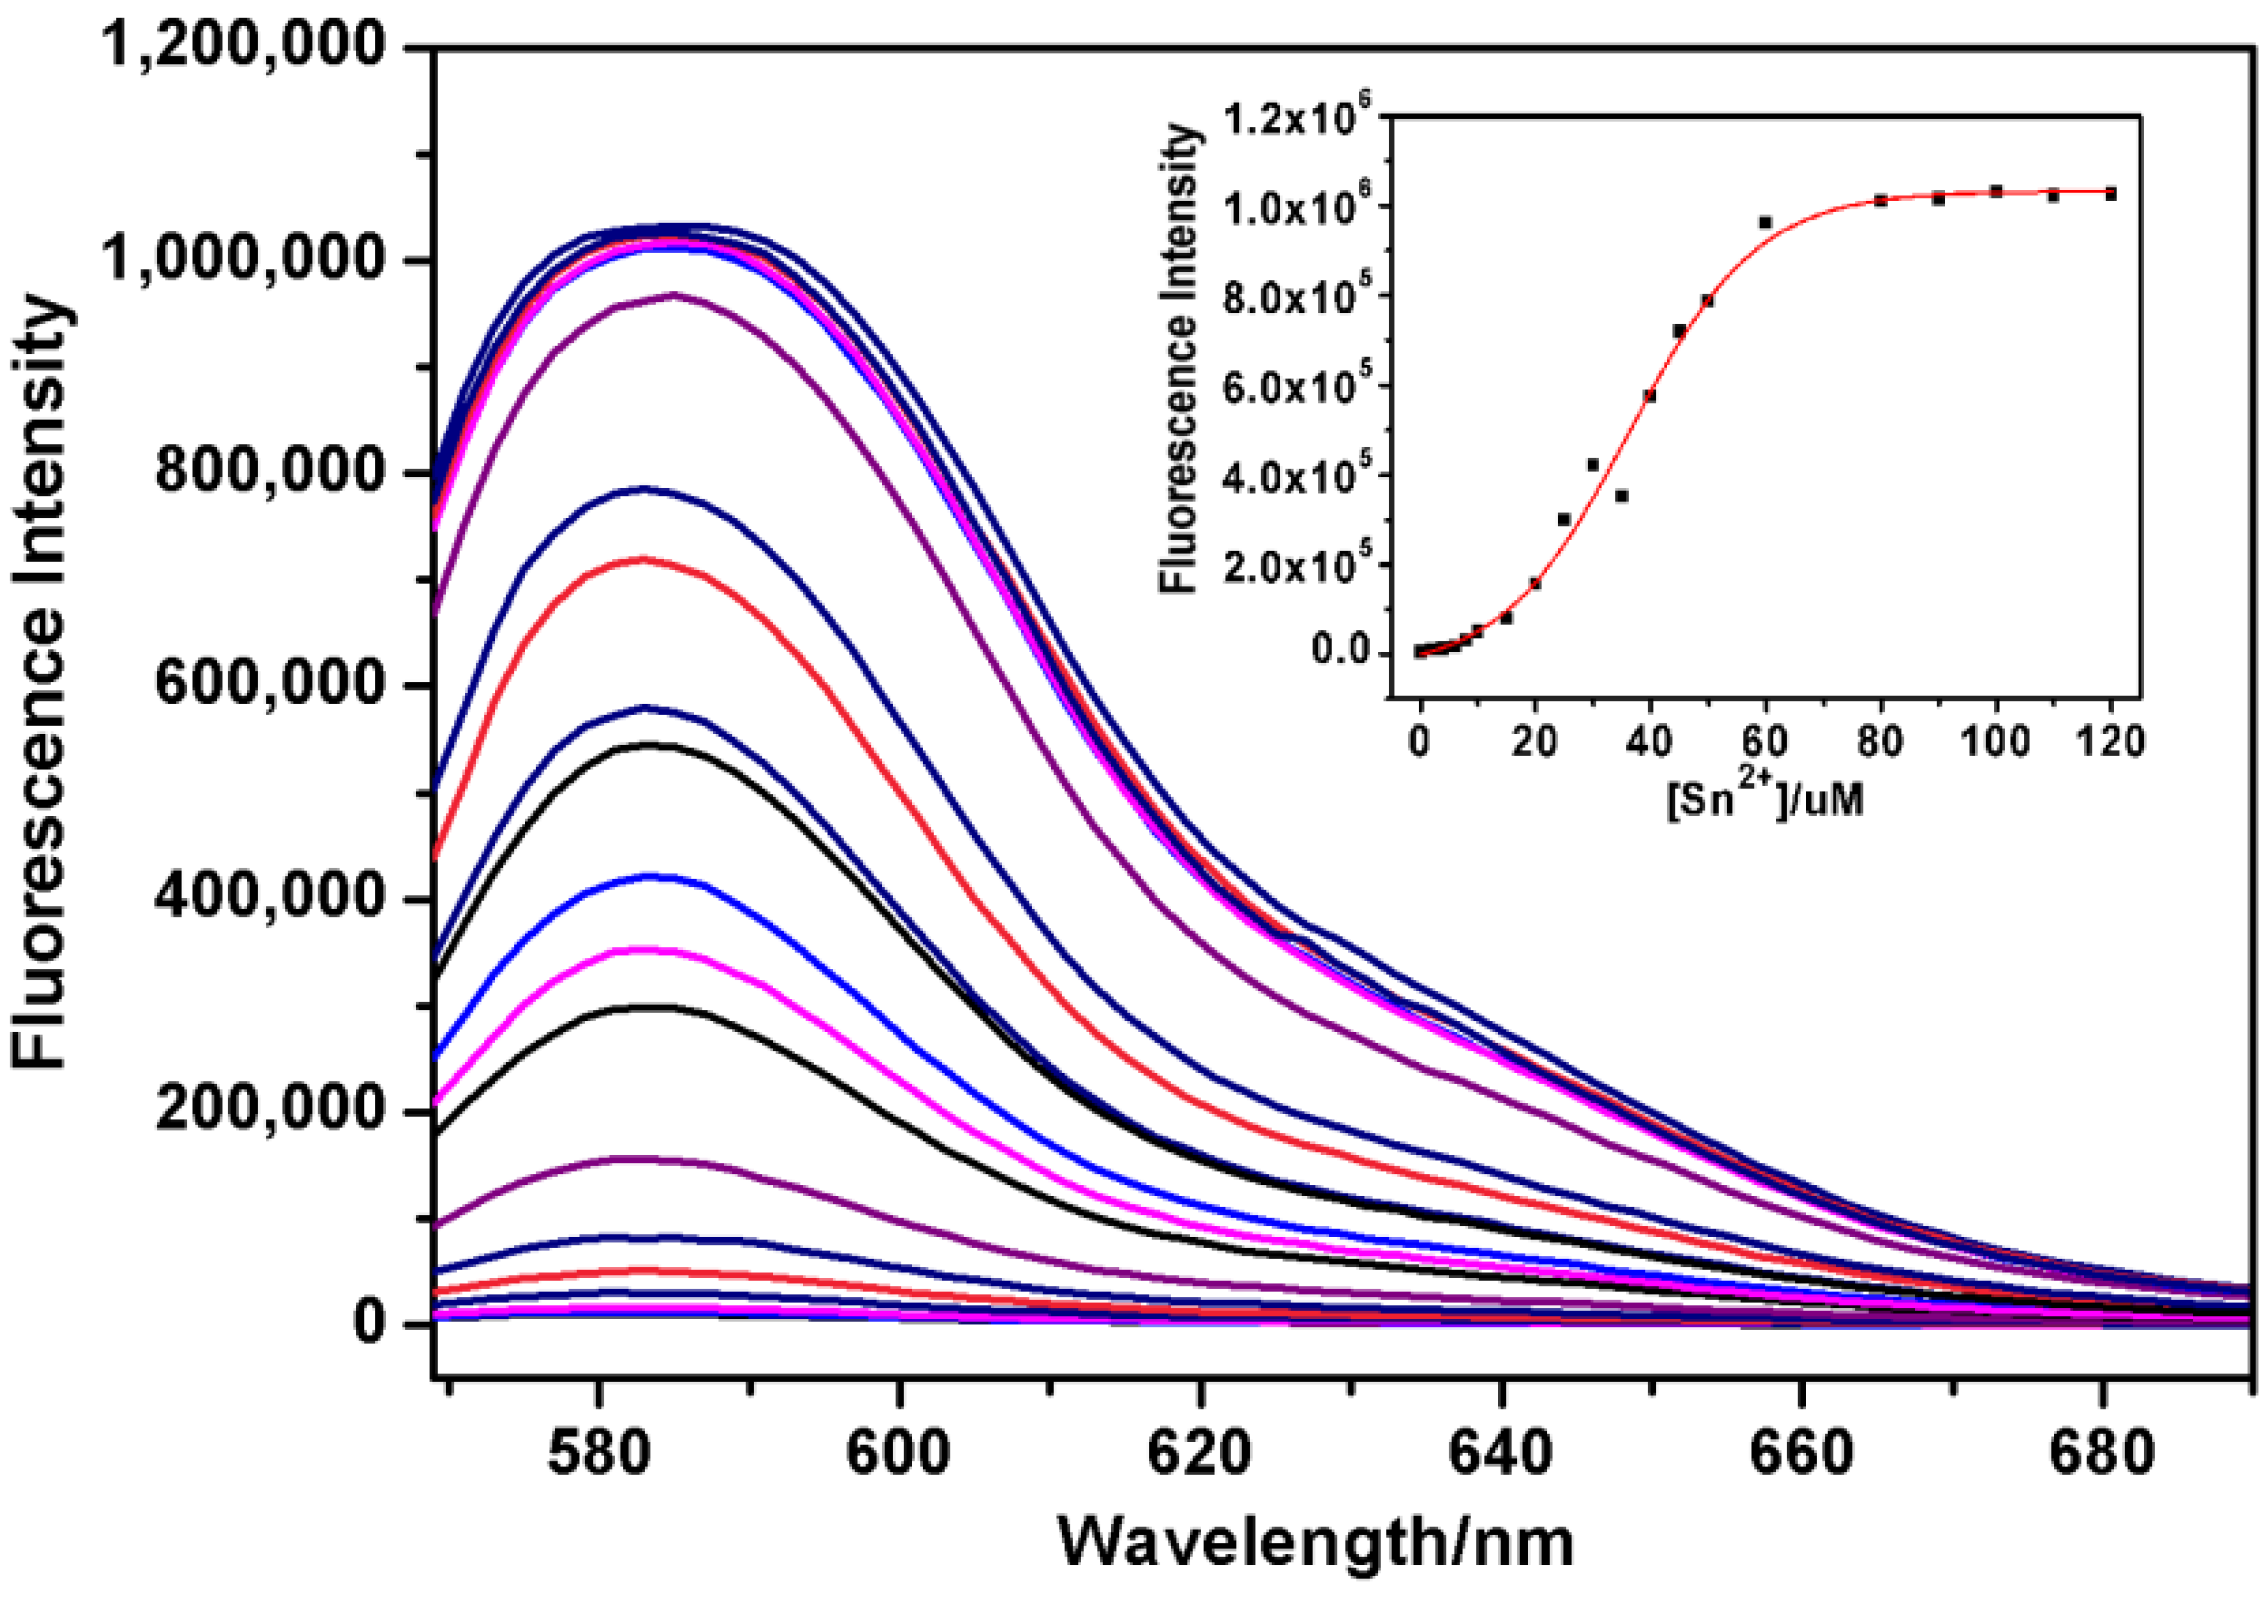
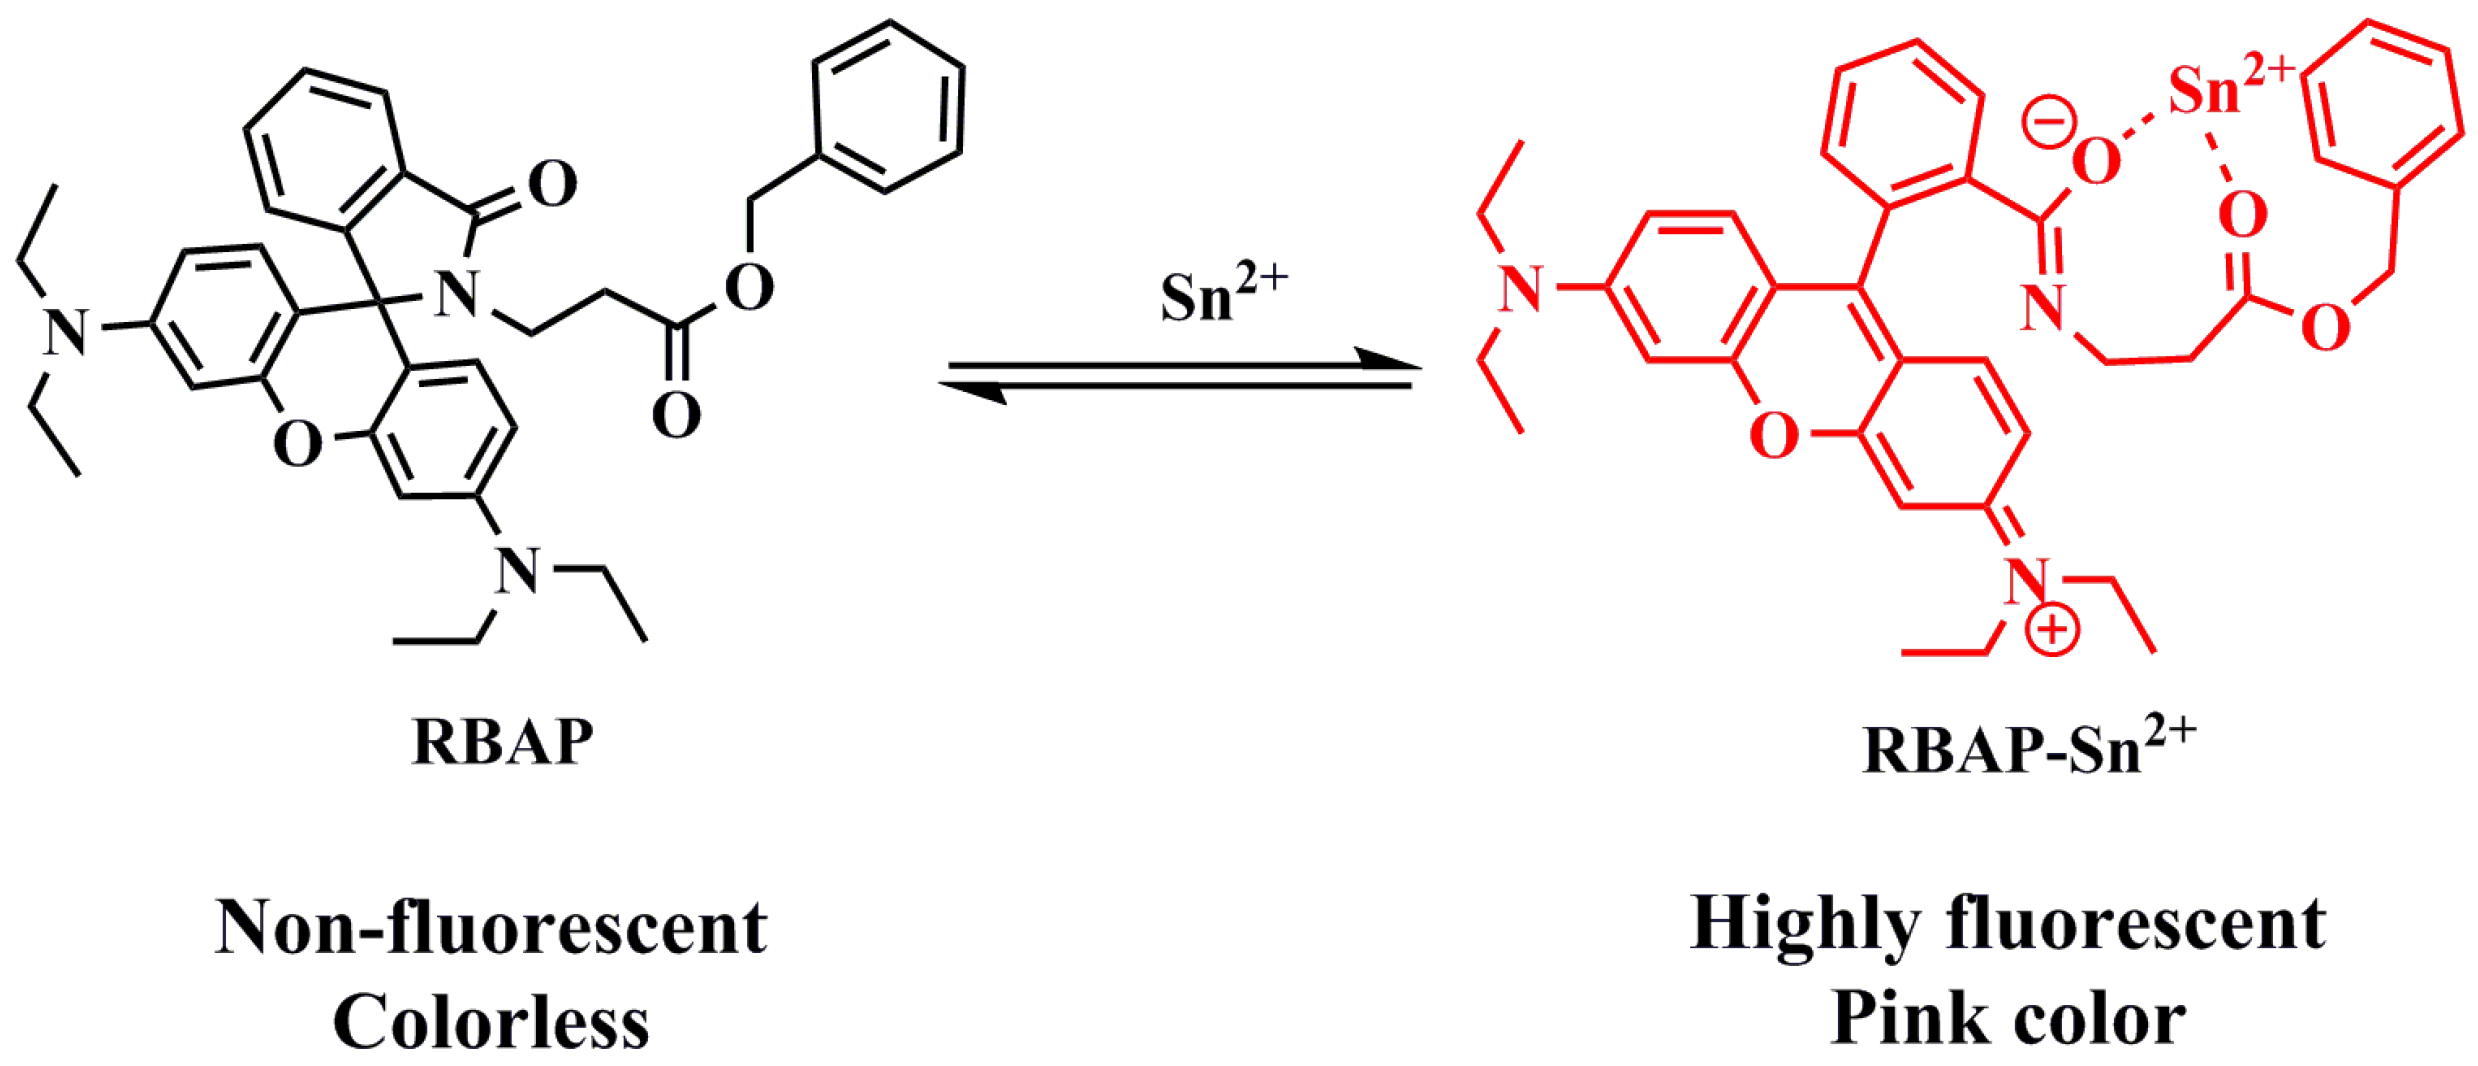
2.6. Fluorescence Titration of RBAP with Sn2+

Figure 9 displays the fluorescence spectrum of RBAP in the presence of different concentrations of Sn2+. The free RBAP chemosensor (10 μM) exhibited a very weak fluorescence (λex = 561 nm) at 583 nm. The titration of Sn2+ with RBAP led to a rapid increase in the emission intensity at 583 nm. Over a 300-fold fluorescence enhancement was observed under saturation conditions (10 equiv.). The association constant was also calculated using the following formula: F − F0 = △F = [Sn2+] (Fmax − F0)/(1/Ka + [Sn2+]) based on a 1:1 stoichiometry, where F is the obtained fluorescence intensity, F0 is the fluorescence intensity of free RBAP at the emission wavelength, and Fmax is the saturated fluorescence intensity for RBAP-Sn2+ complex. When the reciprocal of △F was plotted as a function of Sn2+ concentration, a linear relationship was obtained (y = A + Bx), and Ka was calculated from A/B. Therefore, the binding association constant for Sn2+, Ka, was estimated to be 2.65 × 10⁴ M−1 in the MeOH/H2O (2:3, v/v, pH 5.95) solution, as inferred from the fluorescence titration curves of RBAP with the Sn2+ ion. The detection limit of Sn2+ by RBAP was determined to be 0.044 μM (Supporting Materials, S5).
Figure 9. Changes in the fluorescence intensity of RBAP in MeOH/H2O (2:3, v/v, pH 5.95) upon the addition of Sn2+. λex = 561 nm. Inset: Plot of fluorescence intensities at 583 nm upon the addition of Sn2+.
Molecules 19 07817 g009

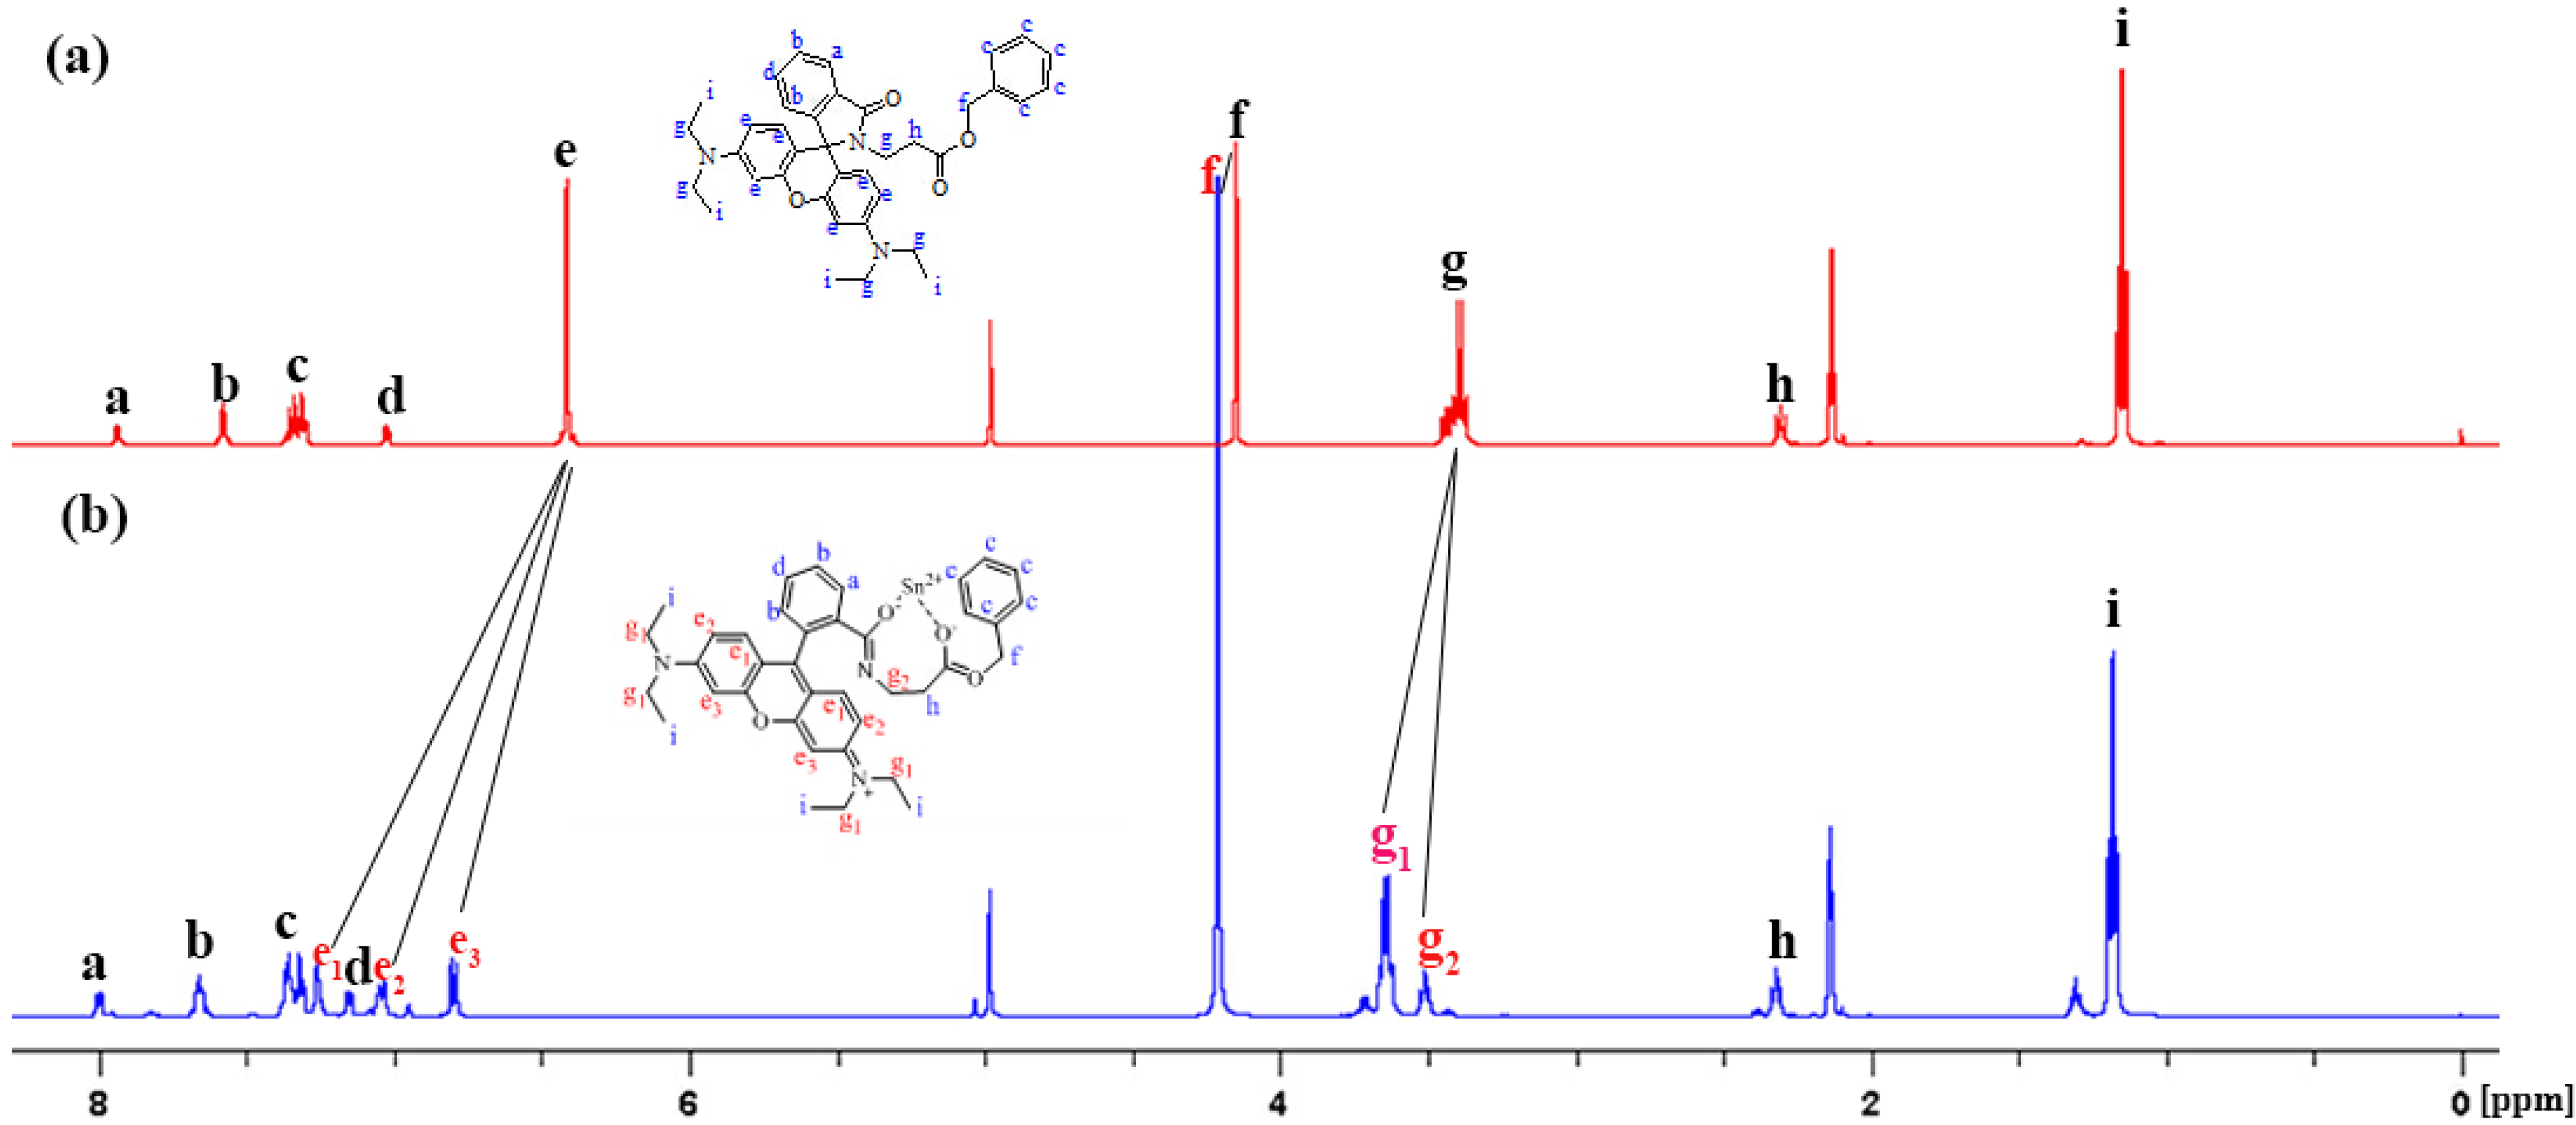
2.7. NMR Study of RBAP with Sn2+

To further elucidate the binding mode of RBAP with Sn2+, 1H-NMR spectra of RBAP in the presence and absence of Sn2+ were acquired. As shown in Figure 10, after the addition of 1 equiv. of Sn2+ into a solution of RBAP in acetone-d6:D2O (5:1, v/v), The singlet peak of Hf proton displayed a downfield shift from 4.15 ppm to 4.21 ppm (Δδ = 0.06 ppm), which originates from the coordination of the carbonyl oxygen of ester group on RBAP with Sn2+. In addition, the Hg multiplet, (the signals of Hg1 and Hg2 overlapped) displayed an apparent downfield shift and signal splitting from one multiplet peak centered at 3.41 ppm to two multiplet peaks centered at 3.65 ppm (Δδ = 0.24 ppm) and 3.50 ppm (Δδ = 0.09 ppm), and the singlet peak of the symmetric He proton also displayed a significant downfield shift and signal splitting, from a peak centered at 6.4 ppm to three doublets peaks centered at 6.78 ppm (Δδ = 0.38 ppm), 7.0 ppm (Δδ = 0.60 ppm) and 7.31 ppm (Δδ = 0.91 ppm), due to the Sn2+ ion-induced ring-opening process of the rhodamine B spirocycle. (Supporting Materials Figure S3). The above results indicate an interaction mode of RBAP and Sn2+ as proposed in Scheme 3, in which Sn2+ is coordinated with the two carbonyl oxygen atoms of RBAP.
Figure 10. 1H-NMR spectra (500 MHz, 298 K, acetone-d6:D2O (5:1, v/v) of (a) RBAP and (b) RBAP + 1 equiv. Sn2+.
Molecules 19 07817 g010

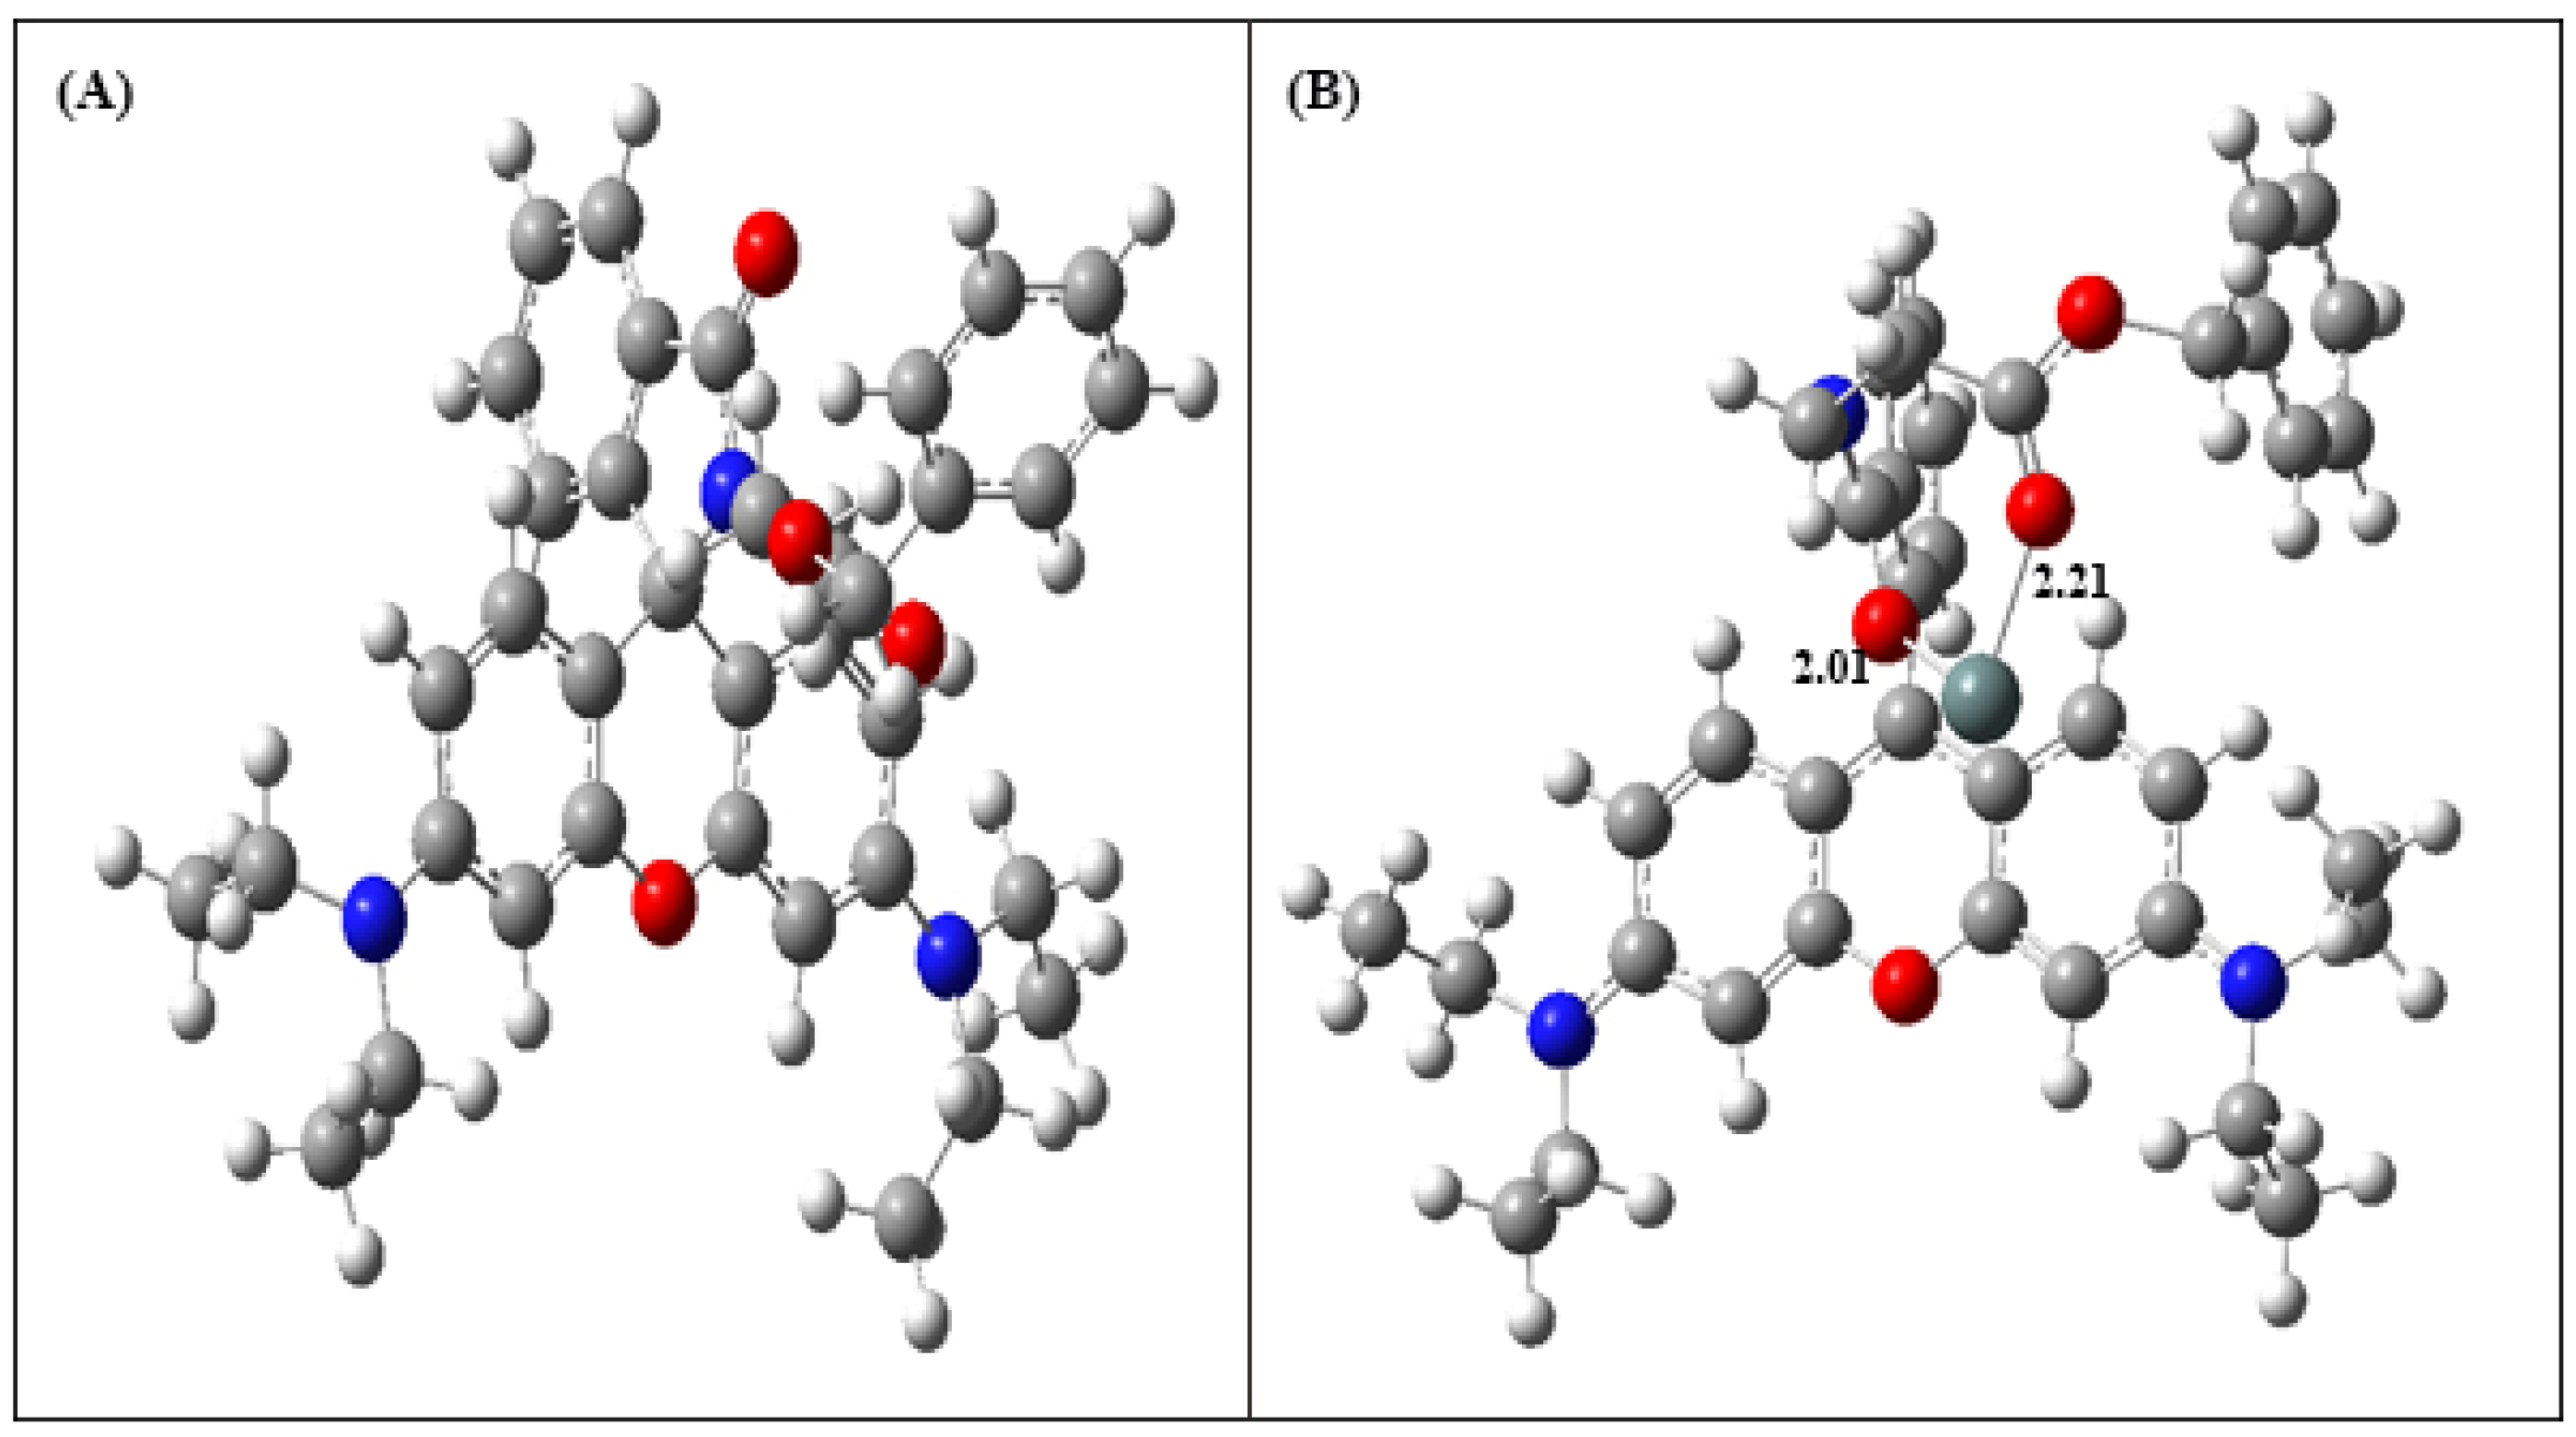
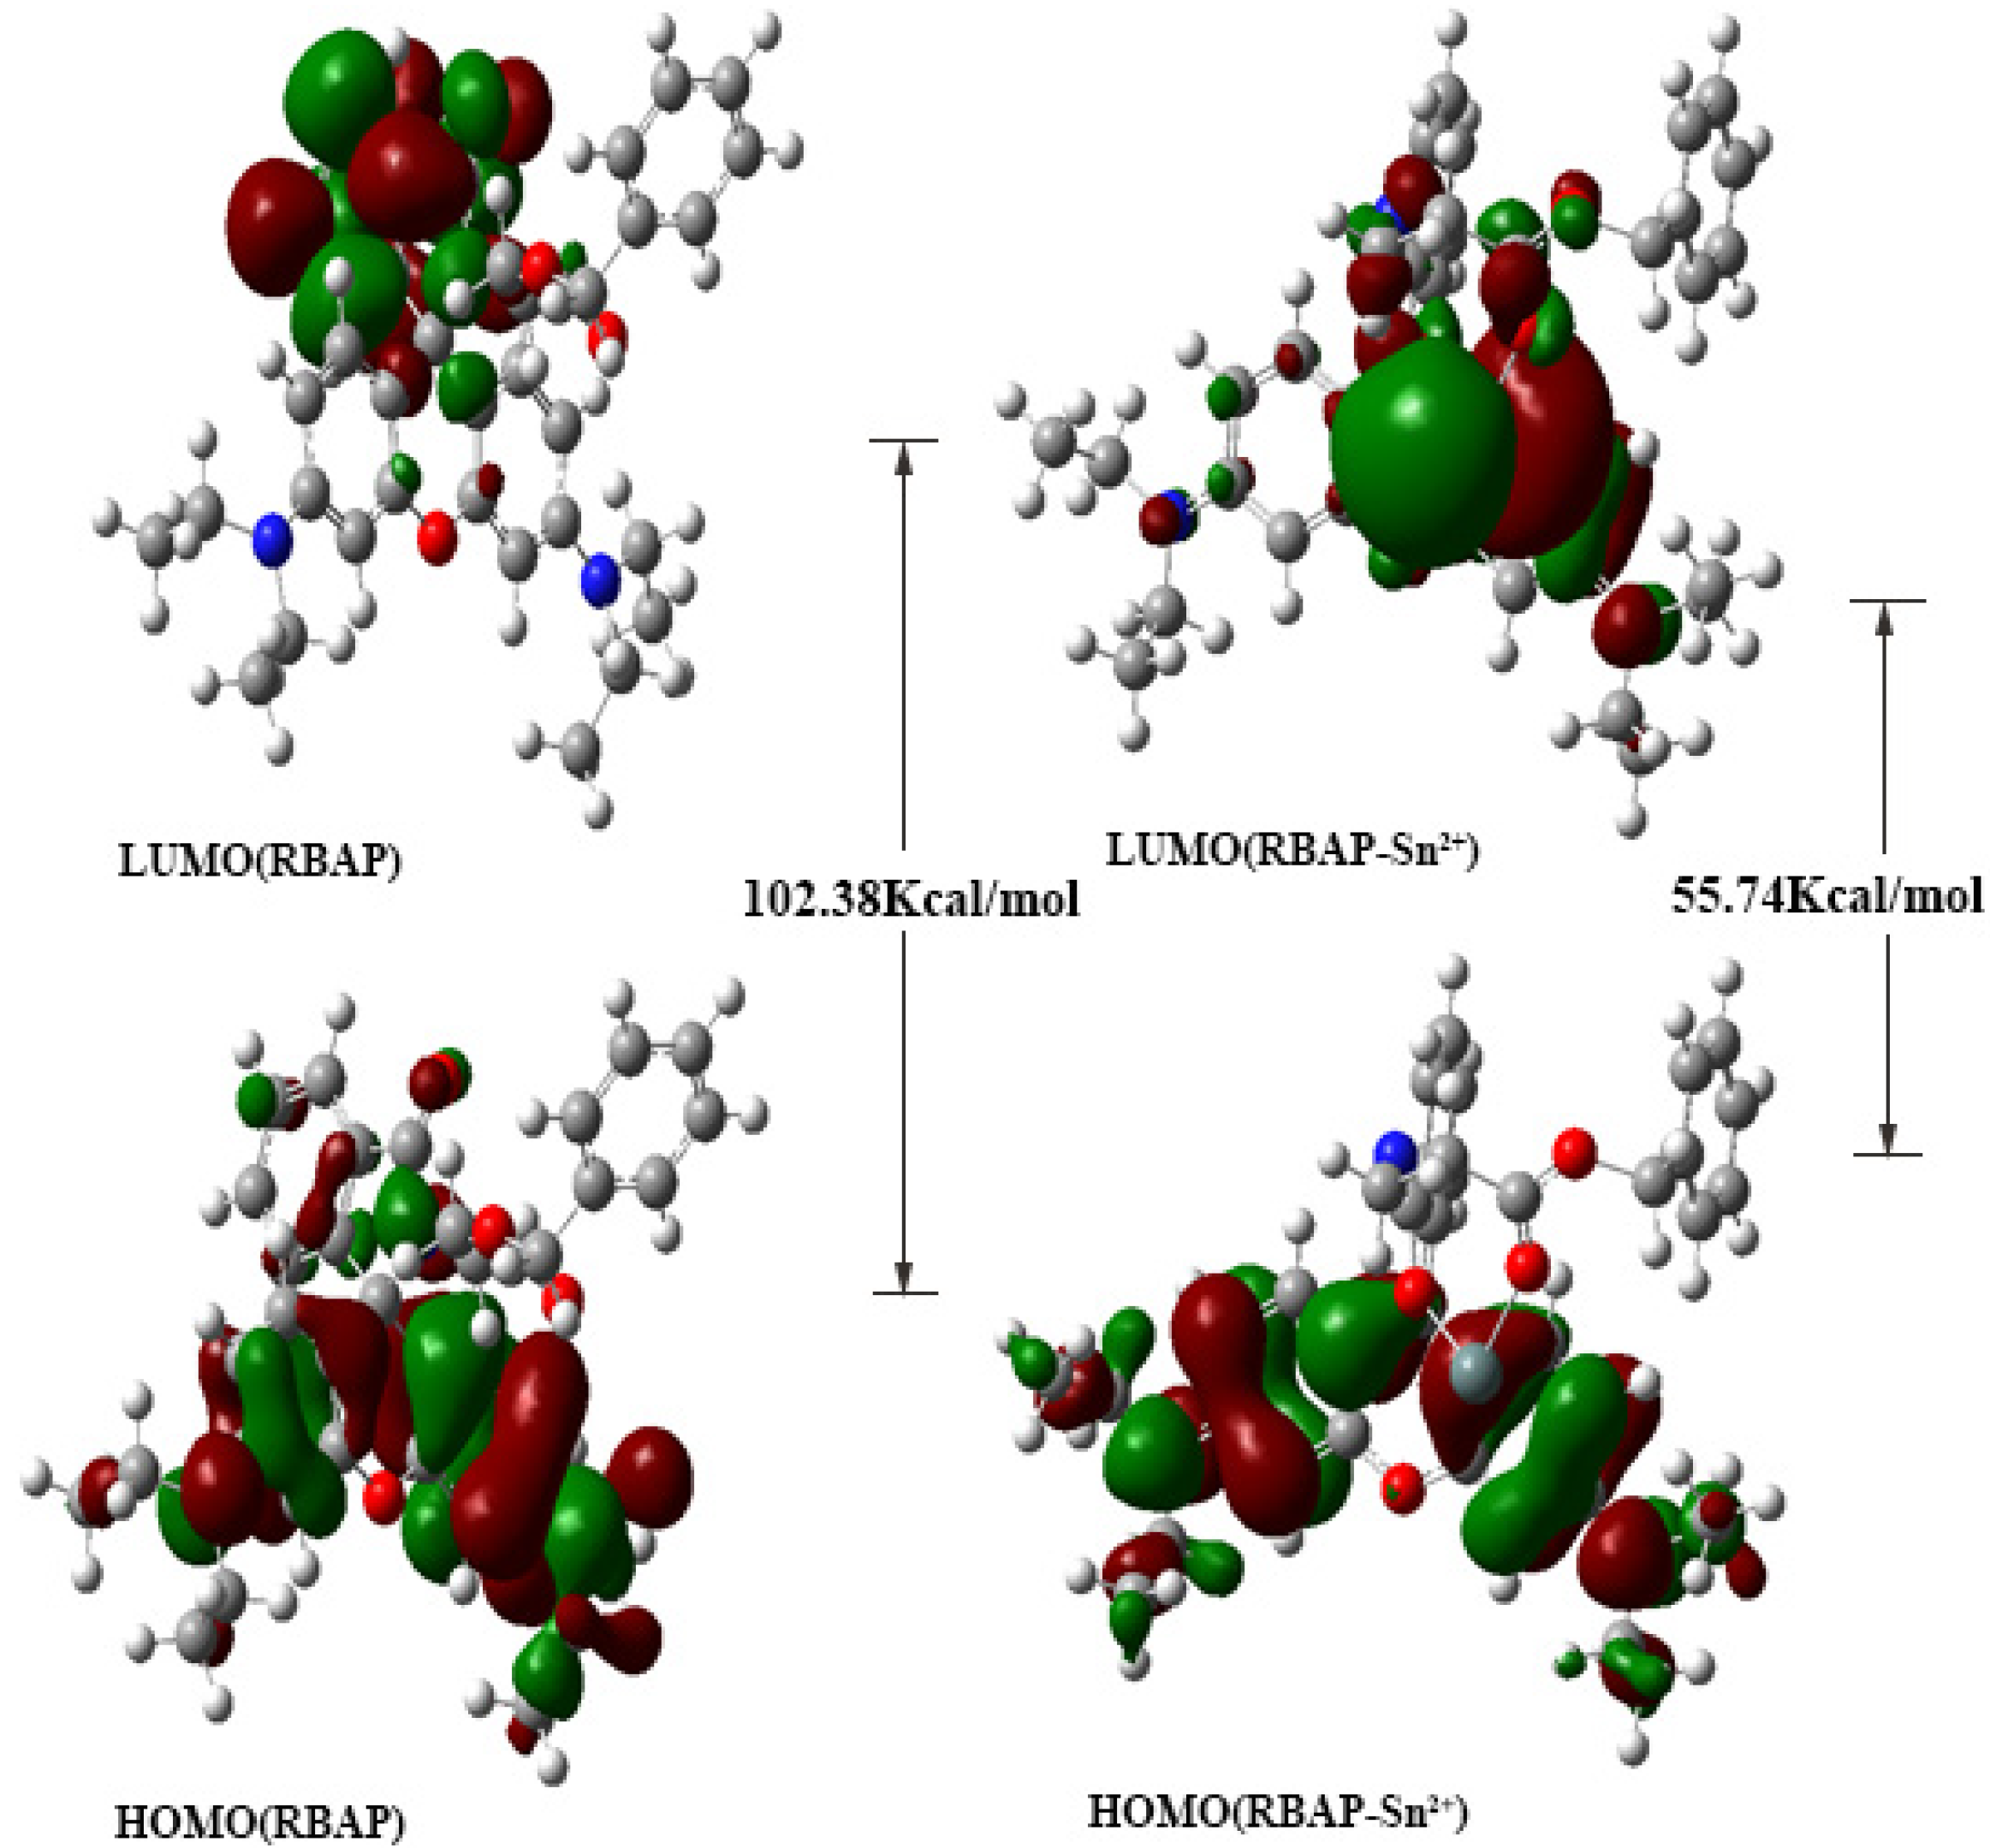
2.8. Density Functional Theory (DFT) Calculations

For better understanding of the nature of Sn2+ coordination with RBAP, energy optimized structures of RBAP and RBAP-Sn2+ (Figure 11) were obtained using DFT calculations with the B3LYP method using 6-31+G(d) as a basis set.
Figure 11. Energy-minimized structure of (A) RBAP and the (B) RBAP-Sn2+complex.
Molecules 19 07817 g011
The spatial distributions and orbital energies of the HOMO and LUMO of RBAP and RBAP-Sn2+ were also generated using DFT calculations (Figure 12). The results indicated that, in RBAP the HOMO is spread out on the xanthenes of the rhodamine B moiety, while the LUMO is centered on the spirocycle of the rhodamine B moiety and more localized. As a result, the C-N bond on the spirocycle of the rhodamine B moiety breaks to facilitate the binding of Sn2+ ions with the two RBAP carbonyl oxygen atoms. The π electrons in the HOMO of the RBAP-Sn2+ complex are mainly located in rhodamine B, while the LUMO is mostly located on the guest Sn2+ ion. The energy gap between the HOMO and LUMO was calculated to be 55.74 kcal/mol, an almost 50% decrease from that of RBAP, which was 102.38 kcal/mol (Supporting Materials). The results clearly suggest that the binding of Sn2+ to RBAP stabilizes the system because the calculated orbital energies of both the HOMO and LUMO were lowered for the complex. In the RBAP-Sn2+ complex, the distances of the two “Sn-O” bonds were calculated to be 2.01 and 2.21 Å, respectively (Figure 11).
Figure 12. HOMO and LUMO orbitals of (A) RBAP and the (B) RBAP-Sn2+ complex.
Molecules 19 07817 g012

3. Experimental Section

3.1. Materials and General Methods

All reagents and organic solvents were ACS grade or higher and were used without further purification. Unless otherwise noted, all chemicals were purchased from J&K Scientific (Shanghai, China) and were used as received. All solvents were of analytical grade, and double distilled water was used in all experiments. The salts used to prepare metal ion stock solutions were Ba(NO3)2, AgNO3, NaCl, LiCl·H2O, KCl, MgCl2·6H2O, FeCl3·6H2O, SnCl2·2H2O, CuCl2·2H2O, CaCl2, PbCl2, MnCl2·4H2O, ZnCl2, CdCl2·2.5H2O, FeCl2·4H2O, HgCl2, AlCl3, CoCl2·6H2O, SnCl4 and CrCl3·6H2O. The reactions were performed under an argon atmosphere using standard Schlenk techniques. Thin-layer chromatography was performed on a HAIYANG silica gel F254 plate, and compounds were visualized under UV light (λ = 254 nm). Column chromatography was performed using HAIYANG silica gel (type: 200–300 mesh ZCX-2).
1H (500 MHz) and 13C-NMR (126 MHz) spectra were recorded on an Avance 500 spectrometer (Bruker; Billerica, MA, USA). The chemical shifts are reported in δ units (ppm) downfield relative to the chemical shift of tetramethylsilane. The abbreviations br, s, d, t, and m denote broad, singlet, doublet, triplet, and multiplet, respectively. Mass spectra were obtained with a Finnigan TSQ Quantum LC/MS Spectrometer (Thermo Fisher Scientific Corp., Waltham, MA, USA). High-resolution mass spectra (HRMS) were acquired under electron ionization conditions with a double-focusing high-resolution instrument (Thermo Fisher Scientific Corp., Waltham, MA, USA) The pH levels of stock solutions were measured using a PHS-25C Precision pH/mV Meter (Aolilong, Hangzhou, China). UV-Vis and fluorescence spectra were obtained on a UV-3600 UV-VIS-NIR spectrophotometer (Shimadzu, Kyoto, Japan) and an Edinburgh FLS920 fluorescence spectrophotometer (Livingston, UK), respectively at room temperature.

3.2. Synthesis of 3-(Benzyloxy)-3-oxopropan-1-aminium chloride (2)

β-Alanine (2.9 g, 32.5 mmol) was suspended in 20 mL of phenylmethanol. Hydrogen chloride was passed through the solution for 15 min at room temperature. The reaction mixture was stirred at 120 °C for 12 h, cooled to room temperature, and then dried under vacuum. Flash chromatography (silica gel; MeOH/DCM, 5:95, v/v; Rf = 0.3) of the residue gave 2 as a white solid (6.45 g, 92%). 1H-NMR (CDCl3): δ = 7.72 (s, 1H), 7.29–7.25 (m, 5H), 5.09 (s, 2H), 3.35 (t, J = 5.5 Hz, 2H), 2.92 (t, J = 6.5 Hz, 2H).

3.3. Synthesis of Benzyl 3-(3',6'-bis(diethylamino)-3-oxospiro[isoindoline-1,9'-xanthen]-2-yl) propan oate (RBAP)

A solution of 2 (2.00 g, 10 mmol) and Et3N (1.5 mL, 10.8 mmol) in 20 mL CH2Cl2 was added to a solution of Rhodamine B (4.00 g, 8.3 mmol) and HOBt (1.2 g, 8.9 mmol) in 30 mL CH2Cl2. The reaction mixture was stirred at room temperature for 12 h, filtered through a pad of Celite and then dried under vacuum. Flash chromatography (silica gel; MeOH/DCM, 2/98, v/v; Rf = 0.3) of the residue gave RBAP as a bright-red solid (4.51 g, 90%). 1H-NMR (acetone-d6/D2O): δ = 7.94–7.92 (m, 1H), 7.58–7.56 (m, 2H), 7.36–7.29 (m, 5H), 7.03–7.01 (m, 1H), 6.43–6.39 (m, 6H), 4.98 (s, 2H), 3.45–3.37 (m, 10H), 2.30 (t, J = 7.75 Hz, 2H), 1.15 (t, J = 7.0 Hz, 12H) ppm. 13C-NMR (126 MHz, CDCl3, 298 K): δ = 171.6, 168.2, 153.9, 153.4, 148.9, 136.0, 132.5, 130.9, 128.9, 128.5, 128.2, 128.0, 123.8, 122.9, 108.3, 105.4, 98.2, 66.2, 65.0, 44.5, 35.9, 32.9, 29.8, 12.7 ppm. ESI-MS (m/s): Calculated for [M + H]+ C38H42N3O4+, 604.3170; HRMS found, 604.3180. (Supporting Materials, Figures S1–S3).

3.4. Experimental Procedure for X-ray Crystallographic Analysis

Crystallographic data of complexes were collected at 296 K on a Bruker APEX-II CCD system equipped with graphite-monochromated Mo-Kα radiation (λ = 0.071073 nm) using the ω-φ scan technique. Diffraction data were integrated using the SAINT program, which was also used for intensity corrections for Lorentz and polarization effects. A semi-empirical absorption correction was applied using SADABS. The structures were solved by direct methods, and all non-hydrogen atoms were refined anisotropically on F2 by full-matrix least-squares using the SHELXL-97 crystallographic software package. Summary of Data CCDC 969599, Compound Name: Formula: C39H44N3O4, Unit Cell Parameters: a 12.5467(15) b 22.338(3) c 12.0855(14) P21/c.

3.5. Stock Solution Preparation for Spectral Detection

Stock solutions (10−2 M) of the chlorides or nitrate salts of Mg2+, Sn2+, Cr3+, Ag+, Ca2+, Na+, Pb2+, K+, Mn2+, Zn2+, Cu2+, Cd2+, Li+, Hg2+, Al3+, Ba2+, Fe2+, Co2+, Sn4+ and Fe3+ in MeOH/H2O (2:3, v/v) were prepared. Stock solutions (10−3 M) of RBAP were prepared in THF/methanol/H2O (5:2:3, v/v/v). RBAP working solutions were freshly prepared by diluting the high concentration stock solution to the desired concentration prior to spectroscopic measurements.

3.6. Computational Studies

Computational studies were carried out to investigate the nature of Sn2+ coordination with RBAP using the Gaussian software package. All geometries for RBAP and RBAP-Sn2+ were optimized using ab initio HF and density functional theory (DFT) calculations. The geometries were first optimized at the HF/3-21G level. The resulting structures were further optimized by DFT calculations using B3LYP with larger basis sets, i.e., the SDDAll basis set for Sn2+ and 6-31+G(d) for all other atoms in the complex.

4. Conclusions

In conclusion, we report a rhodamine B derivative, RBAP, which is a selective and sensitive chemosensor that specifically recognizes the Sn2+ ion in a MeOH/H2O (2:3, v/v, pH 5.95) solution by UV/vis and fluorescence spectroscopy. The chemical structure of RBAP was analyzed by 1H-NMR, 13C-NMR, and HRMS, and its structure was further confirmed by X-ray analysis. The 1:1 coordination mode was proposed on the basis of Job’s plot. The Sn2+ binding ability of RBAP was further demonstrated by DFT calculations, which suggested that both the HOMO and LUMO orbitals in the RBAP-Sn2+ complex were stabilized and that the optical detection resulted from the significant decrease in the HOMO-LUMO energy gap.

Supplementary Materials

Supplementary materials can be accessed at: https://www.mdpi.com/1420-3049/19/6/7817/s1.

Acknowledgments

This research was supported by NSF China (81371616), the Natural Science Foundation of Jiangsu Province (No. BK2011704), the Fundamental Research Funds for the Central Universities (30920130111024, NO. 2011ZDJH08) and the Research Fund for the Doctoral Program of Higher Education of China (20133219120020). We thank the NJUST Sensor Lab (Chief: Xueji Zhang, Co-PI: Dan Shan and Jinming Kong) for providing facilities for the UV-Vis studies.

Author Contributions

Xiaofeng Bao conceived and designed the experiments; Xiaowei Cao, Yanyan Jin, Xuemei Nie, and Baojing Zhou performed the experiments; Xiaofeng Bao analyzed the data and wrote the paper.

Conflicts of Interest

The authors declare no conflict of interest.

References

  1. Guo, X.F.; Qian, X.H.; Jia, L.H. A highly selective and sensitive fluorescent chemosensor for Hg2+ in neutral buffer aqueous solution. J. Am. Chem. Soc. 2004, 126, 2272–2273. [Google Scholar]
  2. Shiraishi, Y.; Sumiya, S.; Kohno, Y.; Hirai, T. A Rhodamine-cyclen conjugate as a highly sensitive and selective fluorescent chemosensor for Hg(II). J. Org. Chem. 2008, 73, 8571–8574. [Google Scholar] [CrossRef]
  3. Tian, M.Z.; Hu, M.M.; Fan, J.L.; Peng, X.J.; Wang, J.-Y.; Sun, S.G.; Zhang, R. Rhodamine-based “turn-on” fluorescent probe for Cu(II) and its fluorescence imaging in living cells. Bioorg. Med. Chem. Lett. 2013, 23, 2916–2919. [Google Scholar]
  4. Wu, D.; Huang, W.; Duan, C.; Lin, Z.; Meng, Q. Highly sensitive fluorescent probe for selective detection of Hg2+ in DMF aqueous media. Inorg. Chem. 2007, 46, 1538–1540. [Google Scholar]
  5. Yin, S.; Leen, V.; van Snick, S.; Boens, N.; Dehaen, W. A highly sensitive, selective, colorimetric and near-infrared fluorescent turn-on chemosensor for Cu2+ based on BODIPY. Chem. Commun. 2010, 46, 6329–6331. [Google Scholar]
  6. Goswami, S.; Aich, K.; Das, S.; Das, A.K.; Manna, A.; Halder, S. A highly selective and sensitive probe for colorimetric and fluorogenic detection of Cd2+ in aqueous media. Analyst 2013, 138, 1903–1907. [Google Scholar]
  7. Goswami, S.; Das, S.; Aich, K.; Sarkar, D.; Mondal, T.K.; Quah, C.K.; Fun, H.K. CHEF induced highly selective and sensitive turn-on fluorogenic and colorimetric sensor for Fe3+. Dalton Trans. 2013, 42, 15113–15119. [Google Scholar]
  8. Bannon, D.I.; Chisolm, J.J. Anodic stripping voltammetry compared with graphite furnace atomic absorption spectrophotometry for blood lead analysis. Clin. Chem. 2001, 47, 1703–1704. [Google Scholar]
  9. Hill, S.J.; Chenery, S.; Dawson, J.B.; Evans, E.H.; Fisher, A.; Price, W.J.; Smith, C.M.M.; Sutton, K.L.; Tyson, J.F. Advances in atomic emission, absorption and fluorescence spectrometry, and related techniques. J. Anal. At. Spectrom. 2000, 15, 763–805. [Google Scholar] [CrossRef]
  10. Resano, M.; Vanhaecke, F.; de Loos-Vollebregt, M.T.C. Electrothermal vaporization for sample introduction in atomic absorption, atomic emission and plasma mass spectrometry-a critical review with focus on solid sampling and slurry analysis. J. Anal. At. Spectrom. 2008, 23, 1450–1475. [Google Scholar] [CrossRef]
  11. Vadillo, J.M.; Garcia, C.C.; Alcantara, J.F.; Laserna, J.J. Thermal-to-plasma transitions and energy threshold in laser ablated metals monitored by atomic emission/mass spectrometry coincidence analysis. Spectrochim. Acta Part B At. Spectrosc. 2005, 60, 948–954. [Google Scholar] [CrossRef]
  12. Romao, W.; Lalli, P.M.; Franco, M.F.; Sanvido, G.; Schwab, N.V.; Lanaro, R.; Costa, J.L.; Sabino, B.D.; Bueno, M.I.M.S.; de Sa, G.F.; et al. Chemical profile of meta-chlorophenylpiperazine (m-CPP) in ecstasy tablets by easy ambient sonic-spray ionization, X-ray fluorescence, ion mobility mass spectrometry and NMR. Anal. Bioanal. Chem. 2011, 400, 3053–3064. [Google Scholar] [CrossRef]
  13. Van Meel, K.; Smekens, A.; Behets, M.; Kazandjian, P.; van Grieken, R. Determination of platinum, palladium, and rhodium in automotive catalysts using high-energy secondary target X-ray fluorescence spectrometry. Anal. Chem. 2007, 79, 6383–6389. [Google Scholar] [CrossRef]
  14. Forzani, E.S.; Zhang, H.Q.; Chen, W.; Tao, N.J. Detection of heavy metal ions in drinking water using a high-resolution differential surface plasmon resonance sensor. Environ. Sci. Technol. 2005, 39, 1257–1262. [Google Scholar] [CrossRef]
  15. Rojas, E.; Herrera, L.A.; Poirier, L.A.; Ostrosky-Wegman, P. Are metals dietarycarcinogens? Mutat. Res. 1999, 443, 157–181. [Google Scholar] [CrossRef]
  16. Unal, U.; Somer, G. Simultaneous determination of trace Sn(II) and Sn(IV) using differential pulse polarography and application. Turkish J. Chem. 2011, 35, 73–85. [Google Scholar]
  17. Braga, A.C.S.; Oliveira, M.B.N.; Feliciano, G.D.; Reiniger, I.W.; Oliveira, J.F.; Silva, C.R.; Bernardo, M. The effect of drugs on the labeling of blood elements with technetium-99m. Curr. Pharm. Des. 2000, 6, 1179–1191. [Google Scholar] [CrossRef]
  18. Viau, C.M.; Guecheva, T.N.; Sousa, F.G.; Pungartnik, C.; Brendel, M.; Saffi, J.; Pegas Henriques, J.A. SnCl2-induced DNA damage and repair inhibition of MMS-caused lesions in V79 Chinese hamster fibroblasts. Arch. Toxicol. 2009, 83, 769–775. [Google Scholar] [CrossRef]
  19. Bao, X.; Liu, D.; Jin, Y.; Liu, X.; Jiang, W. Design and synthesis of a novel Rhodamine B [2] rotaxane. RSC Adv. 2013, 3, 6783–6786. [Google Scholar] [CrossRef]
  20. Biswal, B.; Bag, B. Preferences of rhodamine coupled (aminoalkyl)-piperazine probes towards Hg(II) ion and their FRET mediated signaling. Org. Biomol. Chem. 2013, 11, 4975–4992. [Google Scholar] [CrossRef]
  21. Duong Tuan, Q.; Kim, J.S. Chromogenic chemodosimeters for heavy metal ion detection in solution and biospecimens. Chem. Rev. 2010, 110, 6280–6301. [Google Scholar] [CrossRef]
  22. Kim, H.N.; Lee, M.H.; Kim, H.J.; Kim, J.S.; Yoon, J. A new trend in rhodamine-based chemosensors: Application of spirolactam ring-opening to sensing ions. Chem. Soc. Rev. 2008, 37, 1465–1472. [Google Scholar] [CrossRef]
  23. Kwon, J.Y.; Jang, Y.J.; Lee, Y.J.; Kim, K.M.; Seo, M.S.; Nam, W.; Yoon, J. A highly selective fluorescent chemosensor for Pb2+. J. Am. Chem. Soc. 2005, 127, 10107–10111. [Google Scholar]
  24. Liu, J.; Wu, D.; Yan, X.; Guan, Y. Naked-eye sensor for rapid determination of mercury ion. Talanta 2013, 116, 563–568. [Google Scholar] [CrossRef]
  25. Ni, J.; Li, Q.; Li, B.; Zhang, L. A novel fluorescent probe based on rhodamine B derivative for highly selective and sensitive detection of mercury(II) ion in aqueous solution. Sens. Actuat. B Chem. 2013, 186, 278–285. [Google Scholar] [CrossRef]
  26. Yang, H.; Zhou, Z.; Huang, K.; Yu, M.; Li, F.; Yi, T.; Huang, C. Multisignaling optical-electrochemical sensor for Hg2+ based on a rhodamine derivative with a ferrocene unit. Org. Lett. 2007, 9, 4729–4732. [Google Scholar]
  27. Yu, M.; Shi, M.; Chen, Z.; Li, F.; Li, X.; Gao, Y.; Xu, J.; Yang, H.; Zhou, Z.; Yi, T.; et al. Highly sensitive and fast responsive fluorescence turn-on chemodosimeter for Cu(2+) and its application in live cell imaging. Chemistry 2008, 14, 6892–6900. [Google Scholar] [CrossRef]
  28. Chen, X.; Pradhan, T.; Wang, F.; Kim, J.S.; Yoon, J. Fluorescent chemosensors based on spiroring-opening of xanthenes and related derivatives. Chem. Rev. 2012, 112, 1910–1956. [Google Scholar] [CrossRef]
  29. Goswami, S.; Manna, A.; Maity, A.K.; Paul, S.; Das, A.K.; Das, M.K.; Saha, P.; Quah, C.K.; Fun, H.-K. Selective detection and bio-imaging of Pd2+ with novel “C-CN” bond cleavage of cyano-rhodamine, cyanation with diaminomaleonitrile. Dalton Trans. 2013, 42, 12844–12848. [Google Scholar] [CrossRef]
  30. Mahapatra, A.K.; Manna, S.K.; Mandal, D.; Das Mukhopadhyay, C. Highly sensitive and selective rhodamine-based “off on” reversible chemosensor for tin (sn4+) and imaging in living cells. Inorg. Chem. 2013, 52, 10825–10834. [Google Scholar]
  31. Liu, D.; Pang, T.; Ma, K.; Jiang, W.; Bao, X. A new highly sensitive and selective fluorescence chemosensor for Cr3+ based on rhodamine B and a 4,13-diaza-18-crown 6-ether conjugate. RSC Adv. 2014, 4, 2563–2567. [Google Scholar]
  • Sample Availability: Samples of the compounds 2 and RBAP are available from the authors.

