
Mechanism of the Zn(II)Phthalocyanines’ Photochemical Reactions Depending on the Number of Substituents and Geometry

 , ,
, ,  and
and
Abstract
:1. Introduction
2. Results and Discussion
2.1. Synthesis
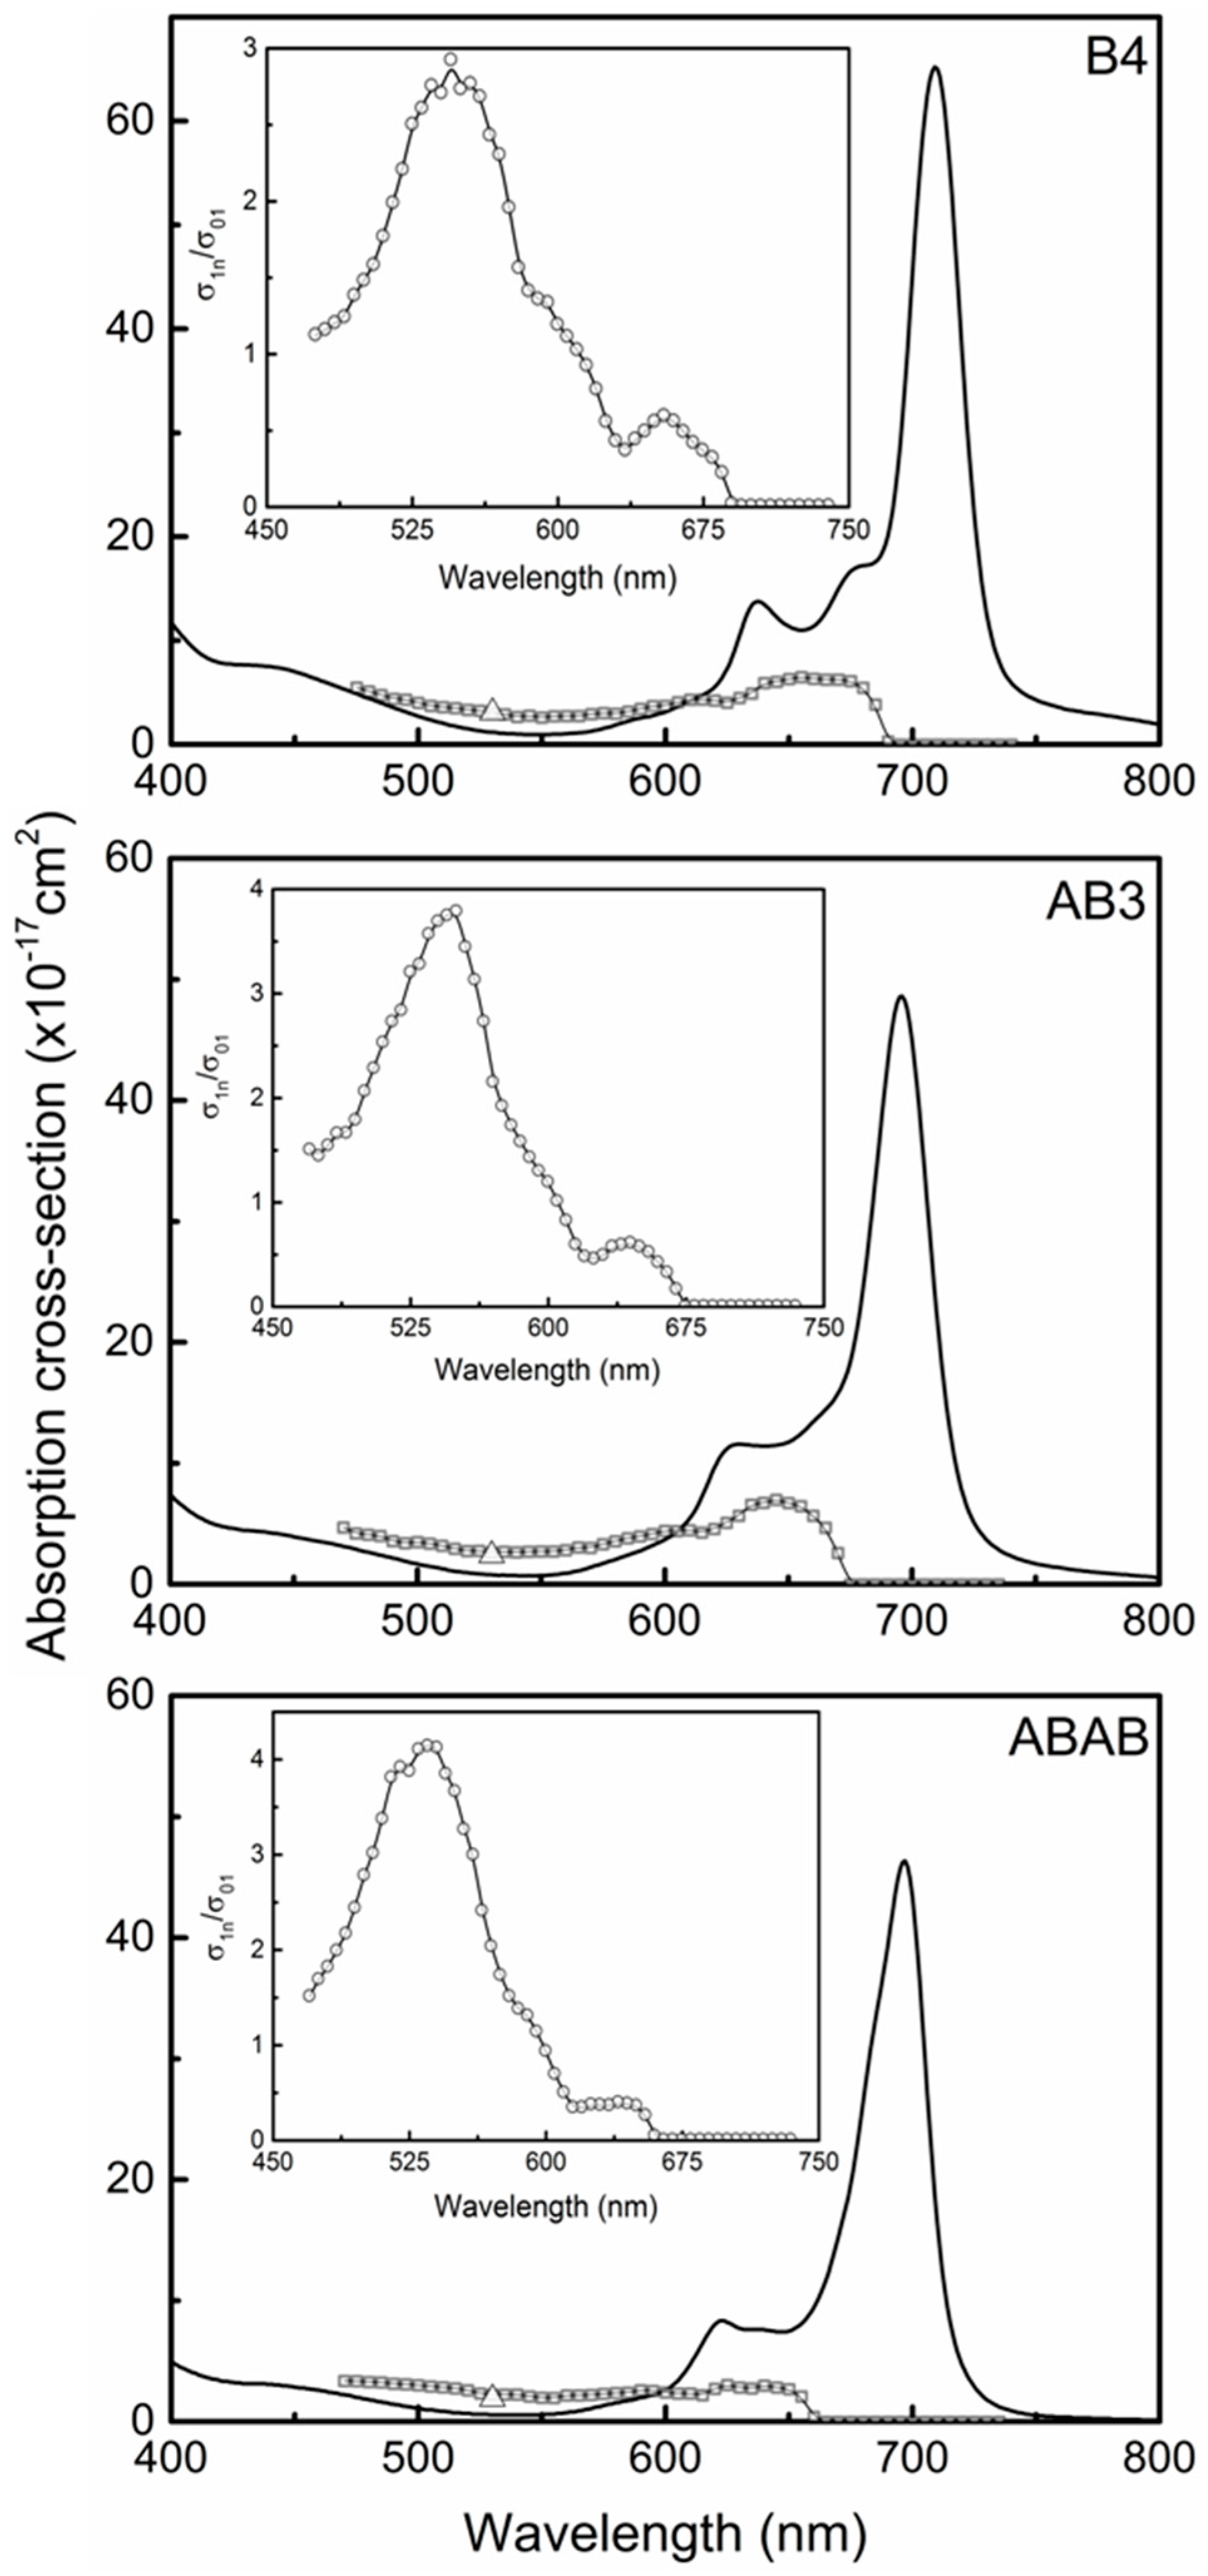
2.2. Ground State Electronic Absorption and Steady-State Fluorescence Measurements
2.3. Fluorescence Quantum Yield Measurements
2.4. Fluorescence Lifetimes (Time-Resolved Measurements)
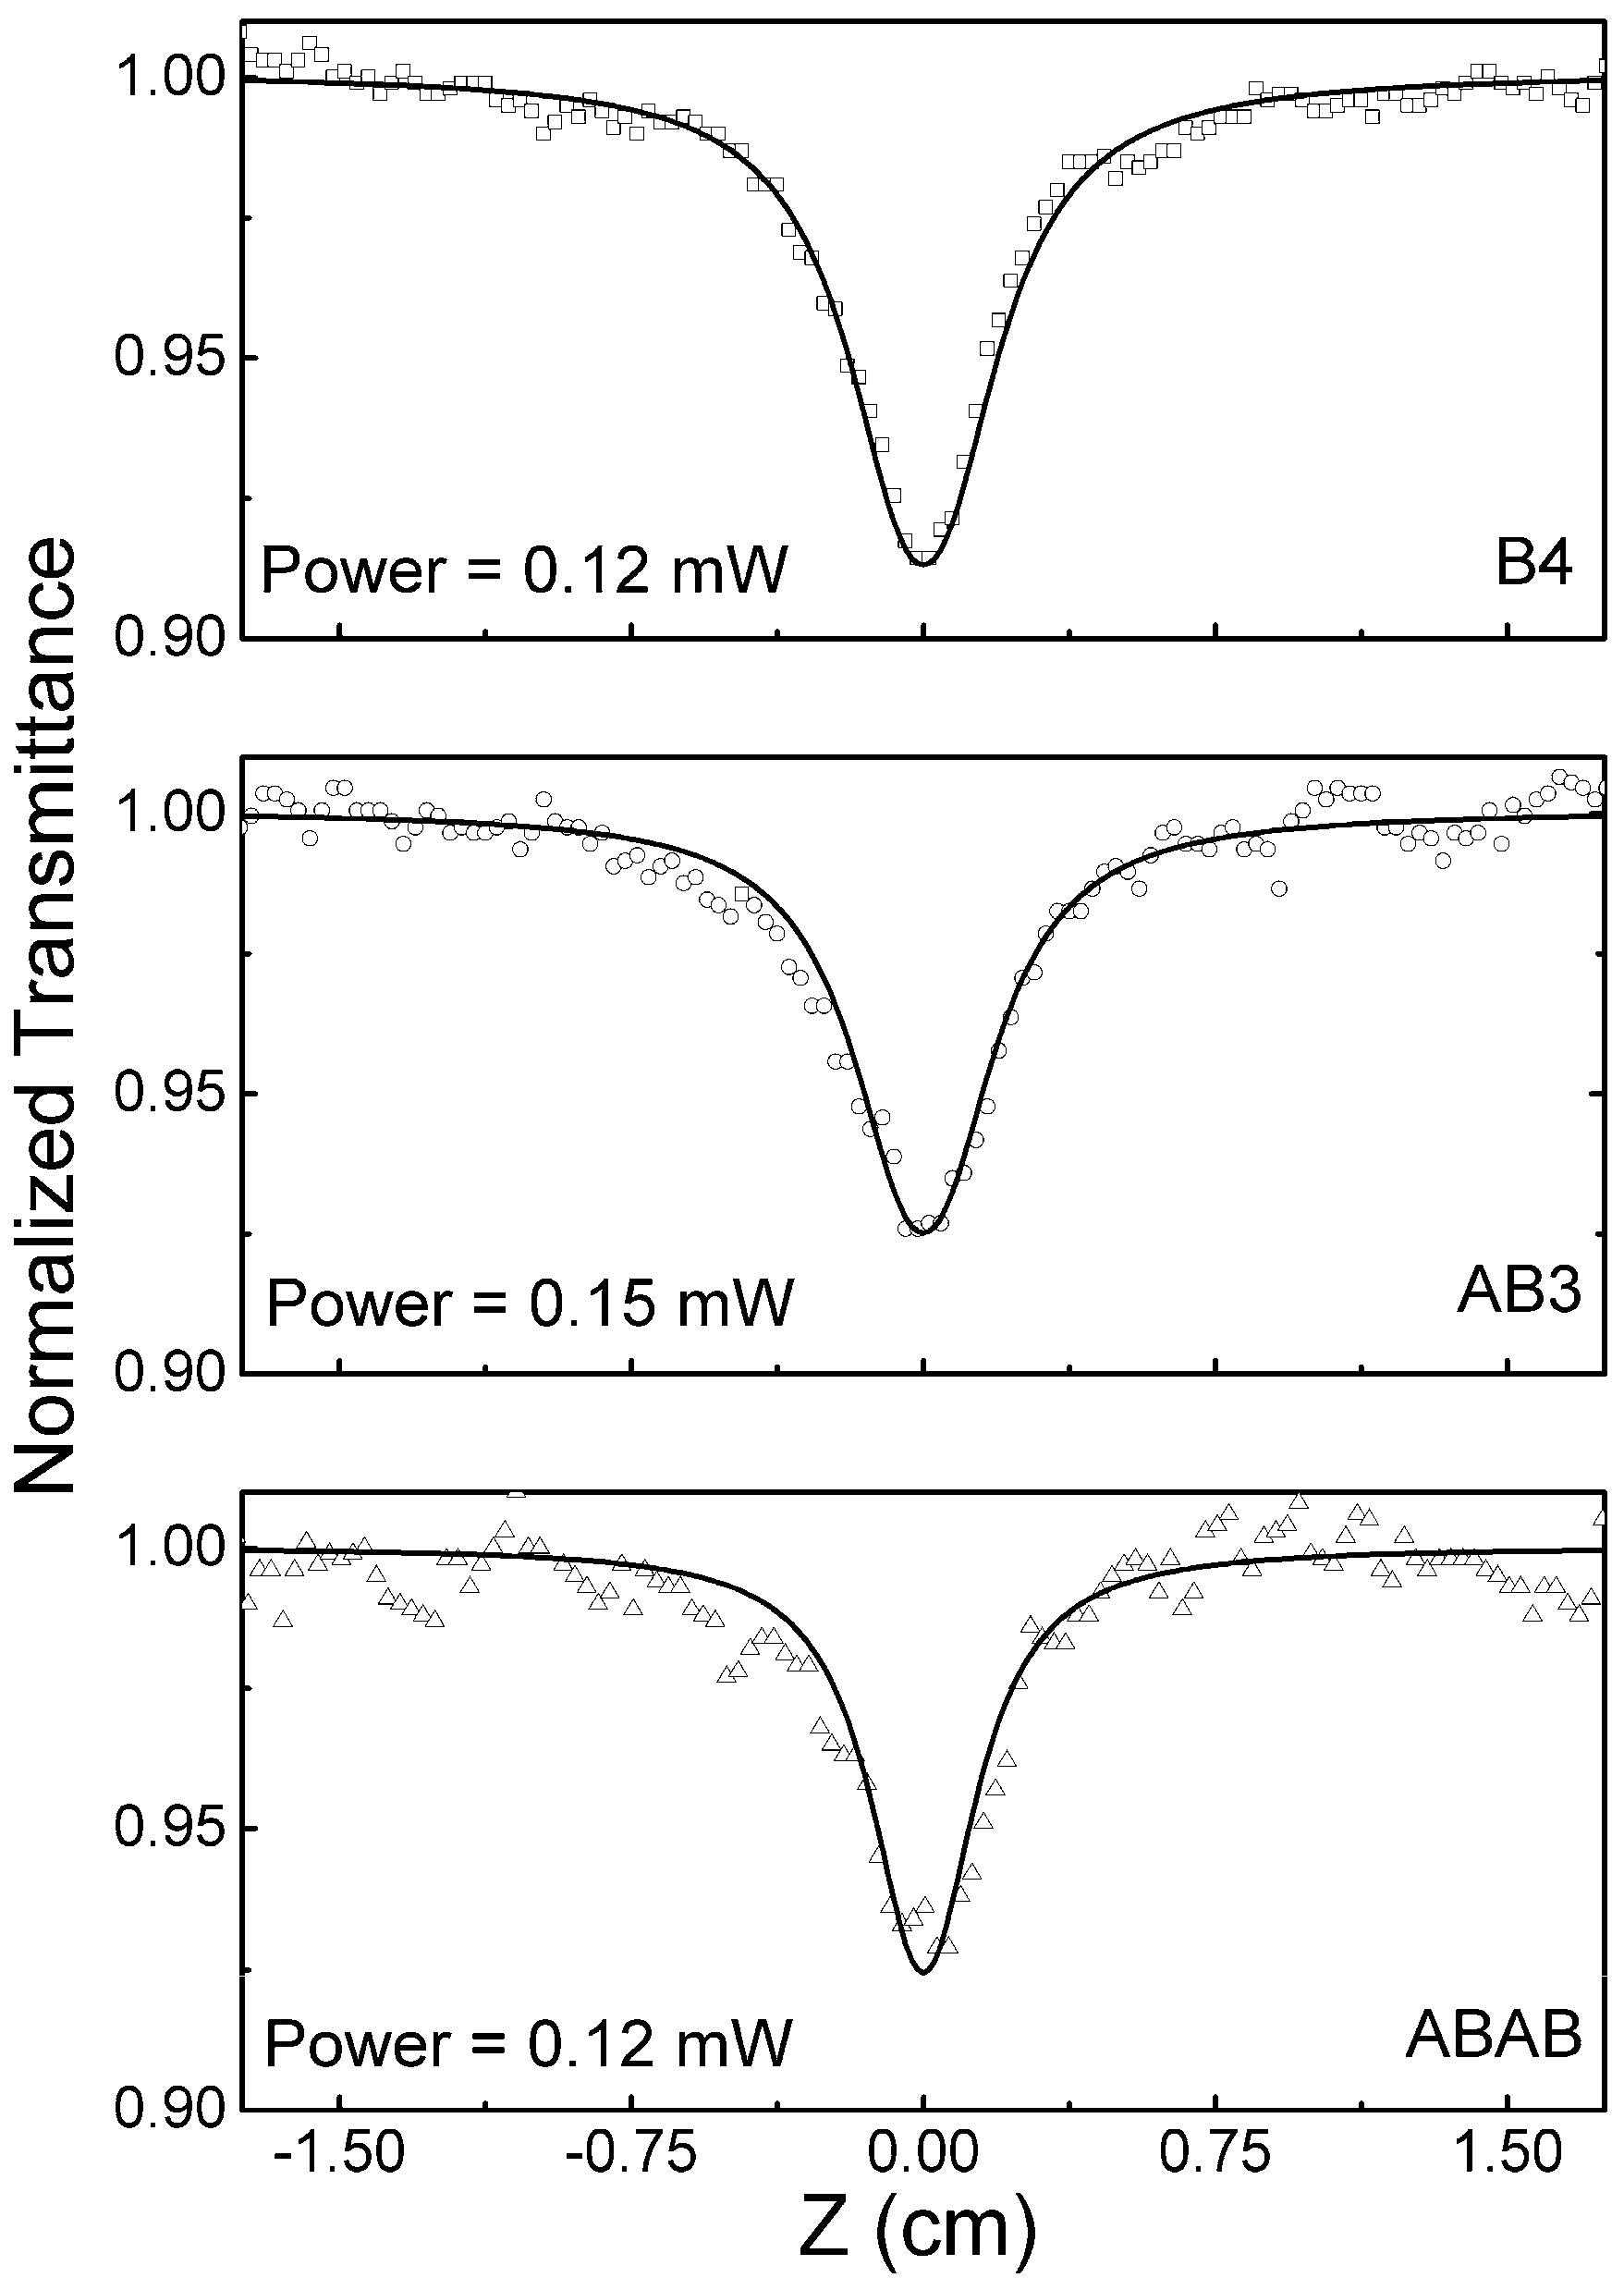
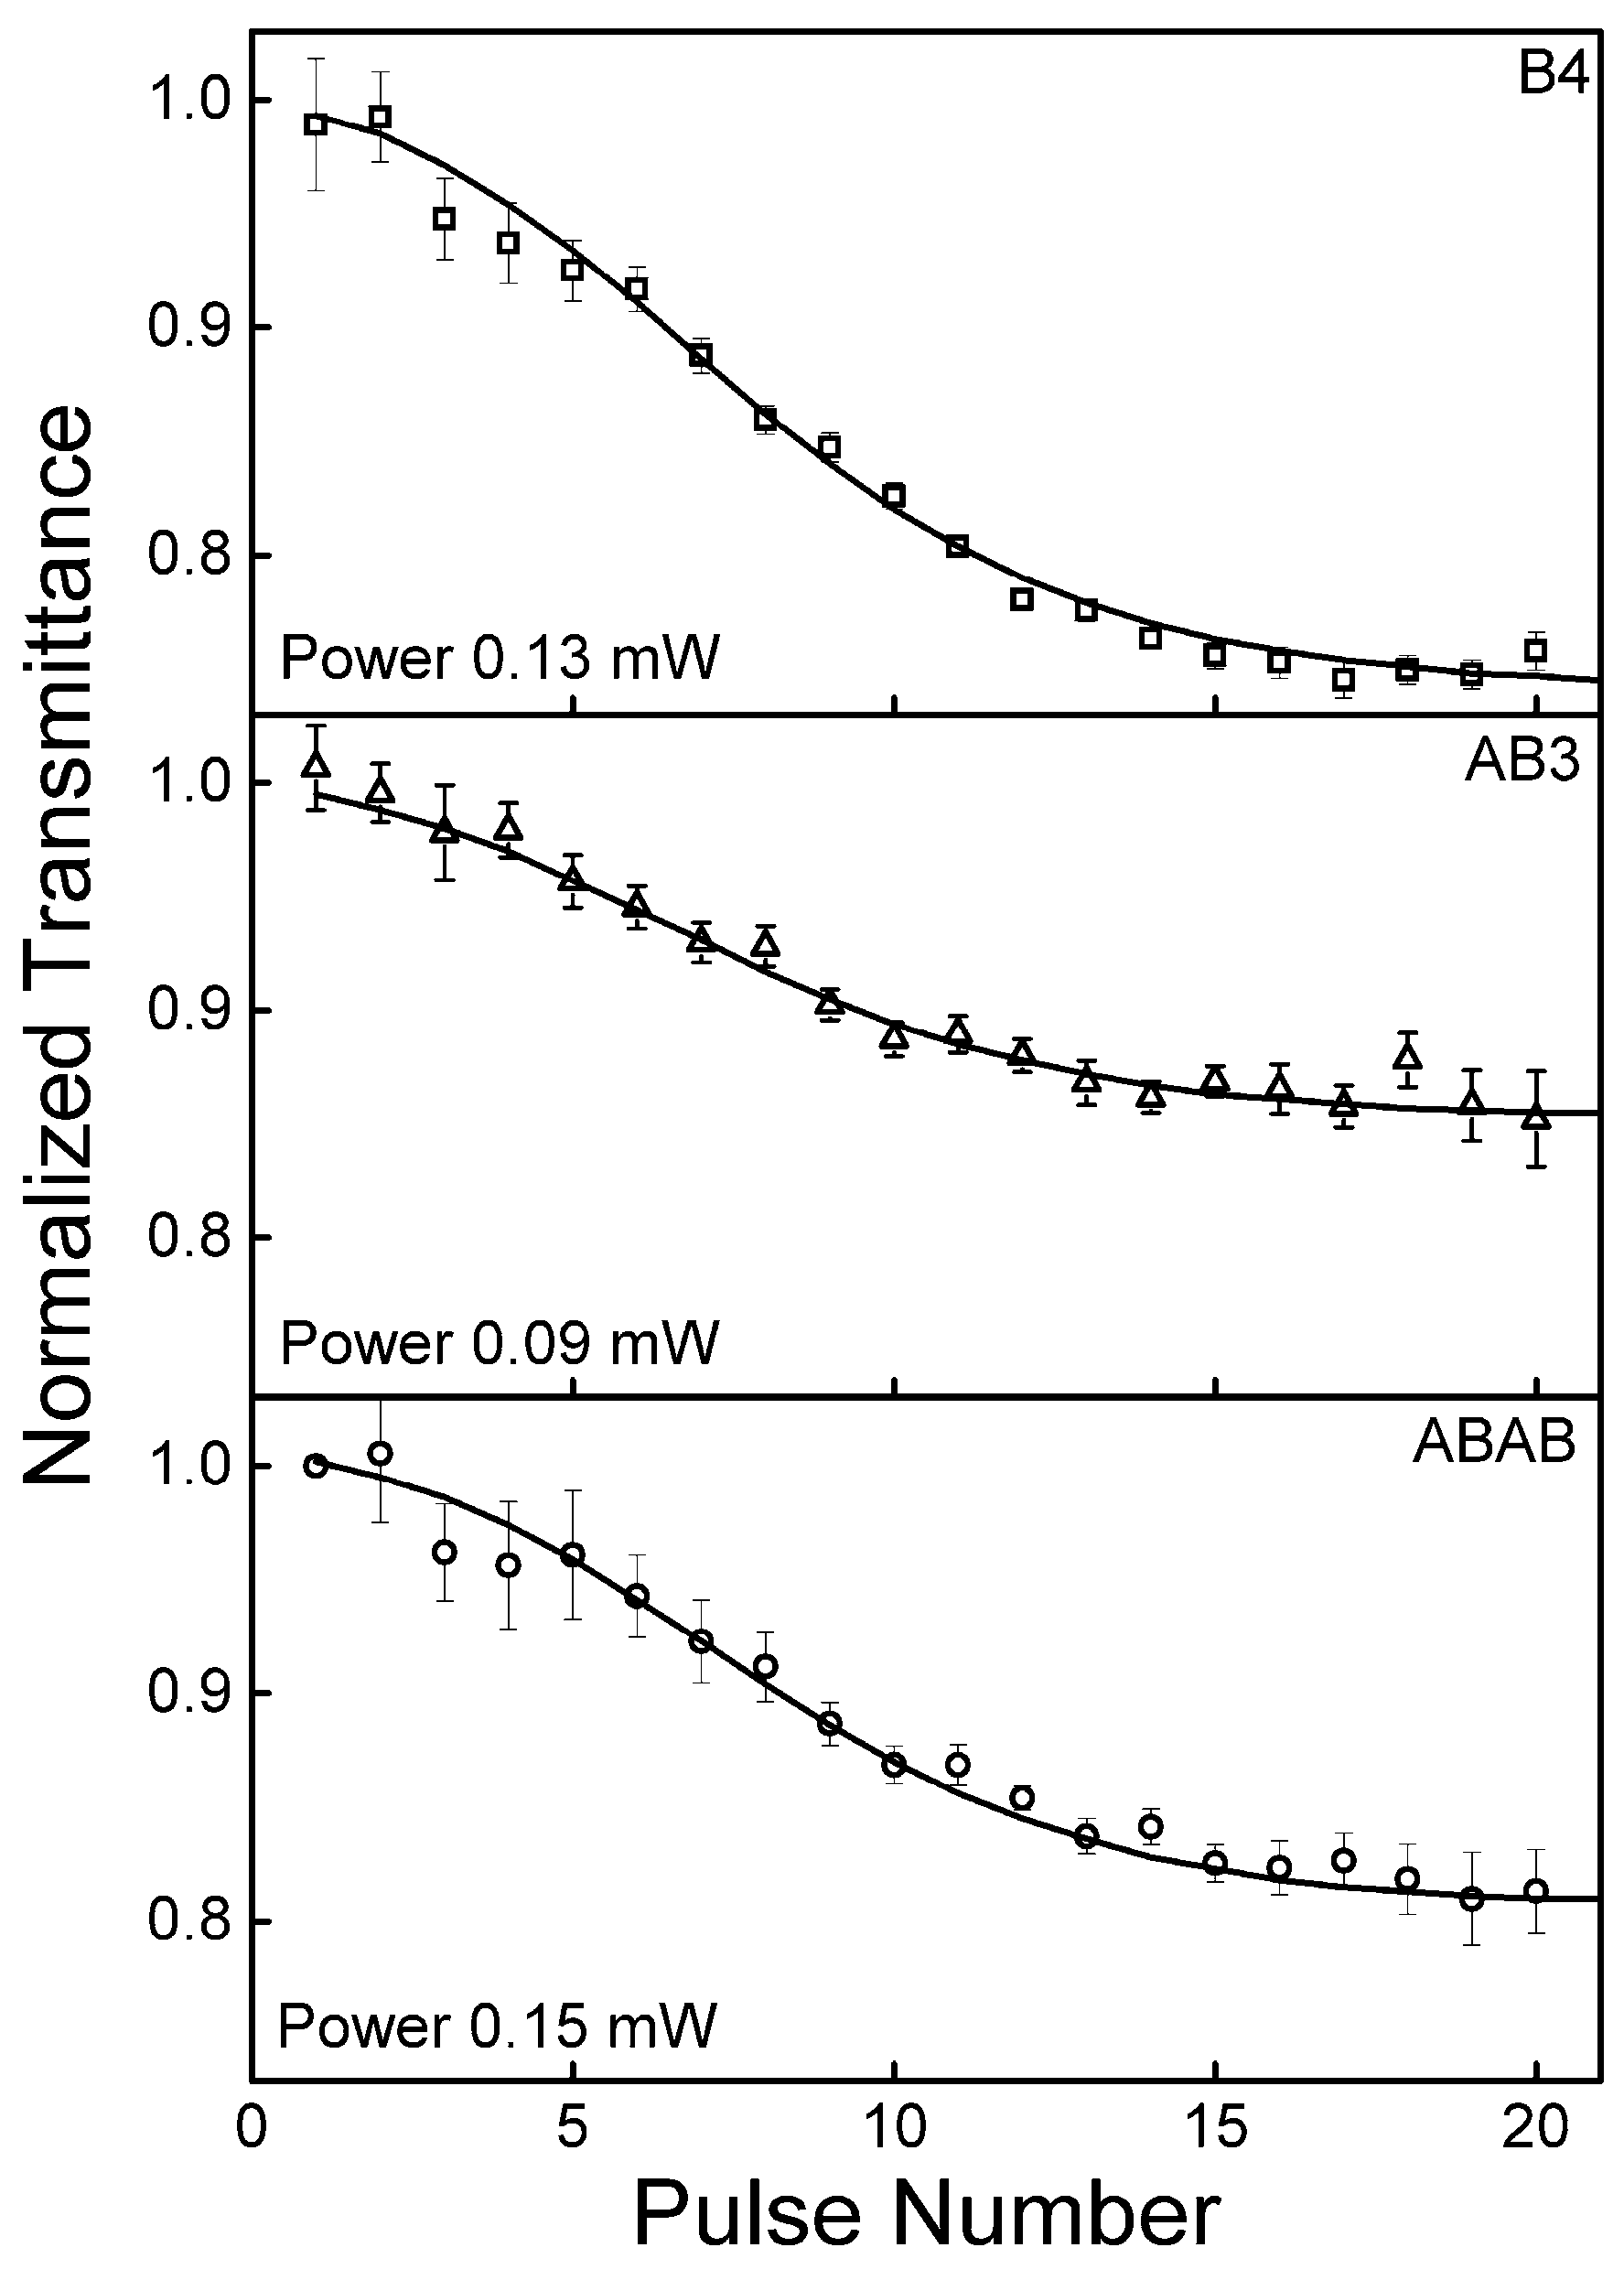
2.5. Excited State Absorption Cross-Section: Z-Scan
3. Materials and Methods
3.1. General Information
3.2. Synthesis: General Procedure for ABAB and AB3 Metalation
3.3. Physical Measurements
Fluorescence Lifetimes (Time-Resolved Measurements)
4. Conclusions
Supplementary Materials
Acknowledgments
Author Contributions
Conflicts of Interest
Abbreviations
| ZnPcs | zinc (II) phthalocyanines |
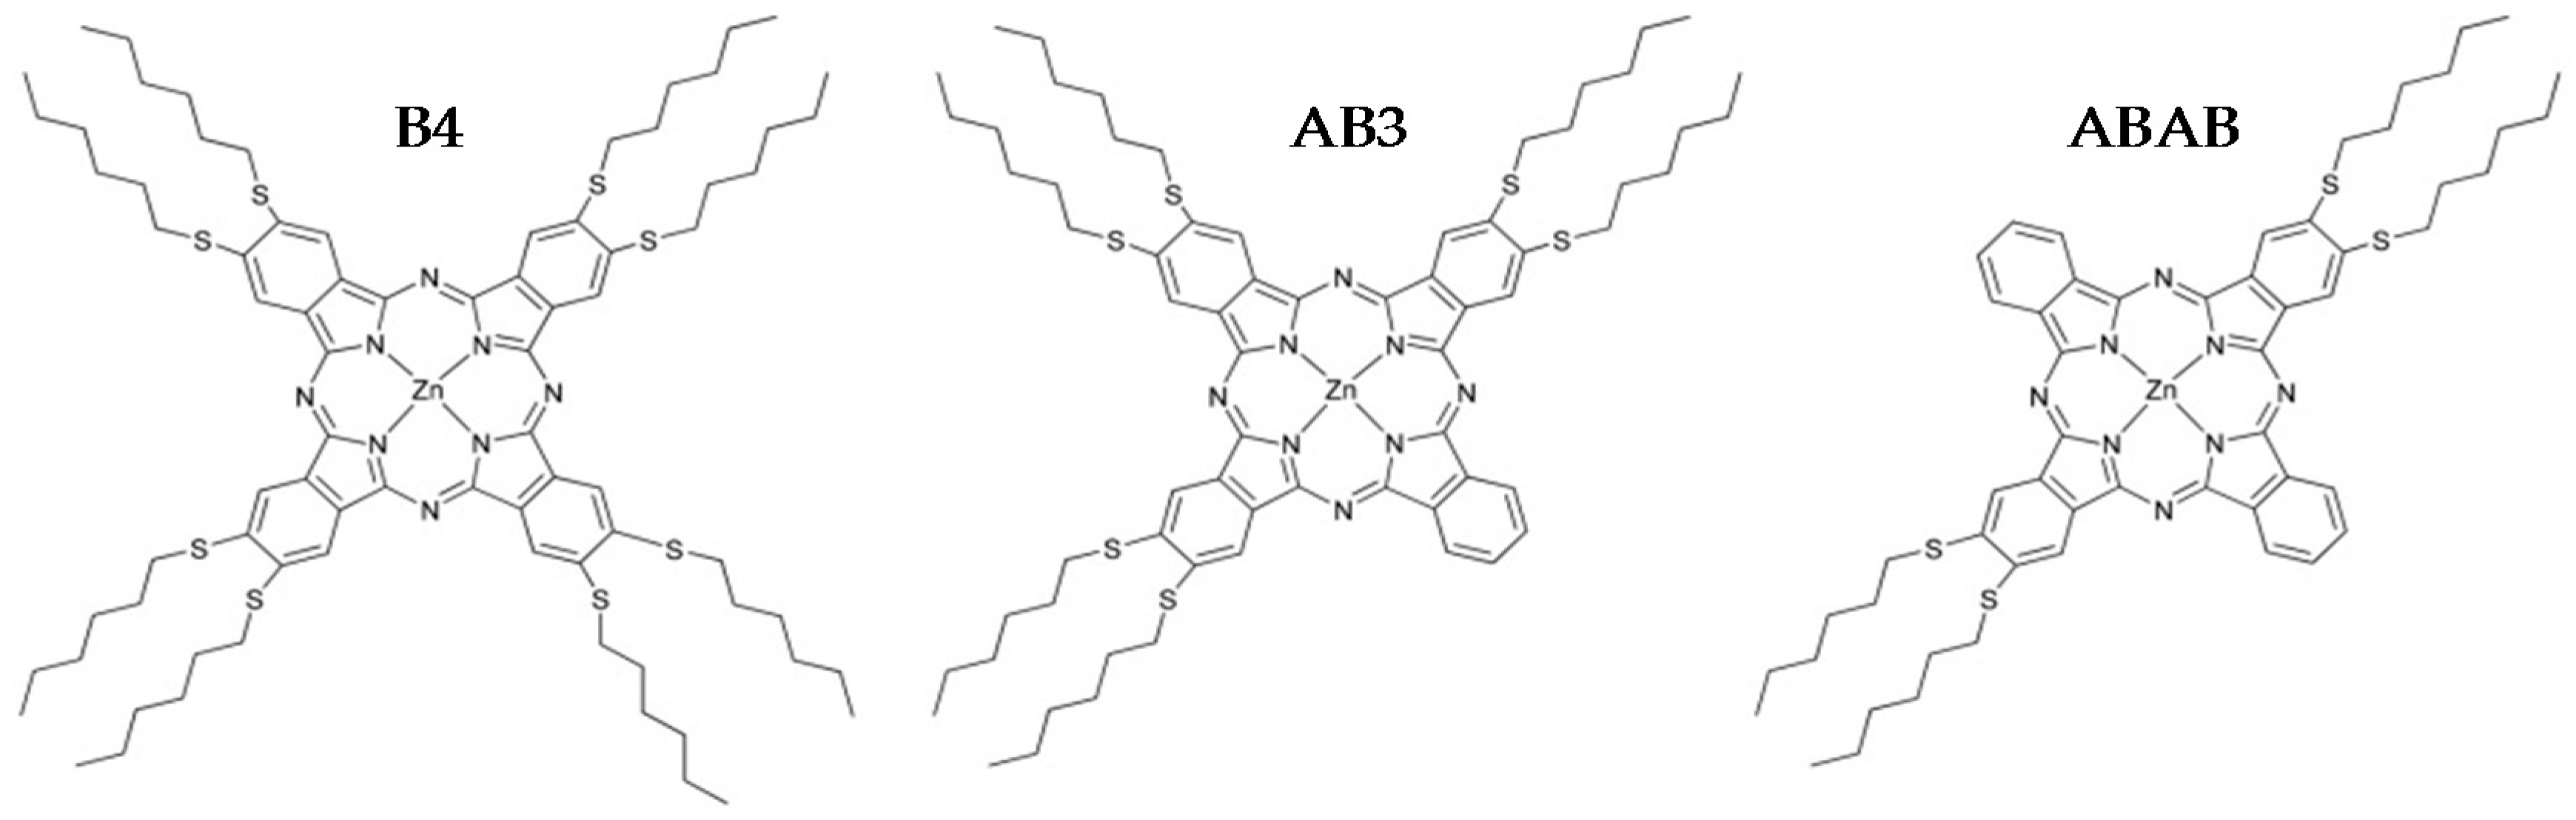
| B4 | 2,3,9,10,16,17,23,24-octakis(hexylthio)phthalocyaninato)zinc |
| AB3 | (2,3,9,10,16,17 hexakis(hexylthio)phthalocyaninato)zinc |
| ABAB | (2,3,16,17-tetrakis(hexylthio)phthalocyaninato)zinc |
| ABAB-H2 | 2,3,16,17-tetra(hexylthio)phthalocyanine |
| AB3-H2 | 2,3,9,10,16,17 hexakis(hexylthio)phthalocyanine |
| RSA | reverse saturation absorption |
| SA | saturable absorption |
| PTZS | pulse train Z-scan technique at 532 nm |
| WLCZS | white light continuum Z-scan |
References
- Claessens, C.G.; Hann, U.; Torres, T. Phthalocyanines: From outstanding electronic properties to emerging applications. Chem. Rec. 2008, 8, 75. [Google Scholar] [CrossRef] [PubMed]
- Garcia, J.; Gonzalez, A.; Gouloumis, A.; Maya, E.M.; Perez, M.D.; Rey, B.D.; Vazquez, P.; Torres, T. Phthalocyanines and Related Compounds: Subunits for the Preparation of Molecular Materials. Turk. J. Chem. 1998, 22, 23–31. [Google Scholar]
- Gregory, P. Industrial applications of phthalocyanines. J. Porphyr. Phthalocya. 2000, 4, 432–437. [Google Scholar] [CrossRef]
- Kadish, K.M.; Smith, K.M.; Guilard, R. Handbook of Porphyrin Science; World Scientific: Singapore, 2012. [Google Scholar]
- Nemykin, V.N.; Dudkin, S.V.; Dumoulin, F.; Hirel, C.; Gurek, A.G.; Ahsen, V. Synthetic approaches to asymmetric phthalocyanines and their analogues. ARKIVOC 2014, (i), 142–204. [Google Scholar]
- Lukyanets, E.A.; Nemykin, V.N. The key role of peripheral substituents in the chemistry of phthalocyanines and their analogs. J. Porphyryns Phthalocyanines 2010, 14, 1–40. [Google Scholar] [CrossRef]
- Nemykin, V.N.; Lukyanets, E.A. Synthesis of substituted phthalocyanines. ARKIVOC 2010, (i), 136–208. [Google Scholar]
- Spikes, J.D. Phthalocyanines; As Photosensitizers in Biological-Systems and for the Photodynamic Therapy of Tumors. Photochem. Photobiol. 1986, 43, 691–699. [Google Scholar] [CrossRef] [PubMed]
- Dougherty, T.J.; Kaufman, J.E.; Goldfarb, A.; Weishaupt, K.R.; Boyle, D.; Mittleman, A. Photoradiation therapy for the treatment of malignant tumors. Cancer Res. 1978, 38, 2628–2635. [Google Scholar] [PubMed]
- Spikes, J.D.J. Chlorins as photosensitizers in biology and medicine. Photochem. Photobiol. B Biol. 1990, 6, 259–264. [Google Scholar] [CrossRef]
- Black, H.S.; Mathewsroth, M.M. Protective role of butylated hydroxytoluene and certain carotenoids in photocarcinogenesis. Photochem. Photobiol. 1991, 53, 707–716. [Google Scholar] [CrossRef] [PubMed]
- Rosenthal, I. Phthalocyanines as Photodynamic sensitizers. Photochem. Photobiol. 1991, 53, 859–870. [Google Scholar] [CrossRef]
- Wohrle, D.; Meissner, D. Organic Solar cells. Adv. Mater. 1991, 3, 129–138. [Google Scholar] [CrossRef]
- Wohrle, D.; Schlettwein, D.; Kirschenmann, M.; Kaneko, M.; Yamada, A. The Combination of Phthalocyanines and Polymers for Electrochemically or Photoelectrochemically Induced Processes. J. Macromol. Sci. A Chem. 1990, 27, 1239–1259. [Google Scholar] [CrossRef]
- Danziger, J.; Dodelet, J.P.; Lee, P.; Nebesny, K.W.; Armstrong, N.R. Heterojunctions formed from phthalocyanines and perylene thin films: Photoelectrochemical characterization. Chem. Mater. 1991, 3, 821–829. [Google Scholar] [CrossRef]
- De Boni, L.; Piovesan, E.; Gaffo, L.; Mendonca, C.R. Resonant Nonlinear Absorption in Zn-Phthalocyanines. J. Phys. Chem. 2008, 112, 6803–6807. [Google Scholar] [CrossRef] [PubMed] [Green Version]
- Topal, S.Z.; İşci, Ü.; Kumru, U.; Atilla, D.; Gürek, A.G.; Hirel, C.; Durmuş, M.; Tommasino, J.B.; Luneau, D.; Berber, S.; et al. Modulation of the electronic and spectroscopic properties of Zn phthalocyanines by their substitution pattern. Dalton Trans. 2014, 43, 6897–6908. [Google Scholar] [CrossRef] [PubMed]
- Calvete, M.; Yang, G.Y.; Hanack, M. Porphyrins and phthalocyanines as materials for optical limiting. Synth. Met. 2004, 141, 231–243. [Google Scholar] [CrossRef]
- Liu, M.O.; Tai, C.H.; Hu, A.T.; Wei, T.H.J. Reverse saturable absorption of lanthanide bisphthalocyanines and their application for optical switches. Organomet. Chem. 2004, 689, 2138–2143. [Google Scholar] [CrossRef]
- Perry, J.W.; Mansour, K.; Marder, S.R.; Perry, K.J.; Alvarez, D.; Choong, I. Enhanced reverse saturable absorption and optical limiting in heavy-atom-substituted phthalocyanines. Opt. Lett. 1994, 19, 625–627. [Google Scholar] [CrossRef] [PubMed]
- Mendonça, C.R.; Gaffo, L.; Misoguti, L.; Moreira, W.C.; Oliveira, O.N.; Zilio, S.C. Characterization of dynamic optical nonlinearities in ytterbium bis-phthalocyanine solution. Chem. Phys. Lett. 2000, 323, 300–304. [Google Scholar] [CrossRef]
- Shirk, J.S.; Pong, R.G.S.; Bartoli, F.J.; Snow, A.W. Optical limiter using a lead phthalocyanine. Appl. Phys. Lett. 1993, 63, 1880–1882. [Google Scholar] [CrossRef]
- Sheik-Bahae, M.; Said, A.A.; Hagan, D.J.; Van Stryland, E.W. Sensitive measurement of optical nonlinearities using a single beam. J. Quantum Electron. 1990, 26, 760–769. [Google Scholar] [CrossRef]
- Misoguti, L; Mendoça, C.R.; Zilio, E.S.C. Characterization of dynamic optical nonlinearities with pulse trains. Appl. Phys. 1999, 74, 1531–1533. [Google Scholar]
- De Boni, L.; Correa, D.S.; Pavinatto, F.J.; dos Santos, D.S., Jr.; Mendonça, C.R. Excited state absorption spectrum of chlorophyll obtained with white-light continuum. J. Chem. Phys. 2007, 126, 165102. [Google Scholar] [CrossRef] [PubMed]
- Oliveira, S.L.; Corrêa, D.S.; De Boni, L.; Misoguti, L.; Zilio, S.C.; Mendonça, C.R. Two-photon absorption cross-section spectrum of a π-conjugated polymer obtained using the white-light continuum Z-scan technique. Appl. Phys. Lett. 2006, 88, 21911. [Google Scholar] [CrossRef]
- De Boni, L.; Gaffo, L.; Misoguti, L.; Mendonça, C.R. Nonlinear absorption spectrum of ytterbium bis-phthalocyanine solution measured by white-light continuum Z-scan technique. Chem. Phys. Lett. 2006, 419, 417–420. [Google Scholar] [CrossRef]
- Nemykin, V.N.; Kobayashi, N.; Nonomura, T.; Luk’yanets, E.A. Low symmetrical phthalocyanines having spectroscopic and electrochemical properties characteristic of unexpected accidental S1 state degeneracy and non-planar distortions. Chem. Lett. 2000, 29, 184–185. [Google Scholar] [CrossRef]
- Parnis, M.J.; Oldham, K.B. Beyond the Beer–Lambert law: The dependence of absorbance on time in photochemistry. J. Photochem. Photobiol. A Chem. 2013, 267, 6–10. [Google Scholar] [CrossRef]
- Zhu, H.; Li, Y.; Chen, J.; Zhou, M.; Niu, Y.; Zhang, X.; Guo, Q.; Wang, S.; Yang, G.; Xia, A. Excited-State Deactivation of Branched Phthalocyanine Compounds. Chem. Phys. Chem. 2015, 16, 3893–3901. [Google Scholar] [CrossRef] [PubMed]
- Howe, L.; Zhang, J.Z. Ultrafast Studies of Excited-State Dynamics of Phthalocyanine and Zinc Phthalocyanine Tetrasulfonate in Solution. J. Phys. Chem. 1997, 101, 3207–3213. [Google Scholar] [CrossRef]
- Turro, N.J. Modern Molecular Photochemistry; The Benjamin/Cummings Publishing Co. Inc.: Menlo Park, CA, USA, 1978. [Google Scholar]
- Lewis, G.N.; Calvin, M. The Color of Organic Substances. Chem. Rev. 1939, 25, 273–328. [Google Scholar] [CrossRef]
- Yuksek, K.; Elmali, A.; Durmus, M.; Yaglioglu, H.G.; Unver, H.; Nyokong, T. Good optical limiting performance of indium and gallium phthalocyanines in a solution and co-polymer host. J. Opt. 2010, 12. [Google Scholar] [CrossRef]
- Shirk, J.S.; Pong, R.G.S.; Flom, S.R.; Bartoli, F.J.; Boyli, M.E.; Snow, A.W. Lead pthalocyanine reverse saturable absorption optical limiters. Pure Appl. Opt. 1996, 5, 701–707. [Google Scholar] [CrossRef]
- Dini, D.; Calvete, M.J.F.; Hanack, M.; Chen, W.; Ji, W. Synthesis of axially substituted gallium, indium and thallium phthalocyanines with nonlinear optical properties. RKIVOC 2006, 2006, 77–96. [Google Scholar]
- Vivas, M.G.; De Boni, L.; Gaffo, L.; Mendonça, C.R. Investigation of ground and excited state photophysical properties of gadolinium phthalocyanine. Dyes Pigment. 2014, 101, 338–343. [Google Scholar] [CrossRef]
- Ayhan, M.M.; Singh, A.; Hirel, C.; Gürek, A.G.; Ahsen, V.; Jeanneau, E.; Ledoux-Rak, I.; Zyss, J.; Andraud, C.; Bretonnière, Y. ABAB Homoleptic Bis(phthalocyaninato)lutetium(III) Complex: Toward the Real Octupolar Cube and Giant Quadratic Hyperpolarizability. J. Am. Chem. Soc. 2012, 134, 3655–3658. [Google Scholar] [CrossRef] [PubMed]
- Gürek, A.G.; Bekâroğlu, Ö. Octakis(alkylthio)-substituted Phthalocyanines and their Interactions with Silver(I) and Palladium(II) Ions. J. Chem. Soc. Dalton Trans. 1994, 9, 1419–1423. [Google Scholar] [CrossRef]
- Sigma Aldrich. Available online: http://www.sigmaaldrich.com. (accessed on 25 February 2016).
- Correra, D.S.; De Boni, L.; Misoguti, L.; Cohanoschi, I.; Hernandez, F.E.; Mendonça, C.R. Z-scan theoretical analysis for three-, four- and five-photon absorption. Opt. Commun. 2007, 227, 440–445. [Google Scholar] [CrossRef]
- Guedes, I.; Misoguti, L.; De Boni, L.; Zilio, S.C. Heterodyne Z-scan measurements of slow absorbers. J. Appl. Phys. 2007, 101, 63112. [Google Scholar] [CrossRef]
- De Boni, L.; Andrade, A.A.; Misoguti, L.; Mendonça, C.R.; Zilio, S.C. Z-scan measurements using femtosecond continuum generation. Opt. Exp. 2004, 12, 3921–3927. [Google Scholar] [CrossRef]
- Sample Availability: Samples of the compounds are not available from the authors.


| Compound | (ns) | (ns) | (ns) | (ns) | kr (×107 s−1) | |||
|---|---|---|---|---|---|---|---|---|
| B4 | 3.1 ± 0.2 | 0.096 | 32.3 ± 0.5 | 4.4 ± 0.2 | 0.717 | 16.5 ± 0.5 | 0.19 | 3.1 |
| AB3 | 3.2 ± 0.1 | 0.181 | 17.7 ± 0.3 | 5.3 ± 0.1 | 0.608 | 15.1 ± 0.6 | 0.21 | 5.6 |
| ABAB | 3.0 ± 0.1 | 0.207 | 14.5 ± 0.2 | 6.5 ± 0.3 | 0.474 | 9.4 ± 0.5 | 0.32 | 6.9 |
© 2016 by the authors. Licensee MDPI, Basel, Switzerland. This article is an open access article distributed under the terms and conditions of the Creative Commons Attribution (CC-BY) license ( http://creativecommons.org/licenses/by/4.0/).
Share and Cite
Zucolotto Cocca, L.H.; Ayhan, M.M.; Gürek, A.G.; Ahsen, V.; Bretonnière, Y.; De Paula Siqueira, J.; Gotardo, F.; Mendonça, C.R.; Hirel, C.; De Boni, L. Mechanism of the Zn(II)Phthalocyanines’ Photochemical Reactions Depending on the Number of Substituents and Geometry. Molecules 2016, 21, 635. https://doi.org/10.3390/molecules21050635
Zucolotto Cocca LH, Ayhan MM, Gürek AG, Ahsen V, Bretonnière Y, De Paula Siqueira J, Gotardo F, Mendonça CR, Hirel C, De Boni L. Mechanism of the Zn(II)Phthalocyanines’ Photochemical Reactions Depending on the Number of Substituents and Geometry. Molecules. 2016; 21(5):635. https://doi.org/10.3390/molecules21050635
Chicago/Turabian StyleZucolotto Cocca, Leandro Henrique, Mehmet Menaf Ayhan, Ayşe Gül Gürek, Vefa Ahsen, Yann Bretonnière, Jonathas De Paula Siqueira, Fernando Gotardo, Cleber Renato Mendonça, Catherine Hirel, and Leonardo De Boni. 2016. "Mechanism of the Zn(II)Phthalocyanines’ Photochemical Reactions Depending on the Number of Substituents and Geometry" Molecules 21, no. 5: 635. https://doi.org/10.3390/molecules21050635