Article

Transcriptomic Analysis of Leaf in Tree Peony Reveals Differentially Expressed Pigments Genes

College of Landscape Architecture and Art, Northwest A & F University, Yangling 712100, Shaanxi, China
*
Authors to whom correspondence should be addressed.
Molecules 2017, 22(2), 324; https://doi.org/10.3390/molecules22020324
Submission received: 15 January 2017 / Accepted: 13 February 2017 / Published: 20 February 2017
(This article belongs to the Section Molecular Diversity)

Abstract

:
Tree peony (Paeonia suffruticosa Andrews) is an important traditional flower in China. Besides its beautiful flower, the leaf of tree peony has also good ornamental value owing to its leaf color change in spring. So far, the molecular mechanism of leaf color change in tree peony is unclear. In this study, the pigment level and transcriptome of three different color stages of tree peony leaf were analyzed. The purplish red leaf was rich in anthocyanin, while yellowish green leaf was rich in chlorophyll and carotenoid. Transcriptome analysis revealed that 4302 differentially expressed genes (DEGs) were upregulated, and 4225 were downregulated in the purplish red leaf vs. yellowish green leaf. Among these DEGs, eight genes were predicted to participate in anthocyanin biosynthesis, eight genes were predicted involved in porphyrin and chlorophyll metabolism, and 10 genes were predicted to participate in carotenoid metabolism. In addition, 27 MYBs, 20 bHLHs, 36 WD40 genes were also identified from DEGs. Anthocyanidin synthase (ANS) is the key gene that controls the anthocyanin level in tree peony leaf. Protochlorophyllide oxido-reductase (POR) is the key gene which regulated the chlorophyll content in tree peony leaf.

1. Introduction

Tree peony (Paeonia suffruticosa Andr.) is a woody shrub of the genus Paeonia and family Paeoniaceae, and is a traditional ornamental flower because of its large, showy, and colorful flowers [1]. Besides its beautiful flower, the leaf of tree peony has also good ornamental value owing to its leaf color change in spring.
Coloration of plant organs such as flowers, fruit and leaves is governed by pigments in plants [2]. There are four main classes of pigments for coloration in plants: flavonoids/anthocyanins, chlorophylls, carotenoids, and betalains [3]. Flavonoids, particularly anthocyanins, acting as major pigments that responsible for the orange to blue colors found in many plant flowers, leaves, fruits, seeds, and other tissues [2,3,4]. Chlorophylls including chlorophyll a and chlorophyll b, the photosynthetic pigments that play essential roles in plant photosynthesis, are main pigments in plant green leaf [5]. Carotenoid belong to the isoprenoid pigments, which are usually responsible for yellow-orange colors [6,7]. Carotenoids are also photosynthetic pigments that usually exist in plant leaf with chlorophylls. Betalains are the yellow and violet pigments belong to the order Caryophyllales, and they only exist in very few plants such as Beta vulgaris and Suaeda salsa [8,9]. In plants, anthocyanins and betalains are usually mutual exclusive, which are never found together in the same plant [10].
Prior to advancements in this field, researchers mainly focused on floral flavonoid/anthocyanin pigment components detection [11,12,13], or flavonoid/anthocyanin genes of petal analysis in tree peony [14,15,16,17]. As far as we know, there has been no report on leaf pigments components detection and related gene analysis in tree peony. In the absence of a complete genome sequence in tree peony, transcriptomic analysis is an effective method for gaining insights into differentially expressed genes (DEGs) between different color leaves. Transcriptome sequencing of the different leaf color stages of tree peony will provide useful insights into the molecular mechanisms of tree peony leaf color changes in spring. Therefore, the leaf pigment levels of different stages in tree peony was analyzed. The different leaf color stage transcriptomes were compared, and the DEGs were filtered. Our main objective was to annotate and analyze the DEGs involved in flavonoid/anthocyanin biosynthesis, chlorophyll and carotenoid biosynthesis to identify the candidate genes responsible for tree peony purplish red leaf in spring.

2. Results

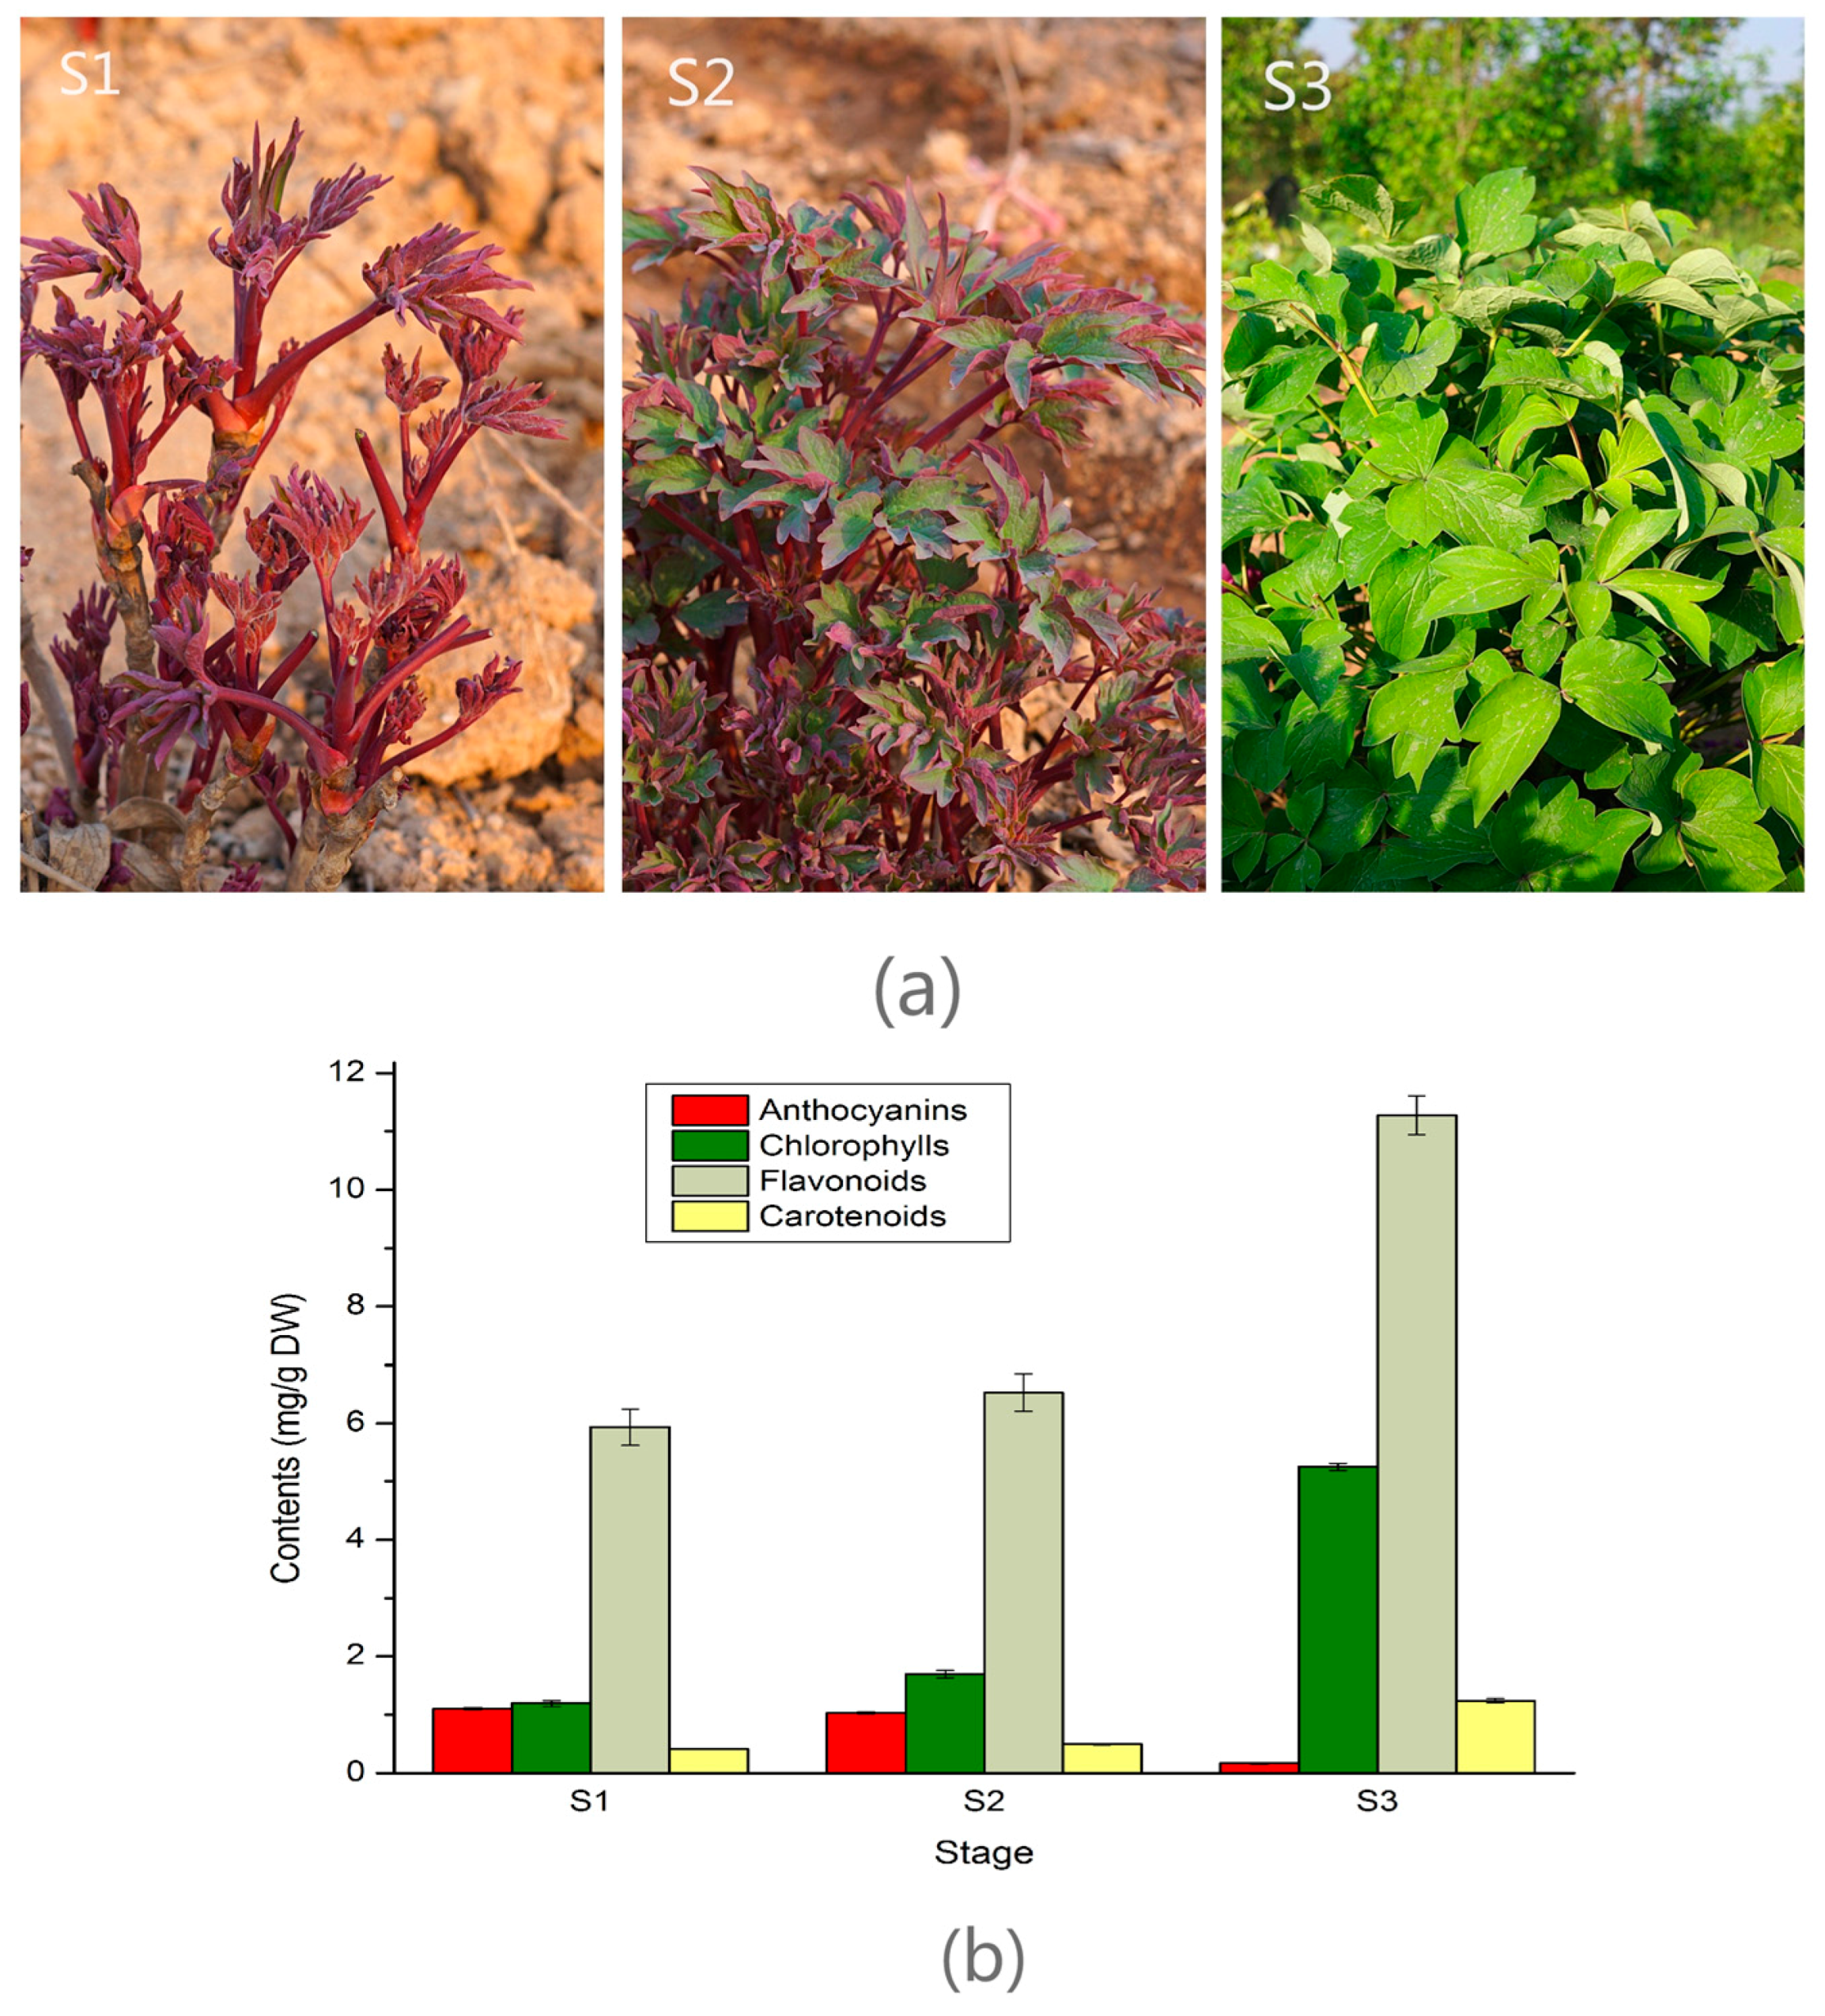
2.1. Pigments Level in the Leaf of Three Developmental Stages in Tree Peony

In spring, as the tree peony leaf developed two major physiological changes, color fading and yellowish greening were visually apparent (Figure 1a). The tree peony leaf color was purplish red at S1, then changed to half purplish red and half yellowish green at S2, finally yellowish green at S3. As shown in Figure 1b, the anthocyanin contents were decreased from S1 to S3. While the total flavonoid, carotenoid, and chlorophyll contents were increased from S1 to S3. These indicated that the change in leaf color phenotypes of tree peony ‘Man Yuan Chun Guang’ was mainly caused by the decrease of anthocyanin content and increase of chlorophyll and carotenoid.

2.2. Library Construction and Transcriptome Sequencing

To understand the molecular basis of leaf color change in tree peony, the leaves of S1, S2, and S3 were used to build three libraries for high-throughput sequencing. 64,530,684; 67,008,409; and 69,283,538 raw reads were obtained from S1, S2, and S3 sequencing libraries, respectively. After removal of adaptor sequences, ambiguous reads, and low-quality reads, 62,835,627; 65,363,790; and 67,681,919 high quality clean reads comprising 9.43, 9.80,10.15 Gb nucleotides with Q20 > 98% were generated from S1, S2, and S3 transcriptome sequencing. In total, 53,323 unigenes with an N50 of 1215 were generated byTrinity 2.1.1 (Broad Institute, Cambridge, MA, USA). The min length, max length and average length of these unigenes were 201, 13121, and 801 nt, respectively. The size distributions of these unigenes are shown in Supplementary Materials Figure S1.

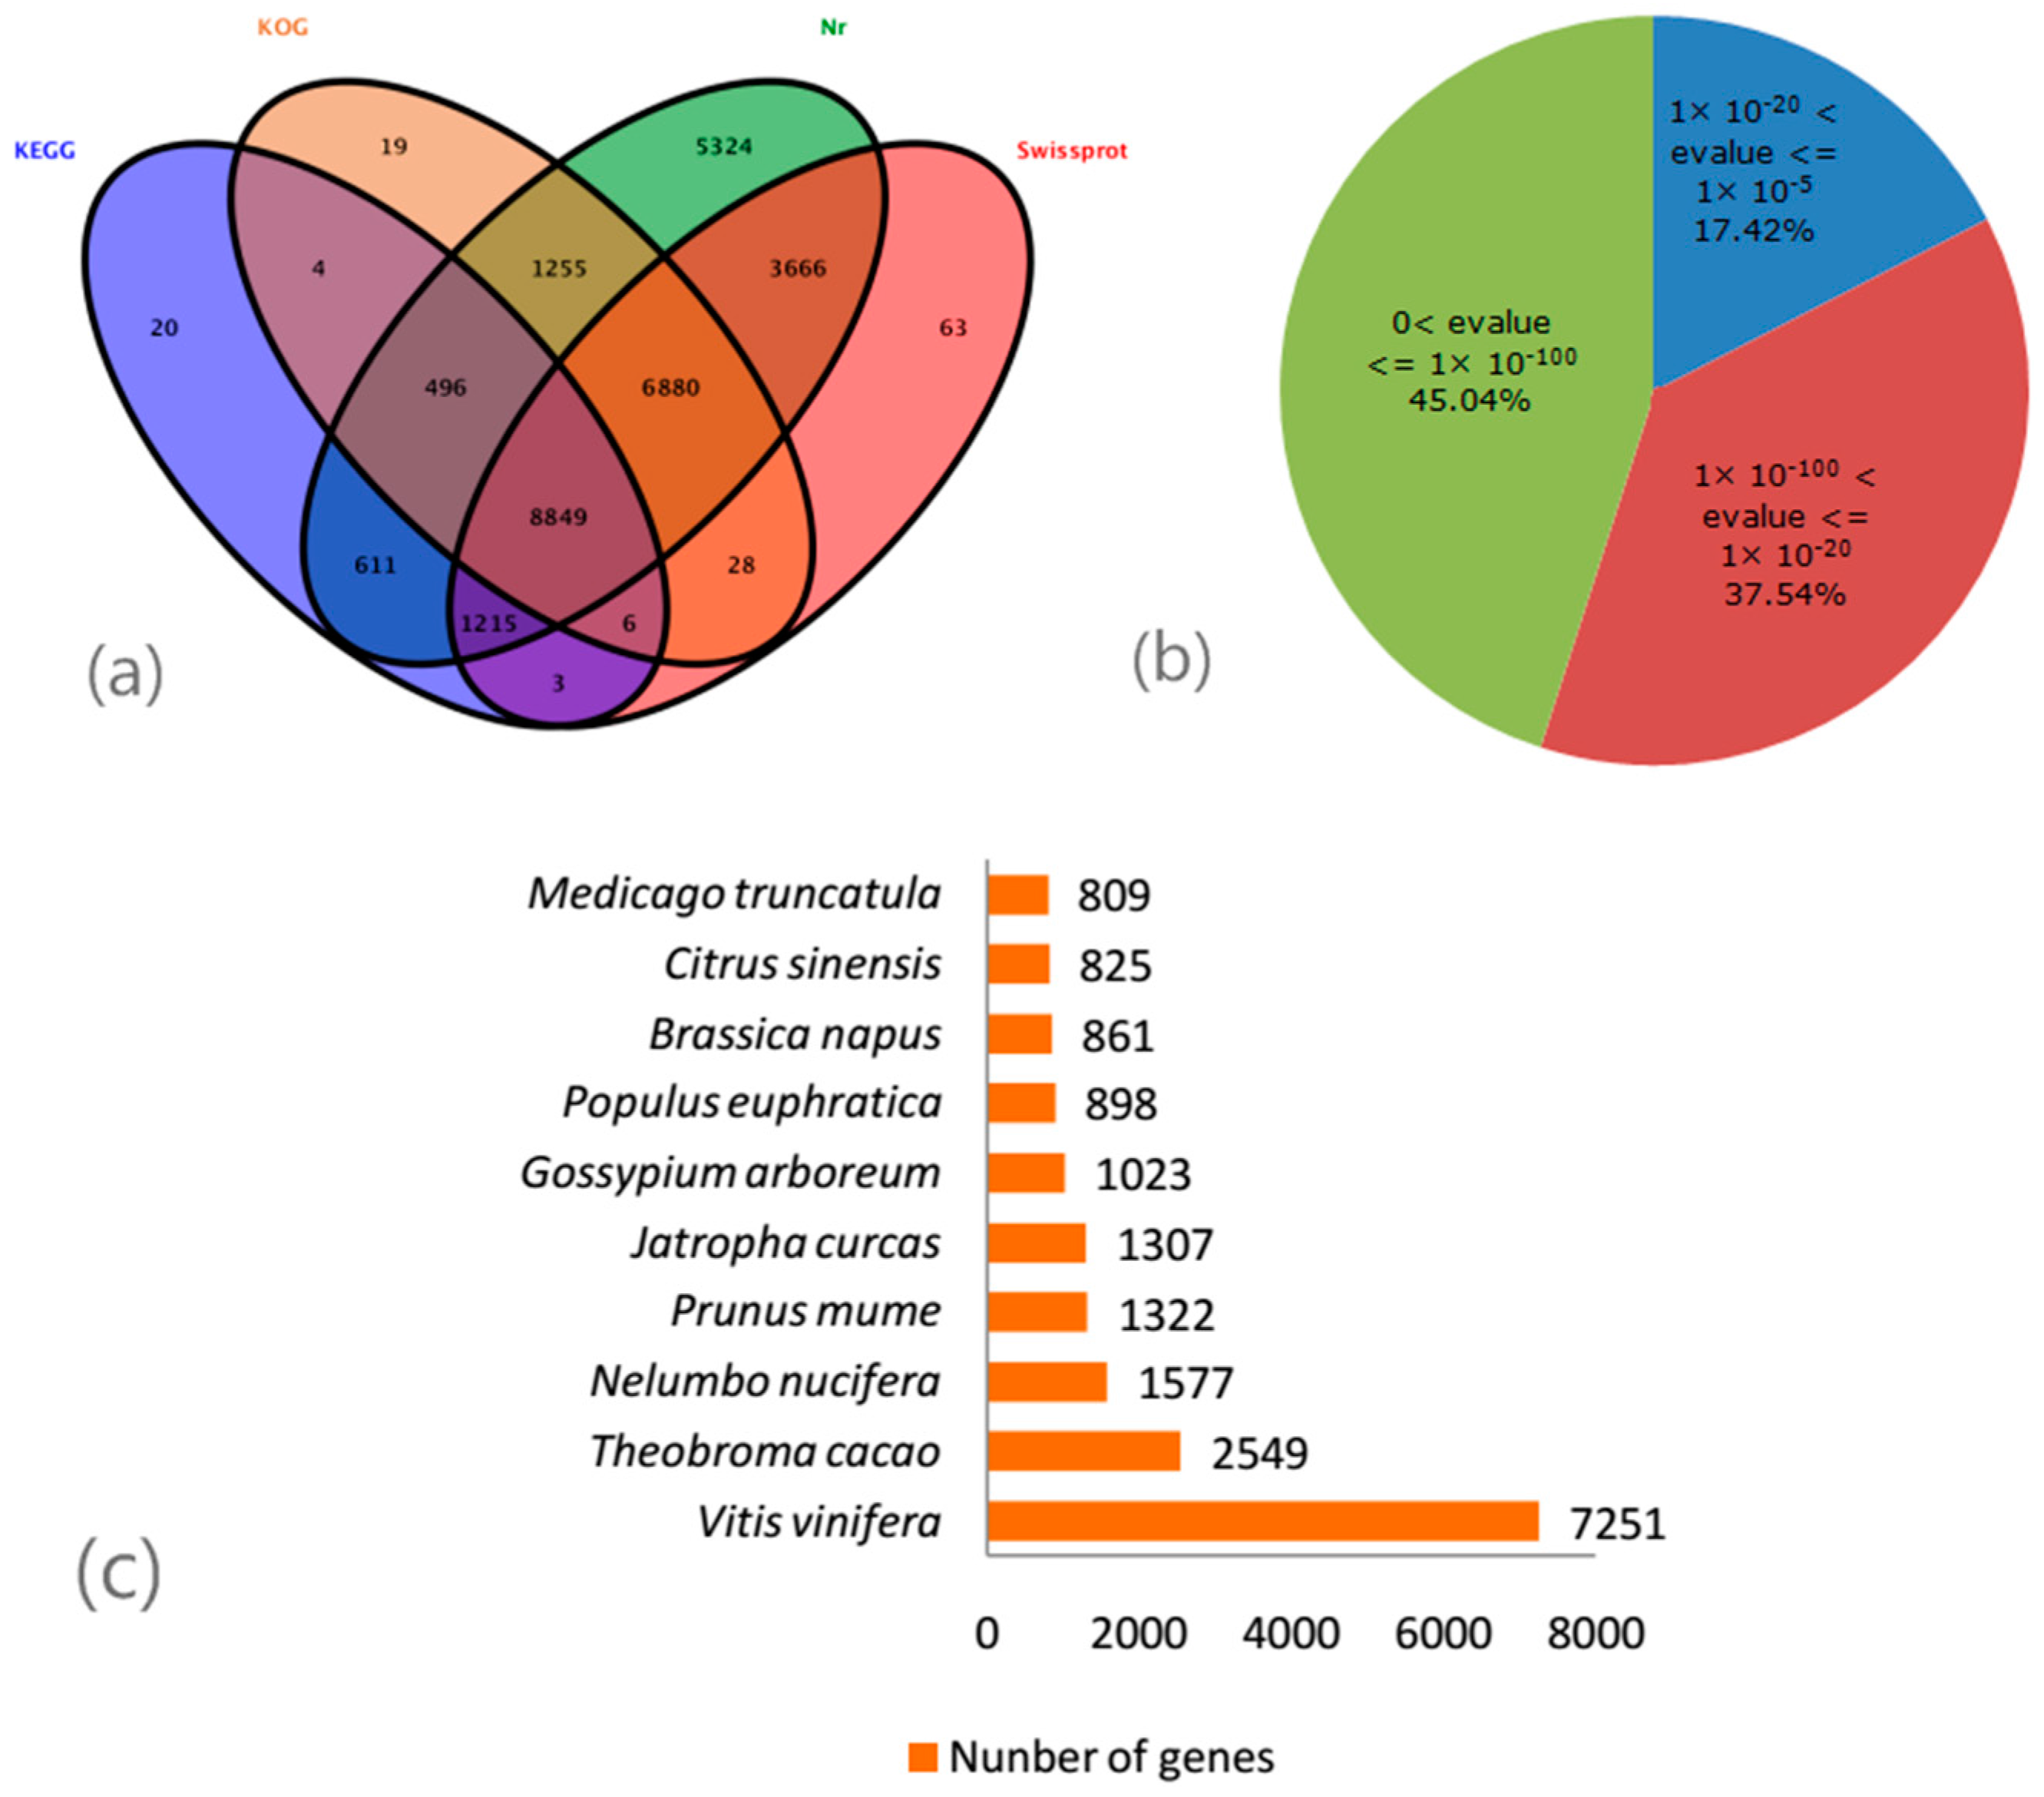
2.3. De Novo Assembly and Gene Annotation

A total of 28,439 unigenes (53.33% of all 53,323 cleaned unigenes) were annotated based on BLAST+ 2.4.0 (http://www.ncbi.nlm.nih.gov/BLAST/) (E-value < 1 × 10⁻⁵) searches of four public databases. Among them, 28,296 unigenes (53.06%); 20,710 (38.84%); 17,537 (32.89%); 11,204 (21.01%) could be annotated to the NCBI nr database released 31 August 2016 (http://www.ncbi.nlm.nih.gov), the Swiss-Prot protein database (http://www.expasy.ch/sprot), the COG/KOG databases (http://www.ncbi.nlm.nih.gov/COG), and the KEGG database (http://www.genome.jp/kegg), respectively (Figure 2a). Based on the NCBI nr annotations, 45.04% of the annotated sequences had very strong homology (E-value ≤ 1 × 10−100), 37.54% showed strong homology (1 × 10−100 < E-value ≤ 1 × 10⁻²⁰), an additional 17.42% showed homology (1 × 10⁻²⁰ < E-value ≤ 1 × 10⁻⁵) to available plant sequences (Figure 2b). 7251 unique sequences had top matches to sequences from Vitis vinifera, and followed by Theobroma cacao (2549), Nelumbo nucifera (1577), Prunus mume (1322), Jatropha curcas (1307), Gossypium arboreum (1023), Populus euphratica (898), Brassica napus (861), Citrus sinensis (825), and Medicago truncatula (809) (Figure 2c).

2.4. Identification and Analysis of DEGs between Three Leaf Color Stages

The thresholds false discovery rate (FDR) < 0.05 and absolute value of log2 ratio > 1 were used to judge the significance of the DEGs at three leaf color stages (S1 vs. S2, S2 vs. S3, S1 vs. S3). There were 797 DEGs between S1 and S2 libraries, in which 575 unigenes were significantly upregulated and 222 unigenes were downregulated. A total of 7587 DEGs were found between S2 and S3 libraries, with 3627 downregulated and 3960 upregulated. Finally, the greatest number of differentially expressed genes (8527 DEGs) occurred between S1 and S3 libraries, with 4225 downregulated and 4302 upregulated (Figure 3). Therefore, DEGs between S1 and S3 libraries were used for further analysis.
Among those differentially expressed genes with a KEGG pathway annotation released 1 July 2016 (http://www.genome.jp/kegg), 1436 DEGs in S1 vs. S3 library were mapped to 121 pathways (Table S1). Since plant leaf pigment was mainly correlated with the accumulation of anthocyanin, chlorophyll, and carotenoid, we were interested in these pigments biosynthesis pathway. Seven pathways including ‘phenylpropanoid biosynthesis’ (44 DEGs, ko00940), ‘flavonoid biosynthesis’ (8 DEGs, ko00941), ‘flavone and flavonol biosynthesis’ (1 DEGs, ko00944), ‘anthocyanin biosynthesis’ (2 DEGs, ko00942), ‘carotenoid biosynthesis’ (13 DEGs, ko00906), ‘isoflavonoid biosynthesis’ (3 DEGs, ko00943), and ‘porphyrin and chlorophyll metabolism’ (4 DEGs, ko00860) were identified which were related to plant organ color development. In addition, there were six glucide metabolic pathways, including ‘starch and sucrose metabolism’ (63 DEGs, ko00500), ‘glycosaminoglycan degradation’ (1 DEG, ko00531), ‘amino sugar and nucleotide sugar metabolism’ (28 DEGs, ko00520), ‘pentose and glucuronate interconversions’ (21 DEGs, ko00040), ‘fructose and mannose metabolism’ (23 DEGs, ko00051), and ‘glycolysis/gluconeogenesis’ (42 DEGs, ko00010). All of these metabolic pathways may relate to the synthesis of substrates for anthocyanin biosynthesis.

2.5. Annotation of DEGs Probably Involved in Flavonoid/Anthocyanin Biosynthesis

By annotation in public database, eight DEGs were predicted to participate in flavonoid/anthocyanin biosynthesis pathway (Table 1). Among them, Unigene0034354, Unigene0040930, Unigene0046696, and Unigene0028008 were annotated as flavanone 3-hydroxylase (F3H), flavonoid 3′-hydroxylase (F3′H), dihydroflavonol 4-reductase (DFR), and anthocyanidin synthase (ANS), respectively. They were the same genes with that reported previously in tree peony [14]. Unigene0004270 has 59% amino acid similarity with chalcone isomerase (CHI) (JN119872) in herbaceous peony, Unigene0018412 was annotated as hydroxycinnamoyl transferase (HCT), encoding HCT which catalyze p-coumaroyl-CoA into caffeoyl-CoA that is continually converted to eriodictyol (a flavanone). Unigene0036137 and Unigene0052871 were annotated as UDP-glycosyltransferase and glucoside glucosyltransferase, these two genes were related with anthocyanidin glycosylation.
In anthocyanin biosynthesis pathway, the spatial and temporal expression of structural genes such as F3H, DFR, and ANS is usually controlled by transcription factors from MYB, bHLH, and WD40 families [18,19,20,21]. In our study 27 MYBs, 20 bHLHs, and 36 WD40 were identified from DEGs (Table 2). Among these transcription factors, 15 MYBs, 15 bHLHs, and 29 WD40 were upregulated in purplish red leaf. It indicated that these upregulation transcription factors were positively related with anthocyanin level in tree peony leaf.

2.6. Annotation of DEGs Probably Involved in Chlorophyll Biosynthesis

Four DEGs involved in porphyrin and chlorophyll metabolism between S1 and S3 were identified, while in S2 vs. S3, eight DEGs involved in porphyrin and chlorophyll metabolism were found. Therefore, these eight DEGs involved in porphyrin and chlorophyll metabolism in S2 vs. S3 were used for further analysis (Table 3). As shown in Table 3, Unigene0031269, Unigene0022913, Unigene0032398, Unigene0036679, Unigene0026448, and Unigene0047139 showed higher transcript abundance in S3 compared with S2, while the expression level of Unigene0045551 and Unigene0039869 were lower in S3 than in S2. It implied that the expression of Unigene0031269, Unigene0022913, Unigene0032398, Unigene0036679, Unigene0026448, and Unigene0047139 have a positive role in chlorophyll accumulation. According to the public database, Unigene0031269, Unigene0022913, Unigene0032398, Unigene0036679, Unigene0026448, and Unigene0047139 were annotated as Mg-protoporphyrinogen IX monomethylester cyclase gene (CRD1), divinyl reductase gene (DVR), protochlorophyllide oxidoreductase gene (POR) [22], chlorophyllide a oxygenase gene (CAO), protoheme ferro-lyase gene (HEMH), and pheophorbide a oxygenase gene (PAO).

2.7. Annotation of DEGs Probably Involved in Carotenoid Biosynthesis

In addition, 10 DEGs were predicted to participate in carotenoid biosynthesis metabolism by annotation in public database (Table 4). Unigene0029992, Unigene0030040, Unigene0039699, Unigene0025170, Unigene0013558, Unigene0023761, Unigene0016440, Unigene0032549, Unigene0027491, and Unigene0051809 were annotated as phytoene synthase (PSY), phytoene desaturase (PDS), ζ-carotene desaturase (ZDS), β-carotene isomerase (B-ISO), violaxanthin de-epoxidase (VDE), lycopene β cyclase (LCYB), lycopene epsilon cyclase (LCYE), β-carotene hydroxylase (CHYB), zeaxanthin epoxidase (ZEP), and carotenoid cleavage dioxygenase (NECD) [7,23,24]. All of these genes were upregulated in S3 stage than in S1 according to RNA-Seq data. In real-time quantitative PCR, these 10 Unigenes were also expressed higher in S3 than in S1 (Figure 4c).

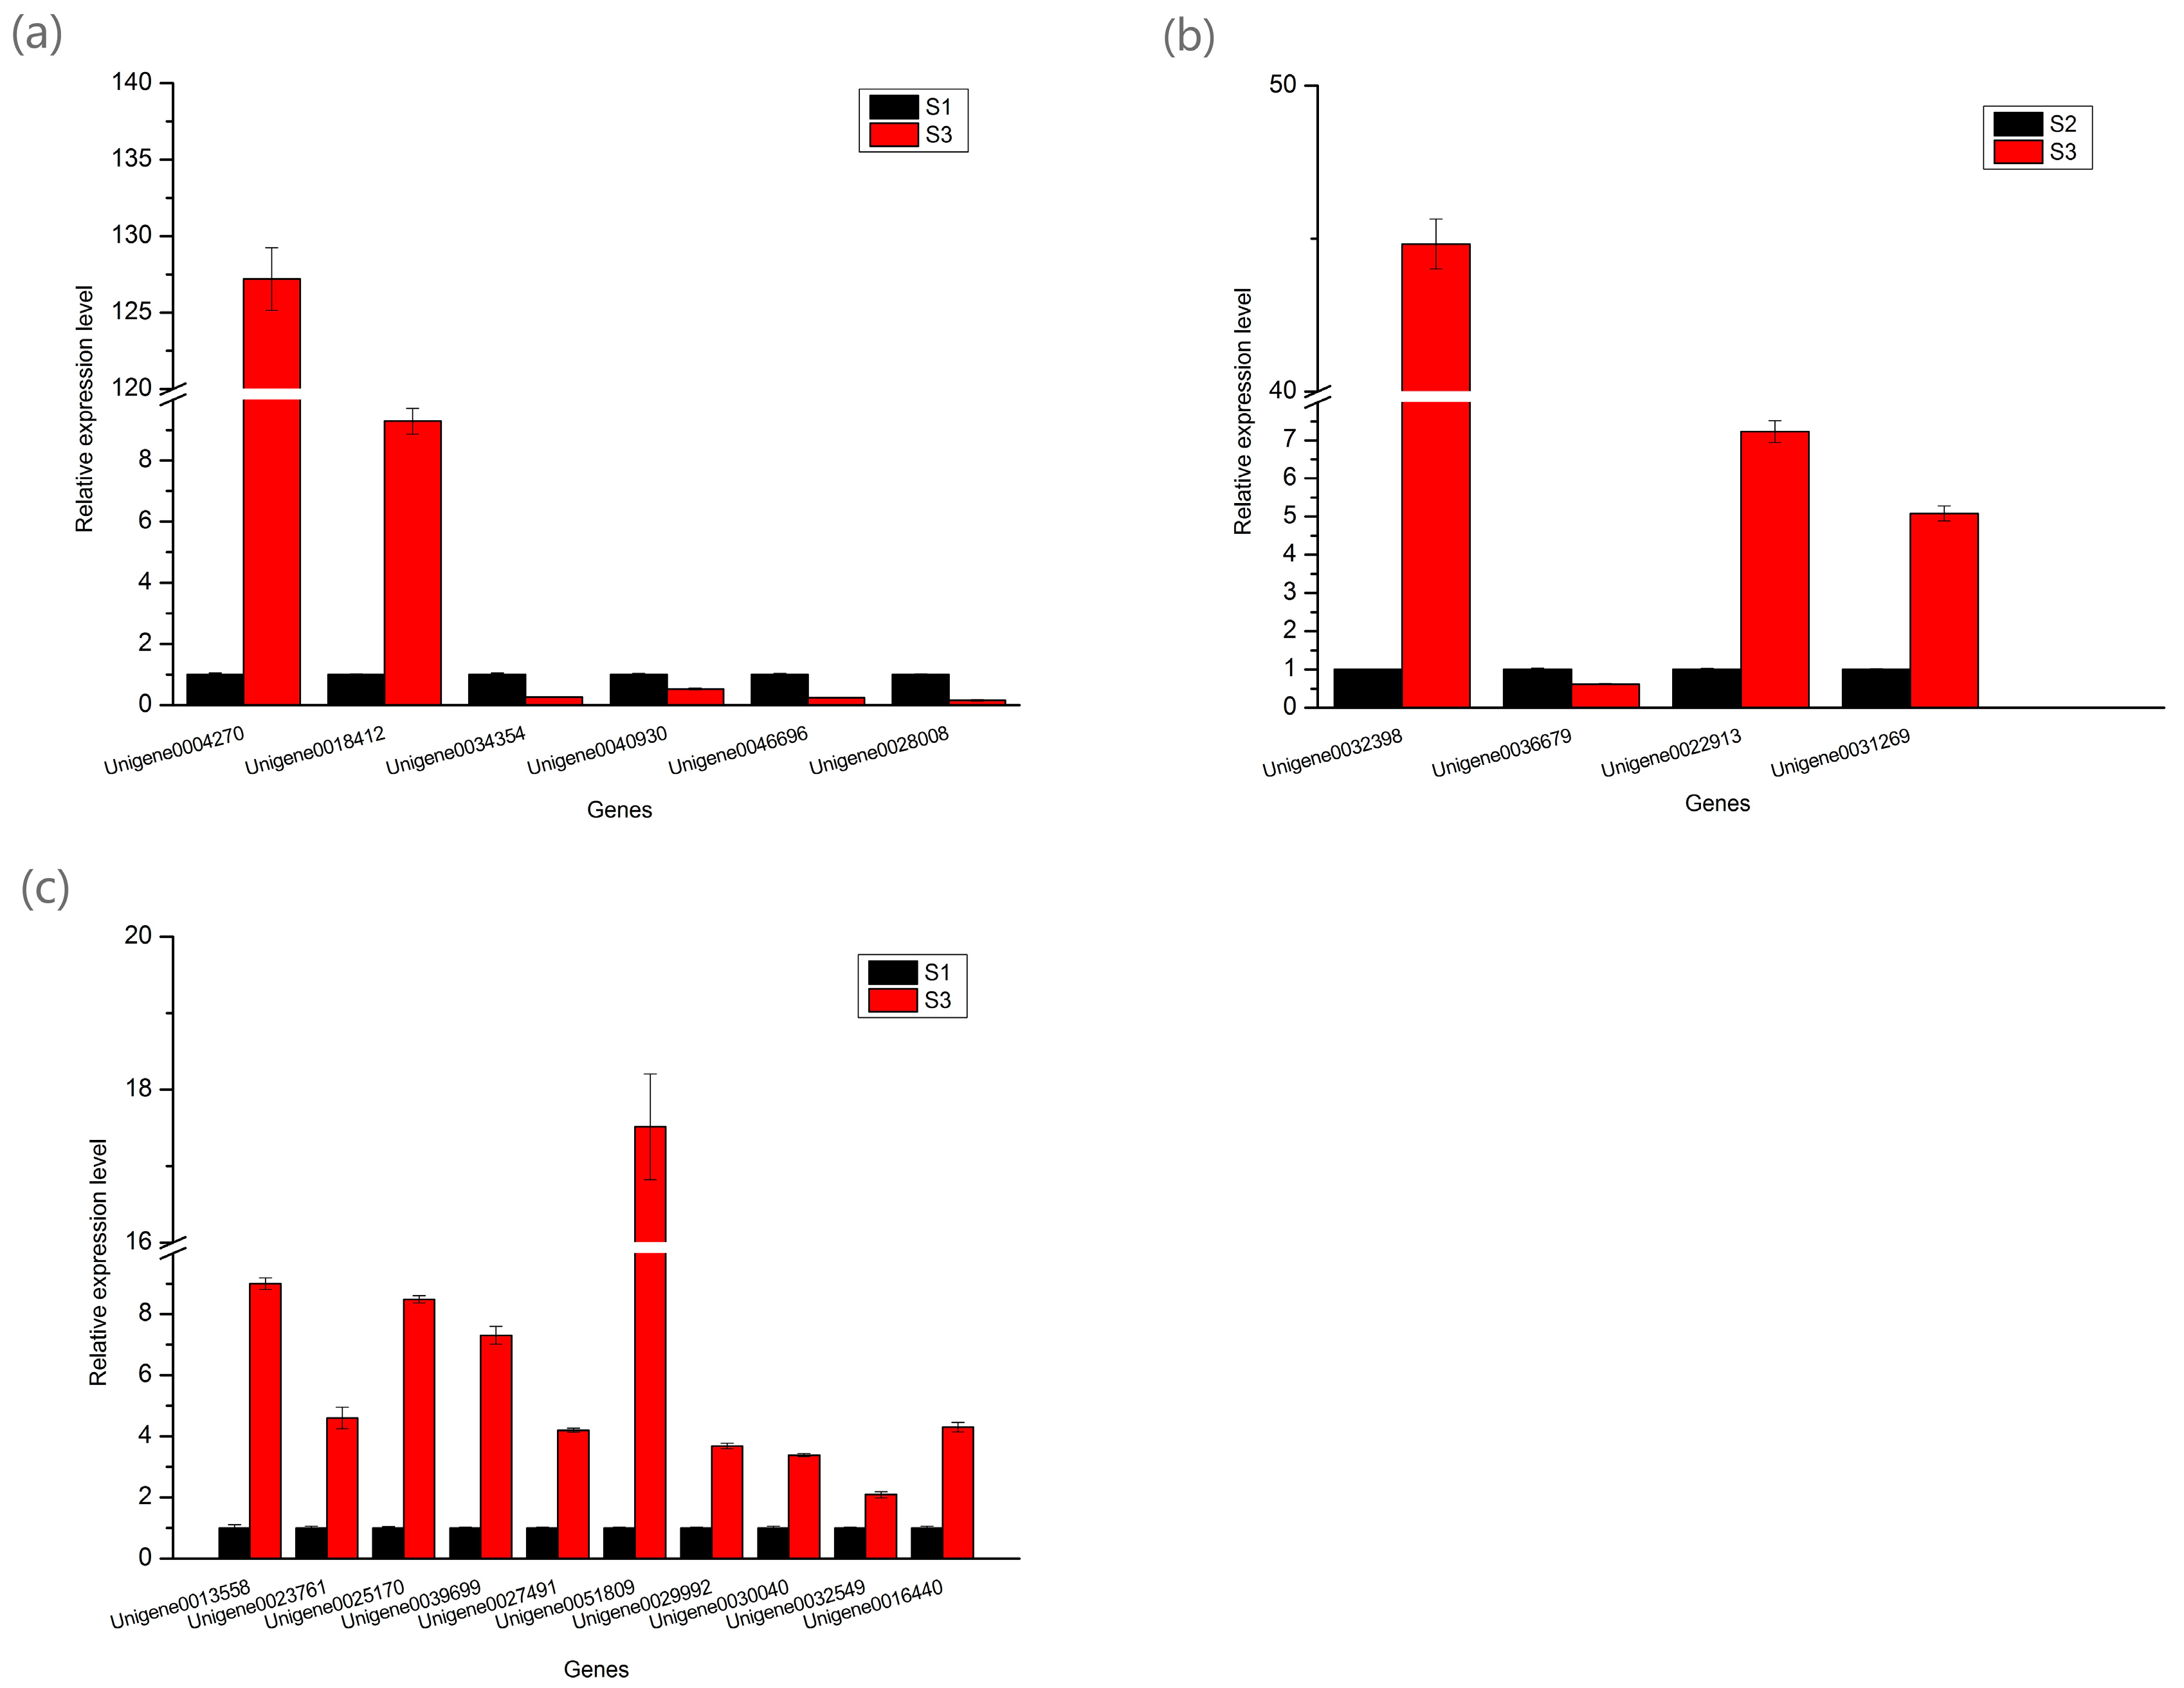
2.8. Real-Time Quantitative PCR Analysis of the DEGs Involved in Pigment Biosynthesis

To test the reliability of the RNA-Seq data, 20 DEGs participated in tree peony leaf pigments biosynthesis including 6 DEGs involved in anthocyanin biosynthesis, 4 DEGs involved in chlorophyll biosynthesis, and 10 DEGs involved in carotenoid biosynthesis were selected for real-time quantitative PCR (q-PCR) analysis. Unigene0020903 (ubiquitin) was used as internal control. The expression patterns revealed by q-PCR analysis were similar to those revealed by RNA-Seq for the same genes (Figure 4).

3. Discussion

Non-green leaves occur in many plants which are very popular in modern landscape garden with its unique ornamental values. Prior to the previous reports, there are three main pigments responsible for non-green leaves. Anthocyanidin accumulation was a major reason for the formation of red color leaves [25,26,27]. Carotenoid was usually responsible for the formation of yellow color [6,28]. Chlorophyll is mainly responsible for the formation of green color [28,29]. High concentrations of chlorophylls can mask the red or yellow color that is provided by anthocyanin or carotenoid [29,30]. In the present study, leaf color altered from purplish red to yellowish green complied with leaf development of tree peony. The anthocyanidins level of the purplish red leaf was significantly higher than that of yellowish green leaf, while chlorophylls and carotenoid level of purplish red leaf was significantly lower than that of the yellowish green leaf. These results indicated that purplish red leaf in tree peony could be attributed to anthocyanidin accumulation. The decrease of anthocyanidin, the increase of chlorophyll and carotenoid were mainly responsible for the alteration from purplish red to yellowish green of tree peony leaf in spring.
According to RNA-Seq data, four anthocyanin structural genes including F3H, F3’H, DFR and ANS were upregulated in the purplish red leaf and downregulated in the yellowish green leaf. While another two anthocyanin structural genes (CHI and HCT) were downregulated in the purplish red leaf and upregulated in the yellowish green leaf. Which were similar to those revealed by q-PCR analysis for the same genes. CHI is the enzyme that catalyze 2′,4′,4′,6′-tetrahydroxy chalcone form to naringenin (a flavanone). HCT can catalyze p-Coumaroyl-CoA produce Caffeoyl-CoA, then synthesize eriodictyol (a flavanone). F3H belongs to the OGD family, which catalyzes naringenin yield dihydrokaempferol. Dihydrokaempferol is catalyzed by F3’H to produce dihydroquercetin [3]. Dihydrokaempferol and dihydroquercetin are catalyzed by DFR to form leucoanthocyanidins, and then generate colored anthocyanidins catalyzed by ANS [3]. High expression of CHI and HCT can produced more flavones, while anthocyanin production can be restrained by low expression of F3H, F3′H, DFR, and ANS. Owing to higher expression of CHI, HCT, and lower expression of F3H, F3′H, DFR, ANS in yellowish green leaf caused the higher accumulation of non-anthocyanin flavonoids (flavones or flavonols), which was verified by leaf pigment level detection (Figure 2). The pigment level analysis showed that anthocyanin content in leaf was consistent with the trend of leaf color variance. Therefore, co-expression of F3H, F3′H, DFR, and ANS was responsible for red pigmentation in the leaf of Paeonia suffruticosa ‘Man Yuan Chun Guang’.
CHI is an upstream gene in anthocyanin biosynthesis that controls conversion of chalcones to (2S)-naringenin [3]. In this study, we found that CHI showed very higher expression level in yellowish green leaf stage compared with purplish red leaf stage. In P. suffruticosa ‘Luoyang Hong’, the expression level of F3H, F3’H, DFR, and ANS was higher in red petal, while the expression level of CHI in red petal was the lowest [14]. The similar expression pattern of CHI was also found in P. lactiflora [31]. While in the leaf of Ginkgo biloba, an organ lacking anthocyanin, the highly expression level of CHI was detected [32]. Li et al. (2006) reported that transgenic tobacco plants over-expressing sense Asteraceae CHI appeared normal in flower color along with an elevated accumulation of flavonoids, but not anthocyanin [33]. In addition, over-expression of CHI from tree peony can increased the level of total flavones and flavonols but reduced the intensity of flower pigmentation in transgenic tobacco [16]. The expression of CHI not only involved in anthocyanin biosynthesis, but also other secondary metabolites biosynthesis, such as flavones and flavonols [3]. All of these indicted that CHI is the key gene affecting the accumulation of flavonoids in plant, but not anthocyanin.
ANS is a downstream gene in anthocyanin biosynthesis, which encoded anthocyanidin synthase that catalyzes the oxidation of the colorless leucoanthocyanidin to the corresponding colored anthocyanidin [3]. In the present study, the expression level of ANS was 6.43-fold higher in purplish red leaf vs. yellowish green leaf, which was significantly higher than other three candidate structural genes of anthocyanin biosynthesis (Figure 4a), suggesting that ANS could be the key gene of anthocyanin accumulation in tree peony leaf. In herbaceous peony, ANS had the highest levels in red flower cultivar and the lowest levels in white flower cultivar, which resulted in the shift from white to pink and red in flowers [4]. In five cultivars of sweet potato, ANS expression was strongly associated with anthocyanin accumulation [34]. The similar result was also found in Chrysanthemum grandiflorum [35] and Malus sp. [36]. In addition, the silencing of ANS in red colored apple cultivar caused the shift of red leaf to green leaf, suggesting that anthocyanin biosynthesis was almost completely blocked [37]. All these implied that ANS was the key gene affecting the accumulation of anthocyanin in plant.
In our present study, eight DEGs (Unigene0045551, Unigene0031269, Unigene0022913, Unigene0032398, Unigene0036679, Unigene0039869, Unigene0026448, and Unigene0047139) potentially involved in porphyrin and chlorophyll biosynthesis were found and analyzed (Table 3). Among these genes, Unigene0031269, Unigene0022913, Unigene0032398, Unigene0036679, Unigene0026448, and Unigene0047139 showed higher transcript abundance in green leaf which has higher chlorophyll level compared with purplish red leaf (Table 3). It seemed that these six genes play positive role in chlorophyll accumulation in tree peony leaf. However, Unigene0026448 was annotated as HEMH, which encoded protoheme ferro-lyase that catalyzed protoporphyrin IX into protoheme, which will cause the decrease of protoporphyrin IX, an important intermediate product of chlorophyll biosynthesis [38]. Unigene0047139 was annotated as PAO, which will cause the opening of the chlorine macrocycle present in chlorophyll, and finally chlorophyll is broken down to colorless linear tetrapyrroles [29,39]. Therefore, Unigene0026448 and Unigene0047139 were not likely the key genes that affect chlorophyll level in tree peony leaf. Unigene0031269 (CRD1) encoded Mg-protoporphyrinogen IX monomethylester cyclase that catalyze Mg-protoporphyrin IX monomethylester formed into divinyl protochlorophyllide. Unigene0022913 (DVR) encoded divinyl reductase which catalyze divinyl protochlorophyllide produced protochlorophyllide. Unigene0032398 encoded protochlorophyllide oxidoreductase which can catalyze protochlorophyllide into chlorophyllide a or catalyze divinyl protochlorophyllide into divinyl chlorophyllide a depending on the availability of substrates [38]. Unigene0036679 (CAO) encoded chlorophyllide a oxygenase which catalyze chlorophyllide a formed to chlorophyllide b. q-PCR data shows that Unigene0031269, Unigene0022913, and Unigene0032398 were expressed higher level in the green leaf compared with the purplish red leaf, especially Unigene0032398 (POR) was expressed very highly level (44.82-fold higher) in the green leaf (Figure 4b). These indicated that POR was the key gene affecting chlorophyll level in tree peony leaf.
In the present study, 10 DEGs were predicted to participate in carotenoid biosynthesis metabolism in the tree peony leaf (Table 4). According to RNA-Seq data (Table 4) and q-PCR (Figure 4c), these 10 DEGs were all expressed higher in S3 stage which has higher carotenoid content than in S1. It seemed that these genes all play positive role in carotenoid accumulation in tree peony leaf. However, Unigene0051809 was annotated as carotenoid cleavage dioxygenase gene that can coded 9-cisepoxycarotenoid dioxygenase (NCED), which catalyze 9-cis-violaxanthin and 9-cis-neoxanthin cleaved to xanthoxin, the precursor of abscisic acid, (ABA) [3], thus caused the decrease of carotenoid accumulation. Therefore, Unigene0051809 (NCED) was not likely the key gene that affect carotenoid level in tree peony leaf.

4. Materials and Methods

4.1. Plant Material

Paeonia suffruticosa Andr. ‘Man Yuan Chun Guang’ plants were grown under field conditions in Northwest A&F University, Yangling Shaanxi, China. Leaf samples were collected at three different leaf color stages (S1, S2, S3) in the morning during the March and April in 2016 (Figure 1a). In order to avoid the effect of other organisms (arthropods, bacteria, fungi, etc.) on gene expression, only healthy, undiseased and non pest injured leaves were collected. All samples were collected from the same plant and washed three times with distilled water, and immediately frozen in liquid nitrogen, then stored at −80 °C for RNA extraction, and flavonoid/anthocyanin, chlorophyll, and carotenoid analysis.

4.2. Measurement of Leaf Pigments

4.2.1. Anthocyanin Level Measurement

Freeze-dried leaves were finely ground and 0.5 g was extracted with 15 mL acidic methanol (0.1% hydrochloric acid) at 4 °C in darkness for 24 h, then suspended by ultrasound for 1 h. After centrifugation at 5000 rpm for 1 min, the supernatant was filtered using a 0.22 μm membrane filter. The absorbance was read at 530 nm using a UV–Vis spectrophotometer (UV-3802, Unico, Suite E Dayton, OH, USA). A standard calibration curve was plotted using cyanidin-3-O-glucoside (Cy3G). The values were normalized to the dry weight of each sample to indicate anthocyanin level.

4.2.2. Flavonoid Level Measurement

Freeze-dried leaves were finely ground and 0.5 g was extracted with 15 mL methanol at 4 °C in darkness for 24 h, then suspended by ultrasound for 1 h. After centrifugation at 5000 rpm for 1 min, the supernatant was filtered using a 0.22 µm membrane filter. 2 mL supernatant, 2 mL 1.5% AlCl3, 3 mL 1 M Acetic acid sodium acetate (pH 5.0) were mixed and keep the volume to 10 mL. After incubation for 10 min, the absorbance was read at 415 nm using a UV-Vis spectrophotometer. A standard calibration curve was plotted using rutin. The values were normalized to the dry weight of each sample to indicate total flavonoid level.

4.2.3. Carotenoid Level Measurement

Freeze-dried leaves were finely ground and 0.5 g was extracted with 15 mL petroleum ether at 4 °C in darkness for 24 h, then suspended by ultrasound for 1 h. After centrifugation at 5000 rpm for 1 min, the supernatant was filtered using a 0.22 µm membrane filter. The absorbance was read at 440 nm using a UV-Vis spectrophotometer. A standard calibration curve was plotted using β-caroteneas. The values were normalized to the dry weight of each sample to indicate carotenoid level.

4.2.4. Chlorophyll Level Measurement

Freeze-dried leaves were finely ground and 0.5 g was extracted with 15 mL 80 % acetone at 4 °C in darkness for 24 h, then suspended by ultrasound for 1 h. After centrifugation at 5000 rpm for 1 min, the supernatant was filtered using a 0.22 µm membrane filter. Chlorophyll level was determined according to the protocol of Arnon.
Three biological replicates were performed for the above pigments measurement.

4.3. RNA Extraction, Library Construction, and Transcriptome Sequencing

Total RNA was extracted using the modified CTAB method. RNase-free DNase I (Tiangen; Beijing, China) was applied to remove contaminating genomic DNA. The RNA purity was determined with a NanoDrop 2000 spectrophotometer (NanoDrop Technologies; Wilmington, DE, USA), and 2% agarose gels were run to verify RNA integrity. The construction of the libraries and the RNA-Seq were performed by the Gene Denovo Corporation (Guangzhou, China). mRNA was enriched with oligo (dT)-rich magnetic beads. Then the enriched mRNA was fragmented into short fragments using fragmentation buffer and reverse transcripted into cDNA with random primers. Second-strand cDNA were synthesized by DNA polymerase I, RNase H, dNTP, and buffer. Then the cDNA fragments were purified with QiaQuick PCR extraction kit, end repaired, poly(A) added, and ligated to Illumina sequencing adapters. The ligation products were size selected by agarose gel electrophoresis, PCR amplified, and sequenced using Illumina HiSeq™ 4000 by Gene Denovo Biotechnology Co. Two biological replicates were used in this section.

4.4. De Novo Assembly and Gene Annotation

The raw reads (which has be uploaded in the NCBI’s Sequence Read Archive, SRP095498) were first filtered by removing adaptor sequences, reads containing more than 10% of unknown nucleotides (N) and low quality reads containing more than 50% of low quality (Q-value ≤ 10) bases using Perl script. The remaining high-quality reads were assembled de novo using Trinity 2.1.1. [40]. In assembly, the reads from all three libraries were combined, and then ran Trinity. The longest transcript (from alternative splicing transcripts) was selected as the unigene in this study.
To annotate the unigenes, we used BLAST + 2.4.0 (http://www.ncbi.nlm.nih.gov/BLAST/) with an E-value threshold of 1 × 10⁻⁵ to NCBI non-redundant protein (Nr) database released 31 August 2016 (http://www.ncbi.nlm.nih.gov), the Swiss-Prot protein database (http://www.expasy.ch/sprot), the Kyoto Encyclopedia of Genes and Genomes (KEGG) database released 1 July 2016 (http://www.genome.jp/kegg), and the COG/KOG database (http://www.ncbi.nlm.nih.gov/COG). Protein functional annotations could then be obtained according to the best alignment results.

4.5. Identification and Analysis of DEGs

The unigene expression was calculated and normalized to RPKM (Reads Per kb per Million reads) [41]. To identify differentially expressed genes across samples, the edgeR package (http://www.r-project.org/) was used. We identified genes with a fold change ≥ 2 and a false discovery rate (FDR) < 0.05 in a comparison as significant DEGs. The confirmed DEGs were subjected to GO functional enrichment analysis and KEGG pathway analysis. Then, based on KEGG pathway analysis, the DEGs involved in leaf coloration were screened for up/downregulated unigenes, and used for further analysis.

4.6. Real-Time Quantitative PCR Analysis

Total RNA was extracted from leaves in S1 and S3 stages, respectively. After treatment with RNase-free DNase I (Tiangen; Beijing, China) according to the user manual, 1 μg of total RNA was reverse-transcribed to first-strand cDNA using the PrimeScript RT reagent kit (Takara; Otsu, Japan). Real-time quantitative PCR (q-PCR) experiments was performed using SYBR Premix Ex Taq (Takara) on ABI 7500 system (Applied Biosystems, Waltham, MA, USA). Primers used are listed in Table S2. Initial denaturation at 95 °C for 10 min, followed by 40 cycles of denaturation for 15 s at 95 °C, annealing for 30 s at 60 °C, and extension for 15 s at 72 °C, followed by a final extension for 15 s at 95 °C. The ubiquitin (Unigene0020903) was used to normalized the q-PCR data [42]. The relative expression levels of genes were calculated using the 2−ΔΔct method. The statistical p-value was generated by the paired t-test. The statistical significance was defined as p < 0.05. Three biological replicates were performed for each gene.

5. Conclusions

Our results indicate that ANS was the key genes that control the anthocyanin level in tree peony leaf. POR was the key gene which regulated the chlorophyll content in tree peony leaf.

Supplementary Materials

Supplementary materials are available online.

Acknowledgments

This work was supported by supported by the Special Fund for Forest Scientific Research in the Public Welfare (201404701) and Fundamental Research Funds for the Central Universities (2452015040).

Author Contributions

Yanlong Zhang and Lixin Niu designed the experiments; Jianrang Luo performed the experiments and wrote the paper; Jianrang Luo and Qianqian Shi analyzed the data. All authors read and approved the final manuscript.

Conflicts of Interest

The authors declare no conflict of interest.

References

  1. Ji, L.; Wang, Q.; da Silva, J.A.T.; Yu, X.N. The genetic diversity of Paeonia L. Sci. Hortic. 2012, 143, 62–74. [Google Scholar] [CrossRef]
  2. Grotewold, E. The genetics and biochemistry of floral pigments. Annu. Rev. Plant Biol. 2006, 57, 761–780. [Google Scholar] [CrossRef] [PubMed]
  3. Tanaka, Y.; Sasaki, N.; Ohmiya, A. Biosynthesis of plant pigments: Anthocyanin, betalains and carotenoid. Plant J. 2008, 54, 733–749. [Google Scholar] [CrossRef] [PubMed]
  4. Zhao, D.Q.; Wei, M.R.; Liu, D.; Tao, J. Anatomical and biochemical analysis reveal the role of anthocyanin in flower coloration of herbaceous peony. Plant Physiol. Biochem. 2016, 102, 97–106. [Google Scholar] [CrossRef] [PubMed]
  5. Li, S.S.; Li, Q.Z.; Rong, L.P.; Tang, L.; Wang, J.J.; Zhang, B. Analysis of the transcriptome of green and mutant golden-yellow leaves of Acer palmatum Thunb. using high-throughput RNA sequencing. J. Hortic. Sci. Biotechnol. 2015, 90, 388–394. [Google Scholar] [CrossRef]
  6. Fambrini, M.; Michelotti, V.; Pugliesi, C. Orange, yellow and white-cream: inheritance of carotenoid-based colour in sunflower pollen. Plant Biol. 2010, 12, 197–205. [Google Scholar] [CrossRef] [PubMed]
  7. Chen, L.; Li, L.; Dai, Y.; Wang, X.; Duan, Y.; Yang, G. De novo transcriptome analysis of Osmanthus serrulatus Rehd. flowers and leaves by Illumina sequencing. Biochem. Syst. Ecol. 2015, 61, 531–540. [Google Scholar] [CrossRef]
  8. Gao, Z.J.; Han, X.H.; Xiao, X.G. Purification and characterisation of polyphenol oxidase from red Swiss chard (Beta vulgaris subspecies cicla) leaves. Food Chem. 2009, 117, 342–348. [Google Scholar] [CrossRef]
  9. Wang, C.Q.; Song, H.; Gong, X.Z.; Hu, Q.G.; Liu, F.; Wang, B.-S. Correlation of tyrosinase activity and betacyanin biosynthesis induced by dark in C3 halophyte Suaeda salsa seedlings. Plant Sci. 2007, 173, 487–494. [Google Scholar] [CrossRef]
  10. Gandia-Herrero, F.; Garcia-Carmona, F. Biosynthesis of betalains: yellow and violet plant pigments. Trends Plant Sci. 2013, 18, 334–343. [Google Scholar] [CrossRef] [PubMed]
  11. Wang, L.S.; Shiraishi, A.; Hashimoto, F.; Aoki, N.; Shimizu, K.; Sakata, Y. Analysis of petal anthocyanin to investigate flower coloration of Zhongyuan (Chinese) and Daikon Island (Japanese) tree peony cultivars. J. Plant Res. 2001, 114, 33–43. [Google Scholar] [CrossRef]
  12. Wang, L.S.; Hashimoto, F.; Shiraishi, A.; Aoki, N.; Li, J.J.; Sakata, Y. Chemical taxonomy of the Xibei tree peony from China by floral pigmentation. J. Plant Res. 2004, 117, 47–55. [Google Scholar] [PubMed]
  13. Zhang, J.; Wang, L.; Shu, Q.; Liu, Z.A.; Li, C.; Zhang, J.; Wei, X.; Tian, D. Comparison of anthocyanin in non-blotches and blotches of the petals of Xibei tree peony. Sci. Hortic. 2007, 114, 104–111. [Google Scholar] [CrossRef]
  14. Zhang, C.; Wang, W.; Wang, Y.; Gao, S.; Du, D.; Fu, J.; Dong, L. Anthocyanin biosynthesis and accumulation in developing flowers of tree peony (Paeonia suffruticosa) ‘Luoyang Hong’. Postharvest Biol. Technol. 2014, 97, 11–22. [Google Scholar] [CrossRef]
  15. Zhang, Y.; Cheng, Y.; Ya, H.; Xu, S.; Han, J. Transcriptome sequencing of purple petal spot region in tree peony reveals differentially expressed anthocyanin structural genes. Front. Plant Sci. 2015, 6, 1–9. [Google Scholar] [CrossRef] [PubMed]
  16. Zhou, L.; Wang, Y.; Ren, L.; Shi, Q.; Zheng, B.; Miao, K.; Guo, X. Overexpression of Ps-CHI1, a homologue of the chalcone isomerase gene from tree peony (Paeonia suffruticosa), reduces the intensity of flower pigmentation in transgenic tobacco. Plant Cell Tiss. Org. 2013, 116, 285–295. [Google Scholar] [CrossRef]
  17. Shi, Q.; Zhou, L.; Wang, Y.; Li, K.; Zheng, B.; Miao, K. Transcriptomic analysis of Paeonia delavayi wild population flowers to identify differentially expressed genes involved in purple-red and yellow petal pigmentation. PLoS ONE 2015, 10, e0135038. [Google Scholar] [CrossRef] [PubMed]
  18. Petroni, K.; Tonelli, C. Recent advances on the regulation of anthocyanin synthesis in reproductive organs. Plant Sci. 2011, 181, 219–229. [Google Scholar] [CrossRef] [PubMed]
  19. Jaakola, L. New insights into the regulation of anthocyanin biosynthesis in fruits. Trends Plant Sci. 2013, 18, 477–483. [Google Scholar] [CrossRef] [PubMed]
  20. Yuan, Y.W.; Sagawa, J.M.; Frost, L.; Vela, J.P.; Bradshaw, H.D., Jr. Transcriptional control of floral anthocyanin pigmentation in monkey flowers (Mimulus). New Phytol. 2014, 204, 1013–1027. [Google Scholar] [CrossRef] [PubMed]
  21. Hsu, C.C.; Chen, Y.Y.; Tsai, W.C.; Chen, W.H.; Chen, H.H. Three R2R3-MYB transcription factors regulate distinct floral pigmentation patterning in Phalaenopsis spp. Plant Physiol. 2015, 168, 175–191. [Google Scholar] [CrossRef] [PubMed]
  22. Kriangphan, N.; Vuttipongchaikij, S.; Kittiwongwattana, C.; Suttangkakul, A.; Pinmanee, P.; Sakulsathaporn, A.; Suwimon, R.; Suputtitada, S.; Chanvivattana, Y.; Apisitwanich, S. Effects of sequence and expression of eight anthocyanin biosynthesis genes on floral coloration in four Dendrobium hybrids. Hortic. J. 2015, 84, 83–92. [Google Scholar] [CrossRef]
  23. Tanaka, Y.; Ohmiya, A. Seeing is believing: engineering anthocyanin and carotenoid biosynthetic pathways. Curr. Opin. Biotechnol. 2008, 19, 190–197. [Google Scholar] [CrossRef] [PubMed]
  24. Han, Y.; Wang, X.; Chen, W.; Dong, M.; Yuan, W.; Liu, X.; Shang, F. Differential expression of carotenoid-related genes determines diversified carotenoid coloration in flower petal of Osmanthus fragrans. Tree Genet. Genomes 2013, 10, 329–338. [Google Scholar] [CrossRef]
  25. Saito, T.; Honma, D.; Tagashira, M.; Kanda, T.; Nesumi, A.; Maeda-Yamamoto, M. Anthocyanin from new red leaf tea “Sunrouge”. J. Agric. Food Chem. 2011, 59, 4779–4782. [Google Scholar] [CrossRef] [PubMed]
  26. Lin, L.; Mu, H.; Jiang, J.; Liu, G. Transcriptomic analysis of purple leaf determination in birch. Gene 2013, 526, 251–258. [Google Scholar] [CrossRef] [PubMed]
  27. He, Q.; Zhang, Z.; Zhang, L. Anthocyanin accumulation, antioxidant ability and stability, and a transcriptional analysis of anthocyanin biosynthesis in purple heading Chinese cabbage (Brassica rapa L. ssp. pekinensis). J. Agric. Food Chem. 2016, 64, 132–145. [Google Scholar] [CrossRef] [PubMed]
  28. Yang, Y.; Xu, M.; Luo, Q.; Wang, J.; Li, H. De novo transcriptome analysis of Liriodendron chinense petals and leaves by Illumina sequencing. Gene 2014, 534, 155–162. [Google Scholar] [CrossRef] [PubMed]
  29. Lai, B.; Hu, B.; Qin, Y.H.; Zhao, J.T.; Wang, H.C.; Hu, G.B. Transcriptomic analysis of Litchi chinensis pericarp during maturation with a focus on chlorophyll degradation and flavonoid biosynthesis. BMC Genom. 2015, 16, 225. [Google Scholar] [CrossRef] [PubMed]
  30. Wang, H.C.; Huang, X.M.; Hu, G.B.; Yang, Z.Y.; Huang, H.-B. A comparative study of chlorophyll loss and its related mechanism during fruit maturation in the pericarp of fast- and slow-degreening litchi pericarp. Sci. Hortic. 2005, 106, 247–257. [Google Scholar] [CrossRef]
  31. Zhao, D.; Tao, J.; Han, C.; Ge, J. Flower color diversity revealed by differential expression of flavonoid biosynthetic genes and flavonoid accumulation in herbaceous peony (Paeonia lactiflora Pall.). Mol. Biol. Rep. 2012, 39, 11263–11275. [Google Scholar] [CrossRef] [PubMed]
  32. Cheng, H.; Li, L.; Cheng, S.; Cao, F.; Wang, Y.; Yuan, H. Molecular cloning and function assay of a chalcone isomerase gene (GbCHI) from Ginkgo biloba. Plant Cell Rep. 2011, 30, 49–62. [Google Scholar] [CrossRef] [PubMed]
  33. Li, F.; Jin, Z.; Qu, W.; Zhao, D.; Ma, F. Cloning of a cDNA encoding the Saussurea medusa chalcone isomerase and its expression in transgenic tobacco. Plant Physiol. Biochem. 2006, 44, 455–461. [Google Scholar] [CrossRef] [PubMed]
  34. Zhou, W.; Huang, C.; Gong, Y.; Feng, Q.; Gao, F. Molecular Cloning and Expression Analysis of an ANS gene encoding anthocyanidin synthase from purple-fleshed sweet potato [Ipomoea batatas (L.) Lam]. Plant Mol. Biol. Rep. 2009, 28, 112–121. [Google Scholar] [CrossRef]
  35. Chen, S.M.; Li, C.H.; Zhu, X.R.; Deng, Y.M.; Sun, W.; Wang, L.S.; Chen, F.D.; Zhang, Z. The identification of flavonoids and the expression of genes of anthocyanin biosynthesis in the chrysanthemum. Biol. Plant. 2012, 56, 458–464. [Google Scholar] [CrossRef]
  36. Zhang, J.; Han, Z.Y.; Tian, J.; Zhang, X.; Song, T.T.; Yao, Y.C. The expression level of anthocyanidin synthase determines the anthocyanin content of crabapple (Malus sp.) petals. Acta Physiol. Plant. 2015, 37, 1–10. [Google Scholar] [CrossRef]
  37. Szankowski, I.; Flachowsky, H.; Li, H.; Halbwirth, H.; Treutter, D.; Regos, I.; Hanke, M.V.; Stich, K.; Fischer, T.C. Shift in polyphenol profile and sublethal phenotype caused by silencing of anthocyanidin synthase in apple (Malus sp.). Planta 2009, 229, 681–692. [Google Scholar] [CrossRef] [PubMed]
  38. Beale, S.I. Green genes gleaned. Trends Plant Sci. 2005, 10, 309–312. [Google Scholar] [CrossRef] [PubMed]
  39. Hortensteiner, S. Update on the biochemistry of chlorophyll breakdown. Plant Mol. Biol. 2013, 82, 505–517. [Google Scholar] [CrossRef] [PubMed]
  40. Grabherr, M.G.; Haas, B.J.; Yassour, M.; Levin, J.Z.; Thompson, D.A.; Amit, I.; Adiconis, X.; Fan, L.; Raychowdhury, R.; Zeng, Q.D.; et al. Full-length transcriptome assembly from RNA-Seq data without a reference genome. Nat. Biotechnol. 2011, 29, 644–652. [Google Scholar] [CrossRef] [PubMed]
  41. Mortazavi, A.; Williams, B.A.; McCue, K.; Schaeffer, L.; Wold, B. Mapping and quantifying mammalian transcriptomes by RNA-Seq. Nat. Methods 2008, 5, 621–628. [Google Scholar] [CrossRef] [PubMed]
  42. Wang, Y.J.; Dong, L.; Zhang, C.; Wang, X.Q. Reference gene selection for real-time quantitative PCR normalization in tree peony (Paeonia suffruticosa Andr.). J. Agric. Biotechnol. 2012, 20, 521–528. [Google Scholar]
  • Sample Availability: Samples of the compounds are available from the authors.
Figure 1. Images of tree peony leaf and pigments contents at three stages. (a) Images of tree peony leaf at three different stages; (b) contents of anthocyanin, chlorophyll, total flavonoid, and carotenoid in the leaf of three different stages.
Molecules 22 00324 g001
Figure 2. Outcome of homology search of tree peony unigenes against the Nr database. (a): Venn diagram of unigene numbers annotated by BLASTx with an E-value threshold of 1 × 10⁻⁵ against protein databases. The numbers in the circles indicate unigenes numbers annotated by single or multiple databases; (b): E-value distribution of the top BLAST hits for each unigene sequence; (c): Species distribution of the top BLAST hits for all homologous sequences.
Molecules 22 00324 g002
Figure 3. Differential gene expression profiles based on the library of the three leaf stages.
Molecules 22 00324 g003
Figure 4. The expression patterns of DEGs involved in anthocyanin (a), chlorophyll (b), and carotenoid (c) biosynthesis revealed by real-time quantitative PCR.
Molecules 22 00324 g004
Table 1. Putative anthocyanin structural genes identified from differentially expressed genes.
GeneIDlog2 Ratio (S3/S1) aFDRAnnotation
Unigene00042706.881.17 × 10−9Chalcone isomerase
Unigene00184122.900.007807Shikimate hydroxycinnamoyltransferase
Unigene0034354−1.490.000353Flavanone 3-hydroxylase
Unigene0040930−1.580.000112Flavonoid 3′-hydroxylase
Unigene0046696−1.650.000548Dihydroflavonol 4-reductase
Unigene0028008−3.406.79 × 10−12Anthocyanidin synthase
Unigene0036137−1.060.023175UDP-glycosyltransferase
Unigene00528711.900.001475Glucoside glucosyltransferase
a Data were the mean value of two biological replicates.
Table 2. Differentially expressed genes in transcription factors of anthocyanin biosynthesis.
GeneIDlog2 Ratio (S3/S1) aFDRAnnotation
Unigene0006988−10.28 0.002581722Transcription factor MYB39 [Aegilops tauschii]
Unigene0028536−4.40 3.34 × 10⁻¹²MYB-like protein X-like [Citrus sinensis]
Unigene0033848−3.43 3.58 × 10⁻⁶MYB domain protein 106 [Theobroma cacao]
Unigene0019117−3.15 5.67 × 10⁻⁵MYB domain protein 17 isoform 1 [Theobroma cacao]
Unigene0015077−2.98 1.59 × 10⁻⁸MYB-related protein 3R-1-like isoform X1 [Vitis vinifera]
Unigene0025015−2.92 3.02 × 10⁻⁷Transcription factor MYB90 [Vitis vinifera]
Unigene0015076−2.77 3.04 × 10⁻⁷MYB transcription factor family[Populus trichocarpa]
Unigene0017724−2.73 0.008752272MYB-related protein 3R-1-like isoform X1 [Vitis vinifera]
Unigene0023351−2.67 0.005438748MYB-related protein A-like [Populus euphratica]
Unigene0003954−2.57 0.007298376MYB-related protein 3R-1-like isoform X1 [Vitis vinifera]
Unigene0040613−2.57 0.000168857MYB family transcription factor APL isoform X2 [Vitis vinifera]
Unigene0031865−2.41 3.11 × 10⁻⁷MYB transcription factor family[Populus trichocarpa]
Unigene0023350−2.09 0.006013724MYB-related protein 3R-1-like [Prunus mume]
Unigene0003975−1.60 0.000354814Transcription factor MYB1R1-like [Citrus sinensis]
Unigene0031901−1.19 0.032182662MYB DNA-binding domain protein [Theobroma cacao]
Unigene00175291.10 0.010140177MYB transcription factor family [Populus trichocarpa]
Unigene00227851.32 0.041043118Transcription factor MYB44-like [Vitis vinifera]
Unigene00309331.48 0.01321785MYB-related protein 308-like [Populus euphratica]
Unigene00038461.57 0.02700583MYB transcription factor family [Populus trichocarpa]
Unigene00032282.00 0.009708022MYB-like protein J [Malus domestica]
Unigene00213042.21 0.028027338Transcription factor MYB59 [Vitis vinifera]
Unigene00096552.25 0.000336502MYB transcription factor family [Populus trichocarpa]
Unigene00184952.27 0.000636996Transcription factor MYB82 [Jatropha curcas]
Unigene00163792.49 0.000248643MYB family transcription factor APL [Prunus mume]
Unigene00132552.87 0.002952733R2R3 MYBA6 transcription factor splice variant 1 [Vitis vinifera]
Unigene00182843.07 0.002052337MYB family transcription factor At1g14600 [Vitis vinifera]
Unigene00294543.13 6.71 × 10⁻⁵MYB-like transcription factor [Betula luminifera]
Unigene0017856−6.92 2.88 × 10⁻²⁰Transcription factor bHLH94-like [Nelumbo nucifera]
Unigene0011325−3.98 0.001209742bHLH family protein [Populus trichocarpa]
Unigene0011327−3.79 0.000339255bHLH family protein [Populus trichocarpa]
Unigene0001264−3.48 0.000243391bHLH family protein [Populus trichocarpa]
Unigene0023425−3.26 6.47 × 10⁻⁵Transcription factor bHLH118-like [Jatropha curcas]
Unigene0013501−2.60 0.033069525Transcription factor bHLH93 [Vitis vinifera]
Unigene0026438−2.44 0.000225777Transcription factor bHLH70 isoform X2 [Vitis vinifera]
Unigene0030075−2.32 0.000257132Transcription factor bHLH30-like [Jatropha curcas]
Unigene0031959−2.14 0.000135867Transcription factor bHLH66-like isoform X4 [Vitis vinifera]
Unigene0041894−1.94 5.05 × 10⁻⁵Transcription factor bHLH35-like [Pyrus x bretschneideri]
Unigene0041893−1.90 0.00691905Transcription factor bHLH35-like [Pyrus x bretschneideri]
Unigene0033453−1.66 0.000163627Myc anthocyanin regulatory protein isoform X1 [Vitis vinifera]
Unigene0009061−1.60 0.011318569Transcription factor bHLH104-like isoform X1 [Citrus sinensis]
Unigene0000218−1.28 0.026379909Transcription factor bHLH49 isoform X1 [Vitis vinifera]
Unigene0037994−1.22 0.03284377Transcription factor bHLH145-like [Prunus mume]
Unigene00337271.06 0.015085073Transcription factor bHLH63 [Vitis vinifera]
Unigene00143881.18 0.03179475Transcription factor bHLH51 [Vitis vinifera]
Unigene00203691.79 0.00037921Transcription factor bHLH149 [Solanum lycopersicum]
Unigene00234371.81 0.00014609Transcription factor bHLH63 [Prunus mume]
Unigene00273431.88 0.000282396Transcription factor bHLH61 isoform 2 [Theobroma cacao]
Unigene0032390−5.15 6.23 × 10⁻¹⁷F-box/WD repeat-containing 10 [Gossypium arboreum]
Unigene0019877−4.98 1.75 × 10⁻⁶WD repeat-containing 62 [Gossypium arboreum]
Unigene0052972−3.88 8.77 × 10⁻⁸WD repeat-containing protein 76 isoform X2 [Jatropha curcas]
Unigene0017625−3.76 0.000361154F-box/WD repeat-containing protein sel-10 [Jatropha curcas]
Unigene0038354−3.59 1.16 × 10⁻¹⁴WD repeat-containing protein 76 isoform X1 [Jatropha curcas]
Unigene0038352−3.35 6.74 × 10⁻⁸WD repeat-containing protein 76 isoform X2 [Jatropha curcas]
Unigene0038982−3.33 5.71 × 10⁻¹⁰WD repeat and HMG-box DNA-binding protein 1 [Vitis vinifera]
Unigene0004606−3.25 1.42 × 10⁻⁶WD repeat-containing protein 76 isoform X1 [Jatropha curcas]
Unigene0016452−2.38 2.55 × 10⁻⁶WD-40 repeat-containing protein MSI3 [Vitis vinifera]
Unigene0038353−2.35 0.000579262WD repeat-containing protein 76 [Gossypium raimondii]
Unigene0038355−2.28 0.004815745WD repeat-containing protein 76 isoform X2 [Jatropha curcas]
Unigene0033696−2.24 6.56 × 10⁻⁷Transducin/WD40 repeat-like superfamily protein [Theobroma cacao]
Unigene0031235−2.22 1.05 × 10⁻⁸WD-40 repeat-containing protein MSI4-like [Eucalyptus grandis]
Unigene0017354−2.05 0.000604273WD repeat-containing protein 5-like [Nelumbo nucifera]
Unigene0041973−1.94 4.57 × 10⁻⁵WD repeat-containing protein 43 isoform X1 [Vitis vinifera]
Unigene0011781−1.86 0.003509861Glutamate-rich WD repeat-containing protein 1 [Nelumbo nucifera]
Unigene0046703−1.71 0.023069191WD repeat-containing 6 [Gossypium arboreum]
Unigene0041702−1.68 0.002347404WD repeat-containing protein 3 [Vitis vinifera]
Unigene0018836−1.63 0.007290383WD repeat-containing protein 82 [Jatropha curcas]
Unigene0024647−1.61 2.61 × 10⁻⁵Transducin/WD40 repeat-like superfamily protein [Theobroma cacao]
Unigene0028464−1.47 0.007517559WD repeat-containing protein [Gossypium arboreum]
Unigene0041538−1.39 0.0043636WD repeat-containing protein 87-like [Cicer arietinum]
Unigene0030123−1.34 0.001589388WD-40 repeat-containing protein MSI1 [Vitis vinifera]
Unigene0051975−1.32 0.002923971WD repeat-containing protein 61 [Nelumbo nucifera]
Unigene0031526−1.18 0.018270378Katanin p80 WD40 repeat-containing subunit B1 homolog isoform X2 [Vitis vinifera]
Unigene0039012−1.13 0.010137359WD repeat-containing protein 70 [Vitis vinifera]
Unigene0032745−1.12 0.014302649Transducin/WD40 repeat-like superfamily protein [Theobroma cacao]
Unigene0045126−1.08 0.031686906WD40 protein [Paeonia suffruticosa]
Unigene00496001.24 0.010794516Transducin/WD40 repeat-like superfamily protein [Theobroma cacao]
Unigene00191581.62 0.014228592WD repeat-containing protein LWD1-like [Gossypium raimondii]
Unigene00295411.84 0.000911988WD repeat-containing 70 [Gossypium arboreum]
Unigene00150652.21 3.62 × 10⁻⁶F-box/WD repeat-containing protein [Medicago truncatula]
Unigene00514832.58 0.008905399Transducin/WD40 repeat-like superfamily protein [Theobroma cacao]
Unigene00334663.91 5.28 × 10⁻⁶Transducin/WD40 repeat-like superfamily protein [Theobroma cacao]
Unigene00334655.08 1.24 × 10⁻⁵Transducin/WD40 repeat-like superfamily protein [Theobroma cacao]
a Data were the mean value of two biological replicates.
Table 3. Putative chlorophyll genes identified from differentially expressed genes.
GeneIDlog2 Ratio (S3/S2) aFDRAnnotation
Unigene00312691.940.03382Mg-protoporphyrinogen IX monomethylester
Unigene00229131.020.047351Divinyl reductase
Unigene00366791.030.033455Chlorophyllide a oxygenase
Unigene0045551−1.420.009836Glutamyl-tRNA synthetase
Unigene00323981.090.02502Protochlorophyllide oxidoreductase
Unigene0039869−5.476.00 × 10−16Geranylgeranyl reductase
Unigene00471391.400.003807Pheophorbide a oxygenase
Unigene00264481.320.019098Protoheme ferro-lyase
a Data were the mean value of two biological replicates.
Table 4. Putative carotenoids genes identified from differentially expressed genes.
GeneIDlog2 Ratio (S3/S1) aFDRAnnotation
Unigene00299922.072.10 × 10−7Phytoene synthase 2, chloroplastic-like
Unigene00300401.773.96 × 10−5Phytoene desaturase, partial
Unigene00251702.284.78 × 10−5Beta-carotene isomerase D27
Unigene00396991.713.42 × 10−5Zeta-carotene desaturase
Unigene00135581.993.48 × 10−7Violaxanthin de-epoxidase, chloroplastic
Unigene00237611.080.014272Lycopene beta cyclase, chloroplastic
Unigene00164401.380.000987Lycopene epsilon cyclase
Unigene00325492.550.013492Beta-carotene hydroxylase, partial
Unigene00274911.605.36 × 10−5Zeaxanthin epoxidase, partial
Unigene00518092.882.71 × 10−13Carotenoid cleavage dioxygenase
a Data were the mean value of two biological replicates.

