Article

Self-Organized TiO2–MnO2 Nanotube Arrays for Efficient Photocatalytic Degradation of Toluene

by
María C. Nevárez-Martínez
1,2,
Marek P. Kobylański
3,
Paweł Mazierski
3,*,
Jolanta Wółkiewicz
4,
Grzegorz Trykowski
4,
Anna Malankowska
3,
Magda Kozak
3,
Patricio J. Espinoza-Montero
2 and
Adriana Zaleska-Medynska
3,*
1
Facultad de Ingeniería Química y Agroindustria, Escuela Politécnica Nacional, Ladrón de Guevara E11-253, P.O. Box 17-01-2759, Quito 170525, Ecuador
2
Centro de Investigación y Control Ambiental “CICAM”, Departamento de Ingeniería Civil y Ambiental, Facultad de Ingeniería Civil y Ambiental, Escuela Politécnica Nacional, Ladrón de Guevara E11-253, P.O. Box 17-01-2759, Quito 170525, Ecuador
3
Department of Environmental Technology, Faculty of Chemistry, University of Gdansk, 80-308 Gdansk, Poland
4
Faculty of Chemistry, Nicolaus Copernicus University, 87-100 Torun, Poland
*
Authors to whom correspondence should be addressed.
Molecules 2017, 22(4), 564; https://doi.org/10.3390/molecules22040564
Submission received: 3 February 2017 / Revised: 27 March 2017 / Accepted: 28 March 2017 / Published: 31 March 2017
(This article belongs to the Special Issue Photon-involving Purification of Water and Air)

Abstract

:
Vertically oriented, self-organized TiO2–MnO2 nanotube arrays were successfully obtained by one-step anodic oxidation of Ti–Mn alloys in an ethylene glycol-based electrolyte. The as-prepared samples were characterized by scanning electron microscopy (SEM), energy-dispersive X-ray spectroscopy (EDX), UV-Vis absorption, photoluminescence spectroscopy, X-ray diffraction (XRD), and micro-Raman spectroscopy. The effect of the applied potential (30–50 V), manganese content in the alloy (5–15 wt. %) and water content in the electrolyte (2–10 vol. %) on the morphology and photocatalytic properties was investigated for the first time. The photoactivity was assessed in the toluene removal reaction under visible light, using low-powered LEDs as an irradiation source (λmax = 465 nm). Morphology analysis showed that samples consisted of auto-aligned nanotubes over the surface of the alloy, their dimensions were: diameter = 76–118 nm, length = 1.0–3.4 μm and wall thickness = 8–11 nm. It was found that the increase in the applied potential led to increase the dimensions while the increase in the content of manganese in the alloy brought to shorter nanotubes. Notably, all samples were photoactive under the influence of visible light and the highest degradation achieved after 60 min of irradiation was 43%. The excitation mechanism of TiO2–MnO2 NTs under visible light was presented, pointing out the importance of MnO2 species for the generation of e and h+.

Graphical Abstract

1. Introduction

TiO2-based photocatalysis is an effective technique for pollutant removal from both gas and liquid phase [1,2,3,4,5,6,7]. In fact, applications of TiO2 are not limited only to photodegradation reactions, but it offers the facility to drive many others such as organic synthesis [8], water splitting [9,10], disinfection [11], CO2 reduction [10,12], self-cleaning or antimicrobial surfaces [13,14], and dye-sensitized solar cells [10,15,16]. Due to the environmentally-friendly nature of TiO2, its chemical and biological inertness, low cost, availability, and excellent photoactivity, this semiconductor material has become of great interest [17]. Nevertheless, some drawbacks as the rapid charge recombination of the photogenerated electrons and holes, and the wide bandgap (3.0 eV for rutile and 3.2 eV for anatase), which restricts photoabsorption to only ultraviolet region (ca. 5% of solar spectrum), need to be overcome in order to extend the practical application of TiO2 photocatalysts for solar or interior light driven photoreactions at large scale [18].
Bandgap engineering in addition to tuning strategies have been studied over last decades with a common aim: shifting the absorption wavelength range of TiO2 to the visible region. Since 1980s, TiO2 has been modified by platinization [19,20,21]. So far, numerous approaches as ion (either cation or anion) doping [22,23,24,25], coupling with a narrower-bandgap semiconductor [26], with noble metals [27,28], with either organic or inorganic dyes [29] have been presented by a large number of research groups. Synthesizing composites with oxide semiconductors has become a promising way to enhance the photoactivity of TiO2 by promoting the absorption of visible light and inhibiting the fast recombination of charge carriers [18,30]. Recent studies have focused on TiO2–MnO2 system due to the MnO2 features as non-toxicity and earth abundance. These composites have been used mainly for capacitance applications [31,32], and despite the narrow bandgap of MnO2 (0.26–2.7 eV), which could allow the absorption of visible and theoretically even infrared light [33,34,35,36,37,38], there exist just few reports in literature about the application of this system in photocatalysis. Xue, et al. [39] synthesized mesoporous MnO2/TiO2 nanocomposite, photoactive for the visible light-driven degradation of MB. They attributed the improved photocatalytic efficiency to the effective separation of photogenerated electrons and holes.
However, the industrial usage of photocatalysts is still in need of improvements to maximize the overall efficiency which also depends on mass and charge transfer processes. Therefore, TiO2 nanostructures like zero-dimensional (nanoparticles), one-dimensional (nanowires, rods, and tubes), two dimensional (layers and sheets), and three dimensional (hierarchical spheres) have been widely synthesized, and used [40]. Since the discovery of carbon nanotubes in 1991 by Iijima [41], 1D morphologies as nanotubes (NTs) have become attractive materials due to the efficient separation of charge carriers, shape selectivity in chemical processes, high surface area to volume ratio, high electron mobility, mechanical strength [40,42], and high photoactivity in air purification [43]. Many approaches as sol-gel, template assisted, hydro/solvothermal and electrochemical have achieved to prepare TiO2 NTs. Among these techniques, the electrochemical anodization of a suitable metal or alloy is the simplest, cheapest, and the most direct to grow self-highly-organized-nanotube arrays under specific electrochemical conditions which permit to control the properties of the fabricated NTs [44]. It was reported previously that MnO2-TiO2 NTs composite could be successfully formed by one-step anodic oxidation of Ti–Mn alloy [22,37]. Mohapatra, et al. [45] synthesized ordered arrays of mixed oxide NTs by anodization of Ti/Mn alloys, under ultrasonication in the presence of a fluoride-containing ethylene glycol solution. They pointed out that before calcination, the as-formed NTs showed a stoichiometry of (Ti,Mn)O2, while annealing at 500 °C resulted in formation of nanotubes composed of anatase and rutile phases of TiO2 and Mn2O3. Ning, Wang, Yu, Li, and Zhao [32] electrochemically prepared mixed oxide NTs from Ti–Mn alloys which showed enhanced capacitive properties compared with those of pristine TiO2 NTs.
Herein, this work aims to anodically grow TiO2–MnO2 NTs in a fluoride-containing ethylene glycol-based electrolyte, and their application in the photodegradation of a model gaseous pollutant. According to our best knowledge, photocatalytic properties of nanotubes made of titania and manganese oxide mixtures have been investigated in this work for the first time. Moreover, parameters as the applied voltage (30–50 V), manganese content in the alloy (5–15 wt. %), and water content (2–10 vol. %) in the electrolyte have been also studied for the first time to analyze their effect on the morphology and photoactivity of the obtained NT arrays. Photodegradation tests in the gas phase were conducted with toluene as the model pollutant, and a possible mechanism of visible-light driven decomposition over the TiO2–MnO2 NTs was proposed as well.

2. Results and Discussion

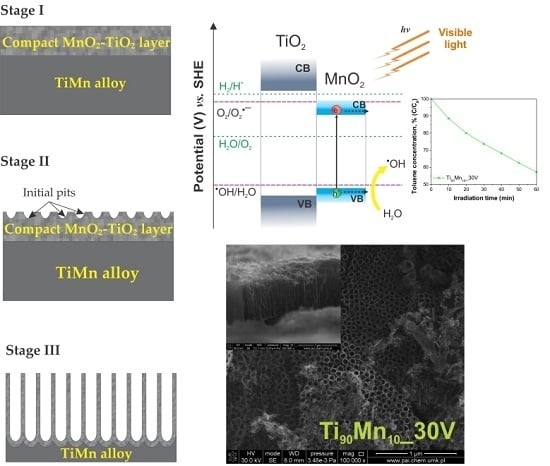
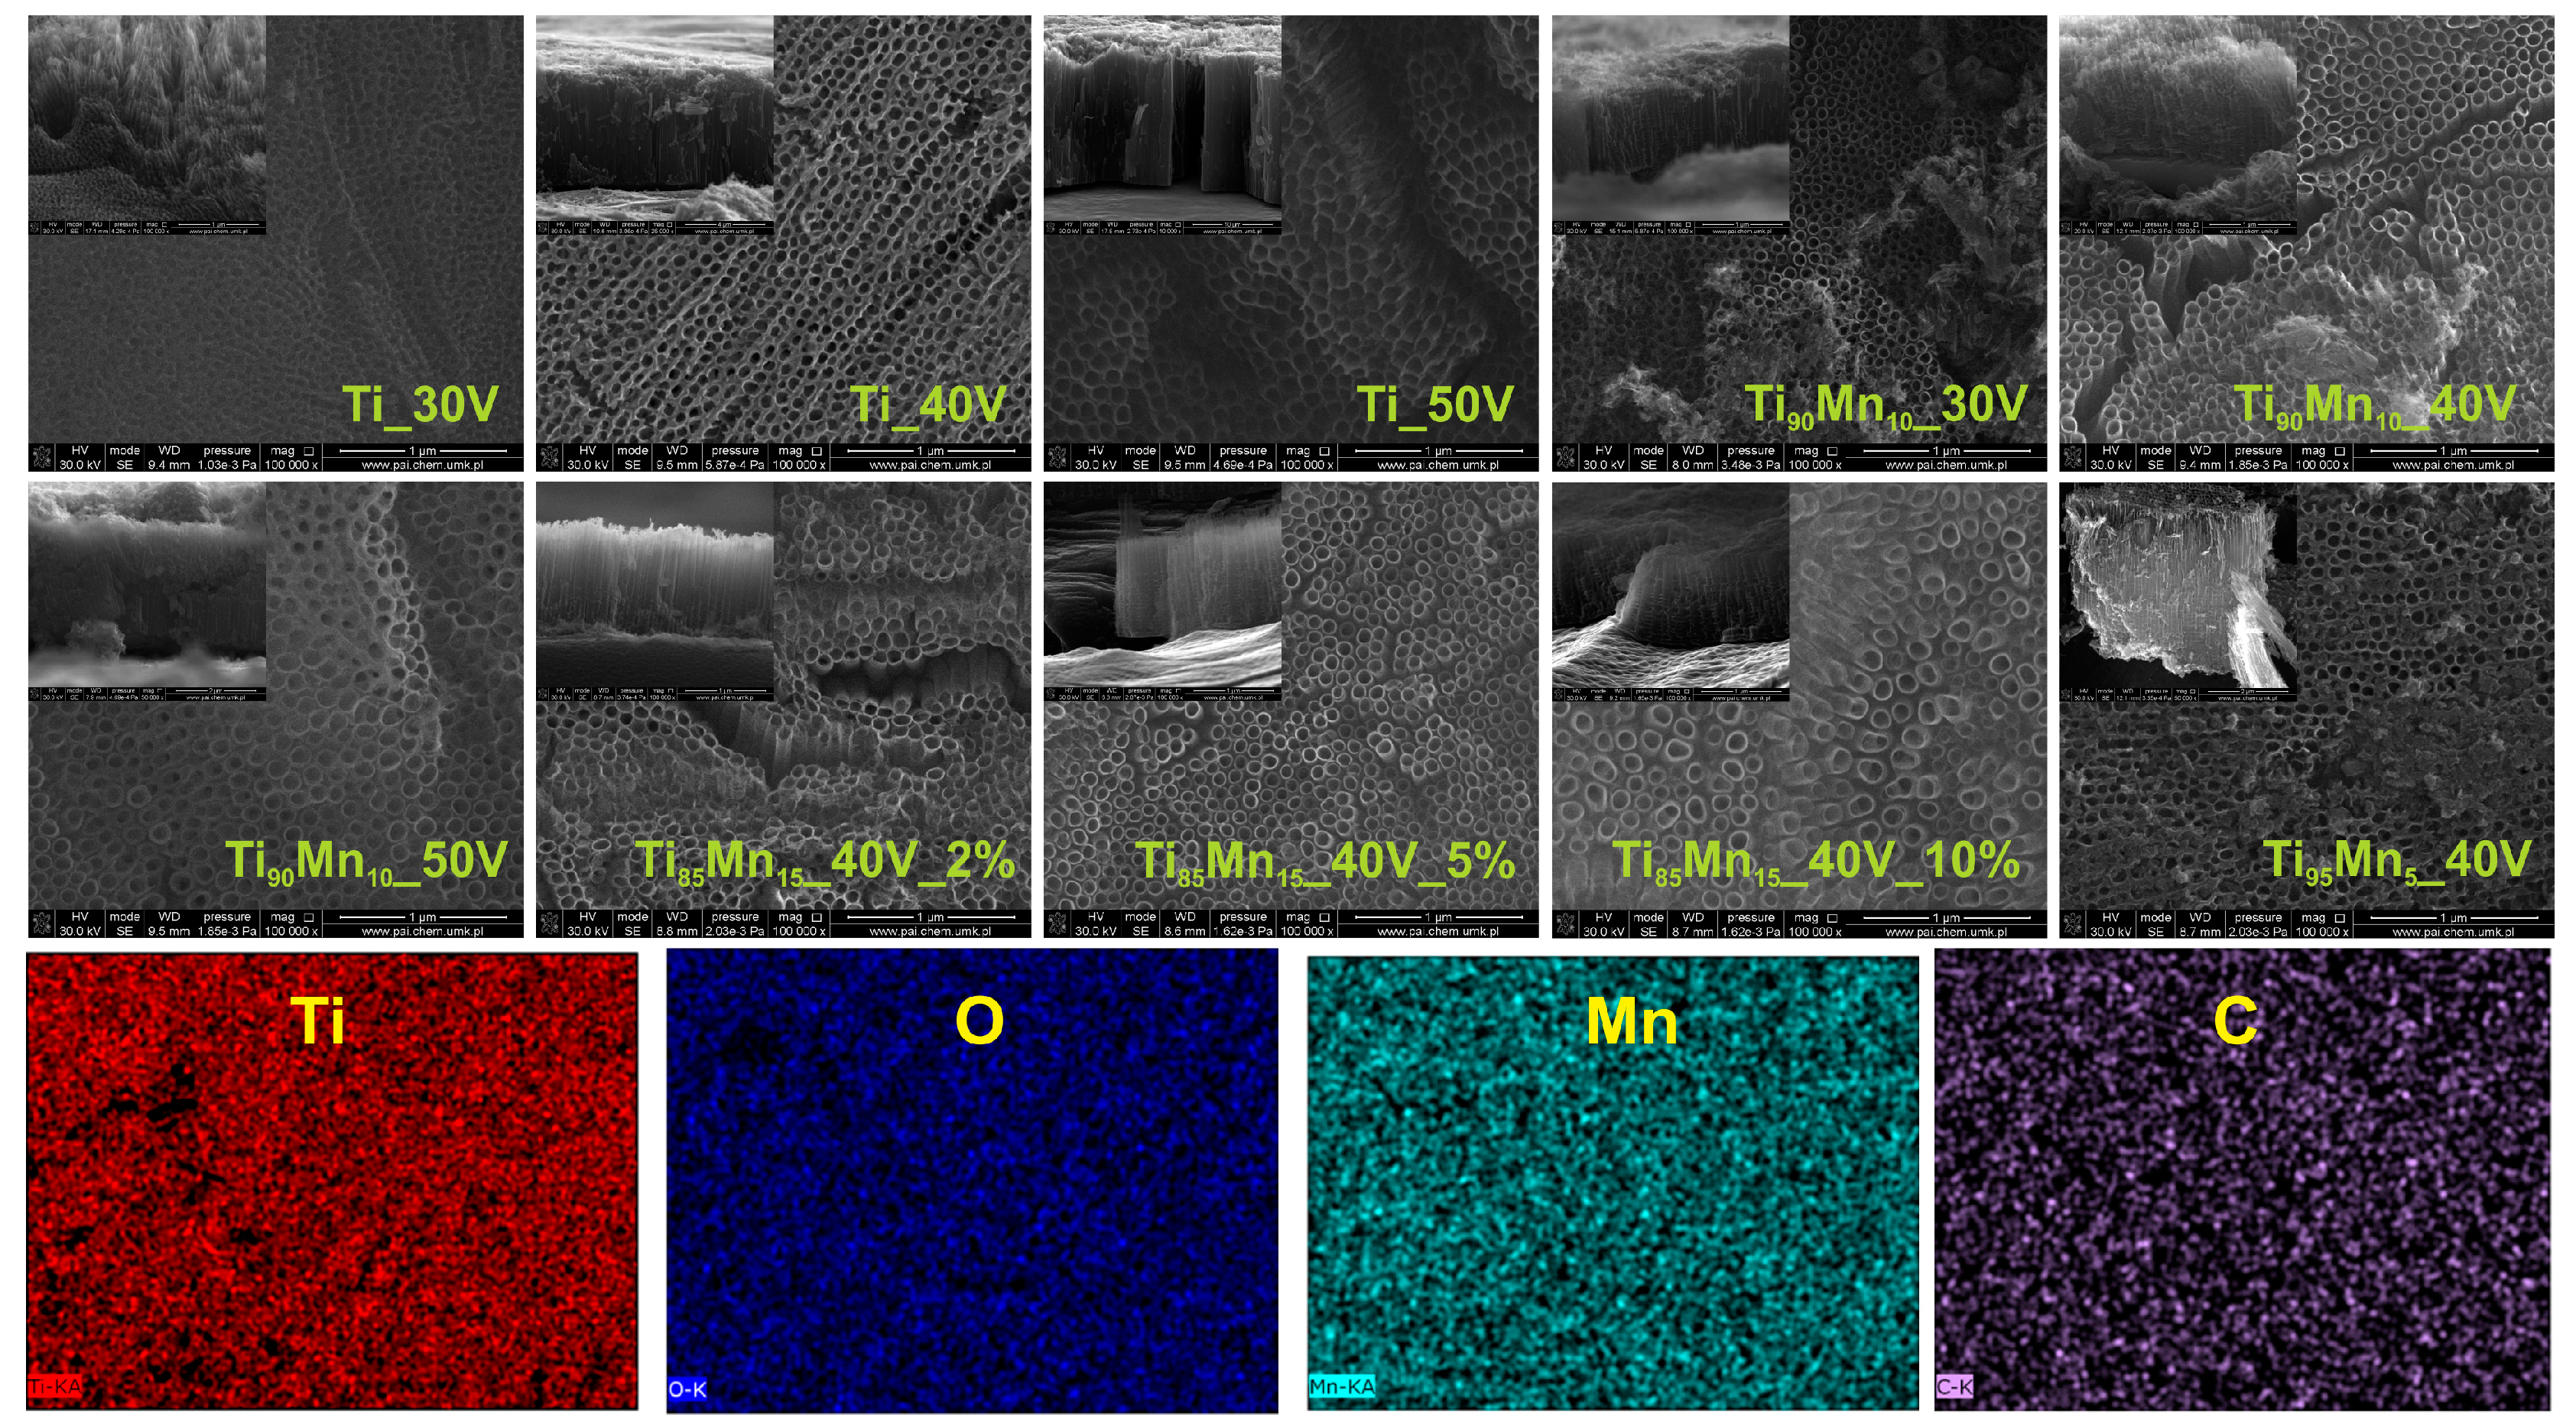
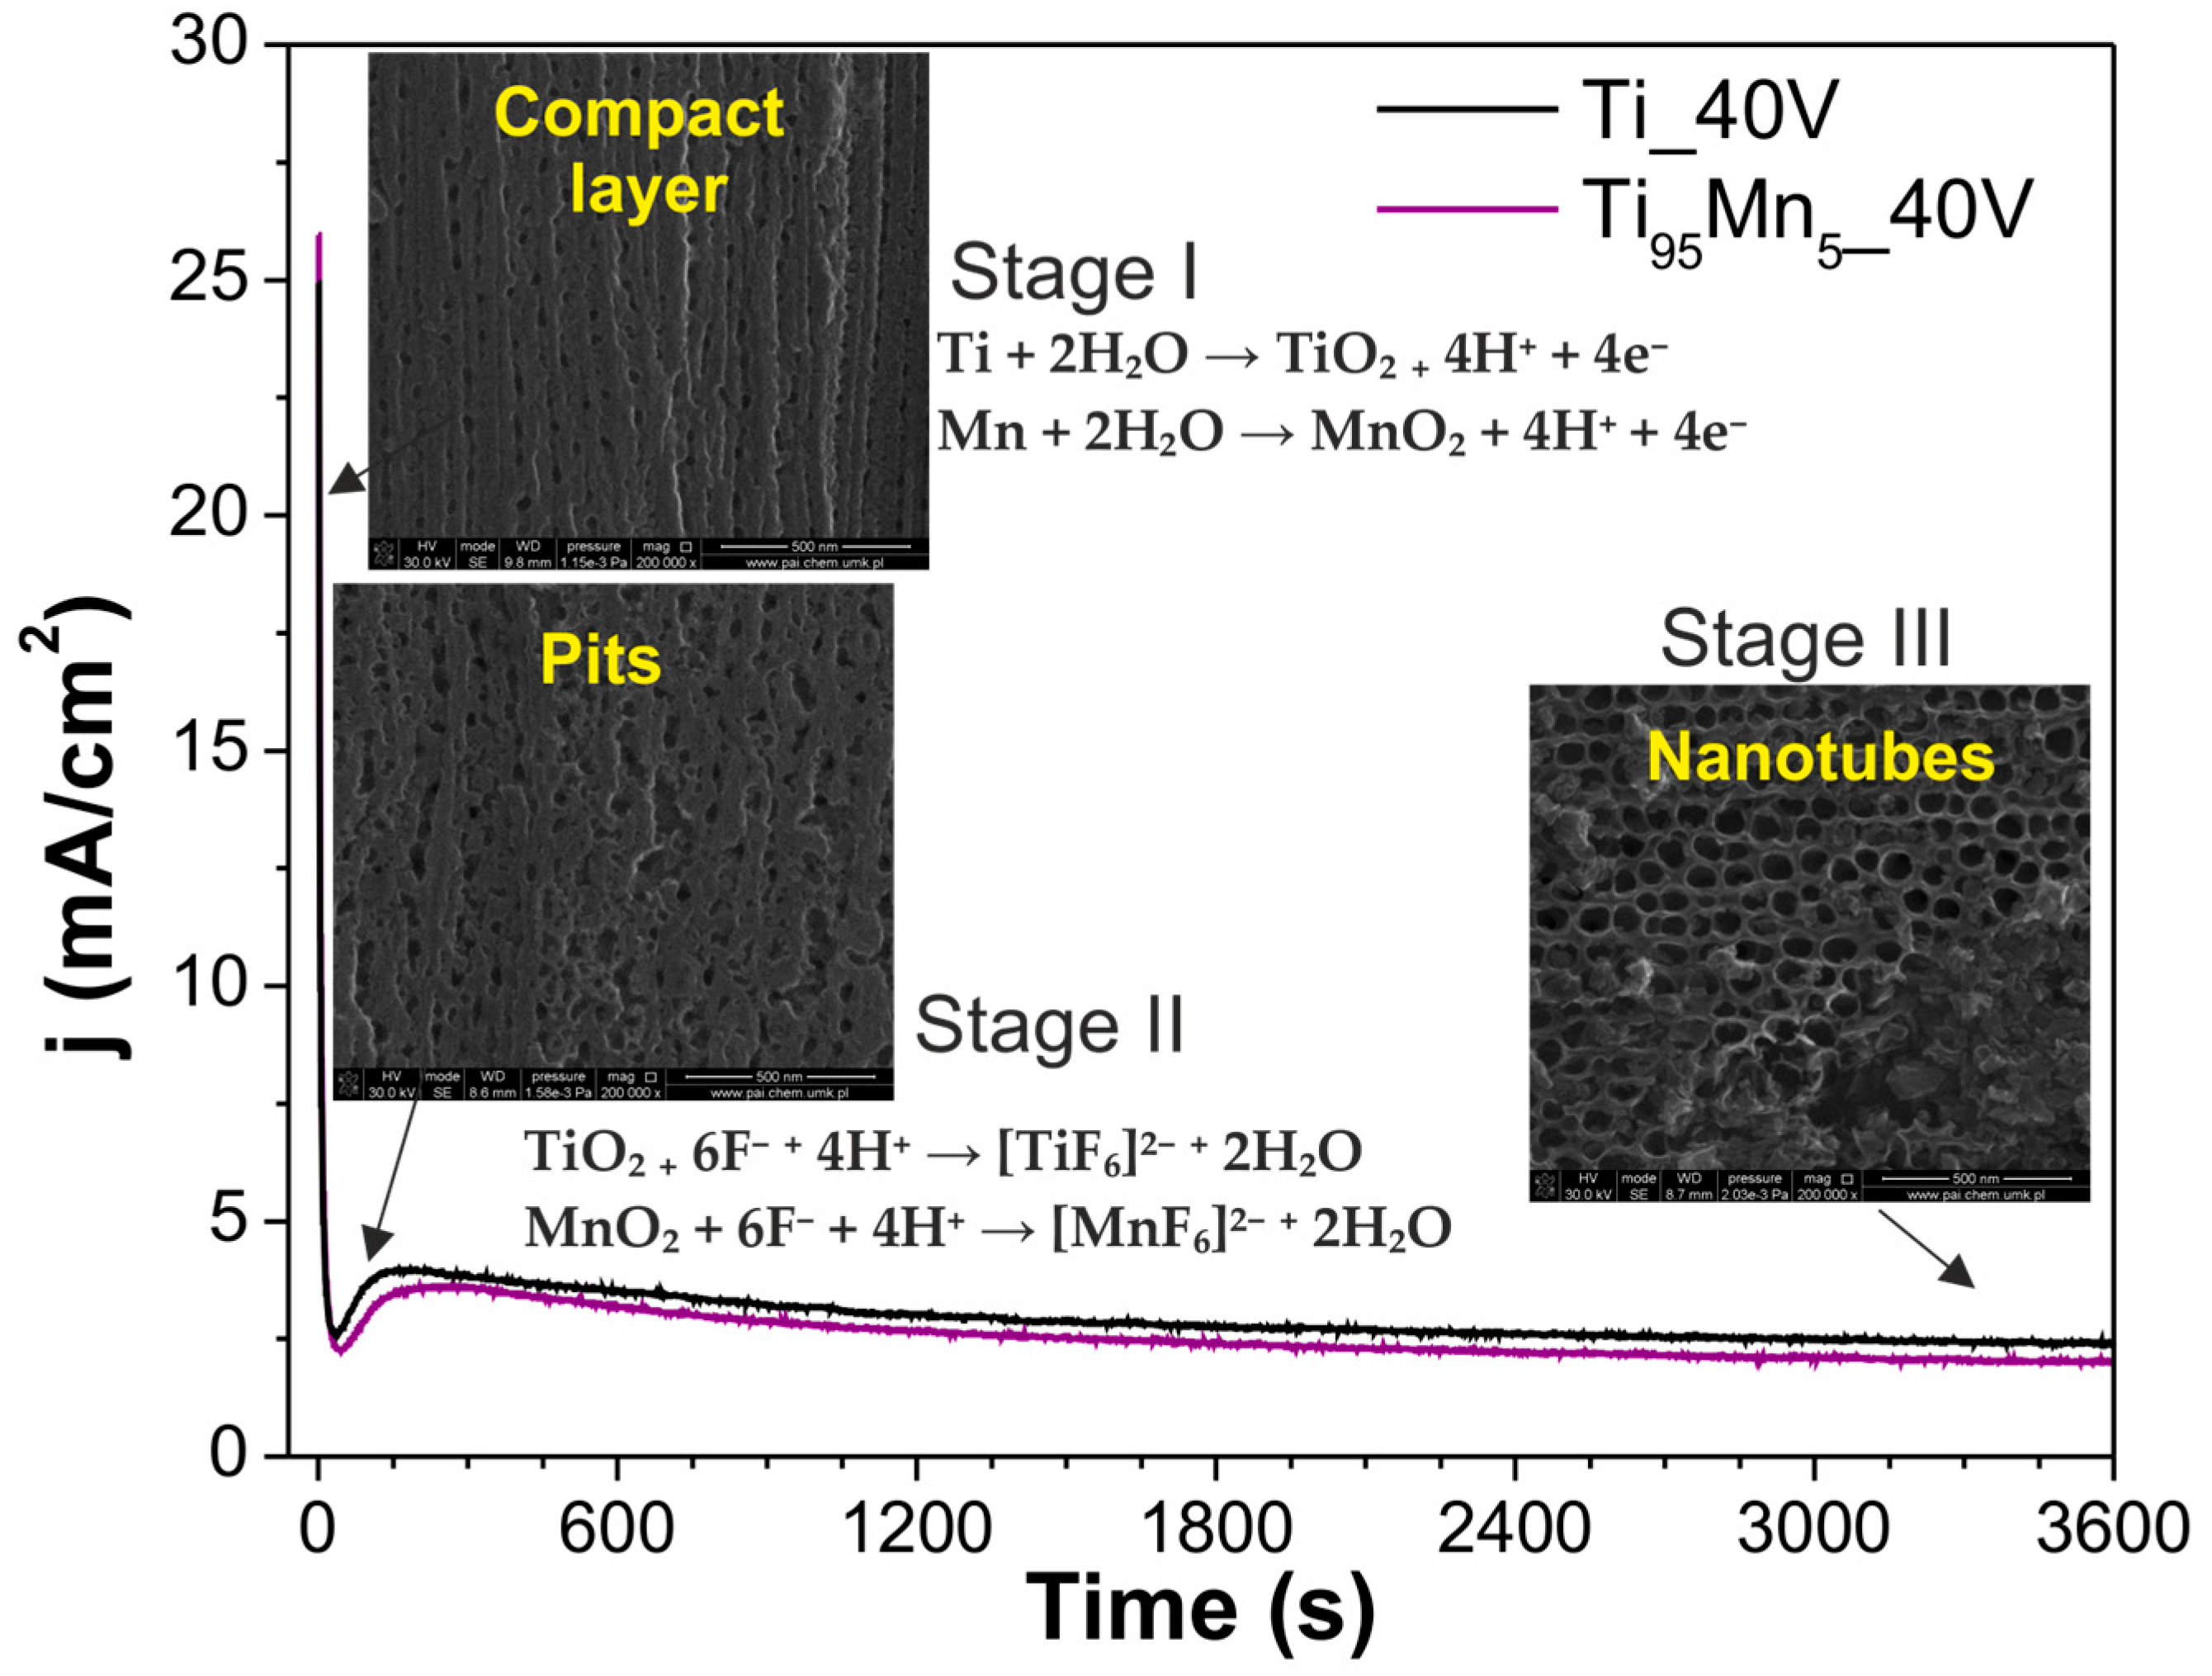
2.1. Morphology and Growth Mechanism

One-step anodization processes were conducted for 60 min to synthesize pristine TiO2 and TiO2–MnO2 nanotube layers from technical grade Ti sheets and Ti–Mn alloys under specific conditions, which are summarized in Table 1. SEM technique was used to analyze the effect of the applied voltage (30, 40 and 50 V), manganese content in the alloy (5, 10 and 15 wt. %) and water content in the electrolyte (2, 5 and 10 vol. %) on the morphology of the as-prepared samples. Figure 1 shows the top and cross-sectional SEM images which indicate that all synthesized nanotubes were uniform and vertically oriented. Pristine TiO2 NTs presented smooth and uniform walls while TiO2–MnO2 NTs had ripples on their walls, which was also observed by Mohapatra, et al. [45] in samples anodized from Ti-8Mn alloys. It is well known that the dimensions of the nanotubes can be easily tuned by changing the preparation parameters [25]. Length and diameter increased with increasing the applied voltage, starting from d = 81 ± 9 nm and l = 1.5 ± 0.1 μm (Ti_30V); and reaching values of d = 120 ± 12 nm and l = 16.2 ± 0.2 μm (Ti_50V) for pristine TiO2 NTs. The influence of anodization voltage was studied keeping constant the manganese content in the alloy (10 wt. %) and the water content in the electrolyte solution (2 vol. %). This way, dimensions of samples synthesized from Ti90Mn10 alloy also were bigger as the applied potential was higher, starting from d = 76 ± 9 nm and l = 1.0 ± 0.1 μm (Ti90Mn10_30V) and rising to d = 118 ± 4 nm and l = 2.8 ± 0.1 μm (Ti90Mn10_50V). Similar behavior of morphological results were reported by Macak, et al. [46]. They performed a systematic study of the factors influencing the two-step anodization of Ti foils in ammonium fluoride-containing glycerol/water mixtures. They prepared NT layers with diameters in the range of 20–300 nm for the potentials 2–40 V, while the thickness of the NT layers, tube length, was in the range of 150 nm up to 3 μm. This dependence of the dimensions, diameter, and length, with the applied potential is in well agreement with the present work. However, herein, the electrolyte media (EG-based) favored longer tubes in the case of pristine TiO2 NTs. Furthermore, a complementary discussion about the anodization voltage effect on the diameter of NT arrays has been reported by Macak, et al. [47]. They stated that, particularly for TiO2 NTs, the diameter strongly depends on the applied potential and electrolyte media, and consequently a wide variety of nanotube diameters can be obtained.
The samples fabricated at 40 V from Ti85Mn15 alloy in electrolytes with different water content (2–10 vol. %) reported smaller length (1.1–1.3 μm) than that of the analogous non-modified (Ti_40V, 5.0 ± 0.4 μm). As it was mentioned in previous works [44,46], the increase of water in the electrolyte, provoked the increase in the formation of ripples in the tube walls. The sample prepared from the alloy with 5 wt. % of Mn showed the longest modified nanotubes (3.4 ± 0.3 μm), presumably due to the low content of Mn in the alloy which allowed a better stabilization of the nanotube matrix by TiO2 species. Detailed information is displayed in Table 1. As it can be seen, all TiO2–MnO2 NTs were shorter, with smaller wall thickness than their pristine analog. Their length decreased with increasing the manganese content in the alloy. This could be attributed to the increase in the dissolution rate in phases with higher manganese content [32,45].
Table 1 also presents the results from EDX analysis which is in accordance with the composition of the alloys and no elements different from Ti, Mn, C, and O were found. Figure 1 presents also the EDX mapping of a selected sample where all elements are well dispersed and thus, there was not aggregation of Ti and Mn which guaranteed chemically homogeneous nanotube arrays.
A possible growth mechanism was proposed in Figure 2, based on the obtained results from SEM images of the sample Ti95Mn5_40V anodized during 4, 15 and 60 min and information provided in literature. It is possible to observe that the current density-time curves recorded for TiO2–MnO2 NTs resemble those corresponding to pristine TiO2 NTs. The characteristic exponential decay of current density during the first stage indicates the formation of the oxide layer composed of TiO2 and MnO2 [45], Progressively, the chemical etching induces the apparition of initial random pits in the mixed oxide layer due to its dissolution through the formation of the fluoride complexes [TiF6]2− and [MnF6]2− [48,49]. Consequently, the resistive field decreases, allowing the current density to increase along the second stage. Finally, throughout the third stage, an equilibrium is established between oxidation and chemical dissolution, leading to the self-organized nanotube growth under steady state conditions [47] allowing the auto-alignment of the nanotubes.

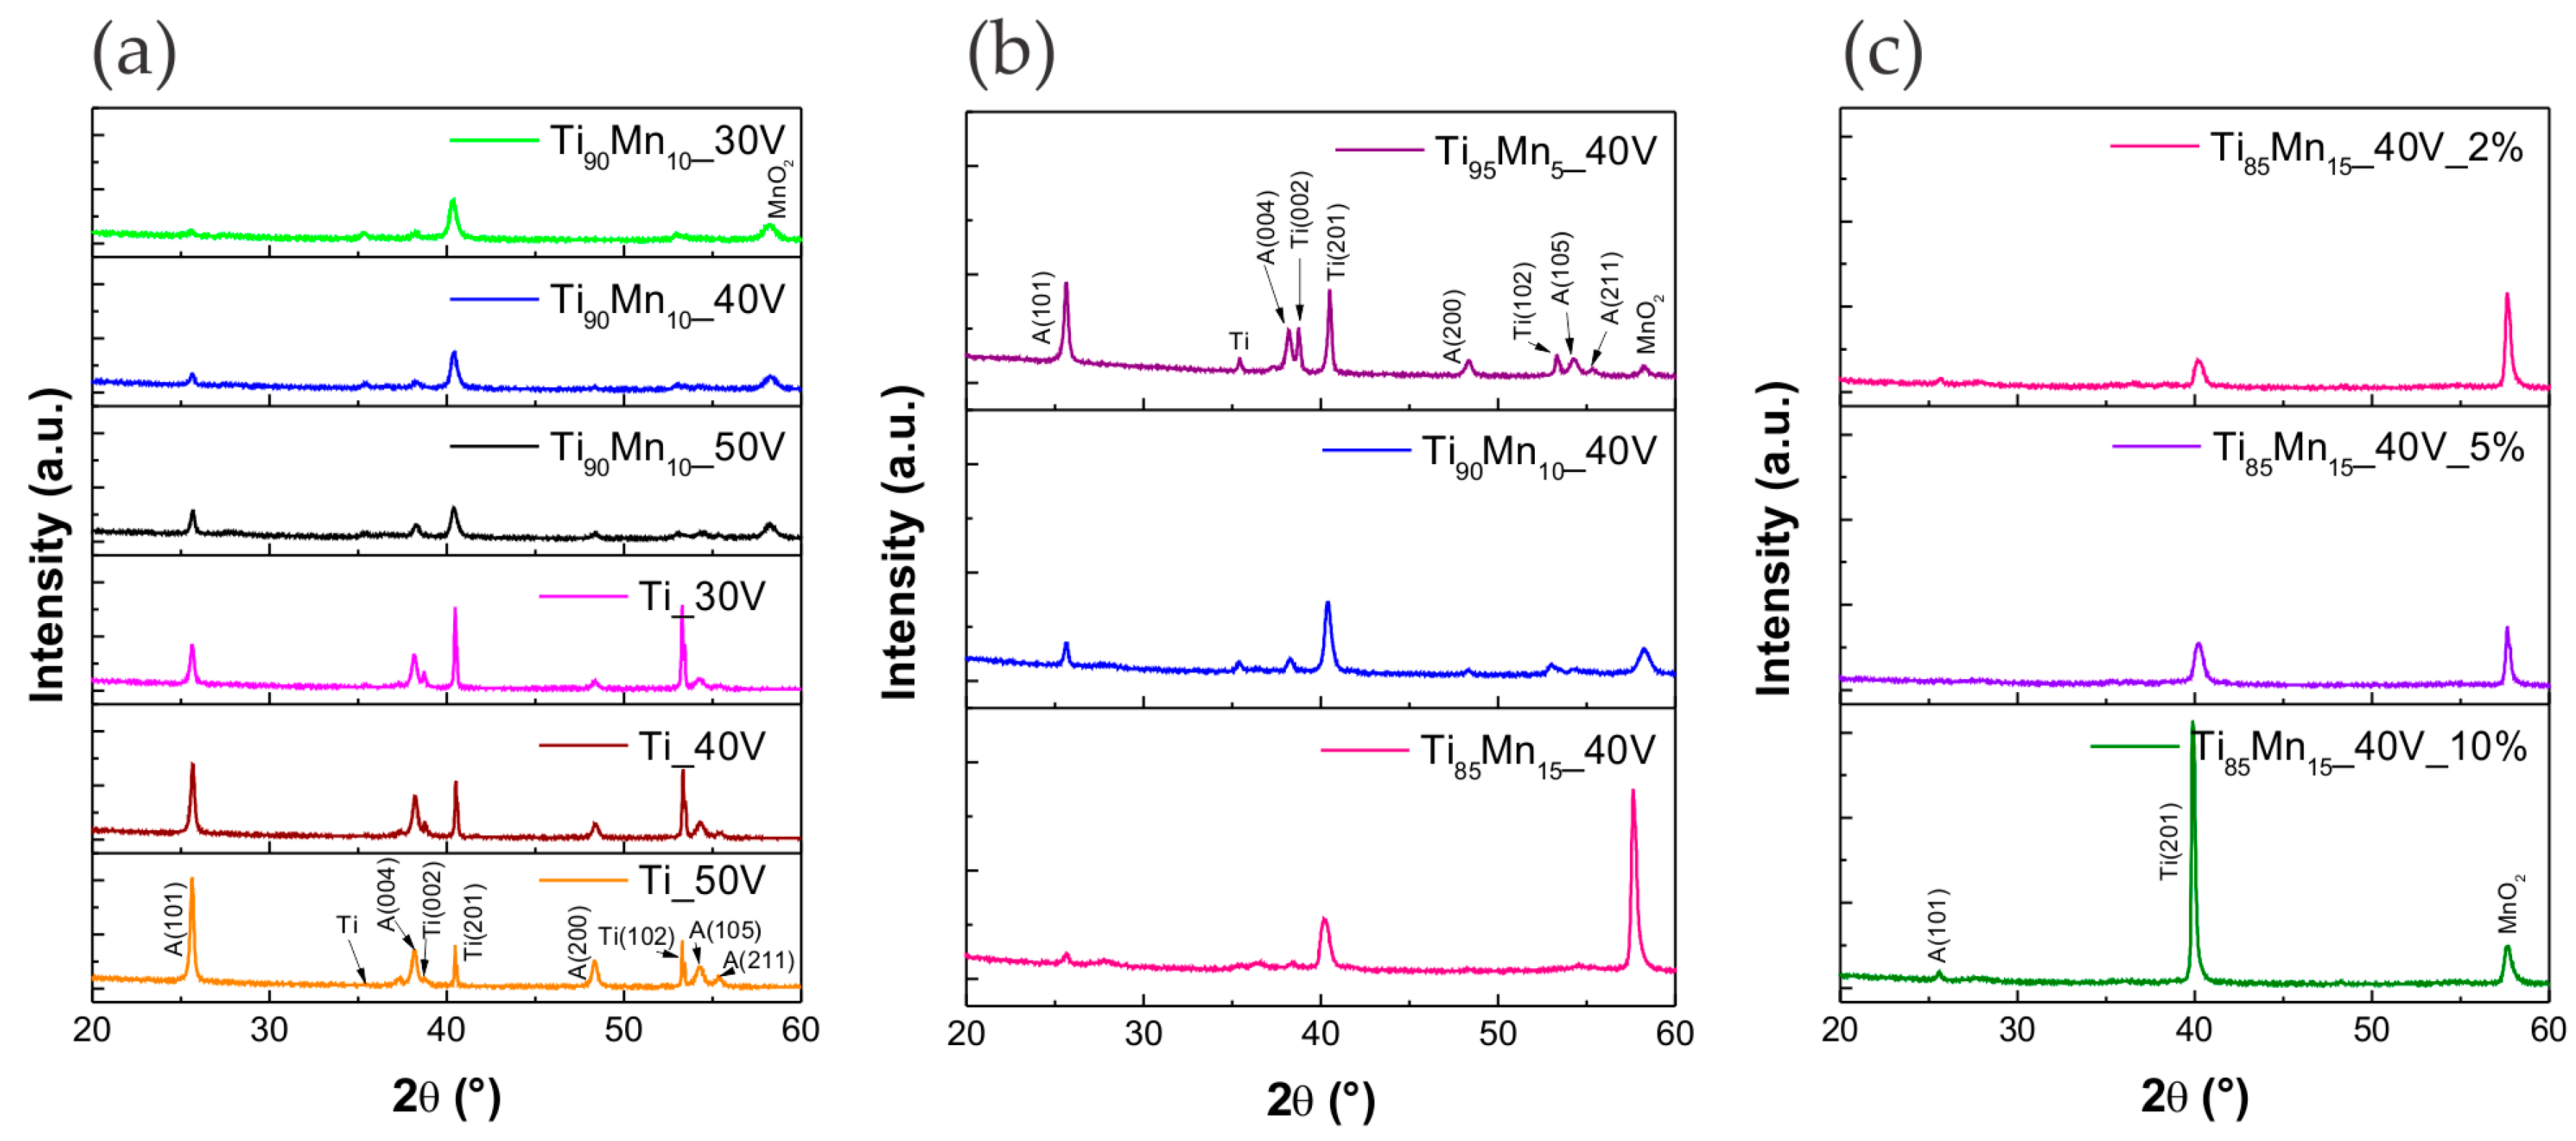
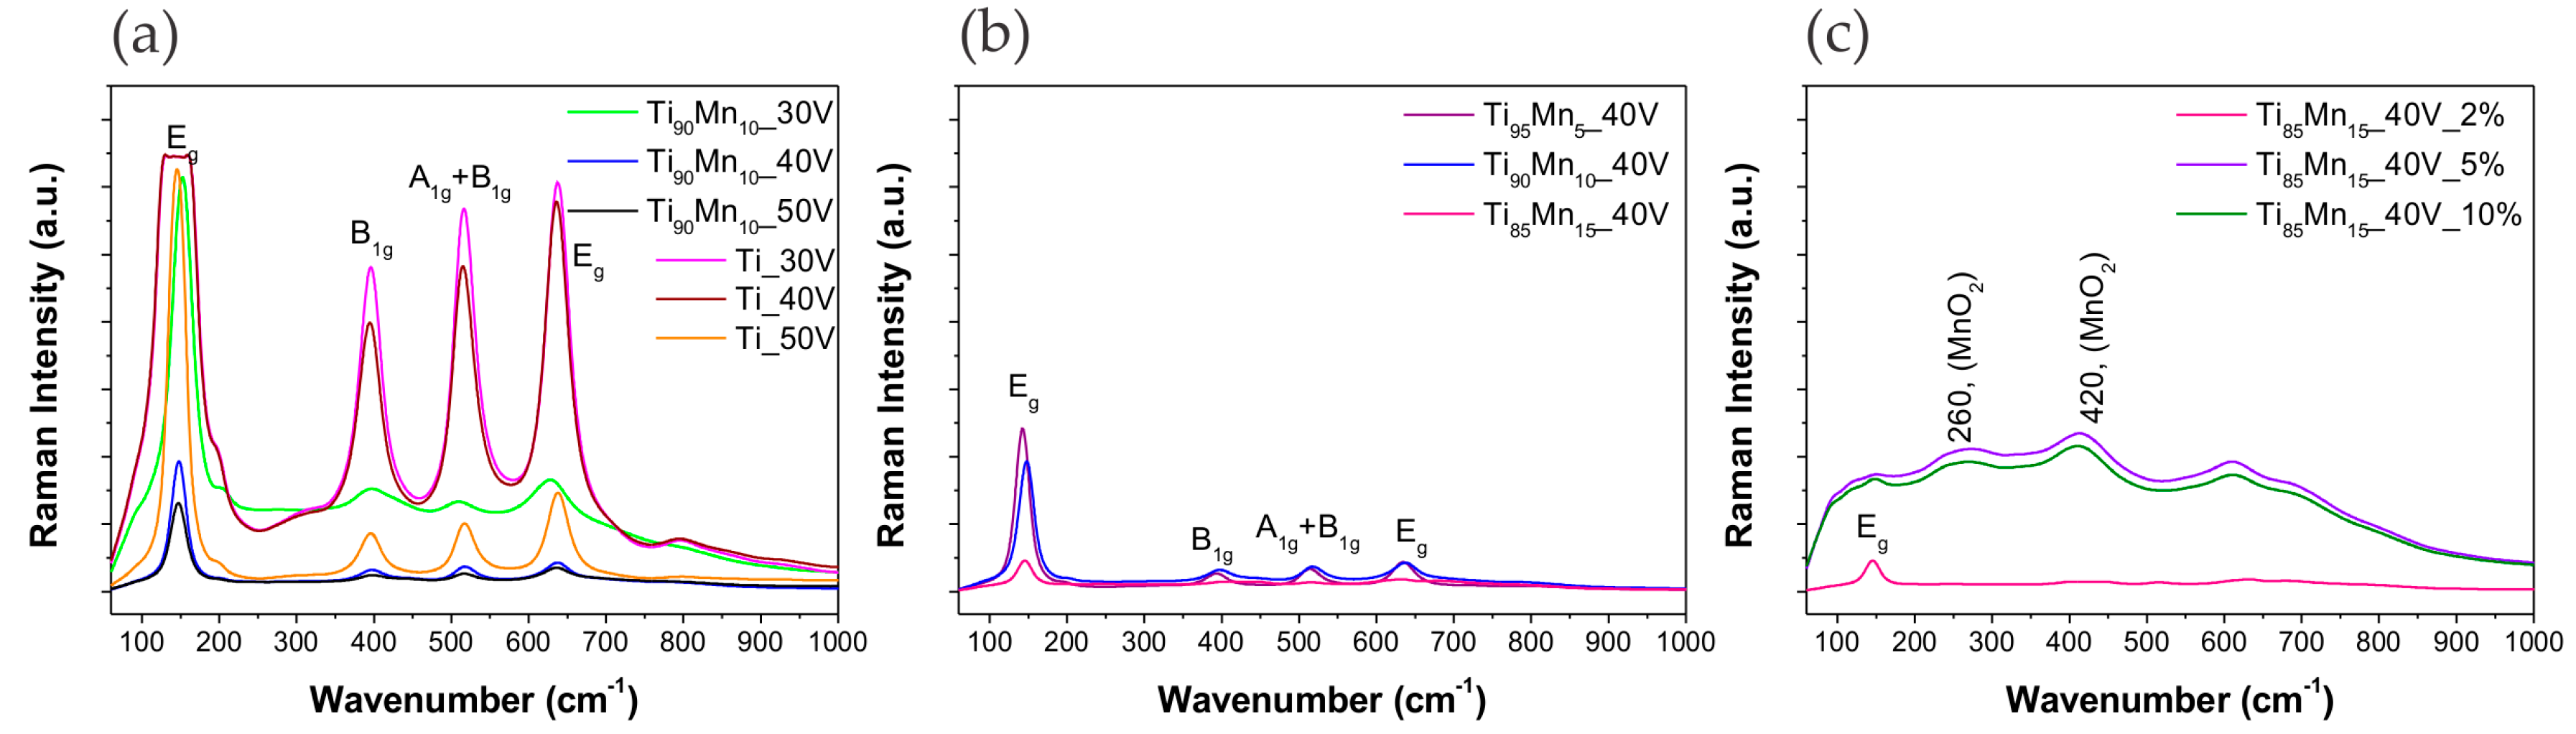
2.2. Structural Properties

The XRD patterns of the as-obtained NTs are presented in Figure 3. As it can be seen, obtained pristine and TiO2–MnO2 NTs consisted mainly of pure anatase TiO2, while the peaks of Ti came from Ti substrate. Five common planes of anatase were found, namely (101), (004), (200), (105) and (211). The intensity of anatase diffraction peaks increased with increasing the anodization potential as a result of thicker NT layer. It was possible to observe just one characteristic peak ascribed to MnO2 at about 58° [50,51]. The absence of any other band corresponding to the signature of MnO2 can be related to the small content and good dispersion of manganese oxide in the TiO2 NT layer, as it was mentioned in previous reports [32,39,52]. However, the constant diffraction peak positions indicate that the structure of TiO2 was not changed through the anodization of Ti–Mn alloy.
The calculated average crystallite size for pristine and modified TiO2 NTs is summarized in Table 1. The average crystallite size was calculated using the Scherrer equation, based on (101) diffraction peak. The largest crystallite size was observed for pristine TiO2 NTs and varied from 33 (30 V) to 38 nm (50 V). Among Ti–Mn series, crystallite sizes tended to be smaller than those of pristine TiO2 NTs. This can be correlated to the wall thickness, as mentioned above, wall thickness of TiO2–MnO2 NTs was smaller than that of pristine TiO2 NTs, thus there is less space to allow the growth of grain.
To further analyze the structure of the synthesized photocatalysts, micro-Raman spectroscopy was performed using a 532 nm laser as excitation light. Figure 4 displays the recorded spectra of pristine TiO2 and TiO2–MnO2 NTs. As it can be seen, the spectra of the samples obtained from alloys with 5 and 10% of Mn mainly presented the signature peaks of anatase phase which are sharper in the spectra of pristine TiO2 NTs. These peaks at approximately 150, 396, 515, and 636 cm−1 can be attributed to the Eg (TiO2 symmetry), B1g (O–Ti–O bending), A1g + B1g (T–O stretching), and Eg modes of anatase as it was exposed in previous reports [53]. The presence of MnO2 in these samples decreased the intensity and broadened the anatase bands. On the other hand, the characteristic peaks of MnO2 at around 521 and 644 cm−1, assigned to the stretching mode of octahedral MnO6 [54], overlapped the anatase peak at 636 cm−1 in the spectra of the samples prepared from Ti85Mn15 alloys, making it broaden to a range of 575–650 cm−1 [52]. These spectra also showed week bands at about 260 and 420 cm−1 originated from the bending modes of the metal–oxygen chain of Mn–O–Mn in the MnO2 octahedral lattice [55,56,57].

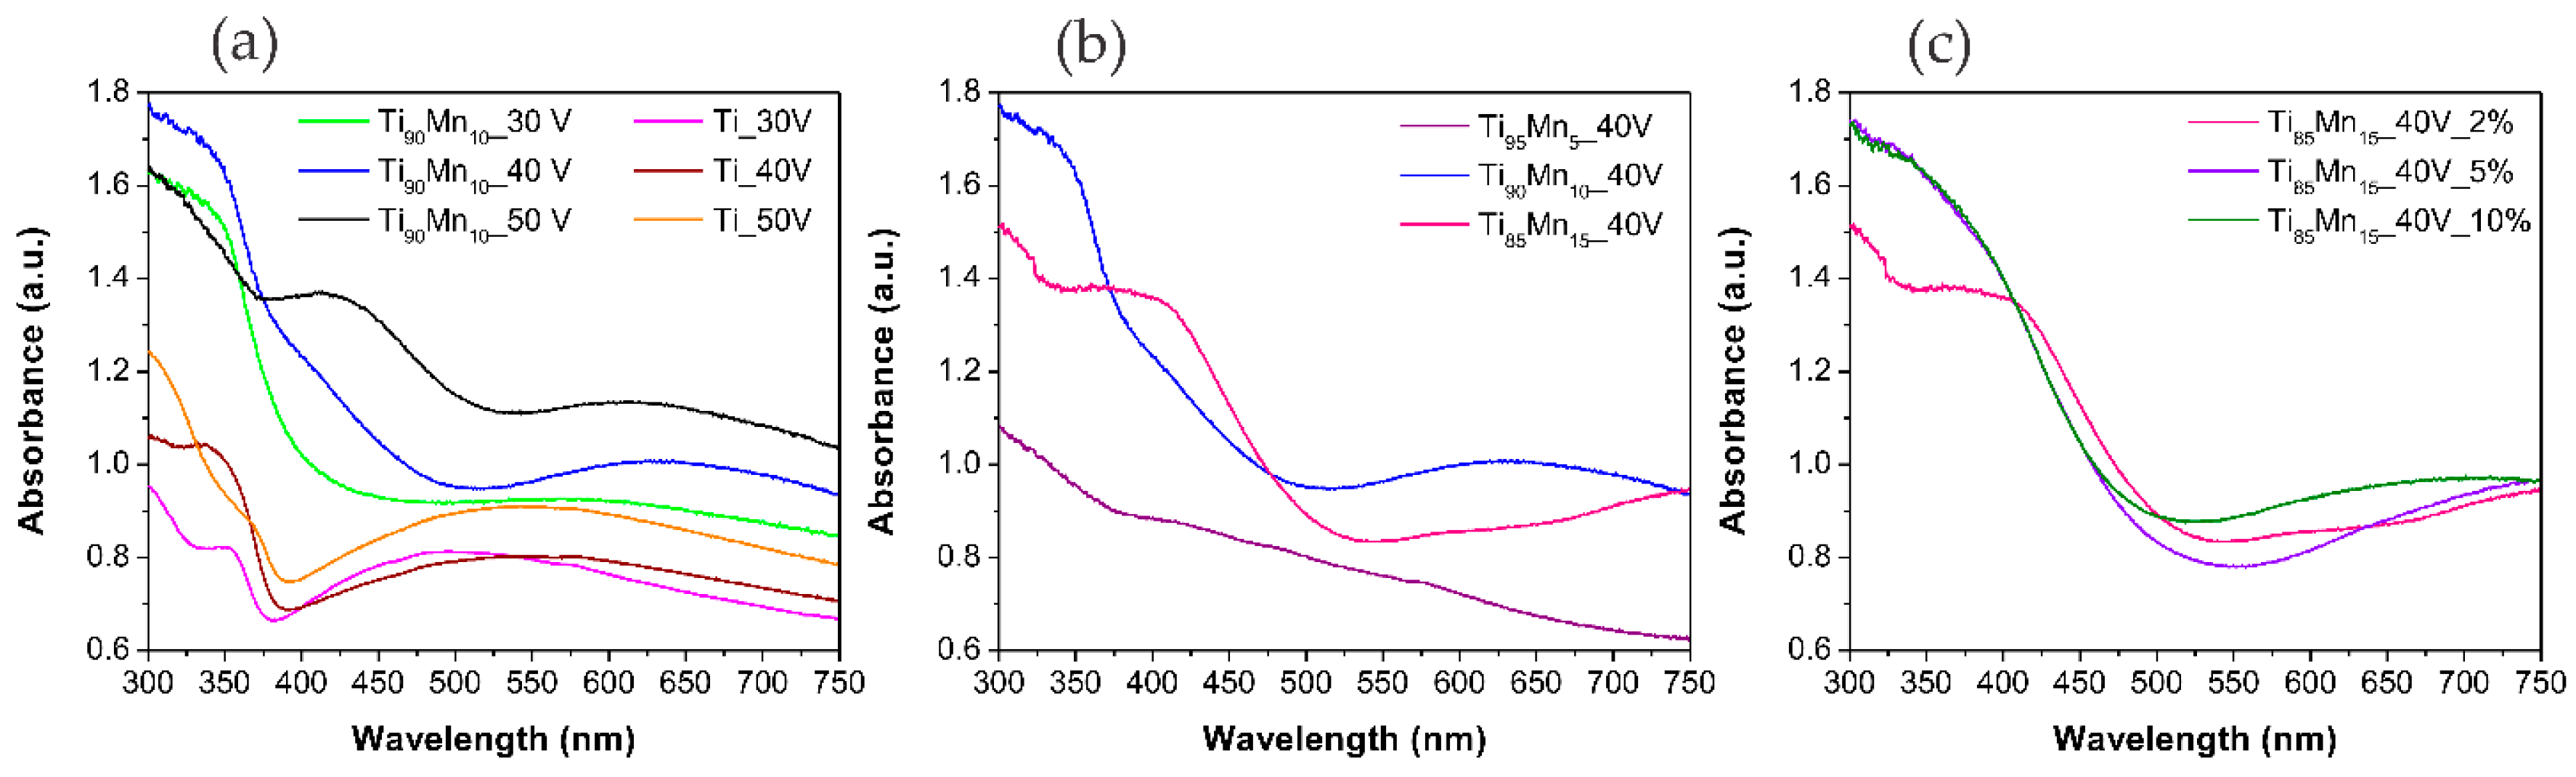
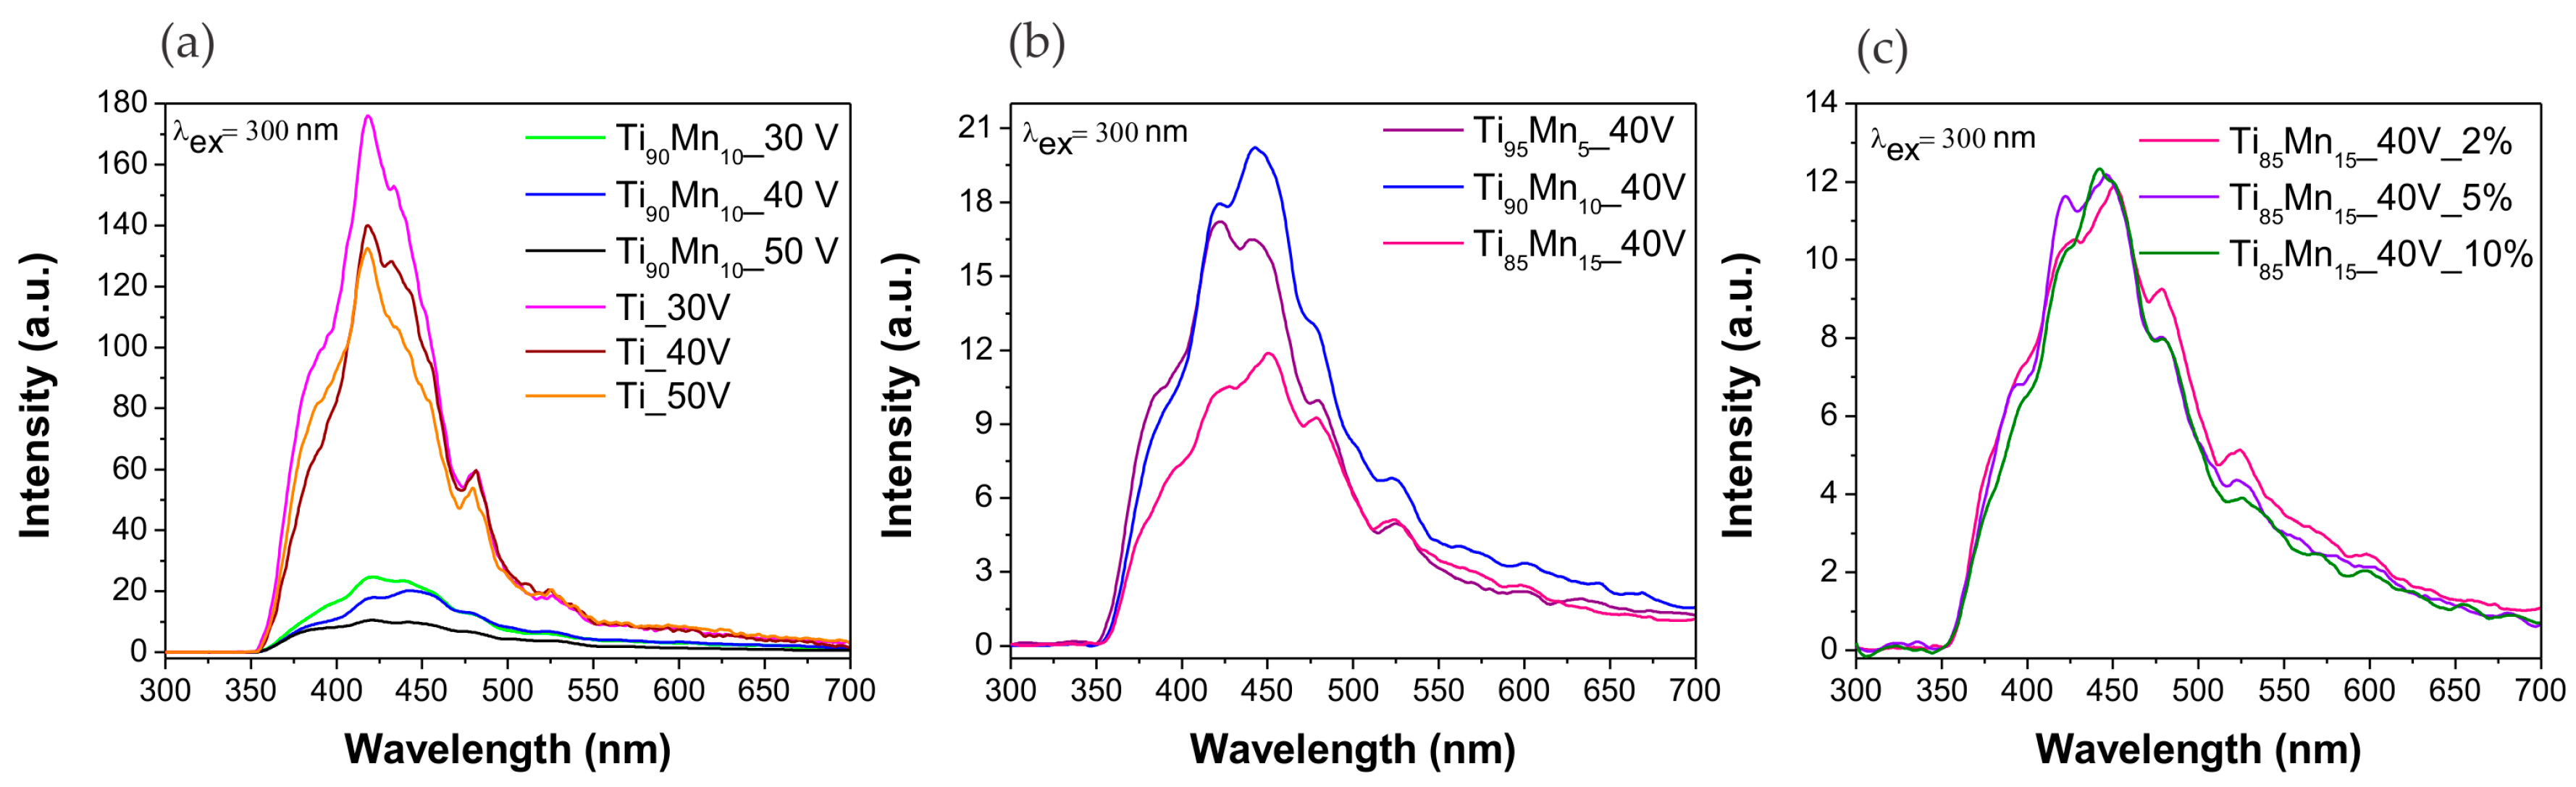
2.3. Optical Properties

Figure 5 shows the absorption spectra of pristine TiO2 and TiO2–MnO2 NTs. All the samples synthesized from the Ti–Mn alloy exhibited absorption in the full visible range due to the presence of MnO2 as it was previously reported for TiO2 NTs coated by MnO2 [58]. The absorption band edge of pure TiO2 NTs at about 400 nm registered a red-shift at about 500 nm which is easier to appreciate in samples prepared from alloys with 15% of Mn. This was also observed in the case of mesoporous structured MnO2/TiO2 nanocomposites [39]. As it was stated by Ding, et al. [59], TiO2–MnO2 NTs could be used for solar-light driven photocatalysis owing to their absorption in the UV and visible region.
Figure 6 shows photoluminescence (PL) spectra of both: pristine TiO2 and TiO2–MnO2 NTs. Four emission peaks were detected among all series of photocatalysts. First one, at approximately 420 nm can be ascribed to the existence of self-trapped excitons from TiO68−octahedron, while the second and third peaks at 450 and 485 nm are associated with the presence of surface defects and oxygen vacancies. The last peak at approximately 525 nm is associated with radiative recombination of charge carriers [60,61].

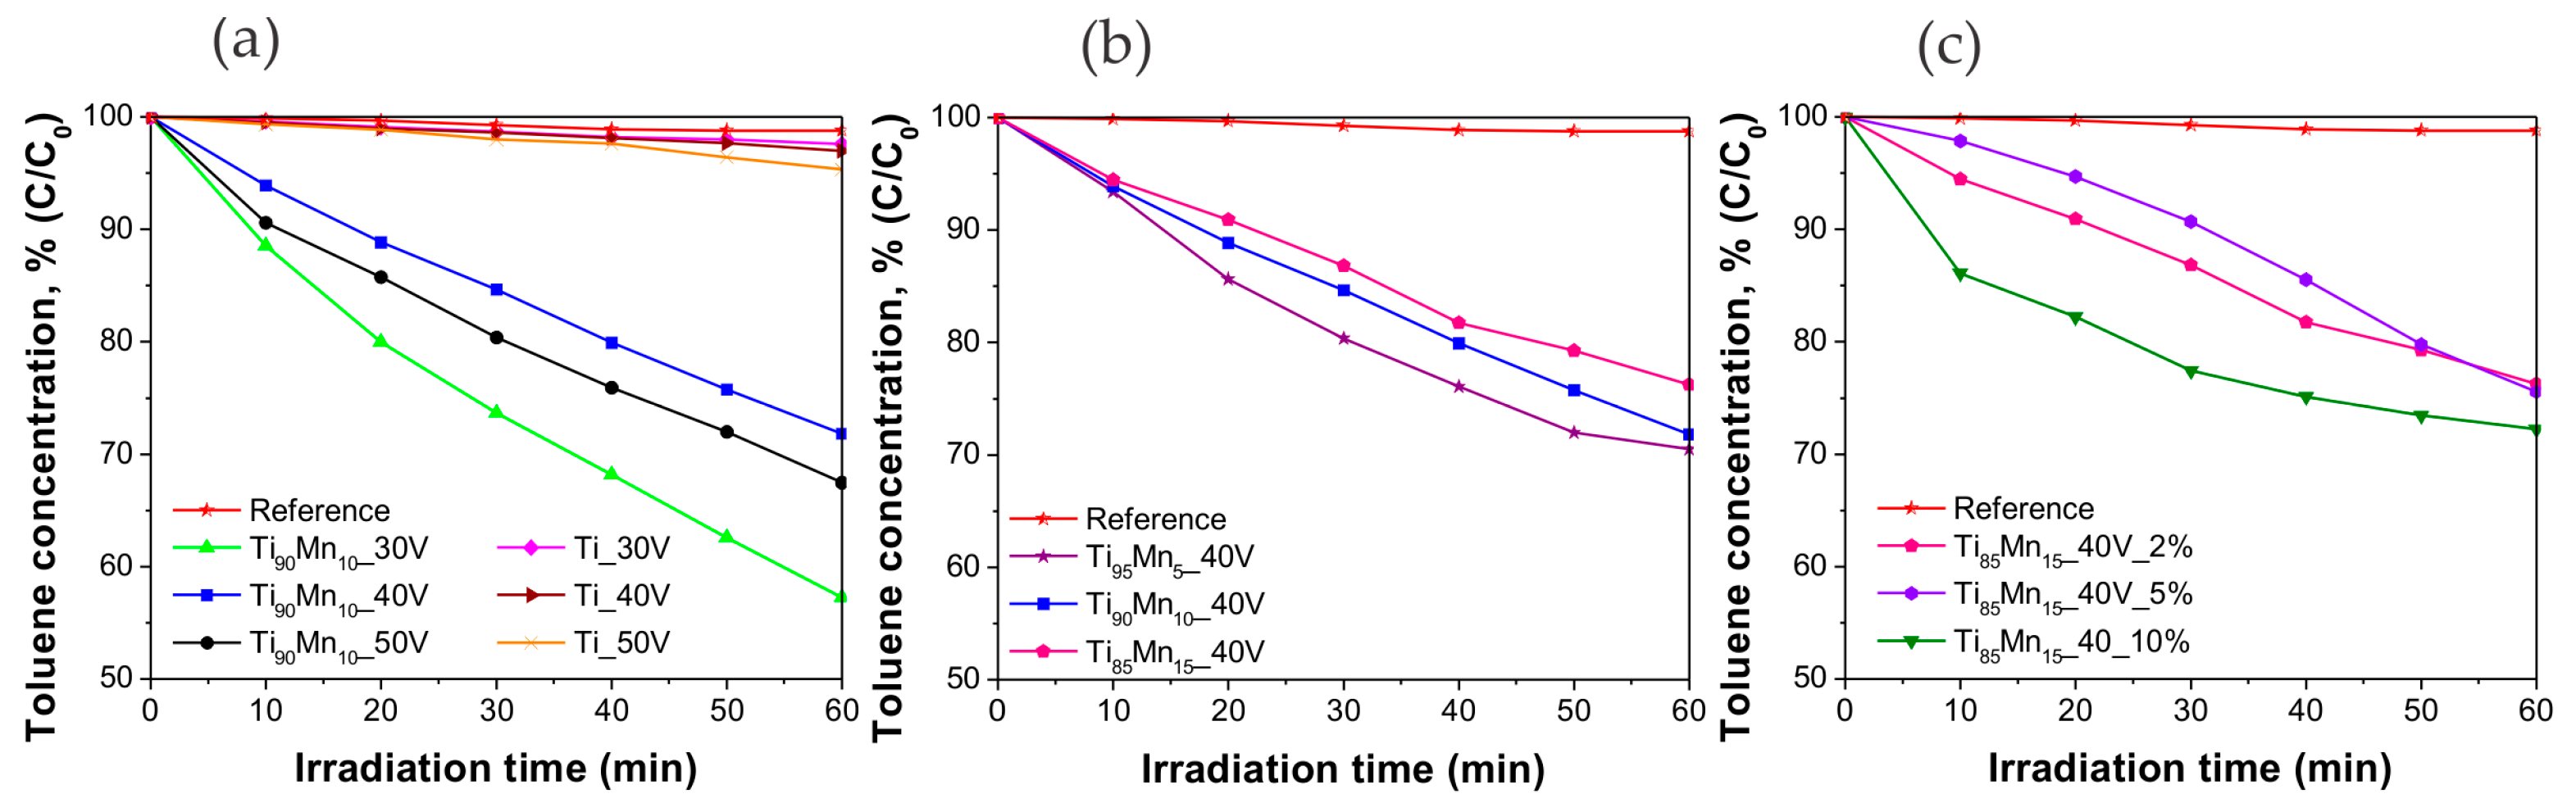
2.4. Photocatalytic Performance

The photoactivity of the prepared samples was tested in the visible-light-driven photodegradation of toluene (200 ppmv) from an air mixture. The irradiation source consisted of a LED array with λmax = 465 nm. The effect of anodization voltage, manganese content in the alloy and water content in the electrolyte was systematically studied. Figure 7 presents the degradation curves in the presence of obtained NT photocatalysts and a reference curve in the absence of any photocatalyst, to test photolysis. It is clearly showed that in the reference curve, degradation was not achieved. Pristine TiO2 NTs exhibited insignificant toluene removal (about 5%) while all of the samples were photoactive towards the degradation of the model pollutant. Figure 7a shows that the highest degradation after 60 min of irradiation was achieved in the presence of the Ti90Mn10_30V sample (43%). The samples anodized from Ti90Mn10 alloys at 40 V and 50 V reported similar toluene removal, 28% and 33% respectively. The results displayed in Figure 7b indicate that the manganese content in the alloy inversely affected the photoactivity, the higher the manganese content in the alloy was, the less degradation was achieved. This way, samples prepared from alloys with 5, 10 and 15 wt. % of manganese reached a degradation of 29%, 28%, and 24%, respectively. This was also observed by Xue, Huang, Wang, Wang, Gao, Zhu, and Zou [39] in the dye-mediated photodegradation of MB under visible light in the presence of mesoporous MnO2/TiO2 nanocomposites. They attributed the lower degradation to the accumulation of MnO2 on the surface of TiO2 which increased the transfer rate of photogenerated electrons within MnO2, overall weakening the effect of improving the photoactivity. The photoactivity of the samples from the series with different water content in the electrolyte was similar between each other (Figure 7c), the highest toluene removal (28%) was accomplished by the sample with 10% of water in the electrolyte. The other two samples exhibited 24% of toluene removal. The kinetic parameters of each photocatalyst are included in Table 2.
The highest initial reaction rate (8.54 ± 0.53 × 10⁻² μmol·dm−3·min−1) and reaction rate constant (9.57 ± 0.59 × 10⁻³ min−1) were observed for the toluene degradation over the Ti90Mn10_30V sample and they were more than 23 times higher compared with those of pristine TiO2 NTs obtained by anodization at 30 V (0.37 ± 0.09 × 10⁻² μmol·dm−3·min−1 and 0.42 ± 0.10 × 10⁻³ min−1).
As shown in Table 2, the most photoactive sample, Ti90Mn10_30V, was used to analyze the effect of the irradiation wavelength (λmax = 375, 415 and 465 nm) in the same degradation reaction. As evident from Figure 8a, the maximum toluene removal (43%) was reached under 465 nm while under 375 nm (UV light) and 415 nm (25% and 20% of degradation, respectively) the sample was less active. This can be explained by a synergistic effect of MnO2 and TiO2 in the NT matrix. As it was formerly reported [58], MnO2 has lower photoactivity than TiO2 under UV light irradiation, and thereby, this narrow-bandgap semiconductor reduced the overall photoactivity of the composite in this wavelength range because of a synergistic effect in the composite. This behavior under UV light was also exposed by Xue, et al. [39] who indicated that the transferring of photoexcited electrons (generated in TiO2) within MnO2 can correspond to an internal dissipation able to suppress the photocatalytic activity. On the other hand, Xu, et al. [58] reported improved visible light-photoactivity for NTs electrodeposited with MnO2. Therefore, we can conclude that the presence of MnO2 in TiO2 NTs favored the conditions for the degradation of toluene in gas phase under visible light (longer wavelength of irradiation) owing to the ability of MnO2 species to absorb visible light irradiation and promote the enhancement of the charge transfer rate.
Additionally, a possible excitation mechanism of TiO2–MnO2 NTs under Vis light was proposed and diagrammed in Figure 8b. The conduction band and valence band edge values of MnO2 were calculated to be 0.57 and 2.34 eV, respectively [34]. Thus, it is likely that photogenerated holes from the valence band (VB) of MnO2 could be involved in the formation of hydroxyl radicals (OH), while electrons from the CB of MnO2 can participate indirectly in the degradation of toluene, considering that the potential of photogenerated electrons is not high enough to generate other reactive oxygen species, such as O2•−, H2O2, and HO2 radicals.

3. Materials and Methods

3.1. Materials

Acetone, isopropanol, and methanol were purchased from P.P.H. “STANLAB” Sp. J. (Lublin, Poland), while ethylene glycol (EG) from CHEMPUR and ammonium fluoride from ACROS ORGANICS. Technical grade Ti foils and Ti–Mn alloys with 5, 10 and 15 wt. % of manganese content were provided by HMW-Hauner Metallische Werkstoffe (Röttenbach, Germany). Deionized (DI) water with conductivity of 0.05 μS was used to prepare all aqueous solutions.

3.2. Synthesis of Pristine TiO2 and TiO2–MnO2 Nanotubes

Ti foils as well as Ti–Mn alloys were ultrasonically cleaned in acetone, isopropanol, methanol, and deionized water for 10 min, respectively. Then, foils were dried in an air stream. The anodization processes were carried out at room temperature, in an electrochemical cell consisting of a platinum mesh as counter electrode, and the Ti foils or the Ti–Mn alloy (2.5 cm × 2.5 cm) as working electrode. A reference electrode of Ag/AgCl connected to a digital multimeter (BRYMEN BM857a) was used to control and record information about the actual potential and current on the alloy. The anodization was conducted in an electrolyte composed of EG, water and NH4F 0.09 M, during 60 min with a voltage in the range of 30–50 V applied with a programmable DC power supply (MANSON SDP 2603). Three electrolyte solutions with different water content were used (volume ratios of EG:water of 98:2, 95:5 and 90:10) The obtained samples were rinsed with deionized water, sonicated in deionized water (1 min), dried in air (80 °C for 24 h), and calcined (450 °C, heating rate 2 °C/min) for 1 h.

3.3. Characterization of Pristine TiO2 and TiO2–MnO2 Nanotubes

The morphology of synthesized pristine TiO2 and TiO2–MnO2 nanotubes was determined by using scanning electron microscopy (SEM, FEI QUANTA 3D FEG, FEI Company, Brno, Czech Republic). Energy-dispersive X-ray spectroscopy (EDX) analysis were performed with a scanning electron microscope (SEM, Zeiss, Leo 1430 VP, Carl Zeiss, Oberkochen, Germany) coupled to an energy-dispersive X-ray fluorescence spectrometer (EDX) Quantax 200 with the XFlash 4010 (Bruker AXS, Karlsruhe, Germany) detector. The crystal structure of the samples was determined from X-ray diffraction patterns recorded in the range of 2θ = 20°–90°, using an X-ray diffractometer (X’Pert Pro, Panalytical, Almelo, The Netherlands) with Cu Kα radiation. The crystallite size was calculated based on the Scherrer formula. Raman spectra were measured with a micro-Raman spectrometer (Senterra, Bruker Optik, Billerica, MA, USA) with a 532 nm excitation laser. The UV-Vis absorbance spectra were registered with the UV-VIS Spectrophotometer, SHIMADZU UV-2600, in the wavelength range of 300–800 nm equipped with an integrating sphere. The baseline was determined with barium sulfate as reference, the scanning speed was 250 nm/min at room temperature. The photoluminescence (PL) spectra were recorded at room temperature with a LS-50B Luminescence Spectrometer equipped with a Xenon discharge lamp, as an excitation source, and a R928 photomultiplier as detector. The excitation radiation (300 nm) was directed on the surface of the samples at an angle of 90°.

3.4. Measurement of Photocatalytic Activity

Photocatalytic activity of the as-prepared NTs was analyzed, for the first time, in the purification of air from toluene which was used as a model pollutant. The photodegradation experiments were carried out in a stainless steel reactor of a volume of ca. 35 cm3. The reactor included a quartz window, two valves and a septum. The light source consisting of an array of 25 LEDs (λmax = 375, 415 and 465 nm, Optel, Opole, Poland) was located above the sample. The anodized foil was placed at the bottom side of the reactor and it was closed with the quartz window. A gas mixture (toluene, 200 ppmv) was passed through the reactor for 1 min, then the valves were closed and the reactor was kept in dark for 30 min in order to achieve the equilibrium. Before starting the irradiation, a reference toluene sample was taken. The concentration was determined by using a gas chromatograph (TRACE 1300, Thermo Scientific, Waltham, MA, USA), equipped with an ionization flame detector (FID) and an Elite-5 capillary column. The samples (200 μL) were dosed with a gas-tight syringe each 10 min. Irradiation intensity was measured by an optical power meter (HAMAMATSU, C9536-01, Hamamatsu, Japan) and reached 14.7, 14.1 and 14.5 mW/cm2 for LEDs with λmax = 375, 415 and 465 nm, respectively.

4. Conclusions

The analysis of the effect of applied potential, manganese content in the alloy and water content in the electrolyte on the morphology and visible-light photocatalytic activity of TiO2–MnO2 NTs obtained from one-step anodic oxidation of Ti–Mn alloys in a fluoride-containing EG-based electrolyte was reported here for the first time. All fabricated samples were described as vertically-oriented, self-organized nanotube arrays with a diameter of 76–115 nm and length of 1–3.4 μm. Diameter and length were directly influenced by the applied voltage while the manganese content led to obtain shorter tubes than those prepared from Ti sheets. The as-prepared TiO2–MnO2 arrays exhibited improved optical and photocatalytic properties in comparison with those of pristine TiO2 NTs. The photoactivity assessment was carried out towards the degradation of toluene (200 ppmv) in gas phase under Vis light irradiation (LEDs, λmax = 465 nm). The highest degradation after 60 min of irradiation corresponded to 43% and the initial reaction rate reached values of 3.79–8.54 × 10⁻² μmol·dm−3·min1. A wavelength dependence exploration was performed as well, MnO2 modified NTs showed the highest activity under visible light irradiation and therefore, a possible mechanism of excitation was presented. These findings suggest that TiO2–MnO2 mixed oxide nanotube arrays, activated by low-powered LEDs, could be a promising material for air purification systems. Moreover, the electrochemical approach is a successful way to obtain these highly-organized nanostructures from Ti–Mn alloys. Consequently, the industrially-oriented application of photocatalysis for air treatment using LEDs, as a low-cost and suitable irradiation source, follows the trends of green chemistry and environmentally friendly performance.

Supplementary Files

Supplementary File 1

Acknowledgments

This research was financially supported by the Polish National Science Center (research grant, Ordered TiO2/MxOy nanostructures obtained by electrochemical method; contract No. NCN 2014/15/B/ST5/00098).

Author Contributions

A.Z.-M. supervised and directed the project; A.Z.-M. and P.M. conceived the concept; M.C.N.-M., P.M., M.P.K., A.M., M.K., J.W., G.T. performed the experiments; M.C.N.-M., P.M., and M.K. analyzed the data; M.C.N.-M., P.M., and M.P.K. contributed reagents/materials/analysis tools; M.N.-M., P.M., P.J.E.-M. and A.Z.-M. wrote the paper.

Conflicts of Interest

The authors declare no conflict of interest.

References

  1. Gaya, U.I.; Abdullah, A.H. Heterogeneous photocatalytic degradation of organic contaminants over titanium dioxide: A review of fundamentals, progress and problems. J. Photochem. Photobiol. C Photochem. Rev. 2008, 9, 1–12. [Google Scholar]
  2. Pichat, P. Photocatalysis and Water Purification: From Fundamentals to Recent Applications; John Wiley & Sons: Hoboken, NJ, USA, 2013. [Google Scholar]
  3. Schneider, J.; Bahnemann, D.; Ye, J.; Puma, G.L.; Dionysiou, D.D. Photocatalysis: Fundamentals and Perspectives; Royal Society of Chemistry: Cambridge, UK, 2016. [Google Scholar]
  4. Dionysiou, D.D.; Puma, G.L.; Ye, J.; Schneider, J.; Bahnemann, D. Photocatalysis: Applications; Royal Society of Chemistry: Cambridge, UK, 2016. [Google Scholar]
  5. Pichat, P. Photocatalysis: Fundamentals, Materials and Potential; MDPI: Basel, Switzerland, 2016. [Google Scholar]
  6. Colmenares Quintero, J.C.; Xu, Y.-J. Heterogeneous Photocatalysis: From Fundamentals to Green Applications; Springer: Berlin/Heidelberg, Germany, 2016; Volume VIII, p. 416. [Google Scholar]
  7. Mazierski, P.; Nadolna, J.; Lisowski, W.; Winiarski, M.J.; Gazda, M.; Nischk, M.; Klimczuk, T.; Zaleska-Medynska, A. Effect of irradiation intensity and initial pollutant concentration on gas phase photocatalytic activity of TiO2 nanotube arrays. Catal. Today 2017, 284, 19–26. [Google Scholar] [CrossRef]
  8. Zavahir, S.; Xiao, Q.; Sarina, S.; Zhao, J.; Bottle, S.; Wellard, M.; Jia, J.; Jing, L.; Huang, Y.; Blinco, J.P.; et al. Selective oxidation of aliphatic alcohols using molecular oxygen at ambient temperature: Mixed-valence vanadium oxide photocatalysts. ACS Catal. 2016, 6, 3580–3588. [Google Scholar] [CrossRef]
  9. Kang, D.; Kim, T.W.; Kubota, S.R.; Cardiel, A.C.; Cha, H.G.; Choi, K.S. Electrochemical synthesis of photoelectrodes and catalysts for use in solar water splitting. Chem. Rev. 2015, 115, 12839–12887. [Google Scholar] [CrossRef] [PubMed]
  10. Highfield, J. Advances and recent trends in heterogeneous photo(electro)-catalysis for solar fuels and chemicals. Molecules 2015, 20, 6739–6793. [Google Scholar] [CrossRef] [PubMed]
  11. Sethi, D.; Jada, N.; Tiwari, A.; Ramasamy, S.; Dash, T.; Pandey, S. Photocatalytic destruction of escherichia coli in water by V2O5/TiO2. J. Photochem. Photobiol. B 2015, 144, 68–74. [Google Scholar] [CrossRef] [PubMed]
  12. Low, J.; Cheng, B.; Yu, J. Surface modification and enhanced photocatalytic CO2 reduction performance of TiO2: A review. Appl. Surf. Sci. 2017, 392, 658–686. [Google Scholar] [CrossRef]
  13. Wang, R.; Hashimoto, K.; Fujishima, A.; Chikuni, M.; Kojima, E.; Kitamura, A.; Shimohigoshi, M.; Watanabe, T. Light-induced amphiphilic surfaces. Nature 1997, 388, 431–432. [Google Scholar] [CrossRef]
  14. Pichat, P. Self-cleaning materials based on solar photocatalysis. In New and Future Developments in Catalysis: Solar Photocatalysis; Suib, S.L., Ed.; Elsevier: Amsterdam, The Netherlands, 2013; Volume 7 “Solar catalysis”, pp. 167–190. [Google Scholar]
  15. Ye, M.; Zheng, D.; Wang, M.; Chen, C.; Liao, W.; Lin, C.; Lin, Z. Hierarchically structured microspheres for high-efficiency rutile TiO2-based dye-sensitized solar cells. ACS Appl. Mater. Interfaces 2014, 6, 2893–2901. [Google Scholar] [CrossRef] [PubMed]
  16. Wang, Z.; Ma, W.; Chen, C.; Zhao, J. Sensitization of titania semiconductor: A promising strategy to utilize visible light. In Photocatalysis and Water Purification; Pichat, P., Ed.; Wiley-VCH: Weinheim, Germany, 2013; pp. 199–240. [Google Scholar]
  17. Zhang, H.; Banfield, J.F. Structural characteristics and mechanical and thermodynamic properties of nanocrystalline TiO2. Chem. Rev. 2014, 114, 9613–9644. [Google Scholar] [CrossRef] [PubMed]
  18. Banerjee, S.; Pillai, S.C.; Falaras, P.; O’Shea, K.E.; Byrne, J.A.; Dionysiou, D.D. New insights into the mechanism of visible light photocatalysis. J. Phys. Chem. Lett. 2014, 5, 2543–2554. [Google Scholar] [CrossRef] [PubMed]
  19. Sato, S.; White, J.M. Photodecomposition of water over Pt/TiO2 catalysts. Chem. Phys. Lett. 1980, 72, 83–86. [Google Scholar] [CrossRef]
  20. Ohtani, B.; Osaki, H.; Nishimoto, S.; Kagiya, T. A novel photocatalytic process of amine N-alkylation by platinized semiconductor particles suspended in alcohols. J. Am. Chem. Soc. 1986, 108, 308–310. [Google Scholar] [CrossRef]
  21. Pichat, P. Surface-properties, activity and selectivity of bifunctional powder photocatalysts. New J. Chem. 1987, 11, 135–140. [Google Scholar]
  22. Choi, W.; Termin, A.; Hoffmann, M.R. The role of metal ion dopants in quantum-sized TiO2: Correlation between photoreactivity and charge carrier recombination dynamics. J. Phys. Chem. 1994, 98, 13669–13679. [Google Scholar] [CrossRef]
  23. Asahi, R.; Morikawa, T.; Ohwaki, T.; Aoki, K.; Taga, Y. Visible-light photocatalysis in nitrogen-doped titanium oxides. Science 2001, 293, 269–271. [Google Scholar] [CrossRef] [PubMed]
  24. Mazierski, P.; Lisowski, W.; Grzyb, T.; Winiarski, M.J.; Klimczuk, T.; Mikołajczyk, A.; Flisikowski, J.; Hirsch, A.; Kołakowska, A.; Puzyn, T.; et al. Enhanced photocatalytic properties of lanthanide-TiO2 nanotubes: An experimental and theoretical study. Appl. Catal. B Environ. 2017, 205, 376–385. [Google Scholar] [CrossRef]
  25. Mazierski, P.; Nischk, M.; Gołkowska, M.; Lisowski, W.; Gazda, M.; Winiarski, M.J.; Klimczuk, T.; Zaleska-Medynska, A. Photocatalytic activity of nitrogen doped TiO2 nanotubes prepared by anodic oxidation: The effect of applied voltage, anodization time and amount of nitrogen dopant. Appl. Catal. B Environ. 2016, 196, 77–88. [Google Scholar] [CrossRef]
  26. Ouyang, J.; Chang, M.; Li, X. CdS-sensitized ZnO nanorod arrays coated with TiO2 layer for visible light photoelectrocatalysis. J. Mater. Sci. 2012, 47, 4187–4193. [Google Scholar] [CrossRef]
  27. Diak, M.; Grabowska, E.; Zaleska, A. Synthesis, characterization and photocatalytic activity of noble metal-modified TiO2 nanosheets with exposed {001} facets. Appl. Surf. Sci. 2015, 347, 275–285. [Google Scholar] [CrossRef]
  28. Nischk, M.; Mazierski, P.; Wei, Z.; Siuzdak, K.; Kouame, N.A.; Kowalska, E.; Remita, H.; Zaleska-Medynska, A. Enhanced photocatalytic, electrochemical and photoelectrochemical properties of TiO2 nanotubes arrays modified with Cu, AgCu and Bi nanoparticles obtained via radiolytic reduction. Appl. Surf. Sci. 2016, 387, 89–102. [Google Scholar] [CrossRef] [PubMed]
  29. Chatterjee, D.; Mahata, A. Demineralization of organic pollutants on the dye modified TiO2 semiconductor particulate system using visible light. Appl. Catal. B Environ. 2001, 33, 119–125. [Google Scholar] [CrossRef]
  30. Paramasivam, I.; Nah, Y.C.; Das, C.; Shrestha, N.K.; Schmuki, P. WO3/TiO2 nanotubes with strongly enhanced photocatalytic activity. Chemistry 2010, 16, 8993–8997. [Google Scholar] [CrossRef] [PubMed]
  31. Zhou, H.; Zhang, Y. Electrochemically self-doped TiO2 nanotube arrays for supercapacitors. J. Phys. Chem. C 2014, 118, 5626–5636. [Google Scholar] [CrossRef]
  32. Ning, X.; Wang, X.; Yu, X.; Li, J.; Zhao, J. Preparation and capacitance properties of Mn-doped TiO2 nanotube arrays by anodisation of Ti–Mn alloy. J. Alloys Compd. 2016, 658, 177–182. [Google Scholar] [CrossRef]
  33. Islam, A.K.M.F.U.; Islam, R.; Khan, K.A. Studies on the thermoelectric effect in semiconducting MnO2 thin films. J. Mater. Sci. Mater. Electron. 2005, 16, 203–207. [Google Scholar] [CrossRef]
  34. Zhao, J.; Nan, J.; Zhao, Z.; Li, N.; Liu, J.; Cui, F. Energy-efficient fabrication of a novel multivalence Mn3O4–MnO2 heterojunction for dye degradation under visible light irradiation. Appl. Catal. B Environ. 2017, 202, 509–517. [Google Scholar] [CrossRef]
  35. Pinaud, B.A.; Chen, Z.; Abram, D.N.; Jaramillo, T.F. Thin films of sodium birnessite-type MnO2: Optical properties, electronic band structure, and solar photoelectrochemistry. J. Phys. Chem. C 2011, 115, 11830–11838. [Google Scholar] [CrossRef]
  36. Chen, Z.; Jaramillo, T.F.; Deutsch, T.G.; Kleiman-Shwarsctein, A.; Forman, A.J.; Gaillard, N.; Garland, R.; Takanabe, K.; Heske, C.; Sunkara, M.; et al. Accelerating materials development for photoelectrochemical hydrogen production: Standards for methods, definitions, and reporting protocols. J. Mater. Res. 2011, 25, 3–16. [Google Scholar] [CrossRef]
  37. Sherman, D.M. Electronic structures of iron(III) and manganese(IV) (hydr)oxide minerals: Thermodynamics of photochemical reductive dissolution in aquatic environments. Geochim. Cosmochim. Acta 2005, 69, 3249–3255. [Google Scholar] [CrossRef]
  38. Sakai, N.; Ebina, Y.; Takada, K.; Sasaki, T. Photocurrent generation from semiconducting manganese oxide nanosheets in response to visible light. J. Phys. Chem. B 2005, 109, 9651–9655. [Google Scholar] [CrossRef] [PubMed]
  39. Xue, M.; Huang, L.; Wang, J.Q.; Wang, Y.; Gao, L.; Zhu, J.H.; Zou, Z.G. The direct synthesis of mesoporous structured MnO2/TiO2 nanocomposite: A novel visible-light active photocatalyst with large pore size. Nanotechnology 2008, 19, 185604. [Google Scholar] [CrossRef] [PubMed]
  40. Roy, P.; Berger, S.; Schmuki, P. TiO2 nanotubes: Synthesis and applications. Angew. Chem. Int. Ed. Engl. 2011, 50, 2904–2939. [Google Scholar] [CrossRef] [PubMed]
  41. Iijima, S. Helical microtubules of graphitic carbon. Nature 1991, 354, 56–58. [Google Scholar] [CrossRef]
  42. Kubacka, A.; Fernandez-Garcia, M.; Colon, G. Advanced nanoarchitectures for solar photocatalytic applications. Chem. Rev. 2012, 112, 1555–1614. [Google Scholar] [CrossRef] [PubMed]
  43. Pichat, P. Are TiO2 nanotubes worth using in photocatalytic purification of air and water? Molecules 2014, 19, 15075–15087. [Google Scholar] [CrossRef] [PubMed]
  44. Lee, K.; Mazare, A.; Schmuki, P. One-dimensional titanium dioxide nanomaterials: Nanotubes. Chem. Rev. 2014, 114, 9385–9454. [Google Scholar] [CrossRef] [PubMed]
  45. Mohapatra, S.K.; Raja, K.S.; Misra, M.; Mahajan, V.K.; Ahmadian, M. Synthesis of self-organized mixed oxide nanotubes by sonoelectrochemical anodization of Ti–8Mn alloy. Electrochim. Acta 2007, 53, 590–597. [Google Scholar] [CrossRef]
  46. Macak, J.M.; Hildebrand, H.; Marten-Jahns, U.; Schmuki, P. Mechanistic aspects and growth of large diameter self-organized TiO2 nanotubes. J. Electroanal. Chem. 2008, 621, 254–266. [Google Scholar] [CrossRef]
  47. Macak, J.M.; Tsuchiya, H.; Ghicov, A.; Yasuda, K.; Hahn, R.; Bauer, S.; Schmuki, P. TiO2 nanotubes: Self-organized electrochemical formation, properties and applications. Curr. Opin. Solid State Mater. Sci. 2007, 11, 3–18. [Google Scholar] [CrossRef]
  48. Helmholz, L.; Russo, M.E. Spectra of manganese(IV) hexafluoride ion (MnF6=) in environments of Oh and D3d symmetry. J. Chem. Phys. 1973, 59, 5455–5470. [Google Scholar] [CrossRef]
  49. Pourbaix, M. Atlas of Electrochemical Equilibria in Aqueous Solutions; Pergamon Press: New York, NY, USA, 1966. [Google Scholar]
  50. Devaraj, S.; Munichandraiah, N. Effect of crystallographic structure of MnO2 on its electrochemical capacitance properties. J. Phys. Chem. C 2008, 112, 4406–4417. [Google Scholar] [CrossRef]
  51. Li, J.; Chen, J.; Ke, R.; Luo, C.; Hao, J. Effects of precursors on the surface Mn species and the activities for NO reduction over MnOx/TiO2 catalysts. Catal. Commun. 2007, 8, 1896–1900. [Google Scholar] [CrossRef]
  52. Liao, J.-Y.; Higgins, D.; Lui, G.; Chabot, V.; Xiao, X.; Chen, Z. Multifunctional TiO2–C/MnO2 core–double-shell nanowire arrays as high-performance 3D electrodes for lithium ion batteries. Nano Lett. 2013, 13, 5467–5473. [Google Scholar] [CrossRef] [PubMed]
  53. Borbón-Nuñez, H.A.; Dominguez, D.; Muñoz-Muñoz, F.; Lopez, J.; Romo-Herrera, J.; Soto, G.; Tiznado, H. Fabrication of hollow TiO2 nanotubes through atomic layer deposition and MWCNT templates. Powder Technol. 2017, 308, 249–257. [Google Scholar] [CrossRef]
  54. Jana, S.; Basu, S.; Pande, S.; Ghosh, S.K.; Pal, T. Shape-selective synthesis, magnetic properties, and catalytic activity of single crystalline β-MnO2 nanoparticles. J. Phys. Chem. C 2007, 111, 16272–16277. [Google Scholar] [CrossRef]
  55. Wei, M.; Konishi, Y.; Zhou, H.; Sugihara, H.; Arakawa, H. Synthesis of single-crystal manganese dioxide nanowires by a soft chemical process. Nanotechnology 2005, 16, 245–249. [Google Scholar] [CrossRef] [PubMed]
  56. Jana, S.; Pande, S.; Sinha, A.K.; Sarkar, S.; Pradhan, M.; Basu, M.; Saha, S.; Pal, T. A green chemistry approach for the synthesis of flower-like Ag-doped MnO2 nanostructures probed by surface-enhanced raman spectroscopy. J. Phys. Chem. C 2009, 113, 1386–1392. [Google Scholar] [CrossRef]
  57. Luo, J.; Zhu, H.T.; Fan, H.M.; Liang, J.K.; Shi, H.L.; Rao, G.H.; Li, J.B.; Du, Z.M.; Shen, Z.X. Synthesis of single-crystal tetragonal α-MnO2 nanotubes. J. Phys. Chem. C 2008, 112, 12594–12598. [Google Scholar] [CrossRef]
  58. Xu, X.; Zhou, X.; Li, X.; Yang, F.; Jin, B.; Xu, T.; Li, G.; Li, M. Electrodeposition synthesis of MnO2/TiO2 nanotube arrays nanocomposites and their visible light photocatalytic activity. Mater. Res. Bull. 2014, 59, 32–36. [Google Scholar] [CrossRef]
  59. Ding, S.; Liyong, W.; Shaoyan, Z.; Qiuxiang, Z.; Yu, D.; Shujuan, L.; Yanchao, L.; Quanying, K. Hydrothermal synthesis, structure and photocatalytic property of nano-TiO2–MnO2. Sci. China Ser. B 2003, 46, 542. [Google Scholar] [CrossRef]
  60. Tang, H.; Berger, H.; Schmid, P.E.; Lévy, F. Optical properties of anatase (TiO2). Solid State Commun. 1994, 92, 267–271. [Google Scholar] [CrossRef]
  61. Knorr, F.J.; Mercado, C.C.; McHale, J.L. Trap-state distributions and carrier transport in pure and mixed-phase TiO2: Influence of contacting solvent and interphasial electron transfer. J. Phys. Chem. C 2008, 112, 12786–12794. [Google Scholar] [CrossRef]
Sample Availability: Samples of the compounds are available from the authors.
Figure 1. Top-view and cross-sectional SEM images of pristine TiO2 and TiO2–MnO2 NTs (the effect of applied voltage, manganese content in the Mn/Ti alloy, and water content in the electrolyte on the morphology of formed nanotubes) and EDX mapping of the Ti90Mn10_30V sample.
Molecules 22 00564 g001
Figure 2. Proposed growth mechanism of TiO2–MnO2 NTs.
Molecules 22 00564 g002
Figure 3. XRD spectra of pristine TiO2 and TiO2–MnO2 NTs. Effect of (a) anodization potential; (b) manganese content in the alloy; and (c) water content in the electrolyte.
Molecules 22 00564 g003
Figure 4. Raman spectra of pristine TiO2 and TiO2–MnO2 NTs. Effect of (a) anodization potential; (b) manganese content in the alloy; and (c) water content in the electrolyte.
Molecules 22 00564 g004
Figure 5. UV-Vis spectra of pristine TiO2 and TiO2–MnO2 NTs. Effect of (a) anodization potential; (b) manganese content in the alloy; and (c) water content in the electrolyte.
Molecules 22 00564 g005
Figure 6. Photoluminescence spectra of pristine TiO2 and TiO2–MnO2 NTs. Effect of (a) anodization potential; (b) manganese content in the alloy; and (c) water content in the electrolyte.
Molecules 22 00564 g006
Figure 7. Photoactivity of pristine TiO2 and TiO2–MnO2 NTs in gas phase degradation of toluene under Vis light irradiation (λmax = 465 nm). Effect of (a) applied voltage; (b) manganese content in the alloy, and (c) water content in the electrolyte.
Molecules 22 00564 g007
Figure 8. (a) Photoactivity of Ti90Mn10_30V sample in gas phase degradation of toluene under different wavelengths of irradiation (λmax = 375, 415, 465 nm) and (b) possible excitation mechanism of TiO2–MnO2 NTs under Vis light irradiation.
Molecules 22 00564 g008
Table 1. Sample labels, preparation conditions, and selected properties of pristine TiO2 and TiO2–MnO2 nanotubes.
Sample LabelPreparation ParametersExternal Diameter (nm)Tube Length (μm)Wall Thickness (nm)Average Crystallite Size (nm)EDX Analysis
Electrolyte, Applied VoltageTi (wt. %)Mn (wt. %)C (wt. %)O (wt. %)
Ti_30VEG 98% (v/v), H2O 2% (v/v), NH4F 0.09 M, 30 V81 ± 91.5 ± 0.110 ± 23371.4700.1928.34
Ti_40VEG 98% (v/v), H2O 2% (v/v), NH4F 0.09 M, 40 V100 ± 75 ± 0.413 ± 23466.7300.0333.24
Ti_50VEG 98% (v/v), H2O 2% (v/v), NH4F 0.09 M, 50 V120 ± 1216.2 ± 0.218 ± 33867.6900.0332.28
Ti90Mn10_30VEG 98% (v/v), H2O 2% (v/v), NH4F 0.09 M, 30 V76 ± 91 ± 0.18 ± 33176.158.910.0114.83
Ti90Mn10_40VEG 98% (v/v), H2O 2% (v/v), NH4F 0.09 M, 40 V92 ± 81.5 ± 0.19 ± 33282.737.770.019.51
Ti90Mn10_50VEG 98% (v/v), H2O 2% (v/v), NH4F 0.09 M, 50 V118 ± 42.8 ± 0.19 ± 23468.796.460.0324.72
Ti85Mn15_40V_2%EG 98% (v/v), H2O 2% (v/v), NH4F 0.09 M, 40 V94 ± 111.3 ± 0.19 ± 23177.2011.140.0111.67
Ti85Mn15_40V_5%EG 95% (v/v), H2O 5% (v/v), NH4F 0.09 M, 40 V90 ± 71.3 ± 0.19 ± 23579.9412.400.017.66
Ti85Mn15_40V_10%EG 90% (v/v), H2O 10% (v/v), NH4F 0.09 M, 40 V115 ± 81.1 ± 0.111 ± 23461.769.111.1827.95
Ti95Mn5_40VEG 98% (v/v), H2O 2% (v/v), NH4F 0.09 M, 40 V94 ± 83.4 ± 0.39 ± 13270.892.100.0327.00
Table 2. Initial reaction rate and reaction rate constant for the gas phase degradation of toluene (200 ppmv) under Vis light irradiation (25-LED array, λmax = 465 nm, irradiation intensity = 14.5 mW·cm−2) in the presence of pristine TiO2 and TiO2–MnO2 NTs.
Sample LabelPhotocatalytic Toluene Degradation
Initial Reaction Rate × 102 (μmol·dm−3·min−1)Reaction Rate Constant × 103 (min−1)
Ti_30V0.37 ± 0.090.42 ± 0.10
Ti_40V0.43 ± 0.090.49 ± 0.10
Ti_50V0.64 ± 0.040.72 ± 0.04
Ti90Mn10_30V8.54 ± 0.539.57 ± 0.59
Ti90Mn10_40V4.97 ± 0.305.57 ± 0.33
Ti90Mn10_50V6.04 ± 0.086.77 ± 0.09
Ti85Mn15_40V_2%4.18 ± 0.774.69 ± 0.87
Ti85Mn15_40V_5%3.79 ± 0.434.24 ± 0.48
Ti85Mn15_40V_10%5.84 ± 1.616.54 ± 1.81
Ti95Mn5_40V5.76 ± 0.126.45 ± 0.14

