Article

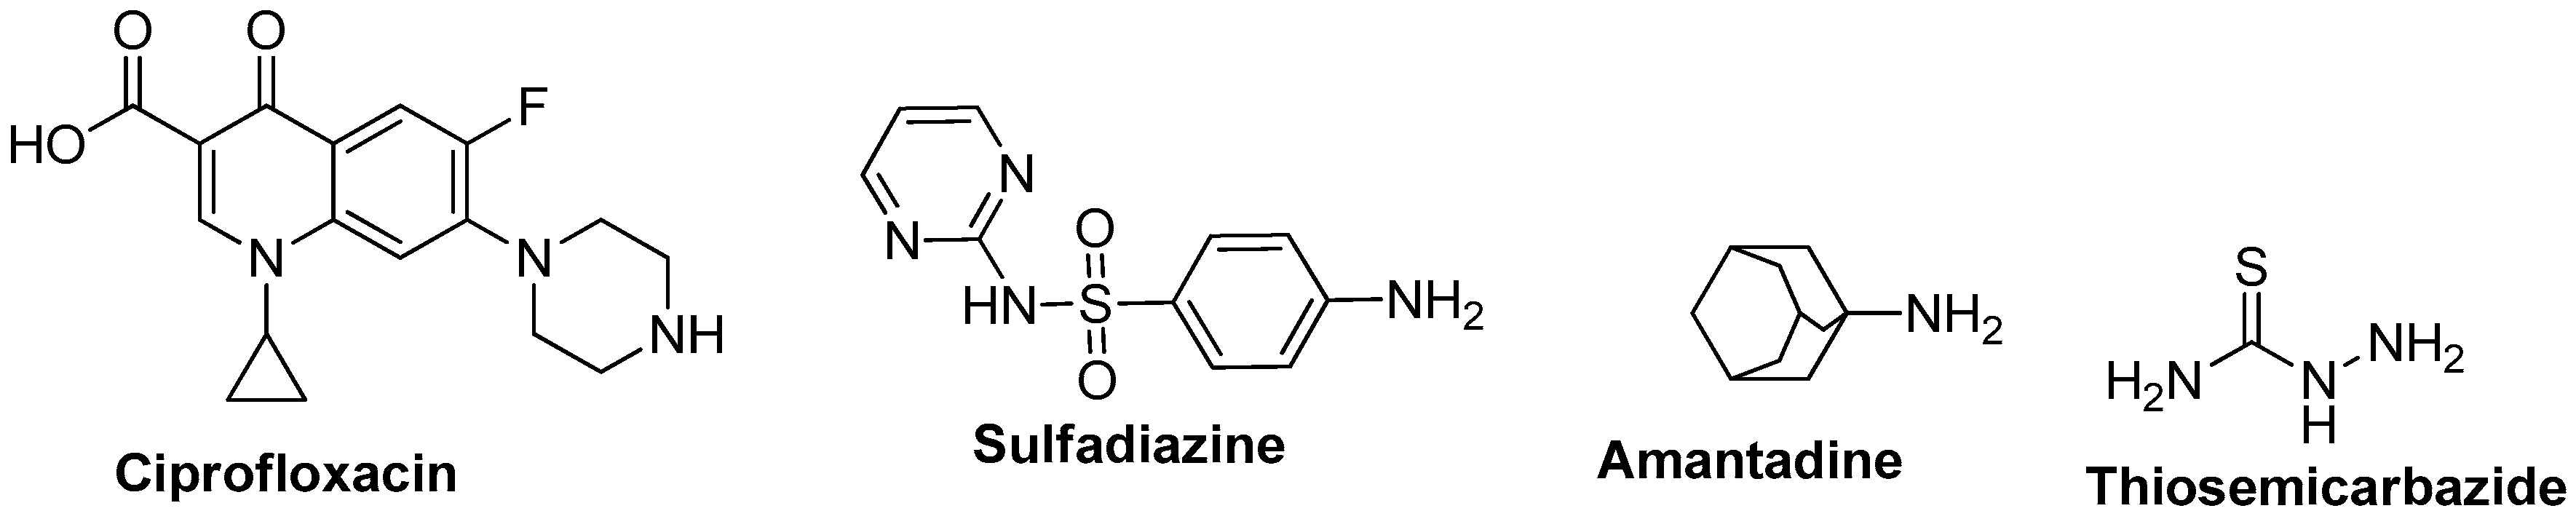
Sulfonamide-Linked Ciprofloxacin, Sulfadiazine and Amantadine Derivatives as a Novel Class of Inhibitors of Jack Bean Urease; Synthesis, Kinetic Mechanism and Molecular Docking

1
Department of Chemistry, Quaid-I-Azam University, Islamabad 45320, Pakistan
2
Department of Organic Chemistry, University of Barcelona, 08028 Barcelona, Spain
3
CIBER-BBN, Networking Centre on Bioengineering, Biomaterials and Nanomedicine, Barcelona Science Park, University of Barcelona, 08028 Barcelona, Spain
4
Department of Biological Sciences, College of Natural Sciences, Kongju National University, 56 Gongjudehak-Ro, Gongju, Chungnam 314-701, Korea
5
Department of Physiology, University of Sindh, Jamshoro 76080, Pakistan
*
Authors to whom correspondence should be addressed.
Molecules 2017, 22(8), 1352; https://doi.org/10.3390/molecules22081352
Submission received: 5 July 2017 / Accepted: 9 August 2017 / Published: 16 August 2017
(This article belongs to the Special Issue Sulfonamides)

Abstract

:
Sulfonamide derivatives serve as an important building blocks in the drug design discovery and development (4D) process. Ciprofloxacin-, sulfadiazine- and amantadine-based sulfonamides were synthesized as potent inhibitors of jack bean urease and free radical scavengers. Molecular diversity was explored and electronic factors were also examined. All 24 synthesized compounds exhibited excellent potential against urease enzyme. Compound 3e (IC50 = 0.081 ± 0.003 µM), 6a (IC50 = 0.0022 ± 0.0002 µM), 9e (IC50 = 0.0250 ± 0.0007 µM) and 12d (IC50 = 0.0266 ± 0.0021 µM) were found to be the lead compounds compared to standard (thiourea, IC50 = 17.814 ± 0.096 µM). Molecular docking studies were performed to delineate the binding affinity of the molecules and a kinetic mechanism of enzyme inhibition was propounded. Compounds 3e, 6a and 12d exhibited a mixed type of inhibition, while derivative 9e revealed a non-competitive mode of inhibition. Compounds 12a, 12b, 12d, 12e and 12f showed excellent radical scavenging potency in comparison to the reference drug vitamin C.

1. Introduction

Ureases (EC 3.5.1.5; urea amidohydrolase) belong to a super group of amidohydrolases and phosphotriestreases, heteropolymeric enzymes with the dynamic site containing two nickel (II) atoms, found in extensive amounts in nature among plants, microbes, organisms, green growth and spineless creatures [1,2,3]. Urease-delivering microscopic organisms have harmful effects on human health. Thus, in human beings the ureas of Helicobacter pylori cause afflictions of the gastrointestinal and urinary tract, for example, stomach disease and peptic ulcers [4,5].
Ciurli et al. proposed a productive and workable enzymatic mechanism [6,7]. The dynamic focus of urease is relied on trapping three water molecules and a hydroxide ion connects between two nickel atoms [8]. Urea possesses two binding sites and is capable of forming hydrogen bonding linkages. The loosely bound urea molecule collapses in a tetrahedral fashion with the release of the carbamate group which eventually cleaves into an ammonia molecule [9]. The release of excess ammonia furnishes the suitable conditions for the survival of H. pylori in the stomach [10]. H. pylori causes several stomach-related disorders such as urolithiasis, pyelonephritis, hepatic encephalopathy, hepatic unconsciousness and urinary catheter encrustation [11]. The therapeutic treatment of Helicobacter pylori has been summarized in a review by Boer et al. [12]. Ureases have a long storied history and research on the toxicity and multifunctionality of ureases is work in progress. Carlini et al. have comprehensively reviewed the mechanism and function of ureases [13]. Urease inhibitors play a pivotal part in the inhibition of the harmful effects of urease enzyme and substantially improve human health [14]. Moreover, urease inhibitors assist in the design of drugs against stomach ulcer disorders [15,16]. Urease has assorted capacities and its inhibition has received exceptional consideration in the course of recent years and numerous urease inhibitors have been described. Among these are hydroxamic corrosive subordinates [17], hydroxyurea [18], hydroxamic acids [19], phosphorodiamidates, imidazoles, for example, rabeprazole, lansoprazole, omeprazole, quinines, thiol derivatives, and phenols, Schiff base and thiourea derivatives [20]. Sulfonamides constitute an important class of organic compounds that possess a broad spectrum of biological activities such as antibacterial, high-ceiling diuretic, hypoglycemic, antithyroid, anti-inflammatory and antiglaucoma effects [21,22,23,24,25,26,27]. Noreen et al. recently reported thiophene-tagged sulfonamides as µg/mL concentration urease inhibitors. Mojzych et al. published pyrazoletriazine- based sulfonamides as dual potent inhibitors of urease and tyrosinase and their synthesized derivatives showed better potential than standard thiourea, with IC50 values in the micromolar range [28,29,30].
Sulfonamides can easily be synthesized by the reaction of sulfonyl chlorides with amines in a basic medium. However, a number of different methods for the synthesis of sulfonamides have been described in the literature. The straightforward synthetic routes and extended applications in the pharmaceutical and biological field provide incentive to explore and design the role of commercial drugs based sulfonamides as urease inhibitors.
Herein, the exploration of novel sulfonamides based drug derivatives, as significant inhibitors of jack bean urease, are described. We thus extended the range of commercial drugs like ciprofloxacin, sulfadiazine, amantadine and thiosemicarbazide (Figure 1).
The potential of commercial drugs as inhibitors of urease has not been explored in enzymology. All three drugs mentioned in Figure 1 are different from one another. However, these drugs contains intriguing structural features which can show strong binding affinity with the target protein. These drugs share a common nucleophilic behavior owing to the presence of electron rich nitrogen atoms. Prior to the current research account, the scope of these drugs has not been extended to urease inhibition. It was hypothesized that variation or structural modification in these commercial drugs could lead to the development of efficient and side effect-free potent inhibitors of urease. In order to test this hypothesis we envisioned uncovering the potential of some marketed drugs. Moreover, the synthetic molecule thiosemicarbazide was also examined to evaluate the role of small organic molecules as inhibitors of urease. Commercial drugs used in this research work are endowed with complex structural groups which could lead to strong binding in the active site of the target protein.
The sulfonamide derivatives have been considered as suitable candidates for the carbonic anhydrase inhibition assay. We took a step further to explore the role as urease inhibitors of sulfonamides, a privileged class of organic compounds.

2. Results

The synthetic routes to compounds 3a3f/6a6f/9a9f/12a12f are shown in Scheme 1. The new series of sulfonamide-based drugs and thiosemicarbazide-based sulfonamides were synthesized in a single step using sulfonyl chloride as an electrophilic reagent. The amine group-bearing versatile drugs ciprofloxacin, amantadine, sulfadiazine and thiosemicarbazide were reacted with suitably substituted sulfonyl chlorides to construct sulfonamide linkages. For sulfadiazine where the amine function is less reactive, reflux conditions in pyridine were required. For the rest, just room temperature. In all cases, the reaction proceeded smoothly with excellent yields (>70%).

2.1. Jack Bean Urease Inhibition Assay and Structure Activity Relationship (SAR)

Novel sulfonamide based drug-derivatives were screened in a jack bean urease enzyme inhibition assay. The structural resemblance of the synthesized derivatives with urease enzyme resulted in promising activity. Thiourea was taken as reference drug (Table 1). The synthesized derivatives showed different patterns of chemical reactivity, depending upon the nature of the groups attached with the phenyl ring. The urease inhibition results revealed that these compounds display significant inhibition at low dosis. Among the tested drug derivatives, the ciprofloxacin derivative 3e, sulfadiazine derivative 6a, amantadine derivative 9e and thiosemicarbazide derivative 12d were found to be the best, with IC50 values of 0.0453 ± 0.0016, 0.00223 ± 0.00021, 0.0250 ± 0.00073 and 0.0266 ± 0.0021 µM, respectively. The drug structure played a pivotal part in the urease enzyme inhibition assay. Generally, ciprofloxacin-tagged sulfonamides showed better potency compared to sulfadiazine and amantadine derivatives.
The nature of the group associated with the phenyl ring greatly influenced the biological activity results. Compound 3e which bears two methyl substituents at the meta position is more potent compared to 3a where they are located at the para position. Halogens differ in inhibition results, possibly due to inductive effects, and interestingly a chlorine atom linked at the phenyl ring ortho position exhibited better activity. Electron releasing groups showed moderate activity.

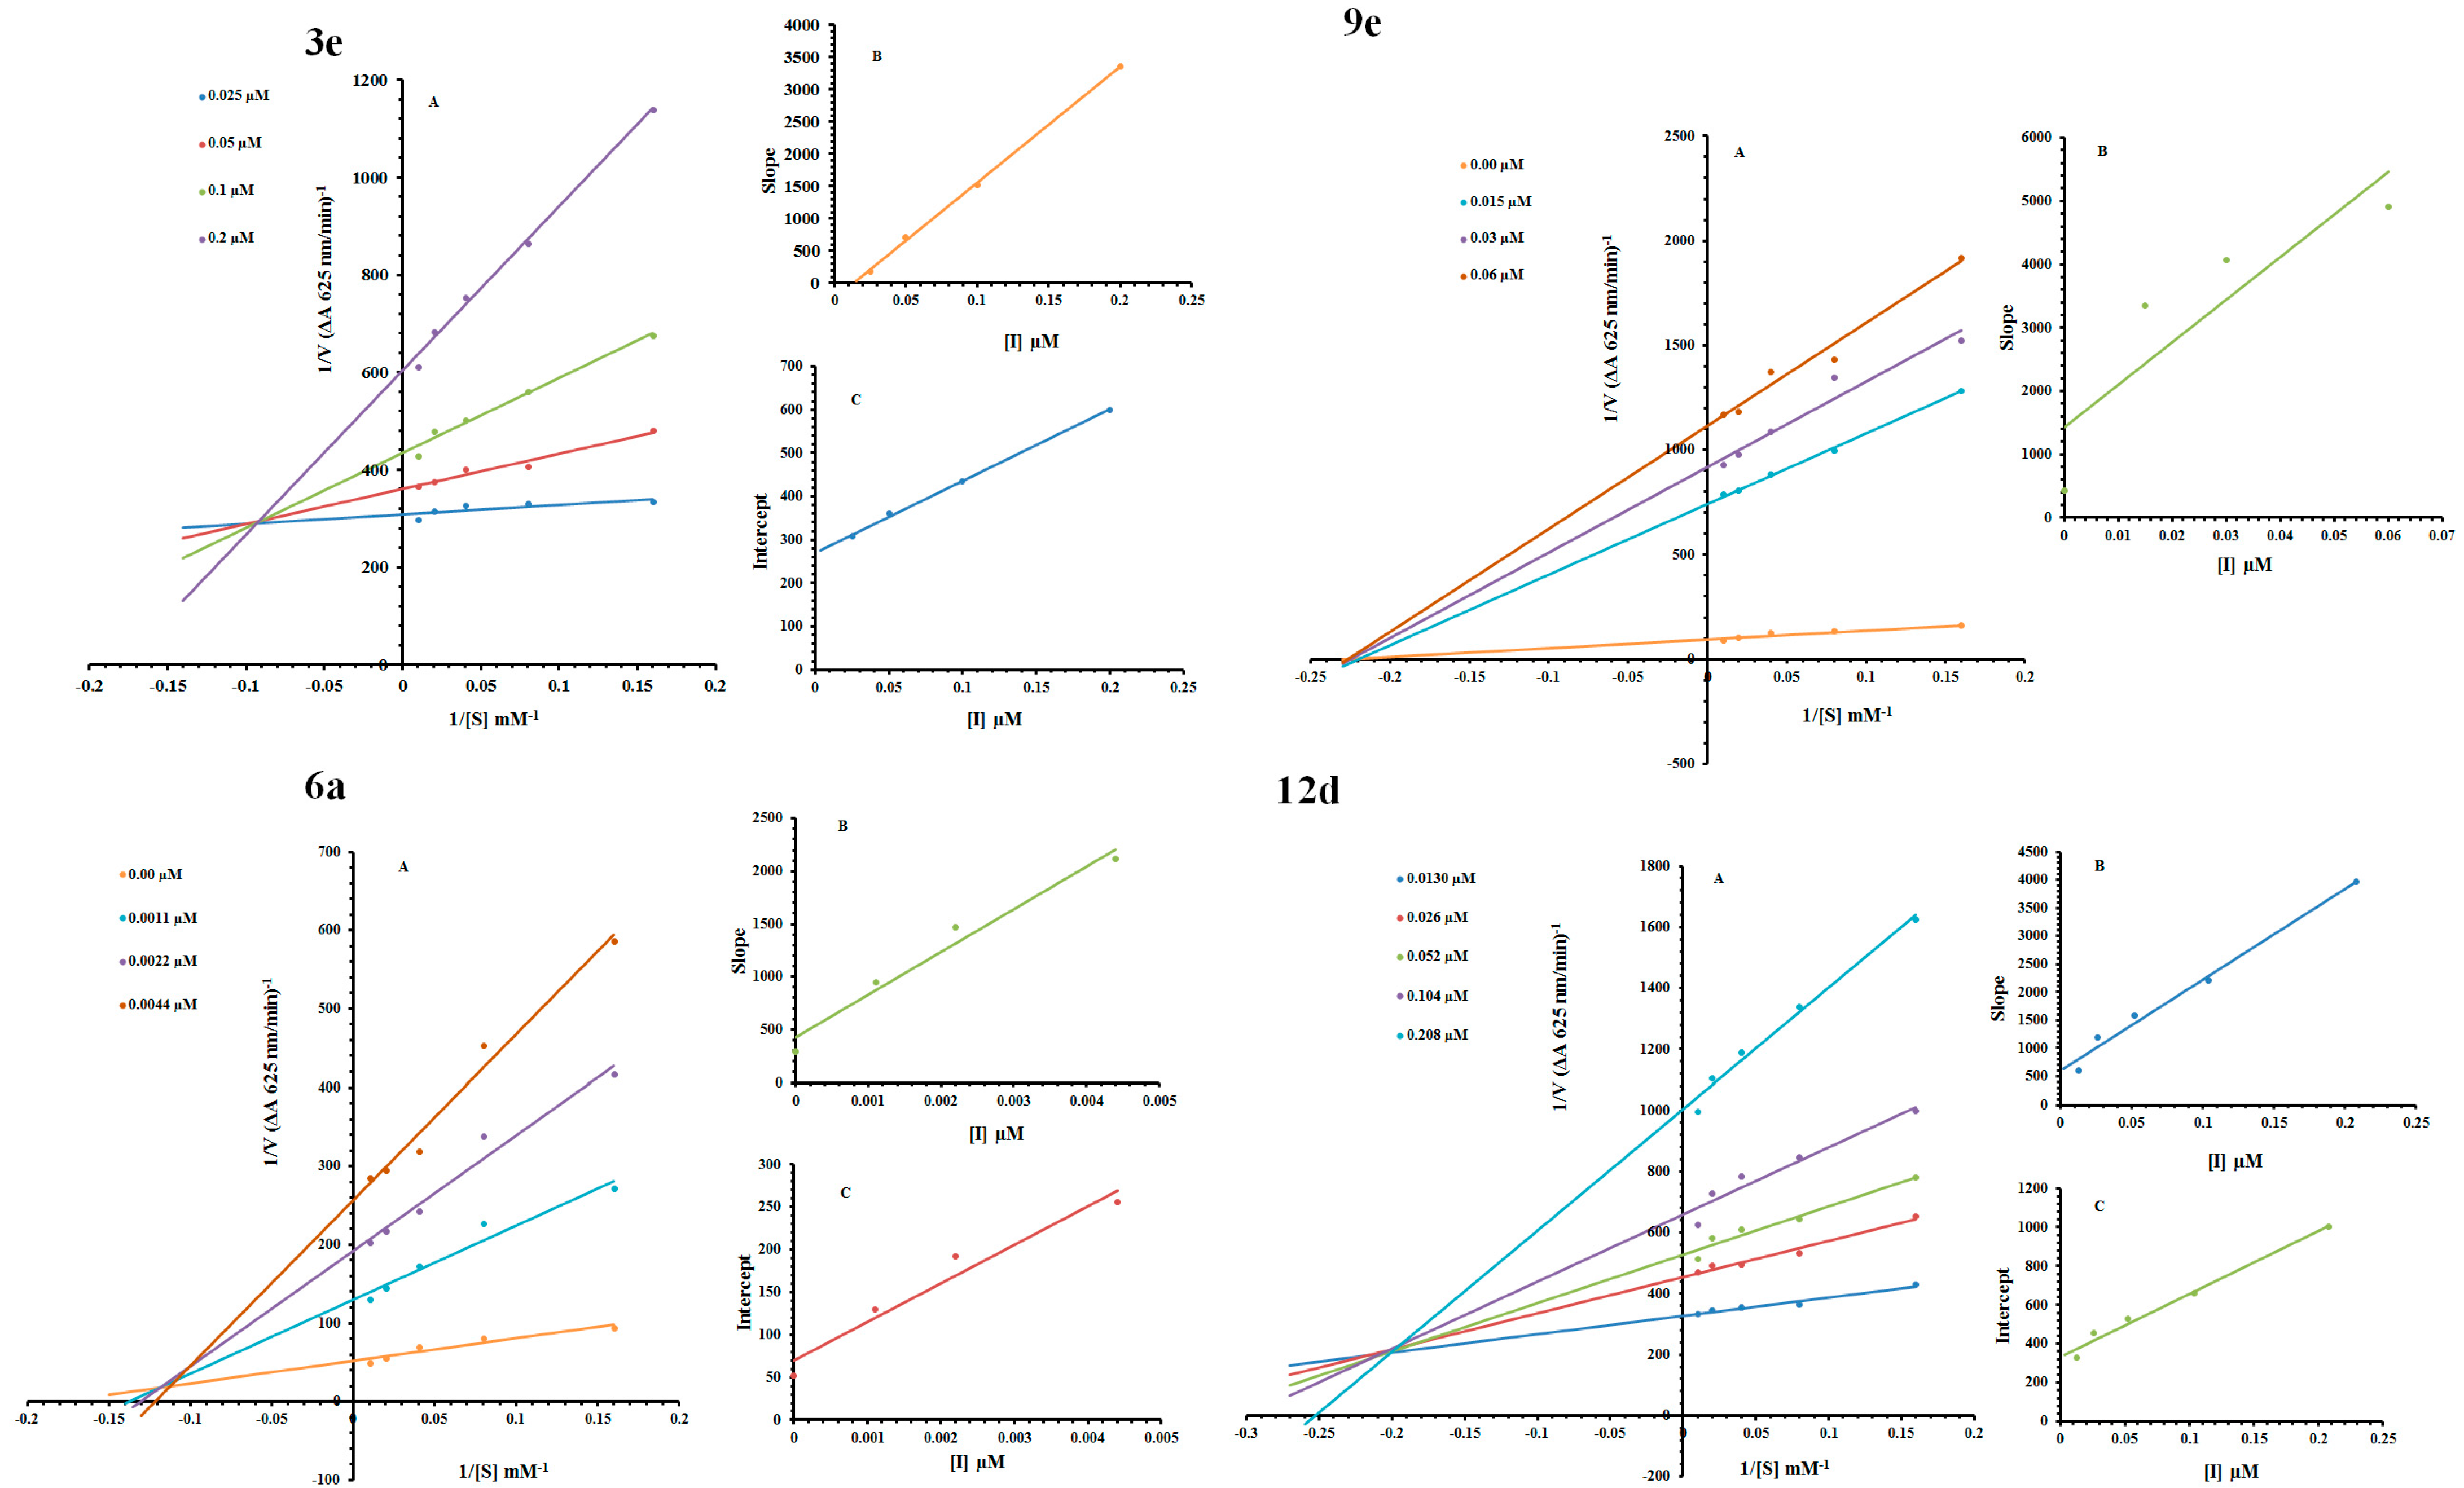
2.2. Kinetic Mechanism

Presently four compounds 3e, 6a, 9e and 12d (the most potent from each group) were studied for their mode of inhibition against urease. The capability of these inhibitors to restrain the enzyme-substrate complex and free enzyme was resolved as far as enzyme inhibitor (EI) and enzyme substrate complex (ESI) constants individually. The active investigations of the catalyst by the double reciprocal plot of 1/Velocity versus 1/[Substrate] within the sight of various inhibitors doses gave a progression of straight lines as they appear in Figure 2. The outcomes of inhibitor 9e provide a sequence of conventional positions, all of which crossed at the identical point on the x-axis Figure 2, (A). The analysis showed that Vmax decreased to another dose while that of Km continues as before accordingly to the increment in the doses of compound 9e. This conduct showed that compound 9e represses urease non-competitively to frame enzyme inhibitor (EI) complex. An optional plot of slope against centralization of 9e indicated a consistent EI separation (Ki) Figure 2, (B). The results of Figure 2, (A) showed that compounds 3e, 6a and 12d intersected within the second quadrant. The analysis showed that Vmax decreased with increasing Km in the presence of increasing concentrations of compounds 3e, 6a and 12d, respectively. This mode of action of inhibitors 3e, 6a and 12d pointed out that they stops the enzyme by a dual method: first competitively by forming a urease inhibitor complex and second by interfering with the urease-substrate (urea)-compound composite, known as noncompetitive mode. The second graph between inhibitor 3e, 6a and 12d versus slope displayed enzyme inhibitor dissociation constant constants Ki Figure 2, (B). Whereas enzyme substrate inhibitor dissociation constants Ki′ were presented by another graph plotting doses of inhibitors 3e, 6a and 12d versus intercept Figure 2, (C). A lesser value of Ki than Ki′ indicated the solid attachment of enzyme and inhibitors 3e, 6a and 12d that indicates more competitive than noncompetitive behavior (Table 2). The kinetic constant and inhibition constant data are listed in Table 2.

3. Discussion

Drug discovery is an intriguing process, which cannot be attempted/faced using just a single strategy. Several groups and important pharmaceutical industries have focused their efforts in the “repurposing” strategy which is basically based on discovering new uses for known drugs [31]. In our current medicinal chemistry programs, we have gone a step further. Thus, we propose the manipulation of known drugs. As proof of concept, we have chosen the sulfonamidation reaction, because sulfonamides are present in many known drugs [32]. As drugs, we have chosen three which contain free amino functions—ciprofloxacin, sulfadiazine and amantadine—and thiosemicarbazide, which although simple, is a motif also present in several drugs [33,34].

3.1. Structural Evaluation of the Target Protein

Jack bean urease consists of four domains (A, B, C and D) having different amino acid lengths. Two nickel atoms are also present in the active binding region of the targeted protein. The overall Volume Area Dihedral Angle Reporter (VADAR) analysis showed that the urease architecture contains with 27% helices, 31% β sheets and 41% coils. The predicted Ramachandran plots indicated that 97.5% of residues were present in favored regions which shows the precision and accuracy of phi (φ) and psi (ψ) angles among the coordinates of jack bean urease. The Ramachandran and hydrophobicity graphs are presented in the Supplementary Data (Figures S1 and S2).

3.2. Biochemical Properties and Rule of Five (RO5) Validation of Synthesized Compounds

The basic biochemical properties of all compounds 3af, 6af, 9af and 12af were predicted using computational tools. Table 3 showed the predicted properties like molecular weight (g/mol), molar refractivity (cm3), density (g/cm3), polarizability (cm3) and polar surface area (PSA) (Å2) values of all ligands. The molar refractivity and molecular lipophilicity properties of drug molecules are significant in receptor binding, bioavailability and cellular uptake. It has been shown that PSA is very helpful parameter for drug absorption prediction in drug discovery [35]. The literature study reported the standard values for molar refractivity and molecular weight (40 to 130 cm3) and (160 to 480 g/mol), respectively [36,37]. The comparative analyses revealed that the predicted values of all the synthesized compounds were comparable with standard values.
Moreover, irrespective of their higher molecular weight (g/mol) and molar refractivity (cm3) values, they showed very good drug-likeness scores. Any single non-ring bond, bonded to a nonterminal heavy (i.e., non-hydrogen) atom is called rotatable bond. The calculated number of rotatable bonds showed molecular flexibility. It has been observed that rotatable bond number is very good descriptor for oral bioavailability drugs [37].
Furthermore, all the compounds were validated by Lipinski’s rules. It has been observed that orally active drugs typically contain no more than 10 hydrogen bond acceptors (HBA) and five hydrogen bond donors (HBD). Moreover, the logP and molecular mass value should be less than 5 and 500 g/mol, respectively. It has been shown that the compounds with HBA and HBD results exceeding these values display poor permeation [38]. Hydrogen-bonding capacity is considered a significant parameter for drug permeability. Our results indicated that the all synthesized compounds possess <10 HBA, <5 HBD and <5 logp values which were comparable with standard values. However, only few compounds possess a molecular weight value >500 g/mol which does not follow the RO5. The reported study showed that molecules with poor absorption are more likely to be observed upon Lipinski violation. However, multiple examples of RO5 violations are known amongst existing drugs [39,40].

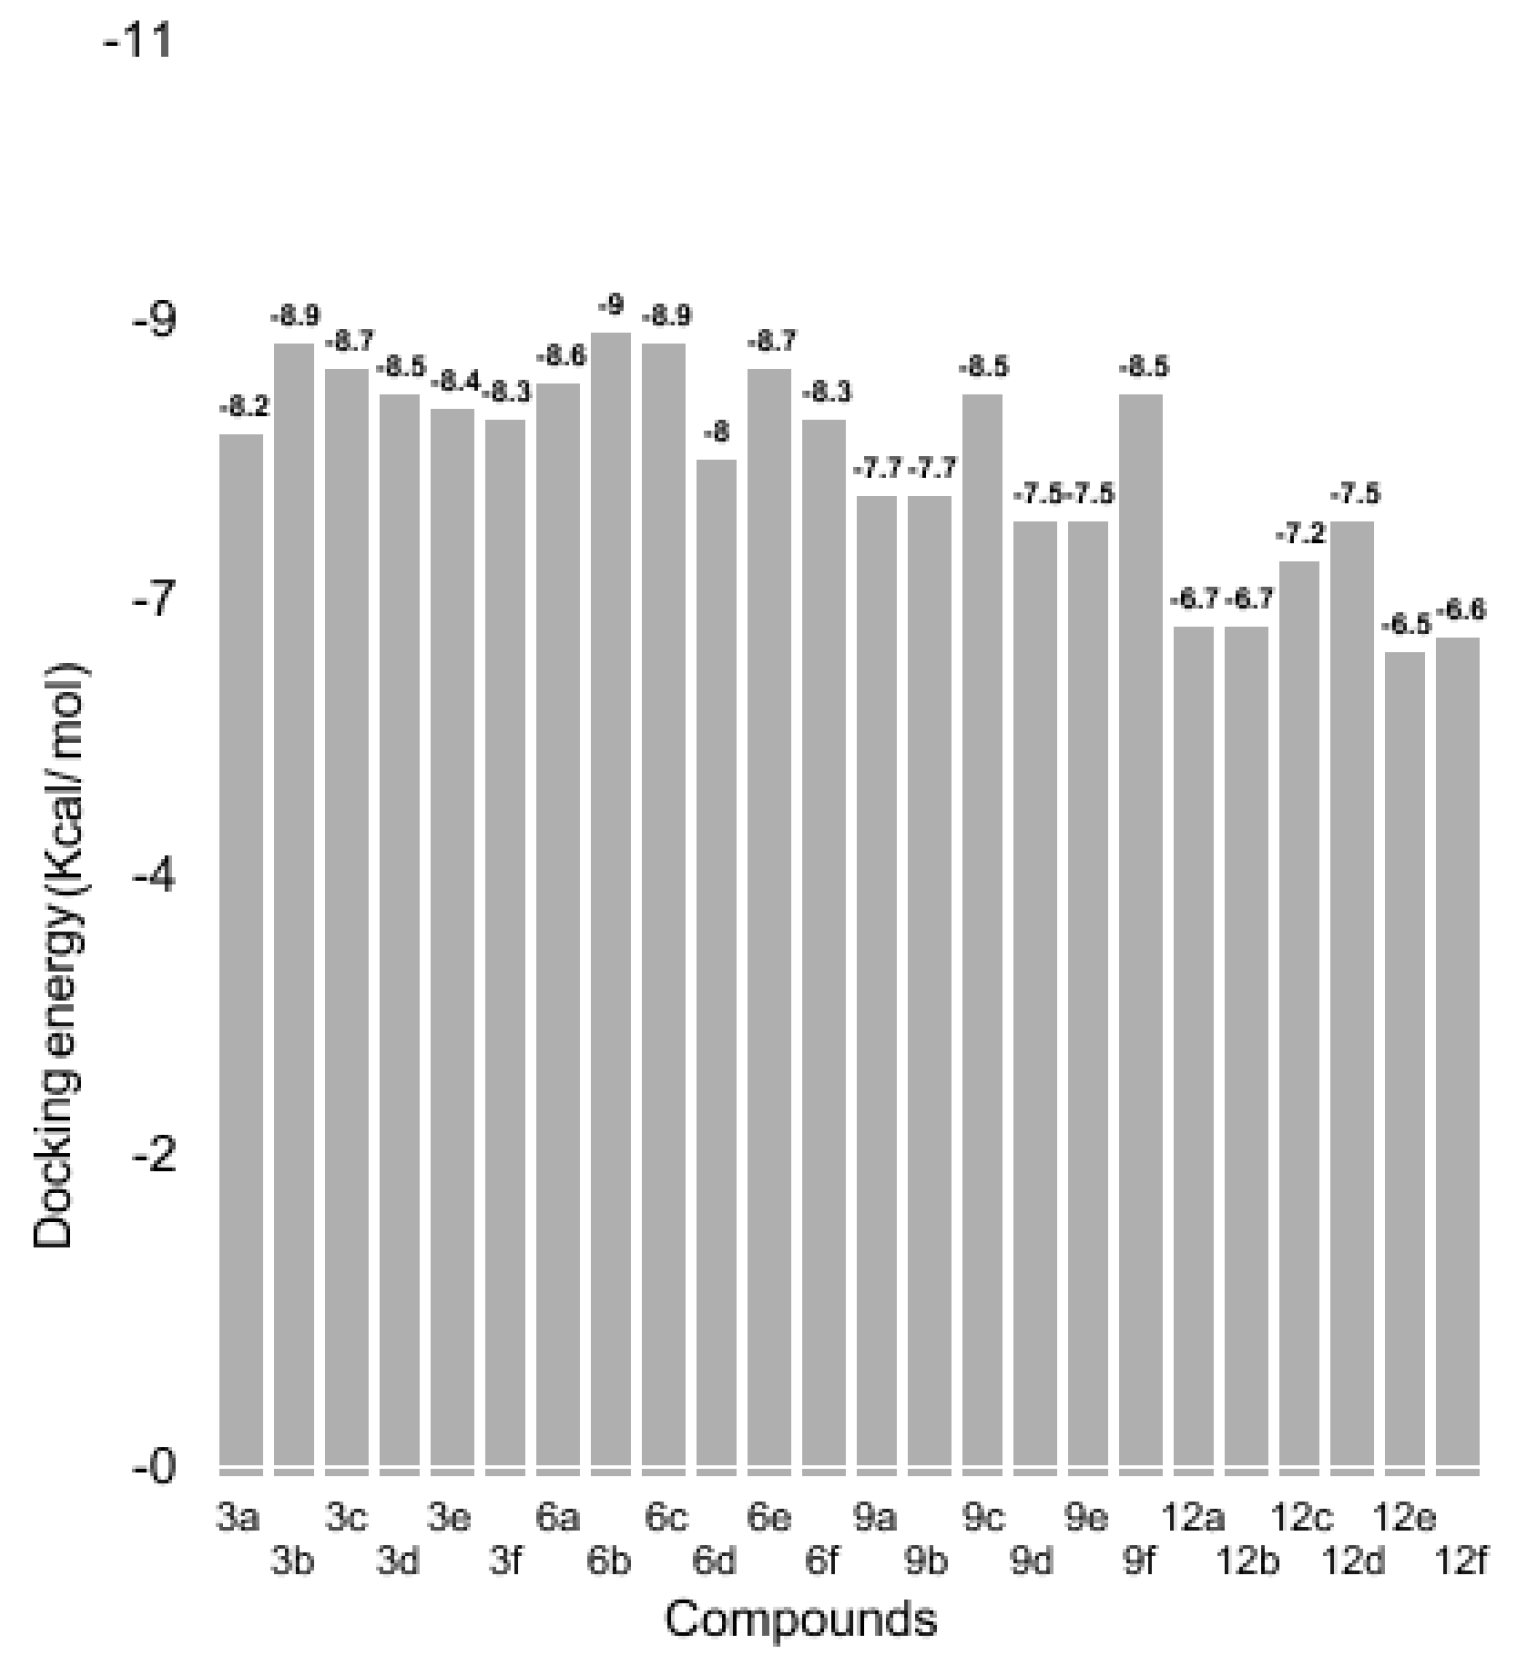
3.3. Binding Energy Evaluation of Synthesized Compounds

To predict the best fitted conformational position of the synthesized compounds 3af, 6af, 6af and 12af against the targeted protein, their generated docked complexes were analyzed on the basis of minimum energy values (Kcal/mol) and bonding interaction patterns (hydrogen/hydrophobic). Among the four different ligand structures, the docking results justified the fact that compounds 3af and 6af were the most active with better binding energy values as compared to 9af and 12af. The comparative analysis showed that 6b has the highest energy value (9.0 Kcal/mol) complex. Compound 6a also has a good binding energy affinity (8.6 Kcal/mol). The docking results showed that compounds 6af have more binding potential against the target protein. Similarly, some other compounds like 3b, 9c, 9f, 12c and 12d also possess good binding energy values (−8.9, −8.5, −8.5, −7.2 and −7.5 Kcal/mol, respectively). However, all the other compounds also exhibited good binding energy values (Kcal/mol) against the receptor molecule. A literature study showed that the standard error mean of docking energy for Autodock is 2.5 kcal/mol. Therefore, among all compounds the energy value difference was no more than 2.5 Kcal/mol. However, the selection of compounds was also confirmed on the basis of in vitro analysis to categorize the compounds and further perform a dynamic simulation study. Our computational analysis also showed a good association with the in-vitro study and a graphical depiction is provided in Figure 3.

3.4. Urease Binding Pocket and Ligand Pose Analysis

The docked complexes were further analyzed on the basis of hydrogen and hydrophobic binding interactions. Docking analysis showed that the four best compounds were confined in the active binding region of the receptor molecule with different conformational poses. The four best docked compounds’ (3e, 6a, 9c and 12d) poses in the binding region of urease with their interaction bonding patterns are shown in (Figure 4). All the other docking complexes are depicted in the Supplementary Data (Figures S3–S22).

3.5. Structure Activity Relationship and Interacting Residues

The hydrogen and hydrophobic interactions are very important in drug protein docking. Prior research data showed that hydrogen bonds with donor-acceptor distances of 2.2–2.5 Å are considered as strong bonds, while, bond distances from 2.5 to 3.2 Å are considered moderate, and bond lengths ranging from 3.2–4.0 Å are considered as weak interactions [40]. In detail, the structure activity relationship (SAR) study showed that in 6a docking two hydrogen bonds were observed against His593, with bond distances of 2.30, 2.60 Å, respectively [41]. However, another showed that the default parameter for the distance between the hydrogen bond donor and the acceptor was 3.2 Å [42]. On average, a hydrogen bond with a distance >3.5 Å is considered as weak and a hydrogen bond with a distance <3.5 Å is considered strong [43]. A single hydrophobic interaction was also seen with Ala636, showing a bond length of 4.03 Å. The amino group of the benzene ring and oxygen moiety of the sulfur interact directly with His593 by a hydrogen bond interaction. Similarly, the benzyl methyl group forms a hydrophobic interaction within the active binding region of the target protein. In the 3e docking complex three hydrogen bonds were observed. The oxygen and methoxy functional groups of 3e form hydrogen bonds with Arg439 and Ala636 with bonding distances of 3.06, 2.92 and 4.40 Å, respectively. Compounds 9e and 12d are also involved in hydrogen bonding interactions with target protein residues. The oxygen moiety of 9e forms double hydrogen bonds with Arg439 and His594 with bonding distances of 2.08 and 2.72 Å. Similarly, in 12d docking a single hydrogen bond was observed between Arg439 and an oxygen molecule of the ligand with a bonding distance 1.78 Å. It has been observed that Arg439 was most common interacting residues in all docking results. Literature data also verified the importance of these residues in bonding with other urease inhibitors which strengthens our docking results. No ligand interaction was observed with the Ni2+ due to the bulky ligand structures. However, the interaction patterns of our docking results were correlated with published results which strengthens the significance of our docking experiments [44,45,46,47,48]. The comparative binding energy and SAR analysis showed the significance of 6a that may be considered as a potent inhibitor targeting jack bean urease.

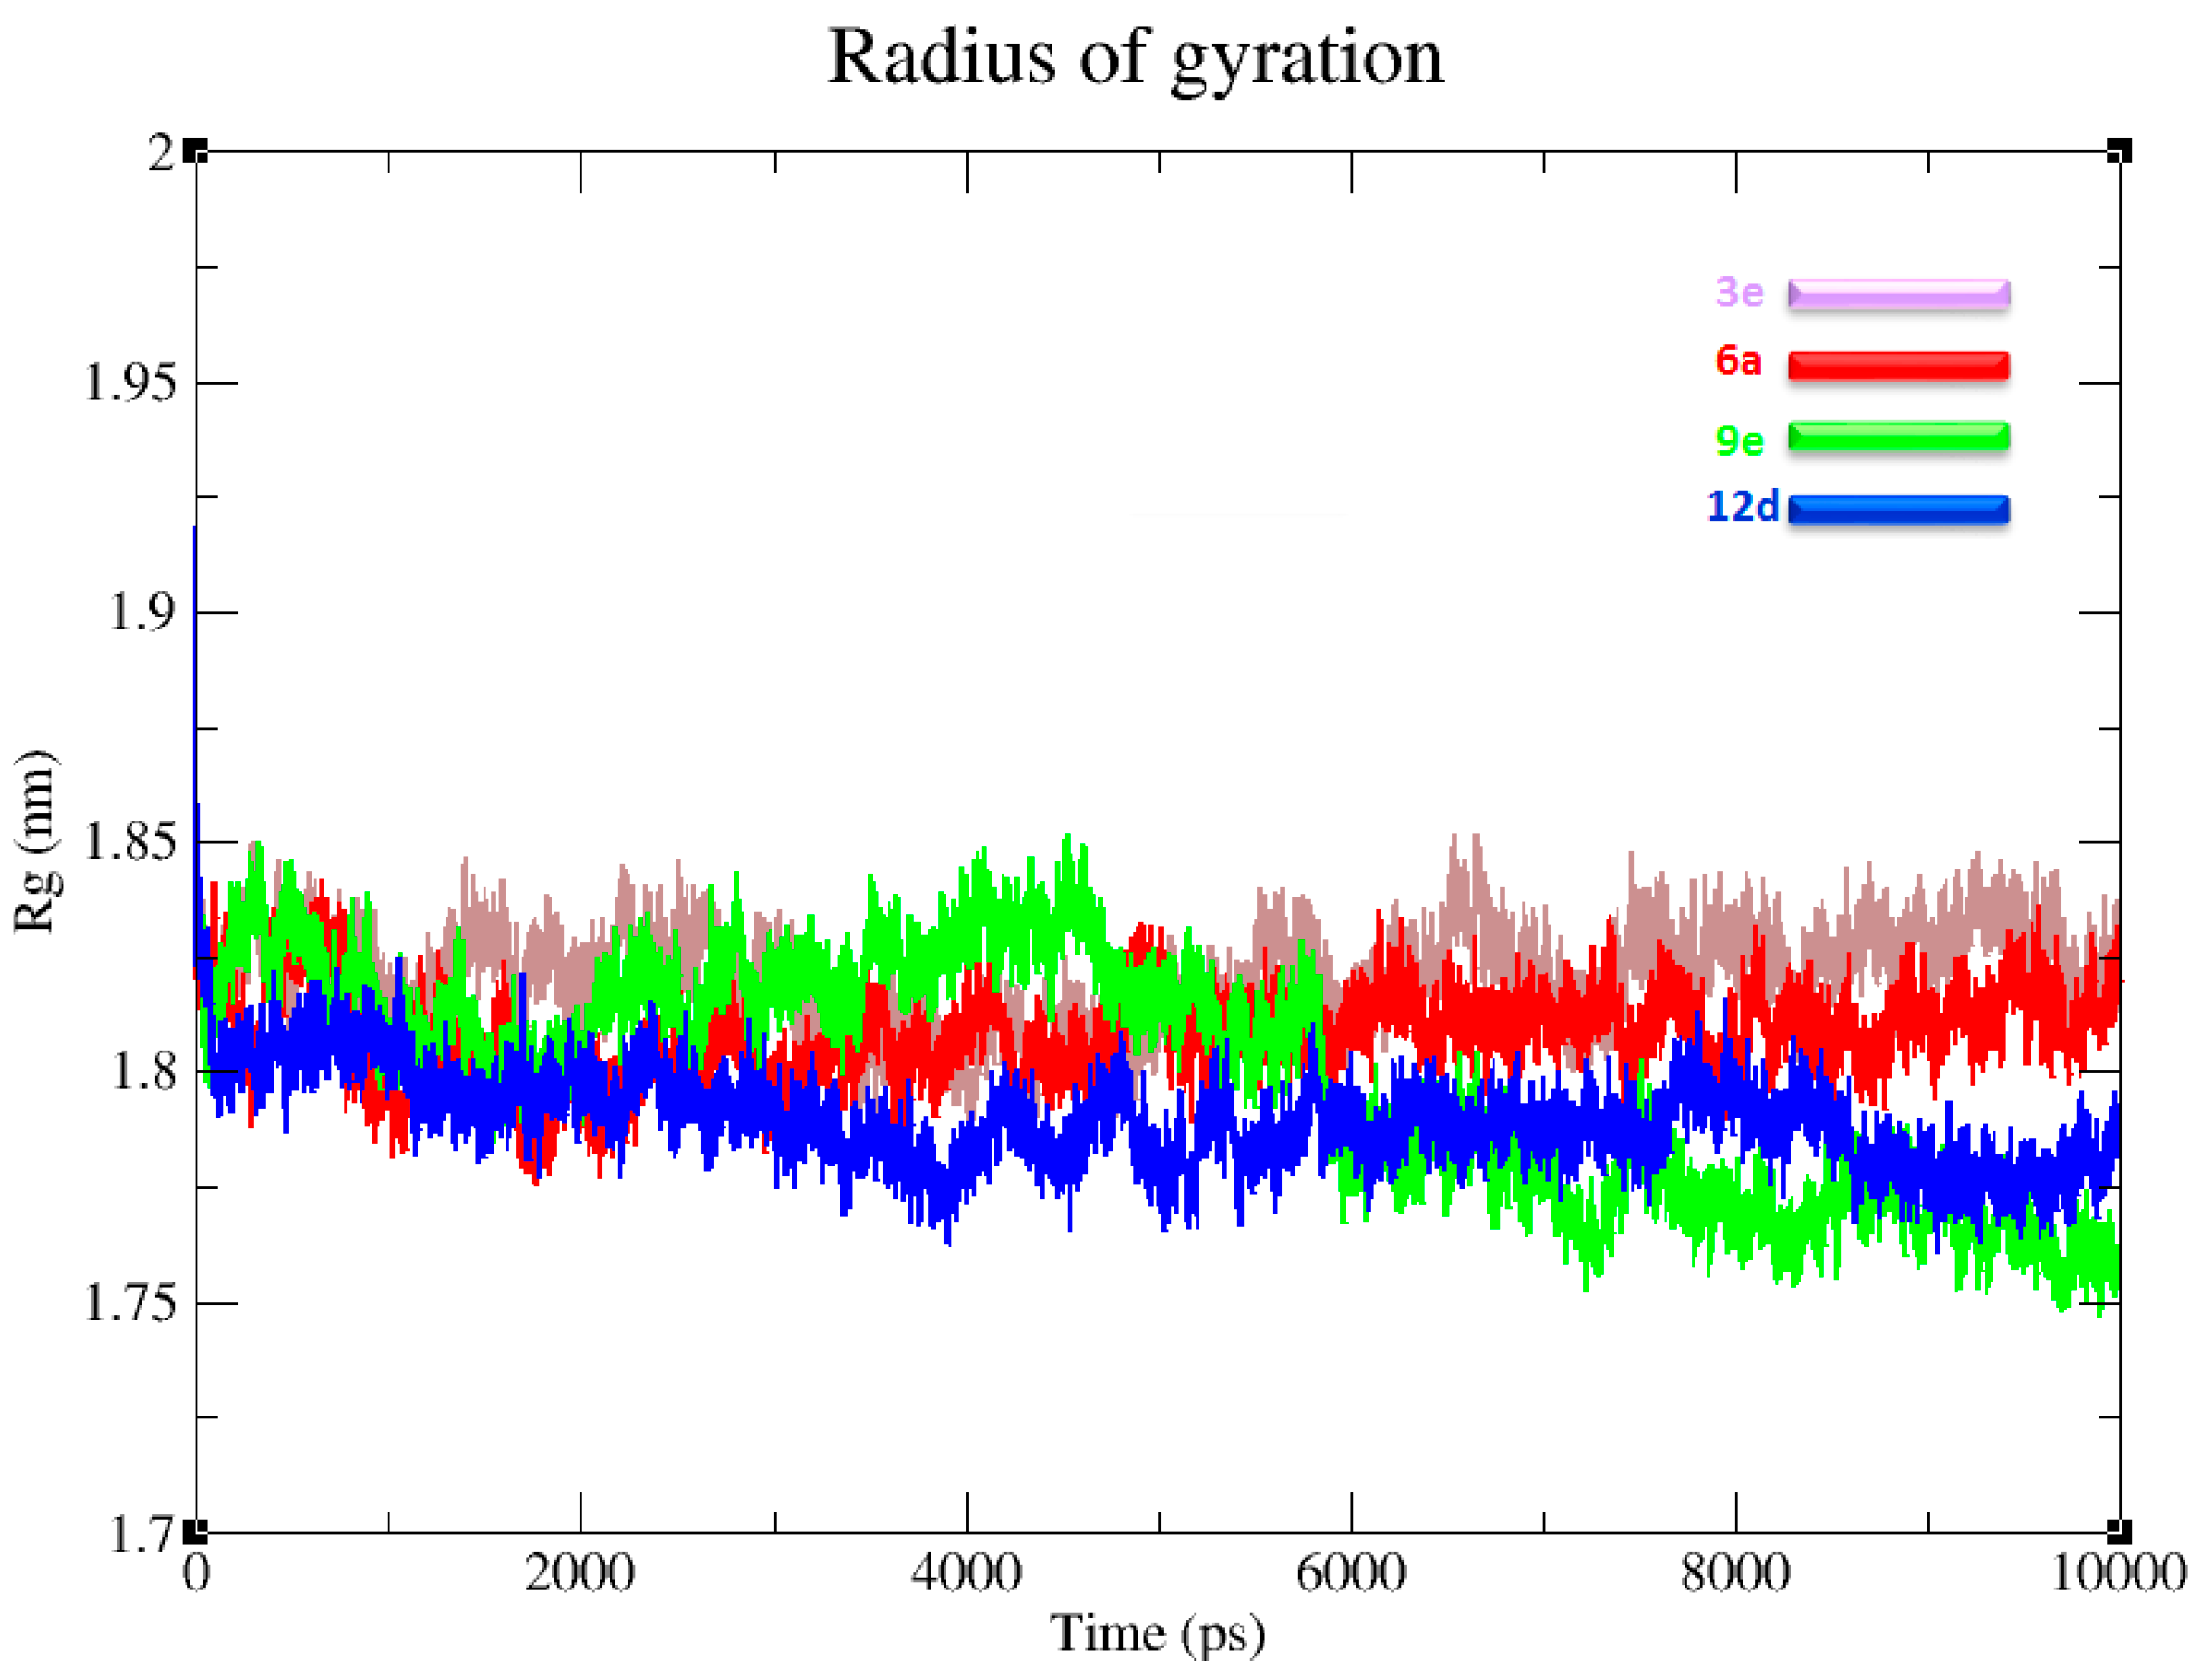
3.6. Radius of Gyration and Protein Stability

The radius of gyration (Rg) prediction was also carefully observed to analyze the compactness of the target protein. The generated graph results indicated that the Rg value is very stable at around 1.83 nm throughout the simulation time (0–10,000 ps). The comparative analysis showed that the 6a graph line was the most stable and showed little fluctuations compared to other complexes. The Rg time graph showed that the residual backbone and the folding of the receptor protein was steadily stable after binding with the inhibitors (Figure 5). The solvent accessible area (SASA) and χ2 distribution/dihedral order of residual fluctuations of all complexes are presented in the Supplementary Data (Figures S23 and S24).

4. Materials and Methods

4.1. Chemicals and Instruments

All the chemicals and reagents were purchased commercially and used without further purification. All the solvents used were dried and distilled prior to use. Melting points were recorded using a digital Gallenkamp model MPD.BM 3.5 apparatus (SANYO, Tokyo, Japan) and are uncorrected. 1H- and 13C-NMR spectra were recorded in DMSO-d6 at 300 MHz and 75 MHz, respectively, using a Bruker (Rheinstetten, Germany) spectrophotometer. IR spectra were recorded on an IR 460 spectrophotometer (Shimadzu, Rheinstetten, Germany) as KBr pellets. Elemental analyses were conducted using a LECO-183 CHNS analyzer (Rheinstetten, Germany). Bioactivities were determined at the Department of Biological Sciences, College of Natural Sciences, Kongju National University. Thin layer chromatography (TLC) was conducted on 0.25 mm silica gel plates (60 F254, Merck, Rheinstetten, Germany). Visualization was made with ultraviolet light. Reagents were obtained commercially and used as received.

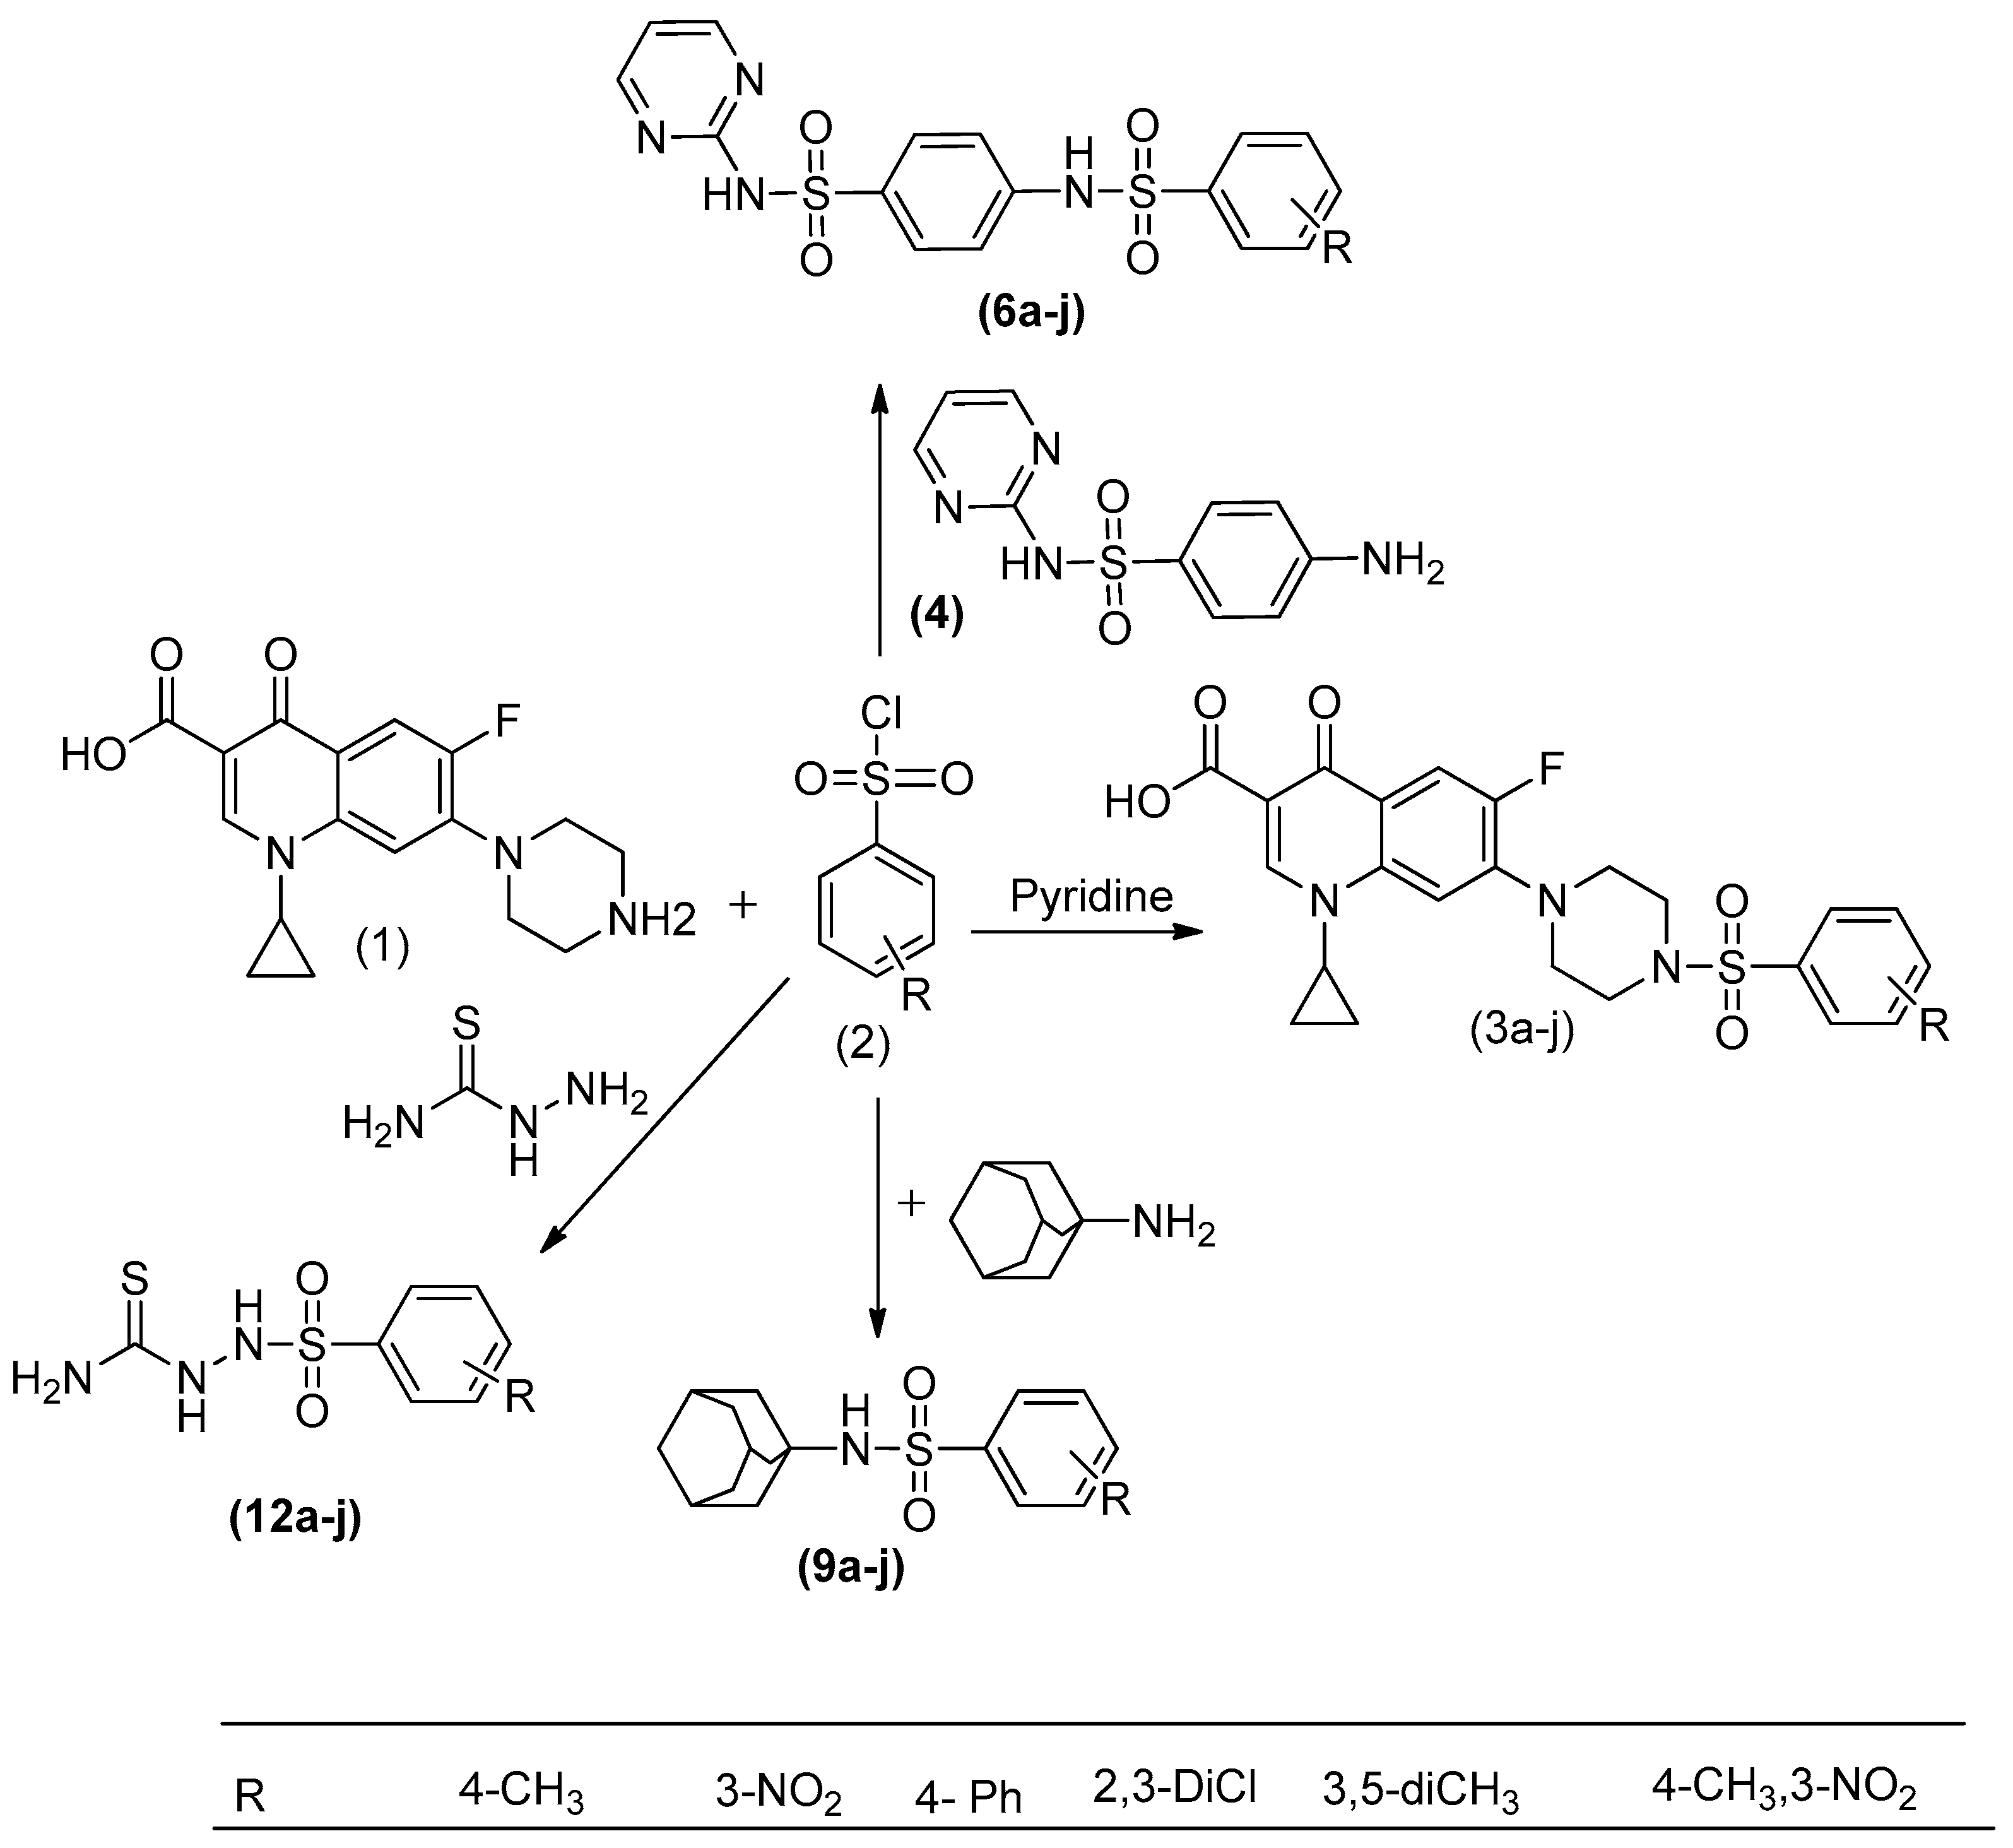
4.2. Synthetic Procedures

New and modern synthetic protocols were used for the synthesis of sulfonamide derivatives [49]. Sulfonyl chloride (0.5 g, 1.85 mmol) in chloroform (10 mL) was added dropwise to a solution of ciprofloxacin/amantadine/sulfadiazine or thiosemicarbazide (0.28 g, 1.85 mmol not valid for all these substrates) and pyridine (0.77 mL) in chloroform (5 mL) and stirred for 48 h. The reaction mixture was washed successively with 10% citric acid (5–10 mL), 10% NaHCO3 (5–10 mL) and water (3–10 mL), dried with MgSO4 and concentrated in vacuo. Purification by flash column chromatography (30% hexane–ethyl acetate) yielded the crude compound as a yellow oil. The oil was further purified by recrystallization from chloroform and a few drops of n-hexane. The characterization data for the compounds is given below.

4.3. Characterization Data

1-Cyclopropyl-6-fluoro-7-(4-((3-nitrophenyl)sulfonyl)piperazin-1-yl)-4-oxo-1,4-dihydroquinoline-3-carboxylic acid (3a). White solid; yield: 76%; m.p.: 225–227 °C; Rf: 0.63 (1:1 petroleum ether–ethyl acetate); FTIR (neat, cm−1): 3135 (Csp2-H), 1663 (C=O), 1589, 1541 (Ar C=C), 1487 (N=O), 1251 (C=S); 1H-NMR: δ (ppm) 15.09 (s, 1H, COOH), 8.80 (s, 1H, ArH), 8.39 (d, 1H, ArH, J = 8.8 Hz), 8.29 (s, 1H, Ar-H), 8.21 (d, 1H, Ar-H, J = 8.6 Hz), 7.93 (s, 1H, Ar-H), 7.71–7.67 (m, 1H, ArH), 7.51 (s, 1H, C=CH), 3.69–3.56 (m, 1H, CH), 3.19–3.15 (m, 4H, CH2), 2.64–2.59 (m, 4H, CH2), 1.11 (d, 4H, CH2, J = 6.8 Hz); 13C-NMR: δ (ppm) 199.0 (ketone C=O), 173.0 (acid C=O), 162.95, 151.1, 149.8, 146.7, 139.6, 134.5, 133.1, 132.6, 130.3, 129.4, 127.0, 114.6, 113.5, 51.7, 42.0, 34.6, 11.7. Anal. Calcd. for C24H24FN3O5S: C, 59.39; H, 4.96; N, 8.69; S, 6.62 found: C, 59.12; H, 4.84; N, 8.24; S, 6.48.
1-Cyclopropyl-6-fluoro-4-oxo-7-(4-tosylpiperazin-1-yl)-1,4-dihydroquinoline-3-carboxylic acid (3b). White solid; yield: 80%; m.p.: 160–162 °C; Rf: 0.61 (1:1 petroleum ether–ethyl acetate); FTIR (neat, cm−1): 3030 (Csp2-H), 1664 (C=O), 1557, 1527 (Ar C=C), 1258 (C=S); 1H-NMR: δ (ppm) 14.09 (s, 1H, COOH), 8.63 (s, 1H, Ar-H), 7.75 (s, 1H, Ar-H), 7.71 (d, 2H, ArH, J = 8.3 Hz), 7.56 (s, 1H, C=CH), 7.03 (d, 2H, ArH, J = 8.3 Hz), 3.49–3.44 (m, 1H, CH), 3.17–3.11 (m, 4H, CH2), 2.14–2.07 (m, 4H, CH2), 2.01 (s, 3H, CH3), 1.14 (d, 4H, CH2, J = 6.3 Hz); 13C-NMR: δ (ppm) 166.0 (acid C=O), 161.3 (amide C=O), 151.95, 141.8, 138.8, 135.7, 128.3, 124.5, 123.1, 121.6, 120.7, 118.3, 117.0, 115.6, 110.5, 107.0, 52.7, 44.0, 37.6, 9.7. Anal. Calcd. for C23H21FN4O7S: C, 53.29; H, 3.96; N, 10.83; S, 6.21 found: C, 53.12; H, 3.84; N, 10.59; S, 6.07.
1-Cyclopropyl-7-(4-((2,3-dichlorophenyl)sulfonyl)piperazin-1-yl)-6-fluoro-4-oxo-1,4-dihydroquinoline-3-carboxylic acid (3c). White solid; yield: 79%; m.p.: 168–170 °C; Rf: 0.61 (1:1 petroleum ether–ethyl acetate); FTIR (neat, cm−1): 3090 (Csp2-H), 1667 (C=O), 1561, 1531 (Ar C=C), 1265 (C=S), 735 (C-Cl); 1H-NMR: δ (ppm) 14.19 (s, 1H, COOH), 8.80 (s, 1H, ArH), 8.29 (s, 1H, Ar-H), 7.77 (d, 1H, Ar-H, J = 8.9 Hz), 7.53 (s, 1H, ArH), 7.34 (d, 1H, Ar-H, 8.9 Hz), 7.28 (s, 1H, C=CH), 3.59–3.55 (m, 1H, CH), 3.29–3.26 (m, 4H, CH2), 2.54–2.49 (m, 4H, CH2), 1.21 (d, 4H, CH2, J = 6.3 Hz); 13C-NMR: δ (ppm) 195.0 (ketone C=O), 171.0 (acid C=O), 169.3162.95, 151.1, 149.8, 146.7, 139.6, 134.5, 133.1, 132.6, 130.3, 129.4, 127.0, 113.6, 111.5, 52.7, 41.0, 31.6, 10.7. Anal. Calcd. for C29H26FN3O5S: C, 63.60; H, 4.78; N, 7.68; S, 5.85 found: C, 63.32; H, 4.54; N, 10.59; S, 6.07.
1-Cyclopropyl-7-(4-((3,5-dimethylphenyl)sulfonyl)piperazin-1-yl)-6-fluoro-4-oxo-1,4-dihydroquinoline-3-carboxylic acid (3d). White solid; yield: 78%; m.p.: 229–231 °C; Rf: 0.65 (1:1 petroleum ether–ethyl acetate); FTIR (neat, cm-1): 3150 (Csp2-H), 1652 (C=O),, 1593, 1551 (Ar C=C), 1475 (N=O) 1241 (C=S); 1H-NMR: δ (ppm): 15.09 (s, 1H, COOH), 12.40 (s, 1H, NH-C=S), 9.09 (d, 2H, Ar-H, J = 7.5 Hz), 9.04 (t, 1H, Ar-H, J = 7.5 Hz), 8.82 (s, 1H, Ar-H), 7.95 (s, 1H, Ar-H), 7.59 (s, 1H, C=CH), 3.85–3.79 (m, 1H, CH), 3.53–3.49 (m, 4H, CH2), 3.34–3.30 (m, 4H, CH2), 2.30 (s, 6H, CH3), 1.32 (d, 4H, CH2, J = 6.5 Hz); 13C-NMR: δ (ppm): 192.0 (ketone C=O), 166.2 (acid C=O), 148.6, 148.3, 144.5, 144.4, 139.5, 137.1, 130.1, 129.3, 122.3, 119.8, 119.7, 111.7, 111.4, 107.4, 46.9, 46.8, 43.1, 36.4, 21.6, 8.1. Anal. Calcd. for C23H20Cl2FN3O5S: C, 51.14; H, 3.76; N, 7.76; S, 5.91 found: C, 50.92; H, 3.64; N, 7.59; S, 6.07.
1-Cyclopropyl-6-fluoro-7-(4-((4-methyl-3-nitrophenyl)sulfonyl)piperazin-1-yl)-4-oxo-1,4-dihydroquinoline-3-carboxylic acid (3e). White solid; yield: 80%; m.p.: 160–162 °C; Rf: 0.61 (1:1 petroleum ether–ethyl acetate); FTIR (neat, cm−1): 3030 (Csp2-H), 1664 (C=O), 1557, 1527 (Ar C=C), 1258 (C=S); 1H-NMR: δ (ppm) 14.09 (s, 1H, COOH), 8.63–7.71 (m, 3H, Ar-H), 7.56 (s, 1H, C=CH), 7.03 (d, 2H, ArH, J = 8.3 Hz), 3.49–3.44 (m, 1H, CH), 3.17–3.11 (m, 4H, CH2), 2.14–2.07 (m, 4H, CH2), 2.01 (s, 3H, CH3), 1.14 (d, 4H, CH2, J = 6.3 Hz); 13C-NMR: δ (ppm) 190.0 (ketone C=O), 166.0 (acid C=O), 151.95, 138.8, 135.7, 128.3, 124.5, 123.1, 121.6, 120.7, 118.3, 117.0, 115.6, 110.5, 107.0, 52.7, 44.0, 37.6, 9.7. Anal. Calcd. for C23H20Cl2FN3O5S: C, 51.14; H, 3.76; N, 7.76; S, 5.91 found: C, 50.92; H, 3.64; N, 7.59; S, 6.07.
7-(4-([1,1′-Biphenyl]-4-ylsulfonyl)piperazin-1-yl)-1-cyclopropyl-6-fluoro-4-oxo-1,4-dihydroquinoline-3-carboxylic acid (3f). White solid; yield: 80%; m.p.: 160–163 °C; Rf: 0.63 (1:1 petroleum ether–ethyl acetate); FTIR (pure, cm−1): 3062 (Csp2-H), 1667 (C=O), 1558, 1531 (Ar C=C), 1248 (C=S), 1H-NMR: δ (ppm) 14.29 (s, 1H, COOH), 8.75 (s, 1H, Ar-H), 7.91 (s, 1H, Ar-H), 7.83 (d, 2H, ArH, J = 8.5 Hz), 7.51 (s, 1H, C=CH), 7.43 (d, 2H, ArH, J = 8.5 Hz), 7.40–6.92 (m, 5H, ArH), 3.65–3.61 (m, 1H, CH), 3.18–3.11 (m, 4H, CH2), 2.74–3.67 (m, 4H, CH2), 1.22 (d, 4H, CH2, J = 6.1 Hz); 13C-NMR: δ (ppm) 196.0 (C=O of ketone), 170.0 (C=O acid), 150.8, 149.8, 14677, 139.3, 138.5, 137.1, 135.6, 133.7, 129.3, 135.1, 133.6, 131.7, 129.3, 128.0, 117.6, 111.5, 53.7, 45.0, 39.6, 11.7. Anal. Calcd. for C24H23FN4O7S: C, 54.34; H, 4.36; N, 10.55; S, 5.99 found: C, 54.12; H, 3.98; N, 10.15; S, 6.07.
4-Methyl-N-(4-(N-(pyrimidin-2-yl)sulfamoyl)phenyl)benzenesulfonamide (6a). White solid; yield: 81%; m.p.: 223–225 °C; Rf: 0.63 (1:1 petroleum ether–ethyl acetate); FTIR (neat, cm−1): 3260 (NH) 3133 (Csp2-H), 1587, 1540 (Ar C=C), 1H-NMR: δ (ppm) 8.08 (d, 2H, J =4.8 Hz, pyrimidyl), 7.09 (t, 1H, J = 4.8 Hz, pyrimidinyl), 7.38 (d, 2H, J = 8.4 Hz, C6H4-meta), 7.86 (d, 2H, J = 8.4 Hz, C6H4-ortho), 7.18 (d, 2H, J =8.4 Hz, C6H4-meta), 7.06 (d, 2H, J = 8.4 Hz, C6H4-ortho) 9.27 (s, 1H, NH) 2.21 (s, 3H, CH3), 13C-NMR: δ (ppm) 160.5 (C=N), 158.4, 141.8, 138.8, 135.7, 133.2, 132.5, 130.5, 129.5, 128.3, 120.5, 26.6. Anal. Calcd. For C17H16N4O4S2: C, 50.47; H, 3.99; N, 13.84; S, 15.85 found: C, 50.12; H, 3.78; N, 13.55; S, 16.67.
2-Nitro-N-(4-(N-(pyrimidin-2-yl)sulfamoyl)phenyl)benzenesulfonamide (6b). White solid; yield: 80%; m.p.: 160–162 °C; Rf: 0.61 (1:1 petroleum ether–ethyl acetate); FTIR (neat, cm−1): 3260 (NH) 3131 (Csp2-H), 1586, 1544 (Ar C=C), 1254 (C=S); 1H-NMR: δ (ppm) 8.08 (d, 2H, J = 4.8 Hz, pyrimidyl), 7.09 (t, 1H, J = 4.8 Hz, pyrimidinyl), 7.38 (d, 2H, J =8.4 Hz, C6H4-meta), 8.26 (d, 2H, J = 8.4 Hz, C6H4-ortho), 7.38 (d, 2H, J = 8.4 Hz, C6H4-meta), 7.06 (d, 2H, J = 8.4 Hz, C6H4-ortho), 9.30 (s, 1H, NH) 13C-NMR: δ (ppm) 181.5 (C=S), 142.8, 139.8, 135.8, 127.3. Anal. Calcd. for C17H16N4O4S2: C, 44.12; H, 3.02; N, 16.07; S, 14.75 found: C, 43.98; H, 2.99; N, 15.98; S, 14.61.
N-(4-(N-(pyrimidin-2-yl)sulfamoyl)phenyl)-[1,1′-biphenyl]-4-sulfonamide (6c). White solid; yield: 79%; m.p.: 168–170 °C; Rf: 0.51 (1:1 petroleum ether–ethyl acetate); FTIR (neat, cm−1): 3263 (NH) 3132 (Csp2-H), 1576, 1542 (Ar C=C), 1253 (C=S); 1H-NMR: δ (ppm) 8.18 (d, 2H, J = 4.8 Hz, pyrimidyl), 7.19 (t, 1H, J = 4.8 Hz, pyrimidinyl), 7.82 (d, 2H, J =8.4 Hz, C6H4-meta), 7.76 (d, 2H, J = 8.4 Hz, C6H4-ortho), 7.22 (d, 2H, J = 8.4 Hz, C6H4-meta), 7.16 (d, 2H, J = 8.4 Hz, C6H4-ortho), 7.75–7.39 (m, 5H, Ar), 9.37 (s, 1H, NH) 13C-NMR: δ (ppm) 186.5 (C=S), 142.8, 141.7, 139.8, 138.5, 135.8, 133.5, 132.5, 127.3. Anal. Calcd. for C22H18N4O4S2: C, 56.12; H, 3.89; N, 12.03; S, 13.73 found: C, 55.98; H, 3.76; N, 11.98; S, 13.61.
2-((2,3-Dichlorophenyl)sulfonyl)hydrazine-1-carbothioamide (6d). White solid; yield: 70%; m.p.: 223–225 °C; Rf: 0.63 (1:1 petroleum ether–ethyl acetate); FTIR (neat, cm−1): 3260 (NH) 3133 (Csp2-H), 1587, 1540 (Ar C=C), 1H-NMR: δ (ppm) 8.08 (d, 2H, J = 4.8 Hz, pyrimidyl), 7.09 (t, 1H, J = 4.8 Hz, pyrimidinyl), 7.38 (d, 2H, J = 8.4 Hz, C6H4-meta), 7.86 (d, 2H, J = 8.4 Hz, C6H4-ortho), 7.18 (d, 2H, J = 8.4 Hz, C6H4-meta), 7.06 (d, 2H, J = 8.4 Hz, C6H4-ortho) 9.27 (s, 1H, NH) 2.21 (s, 3H, CH3), 13C-NMR: δ (ppm) 179.5 (C=S), 141.8, 138.8, 135.7, 128.3, 26.6. Anal. Calcd. For C16H12 Cl2N4O4S2: C, 41.83; H, 2.64; N, 12.19; S, 13.93 found: C, 41.48; H, 2.46; N, 11.98; S, 13.61.
2-((3,5-Dimethylphenyl)sulfonyl)hydrazine-1-carbothioamide (6e). White solid; yield: 76%; m.p.: 223–225 °C; Rf: 0.63 (1:1 petroleum ether–ethyl acetate); FTIR (neat, cm−1): 3260 (NH) 3133 (Csp2-H), 1587, 1540 (Ar C=C), 1H-NMR: δ (ppm) 8.08 (d, 2H, J = 4.8 Hz, pyrimidyl), 7.09 (t, 1H, J = 4.8 Hz, pyrimidinyl), 7.38 (d, 2H, J = 8.4 Hz, C6H4-meta), 7.86 (d, 2H, J = 8.4 Hz, C6H4-ortho), 7.18 (d, 2H, J = 8.4 Hz, C6H4-meta), 7.06 (d, 2H, J = 8.4 Hz, C6H4-ortho) 9.27 (s, 1H, NH) 2.21 (s, 3H, CH3), 13C-NMR: δ (ppm) 179.5 (C=S), 141.8, 138.8, 135.7, 128.3, 26.6. Anal. Calcd. For C18H18 N4O4S2: C, 51.53; H, 4.54; N, 13.39; S, 15.32 found: C, 51.35; H, 4.36; N, 13.23; S, 15.12.
2-((4-Methyl-3-nitrophenyl)sulfonyl)hydrazine-1-carbothioamide (6f). White solid; yield: 70%; m.p.: 223–225 °C; Rf: 0.63 (1:1 petroleum ether: ethyl acetate); FTIR (neat, cm−1): 3260 (NH) 3133 (Csp2-H), 1587, 1540 (Ar C=C), 1H-NMR: 8.08 (d, 2H, J = 4.8 Hz, pyrimidyl), 7.09 (t, 1H, J = 4.8 Hz, pyrimidinyl), 7.38 (d, 2H, J = 8.4 Hz, C6H4-meta), 7.86 (d, 2H, J = 8.4 Hz, C6H4-ortho), 7.18 (d, 2H, J = 8.4 Hz, C6H4-meta), 7.06 (d, 2H, J = 8.4 Hz, C6H4-ortho) 9.27 (s, 1H, NH) 2.21 (s, 3H, CH3), 13C-NMR: δ (ppm) 179.5 (C=S), 141.8, 138.8, 135.7, 128.3, 26.6. Anal. Calcd. for C18H18 N4O4S2: C, 51.49; H, 4.44; N, 13.29; S, 14.32 found: C, 51.35; H, 4.31; N, 13.21; S, 14.99.
N-(Adamantan-1-yl)-4-methylbenzenesulfonamide (9a). White solid; yield: 73%; m.p.: 218–222°C; Rf: 0.61 (1:1 petroleum ether–ethyl acetate); FTIR (neat, cm−1): 3262 (NH) 3134 (Csp2-H), 1587, 1544 (Ar C=C), 1H-NMR: δ (ppm) 7.38 (d, 2H, J = 8.4 Hz, C6H4-meta), 7.86 (d, 2H, J = 8.4 Hz, C6H4-ortho), 9.27 (s, 1H, NH) 2.21 (s, 3H, CH3), 1.67–1.79 (m, 6H, CH2); 1.85 (s, 6H, CH2); 2.29 (s, 3H, CH) 13C-NMR: δ (ppm) 141.75, 137.74, 130.49, 129.49, 40.98, 35.80, 29.74, 29.12, 22.4. Anal. Calcd. for C17H23NO2S: C, 66.84; H, 7.58; N, 4.56; S, 10.51 found: C, 66.67; H, 7.41; N, 4.31; S, 10.40.
N-(Adamantan-1-yl)-4-nitrobenzenesulfonamide (9b). White solid; yield: 84%; m.p.: 164–168 °C; Rf: 0.63 (1:1 petroleum ether–ethyl acetate); FTIR (neat, cm−1): 3263 (NH) 3131 (Csp2-H), 1584, 1543 (Ar C=C), 1H-NMR: δ (ppm) 7.48 (d, 2H, J = 8.4 Hz, C6H4-meta), 8.22 (d, 2H, J = 8.4 Hz, C6H4-ortho), 9.30 (s, 1H, NH) 2.24 (s, 3H, CH3), 1.65–1.77 (m, 6H, CH2); 1.84 (s, 6H, CH2) 13C-NMR: δ (ppm) 143.75, 136.74, 131.49, 128.49, 40.99, 35.85, 29.72, 29.123. Anal. Calcd. for C16H20N2O4S: C, 57.11; H, 5.98; N, 8.32; S, 9.52 found: C, 56.99; H, 5.81; N, 7.98; S, 9.41.
N-(Adamantan-1-yl)-[1,1′-biphenyl]-4-sulfonamide (9c). White solid; yield: 76%; m.p.: 165–171 °C; Rf: 0.55 (1:1 petroleum ether–ethyl acetate); FTIR (neat, cm−1): 3263 (NH) 3132 (Csp2-H), 1576, 1542 (Ar C=C), 1H-NMR: δ (ppm) 7.82 (d, 2H, J =8.4 Hz, C6H4-meta), 7.76 (d, 2H, J = 8.4 Hz, C6H4-ortho), 7.75–7.39 (m, 5H, Ar), 9.37 (s, 1H, NH), 2.22 (s, 3H, CH3), 1.64–1.76 (m, 6H, CH2); 1.82 (s, 6H, CH2) 13C-NMR: δ (ppm) 142.8, 141.7, 139.8, 138.5, 135.8, 133.5, 132.5, 127.3, 41.91, 36.82, 29.71, 28.12. Anal. Calcd. for C18H21NO2S: C, 68.54; H, 6.73; N, 4.45; S, 10.18 found: C, 68.43; H, 5.81; N, 4.28; S, 9.97.
N-(Adamantan-1-yl)-2,3-dichlorobenzenesulfonamide (9d). White solid; yield: 78%; m.p.: 221–230 °C; Rf: 0.61 (1:1 petroleum ether–ethyl acetate); FTIR (neat, cm−1): 3255 (NH) 3135 (Csp2-H), 1580, 1542 (Ar C=C), 1H-NMR: δ (ppm) 6.64–7.97 (m, 3H, ArH) 9.24 (s, 1H, NH) 2.23 (s, 3H, CH3), 1.54–1.66 (m, 6H, CH2); 1.72 (s, 6H, CH2); 13C-NMR: δ (ppm) 142.8, 139.8, 135.8, 133.5, 131.4, 127.3, 42.91, 38.82, 30.71, 27.12. Anal. Calcd. for C16H19Cl2NO2S: C, 53.35; H, 5.32; N, 3.87; S, 8.18 found: C, 53.13; H, 5.12; N, 3.78; S, 8.99.
N-(Adamantan-1-yl)-3,5-dimethylbenzenesulfonamide (9e). White solid; yield: 81%; m.p.: 162–164 °C; Rf: 0.61 (1:1 petroleum ether–ethyl acetate); FTIR (neat, cm−1): 3248 (NH) 3156 (Csp2-H), 1572, 1532 (Ar C=C), 1H-NMR: δ (ppm) 7.61–7.97 (m, 3H, ArH) 9.34 (s, 1H, NH); 2.36 (s, 6H, CH3), 2.21 (s, 3H, CH3), 1.58–1.68 (m, 6H, CH2), 1.73 (s, 6H, CH2); 13C-NMR: δ (ppm) 141.8, 139.8, 134.8, 127.3, 43.91, 39.82, 31.71, 29.12 27.5. Anal. Calcd. for C18H25NO2S: C, 67.65; H, 7.88; N, 4.38; S, 10.04 found: C, 67.45; H, 7.69; N, 4.09; S, 9.92.
N-(Adamantan-1-yl)-4-methyl-3-nitrobenzenesulfonamide (9f). White solid; yield: 80%; m.p.: 165–163 °C; Rf: 0.61 (1:1 petroleum ether–ethyl acetate); FTIR (neat, cm−1): 3251 (NH) 3152 (Csp2-H), 1567, 1537 (Ar C=C), 1H-NMR: δ (ppm) 8.10–7.75 (m, 3H, ArH) 9.72 (s, 1H, NH) 2.38 (s, 3H, CH3), 2.23 (s, 3H, CH3), 1.56–1.64 (m, 6H, CH2); 1.72 (s, 6H, CH2); 13C-NMR: δ (ppm) 144.8, 137.8, 136.8, 131.3, 128.5, 126.5 23.6, 47.91, 43.82, 36.71, 28.12. Anal. Calcd. for C17H22N2O4S: C, 58.28; H, 6.34; N, 7.98; S, 9.14 found: C, 58.14; H, 5.97; N, 4.09; S, 8.98.
2-Tosylhydrazine-1-carbothioamide (12a). White solid; yield (76%; m.p.: 220–222 °C; Rf: 0.63 (1:1 petroleum ether–ethyl acetate); FTIR (neat, cm−1): 3264 (NH) 3135 (Csp2-H), 1589, 1541 (Ar C=C), 1251 (C=S); 1H-NMR: δ (ppm) 7.38 (d, 2H, J = 8.4 Hz, C6H4-meta), 7.86 (d, 2H, J = 8.4 Hz, C6H4-ortho), 9.27 (s, 1H, NH) 9.31 (s, 1H, NH) 7.1 (s, 2H, -NH2); 2.21 (s, 3H, CH3); 13C-NMR: δ (ppm) 179.5 (C=S), 141.8, 138.8, 135.7, 128.3, 26.6. Anal. Calcd. For C18H11N2O4S: C, 45.07; H, 5.21; N, 19.71; S, 15.04 found: C, 44.94; H, 4.97; N, 19.49; S, 14.97.
2-((4-Nitrophenyl)sulfonyl)hydrazine-1-carbothioamide (12b). White solid; yield: 80%; m.p.: 160–162 °C; Rf: 0.61 (1:1 petroleum ether–ethyl acetate); FTIR (neat, cm−1): 3260 (NH) 3131 (Csp2-H), 1586, 1544 (Ar C=C), 1254 (C=S); 1H-NMR: δ (ppm) 7.38 (d, 2H, J = 8.4 Hz, C6H4-meta), 8.26 (d, 2H, J = 8.4 Hz, C6H4-ortho), 9.30 (s, 1H, NH) 9.29 (s, 1H, NH) 7.1 (s, 2H, -NH2); 13C-NMR: δ (ppm) 181.5 (C=S), 142.8, 139.8, 135.8, 127.3. Anal. Calcd. for C7H8N4O4S2: C, 30.42; H, 2.91; N, 20.29; S, 23.21 found: C, 30.12; H, 2.82; N, 20.13; S, 23.11.
2-([1,1′-Biphenyl]-4-ylsulfonyl)hydrazine-1-carbothioamide (12c). White solid; yield: 79%; m.p.: 168–170 °C; Rf: 0.51 (1:1 petroleum ether–ethyl acetate); FTIR (neat, cm−1): 3263 (NH) 3132 (Csp2-H), 1576, 1542 (Ar C=C), 1253 (C=S); 1H-NMR: δ (ppm) 7.82 (d, 2H, J = 8.4 Hz, C6H4-meta), 7.76 (d, 2H, J = 8.4 Hz, C6H4-ortho), 7.75–7.39 (m, 5H, Ar), 9.37 (s, 1H, NH), 9.28 (s, 1H, NH), 7.5 (s, 2H, -NH2); 13C-NMR: δ (ppm) 186.5 (C=S), 142.8, 141.7, 139.8, 138.5, 135.8, 133.5, 132.5, 127.3. Anal. Calcd. for C13H13N3O2S2: C, 50.79; H, 4.27; N, 13.65; S, 20.21 found: C, 50.57; H, 4.12; N, 13.19; S, 19.07.
2-((2,3-Dichlorophenyl)sulfonyl)hydrazine-1-carbothioamide (12d). White solid; yield: 78%; m.p.: 229–231 °C; Rf: 0.65 (1:1 petroleum ether–ethyl acetate); FTIR (neat, cm−1): 3258 (NH) 3137 (Csp2-H), 1582, 1540 (Ar C=C), 1264 (C=S); 1H-NMR: δ (ppm) 6.64–7.97 (m, 3H, ArH) 9.22 (s, 1H, NH), 9.17 (s, 1H, NH), 7.43 (s, 2H, -NH2); 13C-NMR: δ (ppm) 187.5 (C=S), 142.8, 139.8, 135.8, 133.5, 131.4, 127.3. Anal. Calcd. for C7H7Cl2N3O2S2: C, 28.79; H, 4.27; N, 13.65; S, 20.21 found: C, 50.57; H, 4.12; N, 13.19; S, 19.07.
2-((3,5-Dimethylphenyl)sulfonyl)hydrazine-1-carbothioamide (12e). White solid; yield: 80%; m.p.: 160–162 °C; Rf: 0.61 (1:1 petroleum ether–ethyl acetate); FTIR (neat, cm−1): 3258 (NH) 3156 (C-H), 1578, 1534 (Ar C=C), 1250 (C=S); 1H-NMR: δ (ppm) 7.61–7.97 (m, 3H, ArH), 9.34 (s, 1H, NH), 9.28 (s, 1H, NH), 7.76 (s, 2H, -NH2), 2.36 (s, 6H, CH3); 13C-NMR: δ (ppm) 181.5 (C=S), 141.8, 139.8, 134.8, 127.3, 27.5. Anal. Calcd. for C9H13N3O2S2: C, 41.68; H, 5.06; N, 16.20; S, 24.71 found: C, 41.49; H, 4.90; N, 15.96; S, 24.59.
2-((4-Methyl-3-nitrophenyl)sulfonyl)hydrazine-1-carbothioamide (12f). White solid; yield: 80%; m.p.: 160–163 °C; Rf: 0.63 (1:1 petroleum ether–ethyl acetate); FTIR (neat, cm−1): 3252 (NH) 3150 (C-H), 1568, 1539 (Ar C=C), 1253 (C=S); 1H-NMR: δ (ppm) 8.11–7.77 (m, 3H, ArH) 9.74 (s, 1H, NH) 9.68 (s, 1H, NH), 7.73 (s, 2H, -NH2), 2.38 (s, 3H, CH3); 13C-NMR: δ (ppm) 171.5 (C=S), 145.8, 138.8, 137.8, 130.3, 129.5, 127.5 24.6. Anal. Calcd. for C8H10N4O4S2: C, 33.10; H, 3.47; N, 19.30; S, 22.09 found: C, 32.59; H, 3.32; N, 19.16; S, 23.98.

4.4. Urease Inhibition Assay

The jack bean urease action was determined by measuring the ammonia produced by the indophenol method described by Weatherburn. The reaction mixtures, containing 50 µL of buffer (100 mM urea, 10 mM dibasic potassium phosphate, 1 mM EDTA and 10 mM LiCl, pH 8.2), 20 µL of sample and 20 µL of the jack bean urease (5 U/mL) were added in a 96-well plate and the plate was incubated at 37 °C for 30 min. After incubation, 50 μL of phenol reagent (1%, w/v phenol and 0.005%, w/v sodium nitroprusside) and 50 μL of alkali reagents (0.5%, w/v NaOH and 0.1% NaOCl) were added in each well, and again the plate was incubated at 37 °C for 10 min. After the second incubation, the absorbance was checked at 625 nm, using a microplate reader (OPTIMax, Tunable, Sunnyvale, CA, USA). All reactions were performed in triplicate. The urease inhibition activity was calculated according to the following formula:
Inhibition (%) = [(BS)/B] × 100
where B and S are the optical densities of sample and blank. Thiourea was used as reference.

4.5. Kinetic Mechanism Study

Kinetic analysis was carried out to determine the mode of inhibition. Four inhibitors (3e, 6a, 9e and 12d) were selected on the basis of the most potent IC50 values. The most potent compound was selected from each group. Kinetics were determined by varying the dose of urea in the presence of different doses of compound 3e (0.025, 0.05, 0.01 and 0.02 µM), compound 6a (0.00, 0.0011, 0.0022, and 0.0044 µM), compound 9e (0.00, 0.015, 0.03 and 0.06 µM) and compound 12d (0.0130, 0.026, 0.052, 0.104 and 0.208 µM). In detail the urea doses were varied between 100, 50, 25, 12.5, 6.25 and 3.125 mM mM for urease kinetics studies and the rest of the procedure was same for all kinetic studies as described in the urease inhibition assay protocol. Maximal initial velocities were determined from the initial linear portion of the absorbances up to 10 min after the addition of enzyme at per minute’s intervals. The inhibition type of the enzyme was assayed by Lineweaver–Burk plots of the inverse of velocities (1/V) versus the inverse of substrate concentration 1/[S] mM−1. The EI dissociation constant Ki was determined by the secondary plot of 1/V versus inhibitor concentration and the ESI dissociation constant Ki′ was calculated from the intercept versus inhibitor concentrations. Urease activity was determined by measuring ammonia production using the indophenol method as reported previously [50]. The results (change in absorbance per min) were recorded at 625 nm using a microplate reader (Optimax Tunable, Sunnyvale, CA, USA).

4.6. Free Radical Scavenging Assay

Radical scavenging activity was determined by adjusting the already reported 2,2-diphenyl-1-picrylhydrazyl (DPPH) assay method [51]. The assay arrangement comprised 100 µL of DPPH (150 µM), 20 µL of increasing concentrations of test compounds and the volume was adjusted to 200 µL in each well with DMSO. At a room temperature, the reaction mixture was incubated for 30 min. Ascorbic acid (Vitamin C) was utilized as a model inhibitor. The assay estimations were done by using a micro plate reader (OPTIMax, Tunable, Sunnyvale, CA, USA) at 517 nm. The response rates were analyzed and the percent inhibition caused by the presence of the tested inhibitor was calculated. Each concentration was analyzed in three independent experiments run thrice.

4.7. Retrieval of Jack Bean Urease Structure from Protein Data Bank (PDB)

The crystal structure of jack bean urease (PDBID 4H9M) was retrieved from the Protein Data Bank (PDB, www.rcsb.org). The selected protein structure was minimized by employing the University of California at San Francisco (UCSF) Chimera 1.10.1 tool [52]. Furthermore, the stereochemical properties of the urease structure and Ramachandran plot and values were generated by Molprobity server [53]. The Discovery Studio 4.1 Client tool was employed to generate the hydrophobicity graph of the target protein [54]. The protein architecture and statistical percentage values of urease helices, β-sheets, coils and turn were predicted using the online server VADAR 1.8 [55].

4.8. Molecular Docking of Synthesized Compounds Using AutoDock

Molecular docking experiments were done for all the synthesized ligands 3af, 6af, 9af and 12af against urease using different AutoDock 4.2 tools according to the specified instructions [56]. In the receptor (urease) the polar hydrogen atoms and Kollman charges were apportioned and for the ligands, Gasteiger partial charges were designated and non-polar hydrogen atoms were merged. All the torsion angles for all the synthesized ligands were set free to rotate through docking experiments. The docking experiments were performed by considering the receptor as rigid, whereas the ligands were considered as flexible molecules. Grid map values were adjusted at 80 Å × 80 Å × 80 Å on the targeted protein to generate the grid map. The number of docking runs for each docking experiment was set to 100 for the best conformational state. The Lamarckian genetic algorithm (LGA) and empirical free energy function were applied by taking default docking parameters. The docked complexes were further evaluated on lowest binding energy (Kcal/mol) values and hydrogen/hydrophobic bond analysis to choose the best docking pose using Discovery Studio, (Accelrys, San Diego, CA, USA, 4.1) and UCSF Chimera 1.10.1.

4.9. Molecular Dynamics Simulations Assay

Based on in vitro analysis, docking energy and conformational pose analysis the four best complexes were selected for molecular dynamic simulations. Groningen Machine for Chemicals Simulations (GROMACS) 4.5.4 package [57] with the GROMOS 53A6 force field [58] were applied on all complexes to interpret the backbone residual flexibility. The receptor and ligands topology files were created by using the GROMOS 53A6 force-field and the online PRODRG Server [59], respectively. Moreover, the receptor–ligand complexes were solvated and placed in the center of a cubic box adjusted to 9 Å distance. Ions were added to neutralize the system charges. Energy minimization (nsteps = 50,000) was done by the steepest descent method (1000 ps). The energy calculation was done by the Particle Mesh Ewald (PME) method [60], whereas covalent bond constraints were calculated by the linear constraint solver (LINCS) algorithm [61]. For final molecular dynamics (MD) setup in a md.mdp file, the time step for integration was adjusted as 0.002 ps, while the cutoff distance for short range neighbor list (rlist) was adjusted to 0.8 nm. The MD run was set to 10,000 ps with nsteps 500,000 for each protein-ligand complexes and trajectories files analysis was done by the Xmgrace tool [47].

5. Conclusions

A small library of compounds based on drug derivatives was synthesized using substituted sulphonyl chlorides. All the synthesized compounds were evaluated for jack bean urease inhibition and free radical scavenging activity. Interestingly, all the drug derivatives elicited superior activity against urease enzyme compared to the standard used (thiourea). The kinetic mechanism was determined for the most potent derivatives and it was found that compounds 3e, 6a, and 12d exhibited a mixed type of mode inhibition, while compound 9e inhibited urease via a non-competitive mechanism. The enzyme inhibition (Ki) value was found to be in the micromolar range, which further ascertained the efficacy of the synthesized ligands against the target enzyme. In addition to this, molecular docking studies were performed to explore the non-covalent interactions and chemoinformatics data were also evaluated using the rule of five or Lipinski’s rule and most of the compounds were found to be in good agreement with these rules. Extensive bioinformatics studies were carried out. From the results we conclude that these compounds could serve as lead compounds in designing structural templates for the inhibition of urease enzyme. This is also proof of the concept that simple manipulations of known drugs can led to the discovery of new drugs.

Supplementary Materials

Supplementary Materials are available online.

Acknowledgments

This work was funded in part by the following: the National Research Foundation (NRF) and the University of KwaZulu-Natal (South Africa); and the CICYT (CTQ2015-67870-P), and the Generalitat de Catalunya (2014 SGR 137) (Spain).

Author Contributions

Pervaiz Ali Channar and Aamer Saeed conceived and designed the experiments; Qamar Abbas and Hussain Raza performed the experiments; and Fernando Albericio and Sung-Yum Seo analyzed the data; Mubashir Hassan contributed reagents/materials/analysis tools; Fayaz Ali Larik wrote the paper.

Conflicts of Interest

The authors declare no conflict of interest.

References

  1. Khan, K.M.; Iqbal, S.; Lodhi, M.A.; Maharvi, G.M.; Choudhary, M.I.; Perveen, S. Biscoumarin: New class of urease inhibitors; economical synthesis and activity. Bioorg. Med. Chem. 2004, 12, 1963–1968. [Google Scholar] [CrossRef] [PubMed]
  2. Arfan, M.; Ali, M.; Ahmad, H.; Anis, I.; Khan, A.; Choudhary, M.I.; Shah, M.R. Urease inhibitors from Hypericum oblongifolium WALL. J. Enzym. Inhibit. Med. Chem. 2010, 25, 296–299. [Google Scholar] [CrossRef] [PubMed]
  3. Amtul, Z.; Rasheed, M.; Choudhary, M.I.; Rosanna, S.; Khan, K.M. Kinetics of novel competitive inhibitors of urease enzymes by a focused library of oxadiazoles/thiadiazoles and triazoles. Biochem. Biophys. Res. Commun. 2004, 319, 1053–1063. [Google Scholar] [CrossRef] [PubMed]
  4. Khan, K.M.; Ullah, Z.; Lodhi, M.A.; Ali, M.; Choudhary, M.I.; ur Rahman, A.; ul Haq, Z. Successful computer guided planned synthesis of (4R)-thiazolidine carboxylic acid and its 2-substituted analogues as urease inhibitors. Mol. Divers. 2006, 10, 223–231. [Google Scholar] [CrossRef] [PubMed]
  5. Amtul, Z.; Siddiqui, R.A.; Choudhary, M.I. Chemistry and mechanism of urease inhibition. Curr. Med. Chem. 2002, 9, 1323–1348. [Google Scholar] [CrossRef] [PubMed]
  6. Zambelli, B.; Musiani, F.; Benini, S.; Ciurli, S. Chemistry of Ni2+ in urease: Sensing, trafficking, and catalysis. Acc. Chem. Res. 2011, 44, 520–530. [Google Scholar] [CrossRef] [PubMed]
  7. Marzadori, C.; Miletti, S.; Gessa, C.; Ciurli, S. Immobilization of jack bean urease on hydroxyapatite: Urease immobilization in alkaline soils. Soil Biol. Biochem. 1998, 30, 1485–1490. [Google Scholar] [CrossRef]
  8. Aslam, M.A.S.; Mahmood, S.U.; Shahid, M.; Saeed, A.; Iqbal, J. Synthesis, biological assay in vitro and molecular docking studies of new Schiff base derivatives as potential urease inhibitors. Eur. J. Med. Chem. 2011, 46, 5473–5479. [Google Scholar] [CrossRef] [PubMed]
  9. Saeed, A.; Zaib, S.; Pervez, A.; Mumtaz, A.; Shahid, M.; Iqbal, J. Synthesis, molecular docking studies, and in vitro screening of sulfanilamide-thiourea hybrids as antimicrobial and urease inhibitors. Med. Chem. Res. 2013, 22, 3653–3662. [Google Scholar] [CrossRef]
  10. Saeed, A.; Khan, M.S.; Rafique, H.; Shahid, M.; Iqbal, J. Design, synthesis, molecular docking studies and in vitro screening of ethyl 4-(3-benzoylthioureido) benzoates as urease inhibitors. Bioorg. Chem. 2014, 52, 1–7. [Google Scholar] [CrossRef] [PubMed]
  11. O’connor, A.; Gisbert, J.; O’Morain, C. Treatment of Helicobacter pylori infection. Helicobacter 2009, 14, 46–51. [Google Scholar] [CrossRef] [PubMed]
  12. de Boer, W.A.; Tytgat, G.N. Regular review: Treatment of Helicobacter pylori infection. BMJ Br. Med. J. 2000, 320, 31–34. [Google Scholar] [CrossRef]
  13. Carlini, C.R.; Ligabue-Braun, R. Ureases as multifunctional toxic proteins: A review. Toxicon 2016, 110, 90–109. [Google Scholar] [CrossRef] [PubMed]
  14. Saeed, A.; Mahmood, S.U.; Rafiq, M.; Ashraf, Z.; Jabeen, F.; Seo, S.Y. Iminothiazoline-Sulfonamide Hybrids as Jack Bean Urease Inhibitors; Synthesis, Kinetic Mechanism and Computational Molecular Modeling. Chem. Biol. Drug Des. 2016, 87, 434–443. [Google Scholar] [CrossRef] [PubMed]
  15. Upadhyay, L.S.B. Urease inhibitors: A review. Indian J. Biotechnol. 2012, 11, 381–388. [Google Scholar]
  16. Kosikowska, P.; Berlicki, Ł. Urease inhibitors as potential drugs for gastric and urinary tract infections: A patent review. Exp. Opin. Ther. Pat. 2011, 21, 945–957. [Google Scholar] [CrossRef] [PubMed]
  17. Saeed, A.; Farid, A.; Larik, F.A.; Abbas, Q.; Channar, P.A.; Hassan, M.; Seo, S.Y.; Shehzadi, S.A.; Tehrani, K.A. Novel N-(Substituted benzoyl)-N′-(1-naphthyl)-N″-(substituted phenyl)guanidines as Jack Bean Urease Inhibitors and Free-Radical Scavengers, Synthesis, Kinetics, and Computational Molecular Modeling Studies. ACS Omega 2017. [Google Scholar] [CrossRef]
  18. Channar, P.A.; Saeed, A.; Larik, F.A.; Sajid Rashid, S.; Iqbal, Q.; Rozi, M.; Younis, S.; Mahar, J. Design and synthesis of 2,6-di(substituted phenyl)thiazolo[3,2-b]-1,2,4-triazoles as a-glucosidase and a-amylase inhibitors, co-relative Pharmacokinetics and 3D QSAR and risk analysis. Biomed. Pharmacother. 2017, 94, 499–513. [Google Scholar] [CrossRef] [PubMed]
  19. Hameed, A.; Khan, K.M.; Zehra, S.T.; Ahmed, R.; Shafiq, Z.; Bakht, S.M.; Yaqub, M.; Hussain, M.; de León, A.D.L.V.; Furtmann, N.; et al. Synthesis, biological evaluation and molecular docking of N-phenyl thiosemicarbazones as urease inhibitors. Bioorg. Chem. 2015, 61, 51–57. [Google Scholar] [CrossRef] [PubMed]
  20. Muri, E.M.F.; Mishra, H.; Avery, M.A.; Williamson, J.S. Design and synthesis of heterocyclic hydroxamic acid derivatives as inhibitors of Helicobacter pylori urease. Synth. Commun. 2003, 33, 1977–1995. [Google Scholar] [CrossRef]
  21. Gadad, A.K.; Mahajanshetti, C.S.; Nimbalkar, S.; Raichurkar, A. Synthesis and antibacterial activity of some 5-guanylhydrazone/thiocyanato-6-arylimidazo[2,1-b]-1,3,4-thiadiazole-2-sulfonamide derivatives. Eur. J. Med. Chem. 2000, 9, 853–857. [Google Scholar] [CrossRef]
  22. Mojzych, M.; Bielawska, A.; Bielawski, K.; Ceruso, M.; Supuran, C.T. Pyrazolo [4,3-e][1,2,4] triazine sulfonamides as carbonic anhydrase inhibitors with antitumor activity. Bioorg. Med. Chem. 2014, 22, 2643–2647. [Google Scholar] [CrossRef] [PubMed]
  23. Zani, F.; Vicini, P. Antimicrobial activity of some 1,2-benzisothiazoles having a benzenesulfonamide moiety. Arch. Pharm. 1998, 331, 219–223. [Google Scholar] [CrossRef]
  24. Brzozowski, Z.; Sławinski, J.; Saczewski, F.; Innocenti, A.; Supuran, C.T. Carbonic anhydrase inhibitors: Synthesis and inhibition of the human cytosolic isozymes I and II and transmembrane isozymes IX, XII (cancer-associated) and XIV with 4-substituted 3-pyridinesulfonamides. Eur. J. Med. Chem. 2010, 45, 2396–2404. [Google Scholar] [CrossRef] [PubMed]
  25. Renzi, G.; Scozzafava, A.; Supuran, C.T. Carbonic anhydrase inhibitors: Topical sulfonamide antiglaucoma agents incorporating secondary amine moieties. Bioorg. Med. Chem. Lett. 2000, 10, 673–676. [Google Scholar] [CrossRef]
  26. Noreen, M.; Rasool, N.; Gull, Y.; Zubair, M.; Mahmood, T.; Ayub, K.; Nasim, F.U.H.; Yaqoob, A.; Zia-Ul-Haq, M.; ade Feo, V. Synthesis, density functional theory (DFT), urease inhibition and antimicrobial activities of 5-aryl thiophenes bearing sulphonylacetamide moieties. Molecules 2015, 20, 19914–19928. [Google Scholar] [CrossRef] [PubMed]
  27. Noreen, M.; Rasool, N.; Gull, Y.; Zahoor, A.F.; Yaqoob, A.; Kousar, S.; Zubair, M.; Bukhari, I.H.; Rana, U.A. A facile synthesis of new 5-aryl-thiophenes bearing sulfonamide moiety via Pd (0)-catalyzed Suzuki–Miyaura cross coupling reactions and 5-bromothiophene-2-acetamide: As potent urease inhibitor, antibacterial agent and hemolytically active compounds. J. Saudi Chem. Soc. 2017, 21, 403–414. [Google Scholar] [CrossRef]
  28. Mojzych, M.; Tarasiuk, P.; Kotwica-Mojzych, K.; Rafiq, M.; Seo, S.Y.; Nicewicz, M.; Fornal, E. Synthesis of chiral pyrazolo [4,3-e][1,2,4] triazine sulfonamides with tyrosinase and urease inhibitory activity. J. Enzyme Inhibit. Med. Chem. 2017, 32, 99–105. [Google Scholar] [CrossRef] [PubMed]
  29. Mobley, H.L.; Hausinger, R.P. Microbial ureases: Significance, regulation, and molecular characterization. Microbiol. Rev. 1989, 53, 85–108. [Google Scholar] [PubMed]
  30. Krajewska, B.; Ureases, I. Functional, catalytic and kinetic properties: A review. J. Mol. Catal. B Enzym. 2009, 59, 9–21. [Google Scholar] [CrossRef]
  31. Schreiber, S.L. Target-oriented and diversity-oriented organic synthesis in drug discovery. Science 2000, 287, 1964–1969. [Google Scholar] [CrossRef] [PubMed]
  32. Supuran, C.T.; Casini, A.; Scozzafava, A. Protease inhibitors of the sulfonamide type: Anticancer, antiinflammatory, and antiviral agents. Med. Res. Rev. 2003, 23, 535–558. [Google Scholar] [CrossRef] [PubMed]
  33. Greenbaum, D.C.; Mackey, Z.; Hansell, E.; Doyle, P.; Gut, J.; Caffrey, C.R.; Lehrman, J.; Rosenthal, P.J.; McKerrow, J.H.; Chibale, K. Synthesis and structure—Activity relationships of parasiticidal thiosemicarbazone cysteine protease inhibitors against Plasmodium falciparum, Trypanosoma brucei, and Trypanosoma cruzi. J. Med. Chem. 2004, 47, 3212–3219. [Google Scholar] [CrossRef] [PubMed]
  34. Gürsoy, A.; Terzioglu, N.; Ötük, G. Synthesis of some new hydrazide-hydrazones, thiosemicarbazides and thiazolidinones as possible antimicrobials. Eur. J. Med. Chem. 1997, 32, 753–757. [Google Scholar] [CrossRef]
  35. Ertl, P.; Rohde, B.; Selzer, P. Fast Calculation of Molecular Polar Surface Area as a Sum of Fragment-Based Contributions and Its Application to the Prediction of Drug Transport Properties. J. Med. Chem. 2000, 43, 3714–3717. [Google Scholar] [CrossRef] [PubMed]
  36. Ghose, A.K.; Herbertz, T.; Hudkins, R.L.; Dorsey, B.D.; Mallamo, J.P. Knowledge-based, central nervous system (CNS) lead selection and lead optimization for CNS drug discovery. ACS Chem. NeuroSci. 2011, 3, 50–68. [Google Scholar] [CrossRef] [PubMed]
  37. Veber, D.F.; Johnson, S.R.; Cheng, H.-Y.; Smith, B.R.; Ward, K.W.; Kopple, K.D. Molecular properties that influence the oral bioavailability of drug candidates. J. Med. Chem. 2002, 45, 2615–2625. [Google Scholar] [CrossRef] [PubMed]
  38. Kadam, R.; Roy, N. Recent trends in drug-likeness prediction: A comprehensive review of in silico methods. Indian. J. Pharm. Sci. 2007, 69, 609–615. [Google Scholar]
  39. Bakht, M.A.; Yar, M.S.; Abdel-Hamid, S.G.; Al Qasoumi, S.I.; Samad, A. Molecular properties prediction, synthesis and antimicrobial activity of some newer oxadiazole derivatives. Eur. J. Med. Chem. 2010, 45, 5862–5869. [Google Scholar] [CrossRef] [PubMed]
  40. Tian, S.; Wang, J.; Li, Y.; Li, D.; Xu, L.; Hou, T. The application of in silico drug-likeness predictions in pharmaceutical research. Adv. Drug Deliv. Rev. 2015, 86, 2–10. [Google Scholar] [CrossRef] [PubMed]
  41. Jeffrey, G.A. An Introduction to Hydrogen Bonding; Oxford University Press: Oxford, UK, 1997. [Google Scholar]
  42. Patil, R.; Das, S.; Stanley, A.; Yadav, L.; Sudhakar, A.; Varma, A.K. Optimized Hydrophobic Interactions and Hydrogen Bonding at the Target-Ligand Interface Leads the Pathways of Drug-Designing. PLoS ONE 2010, 5, 12029. [Google Scholar] [CrossRef] [PubMed]
  43. Bissantz, C.; Kuhn, B.; Stahl, M.A. Medicinal chemist’s guide to molecular interactions. J. Med. Chem. 2010, 53, 5061–5084. [Google Scholar] [CrossRef] [PubMed]
  44. Saeed, A.; Mahesar, P.A.; Channar, P.A.; Larik, F.A.; Abbas, Q.; Hassan, M.; Raza, H.; Seo, S.Y. Hybrid Pharmacophoric Approach in the Design and Synthesis of Coumarin Linked Pyrazolinyl as Urease Inhibitors, Kinetic Mechanism and Molecular Docking. Chem. Biodivers. 2017. [Google Scholar] [CrossRef] [PubMed]
  45. Saeed, A.; Channar, P.A.; Larik, F.A.; Abbas, Q.; Hassan, M.; Raza, H.; Seo, S.Y.; Upadhyay, L.B.; Han, Y.; Huo, G.F.; et al. Jack Bean Urease Inhibitors, and Antioxidant Activity Based on Palmitic acid Derived 1-acyl-3-Arylthioureas: Synthesis, Kinetic Mechanism and Molecular Docking Studies. Drug Res. 2012, 11, 381–388. [Google Scholar] [CrossRef] [PubMed]
  46. Saeed, A.; Larik, F.A.; Channar, P.A.; Mehfooz, H.; Ashraf, M.H.; Abbas, Q.; Hassan, M.; Seo, S.Y. An Expedient Synthesis of N-(1-(5-mercapto-4-((substituted benzylidene)amino)-4H-1,2,4-triazol-3-yl)-2-phenylethyl) benzamides as Jack bean Urease inhibitors and free radical scavengers; kinetic mechanism and molecular docking studies. Chem. Biol. Drug Des. 2017. [Google Scholar] [CrossRef] [PubMed]
  47. Saeed, A.; Sajid, R.; Channar, P.A.; Larik, F.A.; Qamar, A.; Hussain, M.; Raza, U.; Flörke, U.; Sung, Y.S. Long Chain 1-Acyl-3-arylthioureas as Jack Bean Urease Inhibitors, Synthesis, Kinetic Mechanism and Molecular Docking Studies. J. Taiwan Inst. Chem. Eng. 2017, 77, 54–63. [Google Scholar] [CrossRef]
  48. Arshad, N.; Perveen, F.; Saeed, A.; Channar, P.A.; Farooqi, S.I.; Larik, F.A.; Ismail, H.; Mirza, B. Spectroscopic, molecular docking and structural activity studies of (E)-N′-(substituted benzylidene/methylene) isonicotinohydrazide derivatives for DNA binding and their biological screening. J. Mol. Struct. 2017, 1139, 371–380. [Google Scholar] [CrossRef]
  49. Mehfooz, H.; Saeed, A.; Sharma, A.; Albericio, F.; Larik, F.A.; Jabeen, F.; Channar, P.A.; Flörke, U. Dual Inhibition of AChE and BChE with the C-5 Substituted Derivative of Meldrum’s Acid: Synthesis, Structure Elucidation, and Molecular Docking Studies. Crystals 2017, 7. [Google Scholar] [CrossRef]
  50. Gioiello, A.; Rosatelli, E.; Teofrasti, M.; Filipponi, P.; Pellicciari, R. Building a sulfonamide library by eco-friendly flow synthesis. ACS Comb. Sci. 2013, 15, 235–239. [Google Scholar] [CrossRef] [PubMed]
  51. Larik, F.A.; Saeed, A.; Channar, P.A.; Ismail, H.; Dilshad, E.; Mirza, B. New 1-octanoyl-3-aryl thiourea derivatives: Solvent-free synthesis, characterization and multi-target biological activities. Bangladesh J. Pharmacol. 2016, 11, 894–902. [Google Scholar] [CrossRef]
  52. Pettersen, E.F.; Goddard, T.D.; Huang, C.C.; Couch, G.S.; Greenblatt, D.M.; Meng, E.C.; Ferrin, T.E. UCSF Chimera—A visualization system for exploratory research and analysis. J. Comput. Chem. 2004, 25, 1605–1612. [Google Scholar] [CrossRef] [PubMed]
  53. Chen, V.B.; Arendall, W.B.; Headd, J.J.; Keedy, D.A.; Immormino, R.M.; Kapral, G.J.; Murray, L.W.; Richardson, J.S.; Richardson, D.C. MolProbity: All-atom structure validation for macromolecular crystallography. Acta Crystallogr. Sect. D Biol. Crystallogr. 2010, 66, 12–21. [Google Scholar] [CrossRef] [PubMed]
  54. Accelrys. Studio D; Version 2.1; Accelrys: San Diego, CA, USA, 2008. [Google Scholar]
  55. Willard, L.; Ranjan, A.; Zhang, H.; Monzavi, H.; Boyko, R.F.; Sykes, B.D.; Wishart, D.S. VADAR: A web server for quantitative evaluation of protein structure quality. Nucleic Acids Res. 2003, 31, 3316–3319. [Google Scholar] [CrossRef] [PubMed]
  56. Morris, G.M.; Huey, R.; Lindstrom, W.; Sanner, M.F.; Belew, R.K.; Goodsell, D.S.; Olson, A.J. AutoDock4 and AutoDockTools4: Automated docking with selective receptor flexibility. J. Comput. Chem. 2009, 30, 2785–2791. [Google Scholar] [CrossRef] [PubMed]
  57. Pronk, S.; Páll, S.; Schulz, R.; Larsson, P.; Bjelkmar, P.; Apostolov, R.; Shirts, M.R.; Smith, J.C.; Kasson, P.M.; van der Spoel, D.; et al. GROMACS 4.5: A high-throughput and highly parallel open source molecular simulation toolkit. Bioinformatics 2013, 29, 845–854. [Google Scholar] [CrossRef] [PubMed]
  58. Chiu, S.W.; Pandit, S.A.; Scott, H.L.; Jakobsson, E. An improved united atom force field for simulation of mixed lipid bilayers. J. Phys. Chem. B 2009, 113, 2748–2763. [Google Scholar] [CrossRef] [PubMed]
  59. Kleywegt, G.J. Crystallographic refinement of ligand complexes. Acta Crystallogr. Sect. D Biol. Crystallogr. 2007, 63, 94–100. [Google Scholar] [CrossRef] [PubMed]
  60. Wang, H.; Dommert, F.; Holm, C. Optimizing working parameters of the smooth particle mesh Ewald algorithm in terms of accuracy and efficiency. J. Chem. Phys. 2010, 133, 034117. [Google Scholar] [CrossRef] [PubMed]
  61. Amiri, S.; Sansom, M.S.; Biggin, P.C. Molecular dynamics studies of AChBP with nicotine and carbamylcholine: The role of water in the binding pocket. Protein Eng. Des. Sel. 2007, 20, 353–359. [Google Scholar] [CrossRef] [PubMed]
Figure 1. Structures of some synthetic potential urease inhibitor molecules.
Molecules 22 01352 g001
Scheme 1. Synthesis of ciprofloxacin-appended sulfonamide derivatives 3a3f, sulfadiazine drug derivatives 6a6f, amantadine-linked sulfonamides 9a9f and thiosemicarbazide sulfonamide derivatives 12a12f.
Molecules 22 01352 sch001
Figure 2. Double reciprocal plot for inhibition of urease in the existence of inhibitor 3e: (A) Doses of 3e were 0.025, 0.05, 0.01 and 0.02 µM. Substrate urea concentrations were 100, 50, 25, 12.5, 6.25 and 3.125 mM; (B) The graph indicates the plot of the slope (C) the vertical intercepts versus inhibitor 3e concentrations to determine inhibition constants. Double reciprocal plot plots for inhibition of urease in the presence of Compound 6a: (A) Concentrations of 6a were 0.00, 0.0011, 0.0022 and 0.0044 µM. Substrate urea concentrations were 100, 50, 25, 12.5, 6.25, and 3.125 mM; (B) The insets represent the plot of the slope (C) the vertical intercepts versus inhibitor 6a concentrations to determine inhibition constants. Lineweaver–Burk plots for inhibition of urease in the presence of Compound 9e: (A) Concentrations of 9e were 0.00, 0.015, 0.03 and 0.06 µM. Substrate urea concentrations were 100, 50, 25, 12.5, 6.25, and 3.125 mM; (B) The insets represent the plot of the slope. Lineweaver–Burk plots for inhibition of urease in the presence of Compound 12d: (A) Concentrations of 12d were 0.013, 0.026, 0.052, 0.104 and 0.208 µM. Substrate urea concentrations were 100, 50, 25, 12.5, 6.25 and 3.125 mM; (B) The insets represent the plot of the slope (C) the vertical intercepts versus inhibitor 12d concentrations to determine inhibition constants.
Molecules 22 01352 g002
Figure 3. The graphical depiction of docking energy values.
Molecules 22 01352 g003
Figure 4. Binding pocket of urease with binding position of the four best synthesized compounds are illustrated in the center. The individual docking results of the best four compounds are labelled in the surrounding circles. In all docking complexes the urease protein is labelled in gray color, with interior color olive drab while the interacting residues are mentioned in purple color. The most active and potent compound 6a in the docking complex is shown in khaki color, while the other compounds (3e, 9e and 12d) are represented in salmon, coral and sea green, respectively. The sulfur group in all compounds is highlighted in yellow, while the oxygen and amino groups are represented in red and blue, respectively.
Molecules 22 01352 g004
Figure 5. Radius of gyration (Rg) graphs of 3e, 6a, 9e and 12d docked complexes are indicated in purple, red, green and blue colors, respectively, on a 0–10,000 ps time scale.
Molecules 22 01352 g005
Table 1. The inhibitory effect of sulfonamide based drug series on urease (jack bean) activity.
CompoundUrease ActivityCompoundUrease Activity
IC50 ± SEM (µM)IC50 ± SEM (µM)
3a0.081 ± 0.0039a0.2888 ± 0.015
3b0.078 ± 0.0039b0.02757 ± 0.001
3c0.110 ± 0.0049c0.01776 ± 0.000
3d0.082 ± 0.0039d0.0533 ± 0.001
3e0.045 ± 0.0019e0.0250 ± 0.000
3f0.073 ± 0.0049f0.0558 ± 0.001
6a0.002 ± 0.00012a0.2254 ± 0.006
6b0.233 ± 0.01112b0.141 ± 0.004
6c0.141 ± 0.00712c0.186 ± 0.007
6d0.095 ± 0.00412d0.026 ± 0.002
6e0.174 ± 0.00912e0.096 ± 0.0040
6f0.127 ± 0.007612f0.067 ± 0.0029
Thiourea17.814 ± 0.096
SME (standard error of the mean).
Table 2. Kinetic parameters of the jack bean urease for urea activity in the presence of different concentrations of 3e, 6a, 9e and 12d.
CodeDose (µM)Vmax (ΔA/Min)Km (mM)Inhibition TypeKi (µM)Ki′ (µM)
3e0.0250.003370.606
0.050.002731.923Mixed-inhibition0.0160.195
0.010.002333.389
0.020.0016325.263
00.02045
6a0.00110.007696.666Mixed-inhibition0.00110.0016
0.00220.004936.896
0.00440.003517.518
00.01144.166
9e0.0150.001274.166Noncompetitive0.0225---
0.030.001084.166
0.060.000854.166
0.0130.002991.754
12d0.0260.002132.439Mixed-inhibition0.0530.125
0.0520.001942.857
0.1040.00163.174
0.2080.0013.773
Vmax = the reaction velocity; Km = Michaelis–Menten constant; Ki =EI dissociation constant; Ki′ = ESI dissociation constant; --- = Not calculated.
Table 3. Physical properties of the synthesized compounds.
Properties3a3b3c3d3e3f6a6b6c6d6e6f9a9b9c9d9e9f12a12b12c12d12e12f
Mol. weight (g/mol)485517547539499531404436466466457418305337367359319351245277307298259291
No. HBA686668686666353335464446
No. HBD121112232222121112454445
Mol. LogP3.52.74.94.33.92.92.31.43.73.73.12.74.33.55.75.14.73.81.10.292.51.81.500.5
Mol. PSA (A2)78.311678787811610214010110110210241804141417973111727373111
Stereo centers000000000000000000000000
Mol. Vol (A3)470479525482491500327335382382336348312321363321333342202212258211224232
Molar Refractivity (cm3)1221241421271271281011021211211061058385104888890626482676768
Surface tension (dyne/cm)697967736776748771717971516257585060658463736177
Density (g/cm3)1.41.61.41.61.41.51.41.61.41.31.61.41.21.41.21.41.21.31.41.61.31.61.31.5
Polarizability (cm3)484956505051404048464242333341353535242532262627
Drug Score0.920.591.070.801.160.46−0.14−0.640.120.130.040.21−0.85−0.61−0.54−0.82−0.30−1.00−0.06−0.010.12−0.390.23−0.70
No. Rotatable bonds566556677766334334455444
Lipinski RuleYesNoNoNoYesNoYesYesYesYesYesYesYesYesYesYesYesYesYesYesYesYesYesYes
HBA: hydrogen bond acceptors; HBD: hydrogen bond donors; PSA: polar surface area.

