Optimization of Time-Weighted Average Air Sampling by Solid-Phase Microextraction Fibers Using Finite Element Analysis Software

 ,
,  ,
,
Abstract

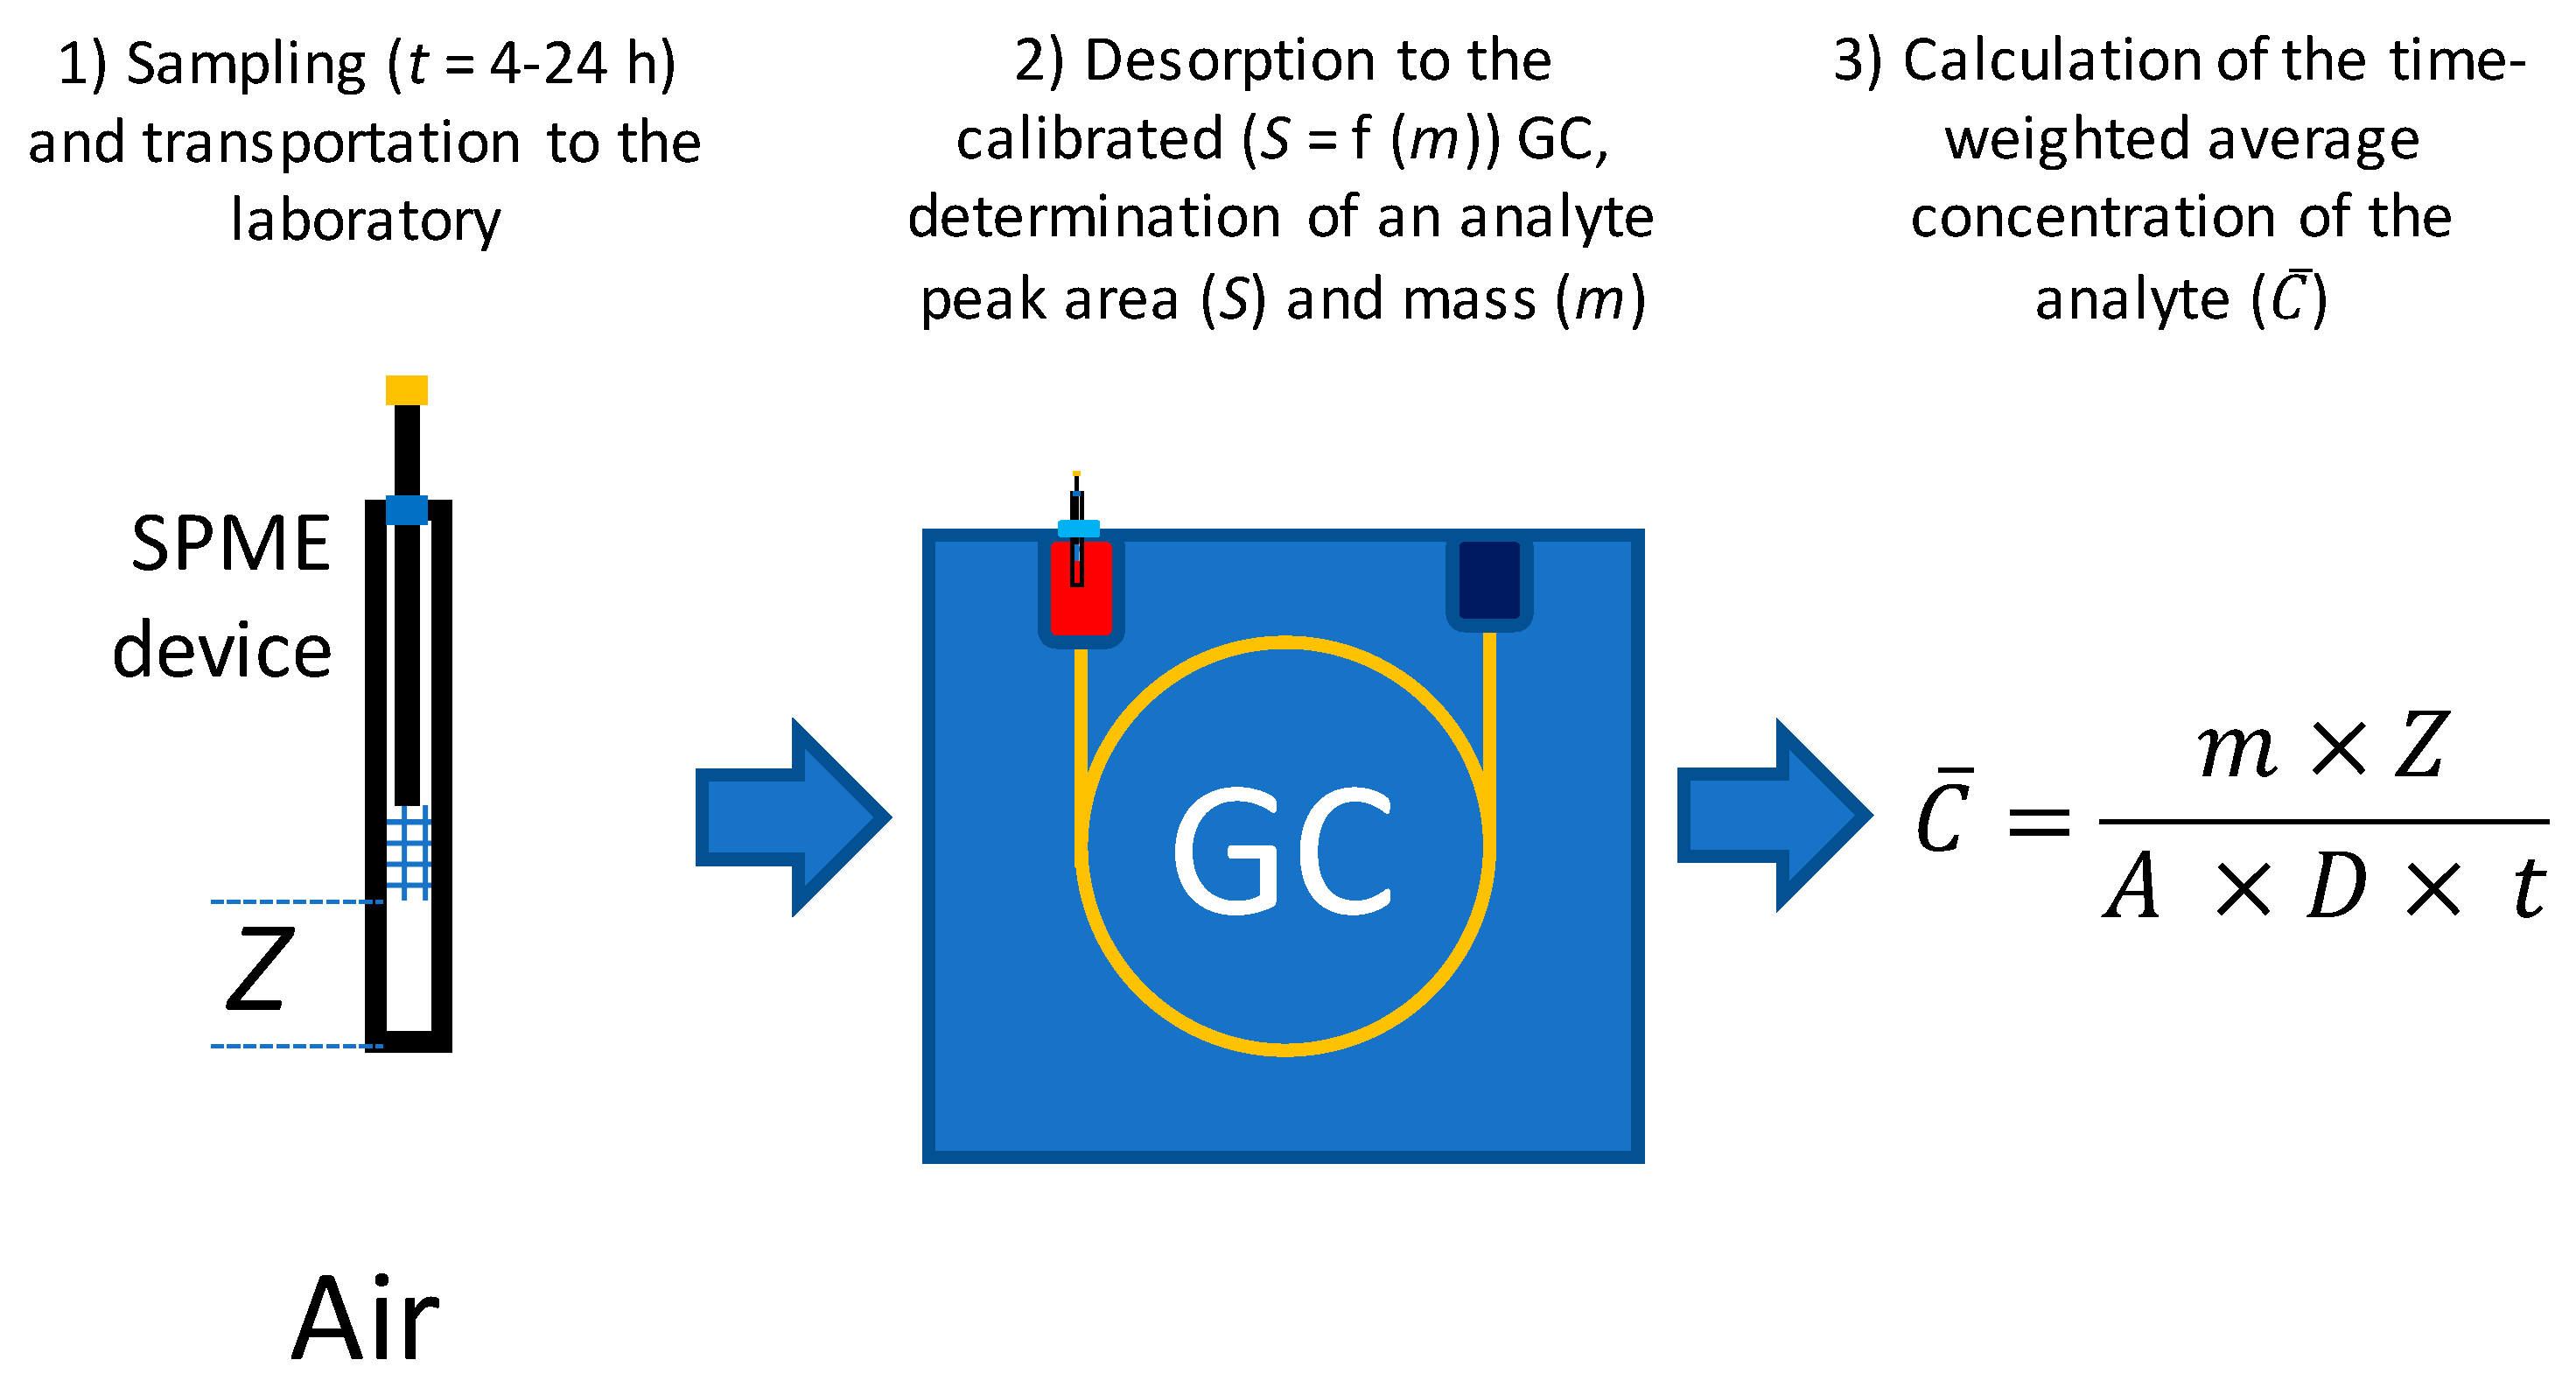
1. Introduction
2. Results and Discussion
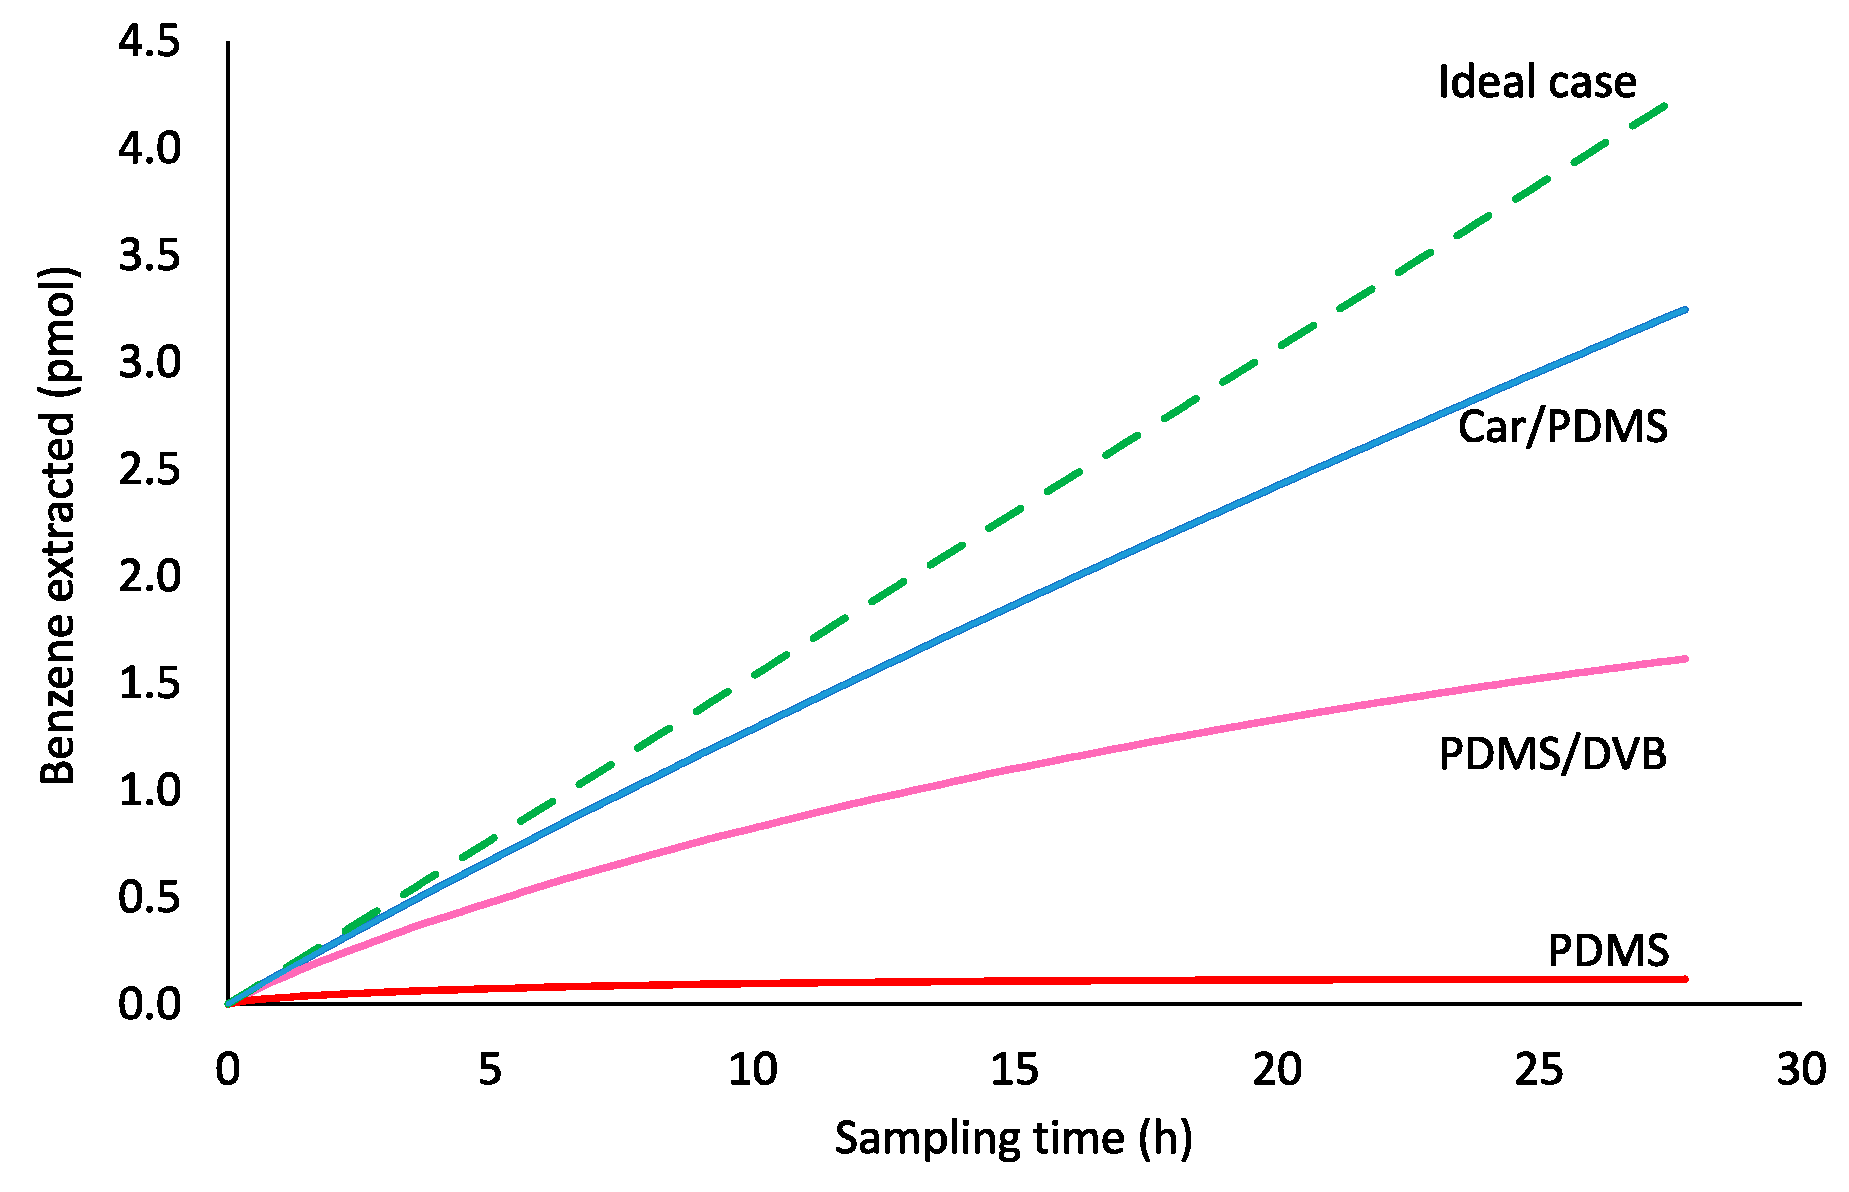
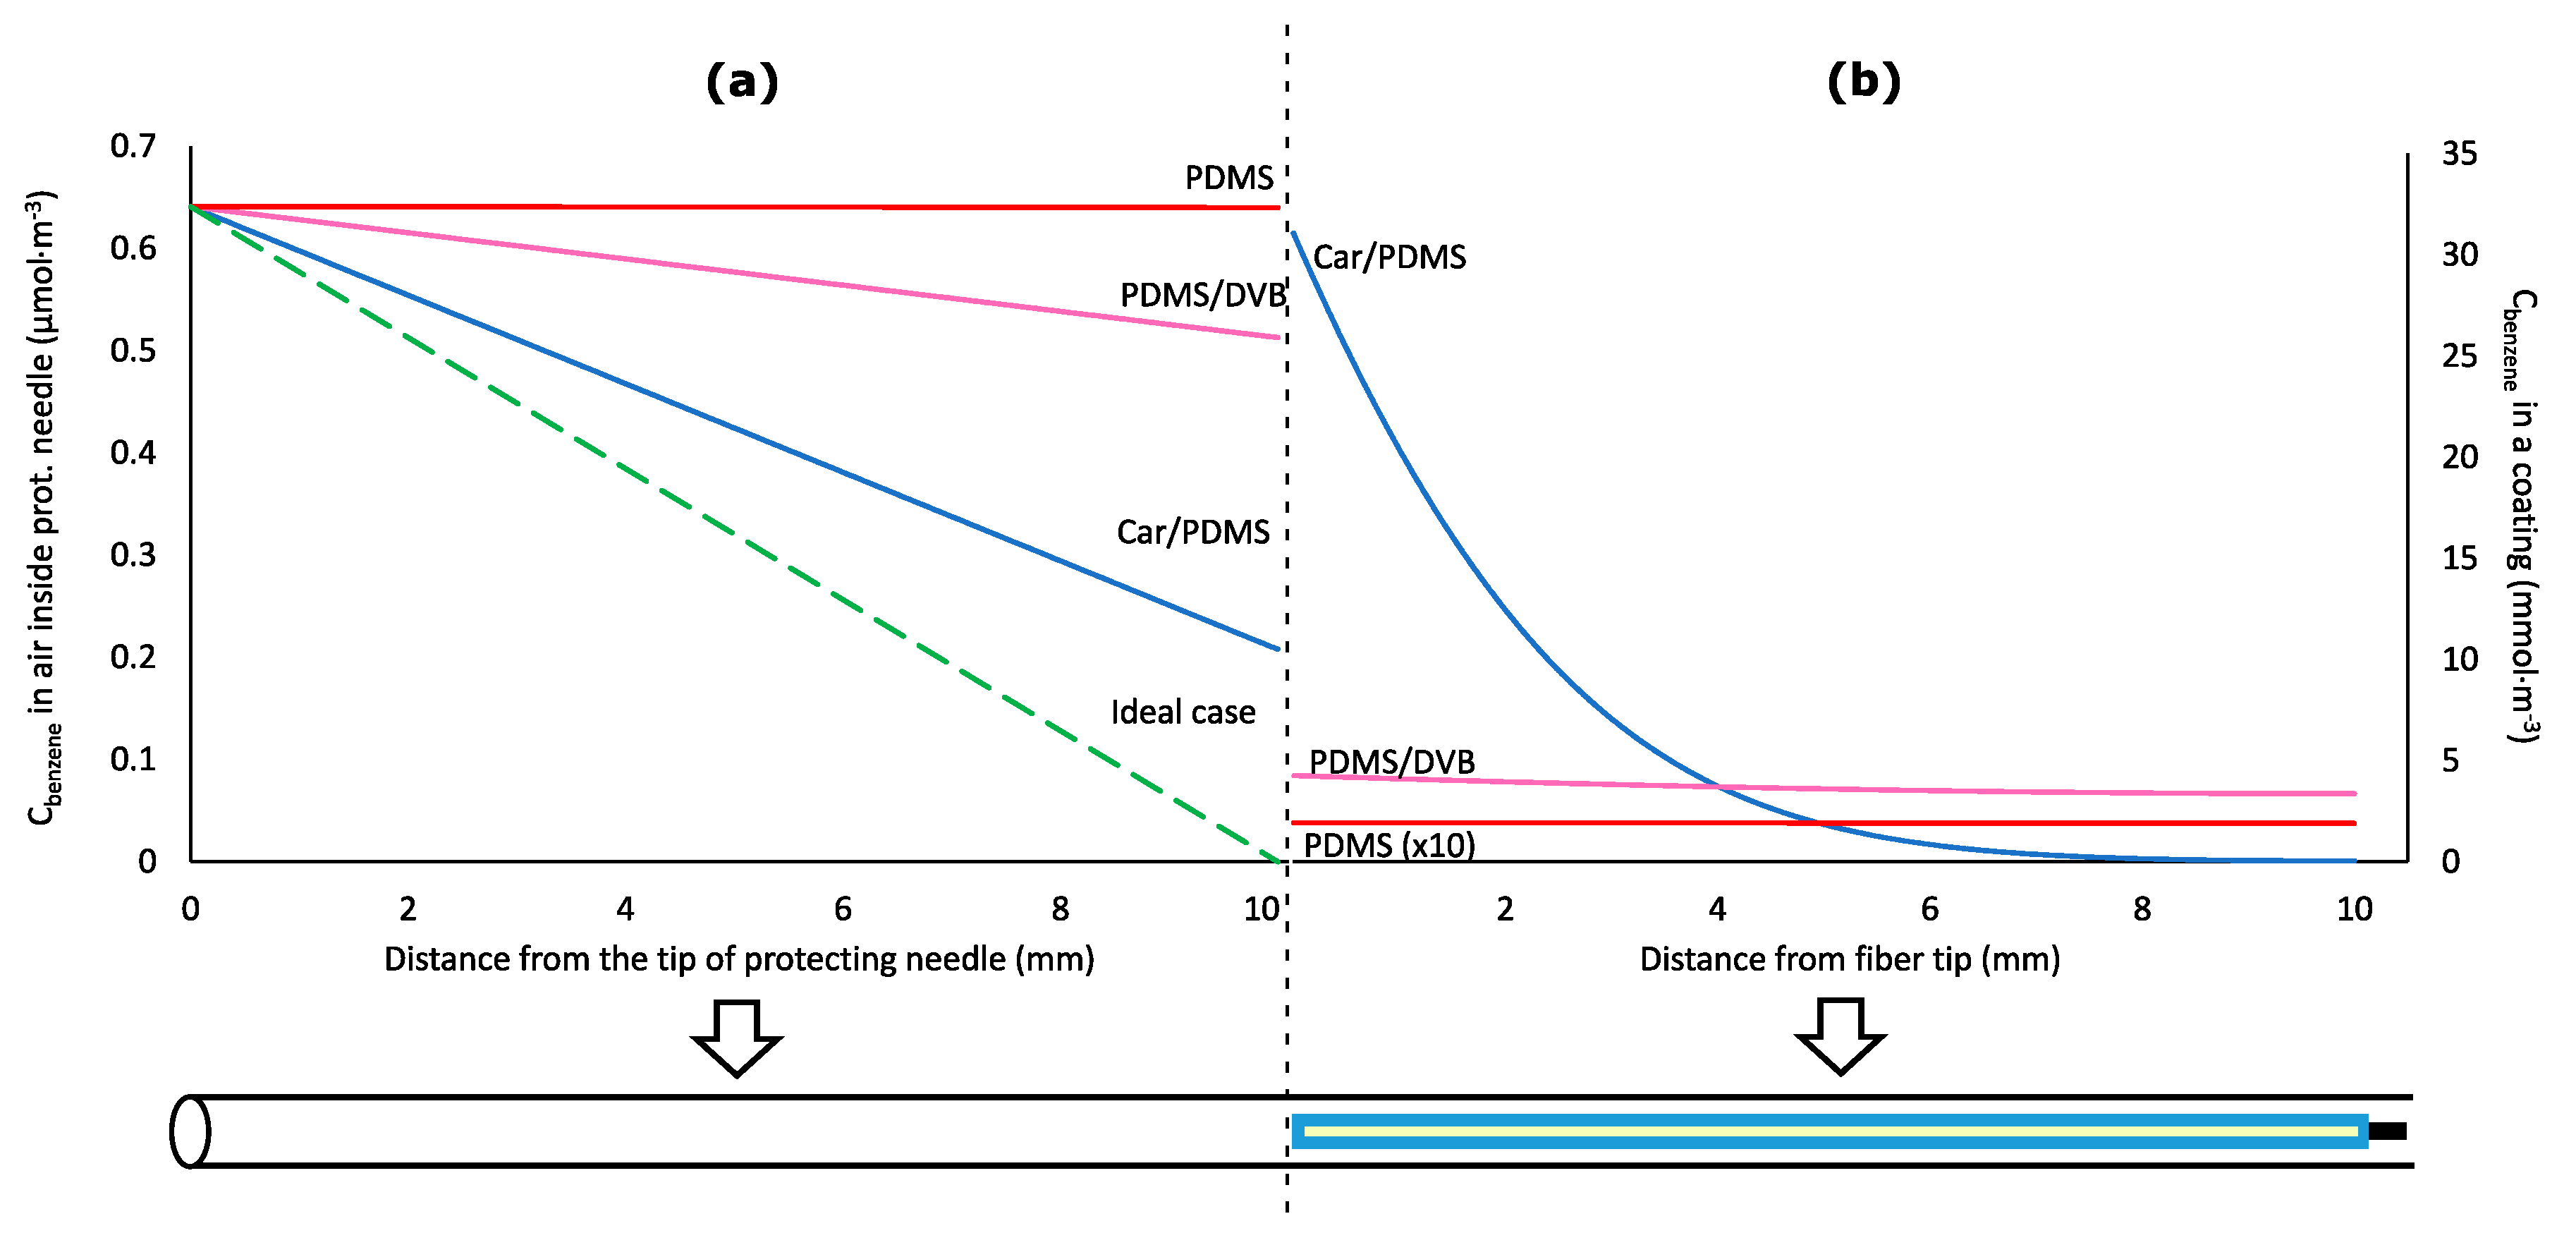
2.1. Time-Weighted Average (TWA) Sampling Profiles of Benzene from Air Using Different Coatings
2.2. Effect of the Diffusion Coefficient and Distribution Constant on Sampling of Analytes by 85-µm Carboxen/Polidimethylsiloxane Coating
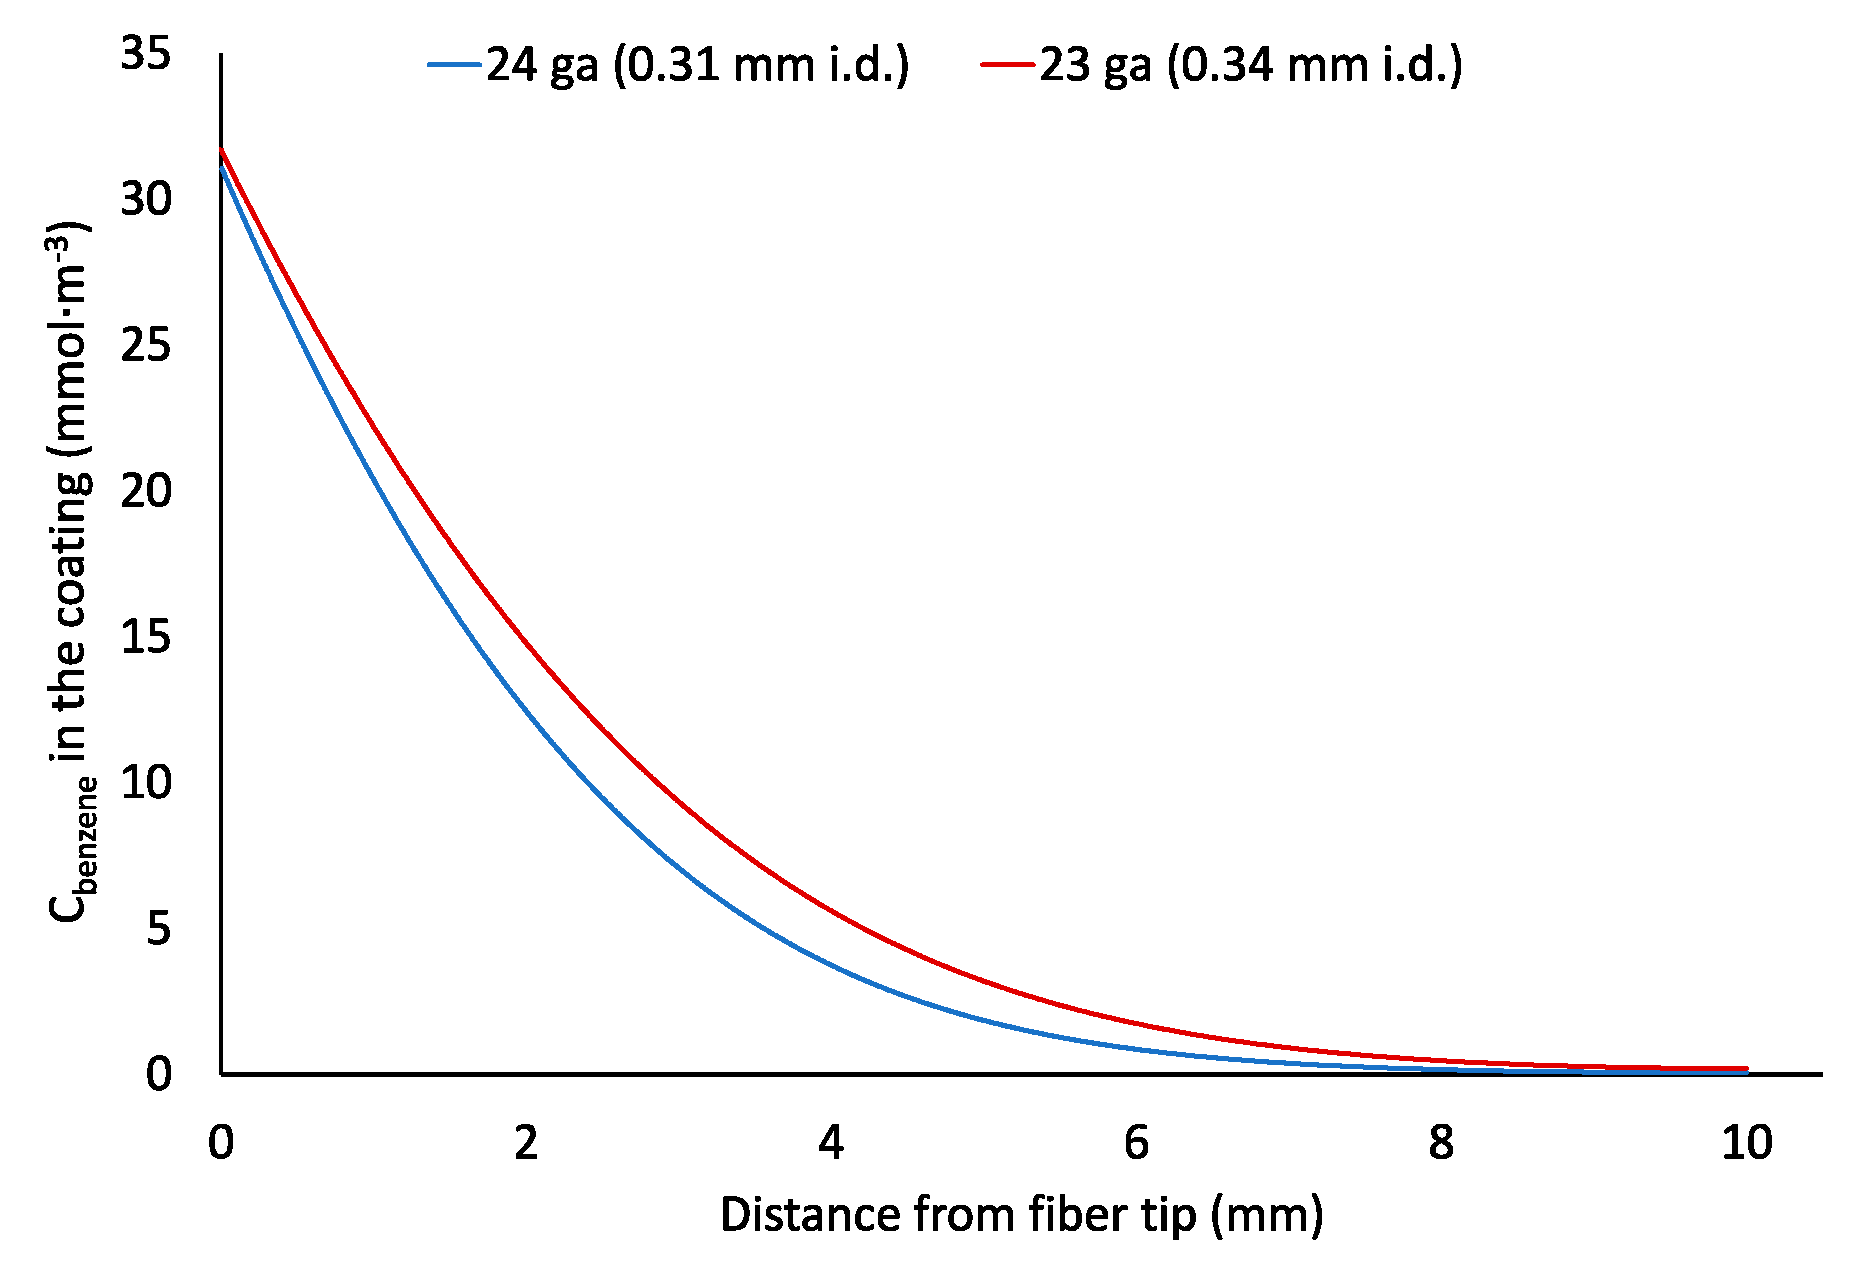
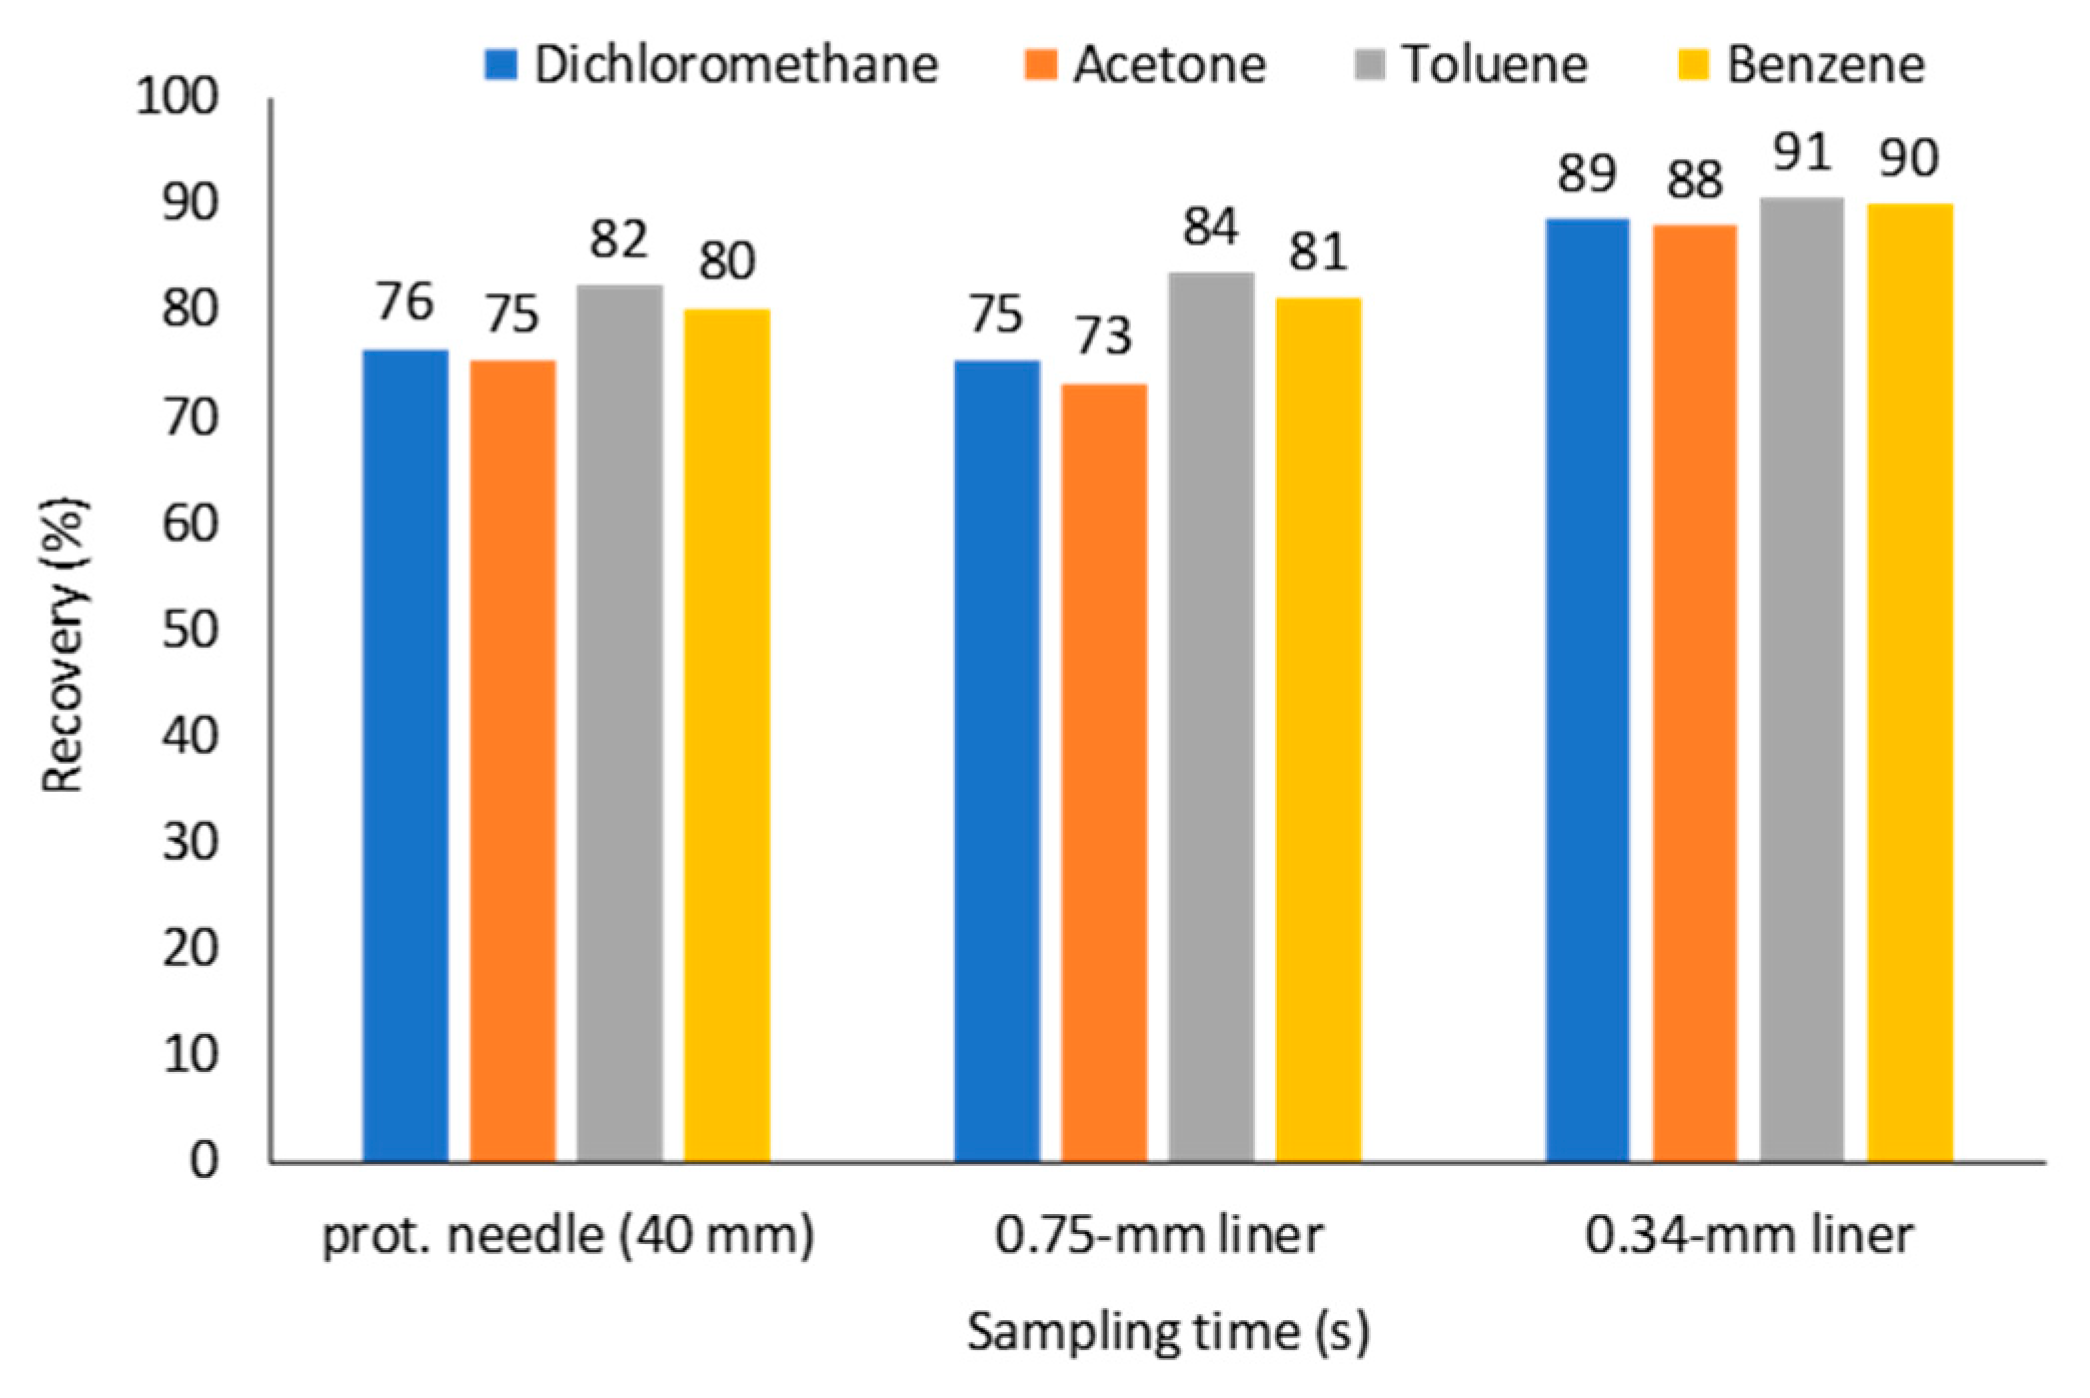
2.3. Effect of a Protecting Needle Gauge Size
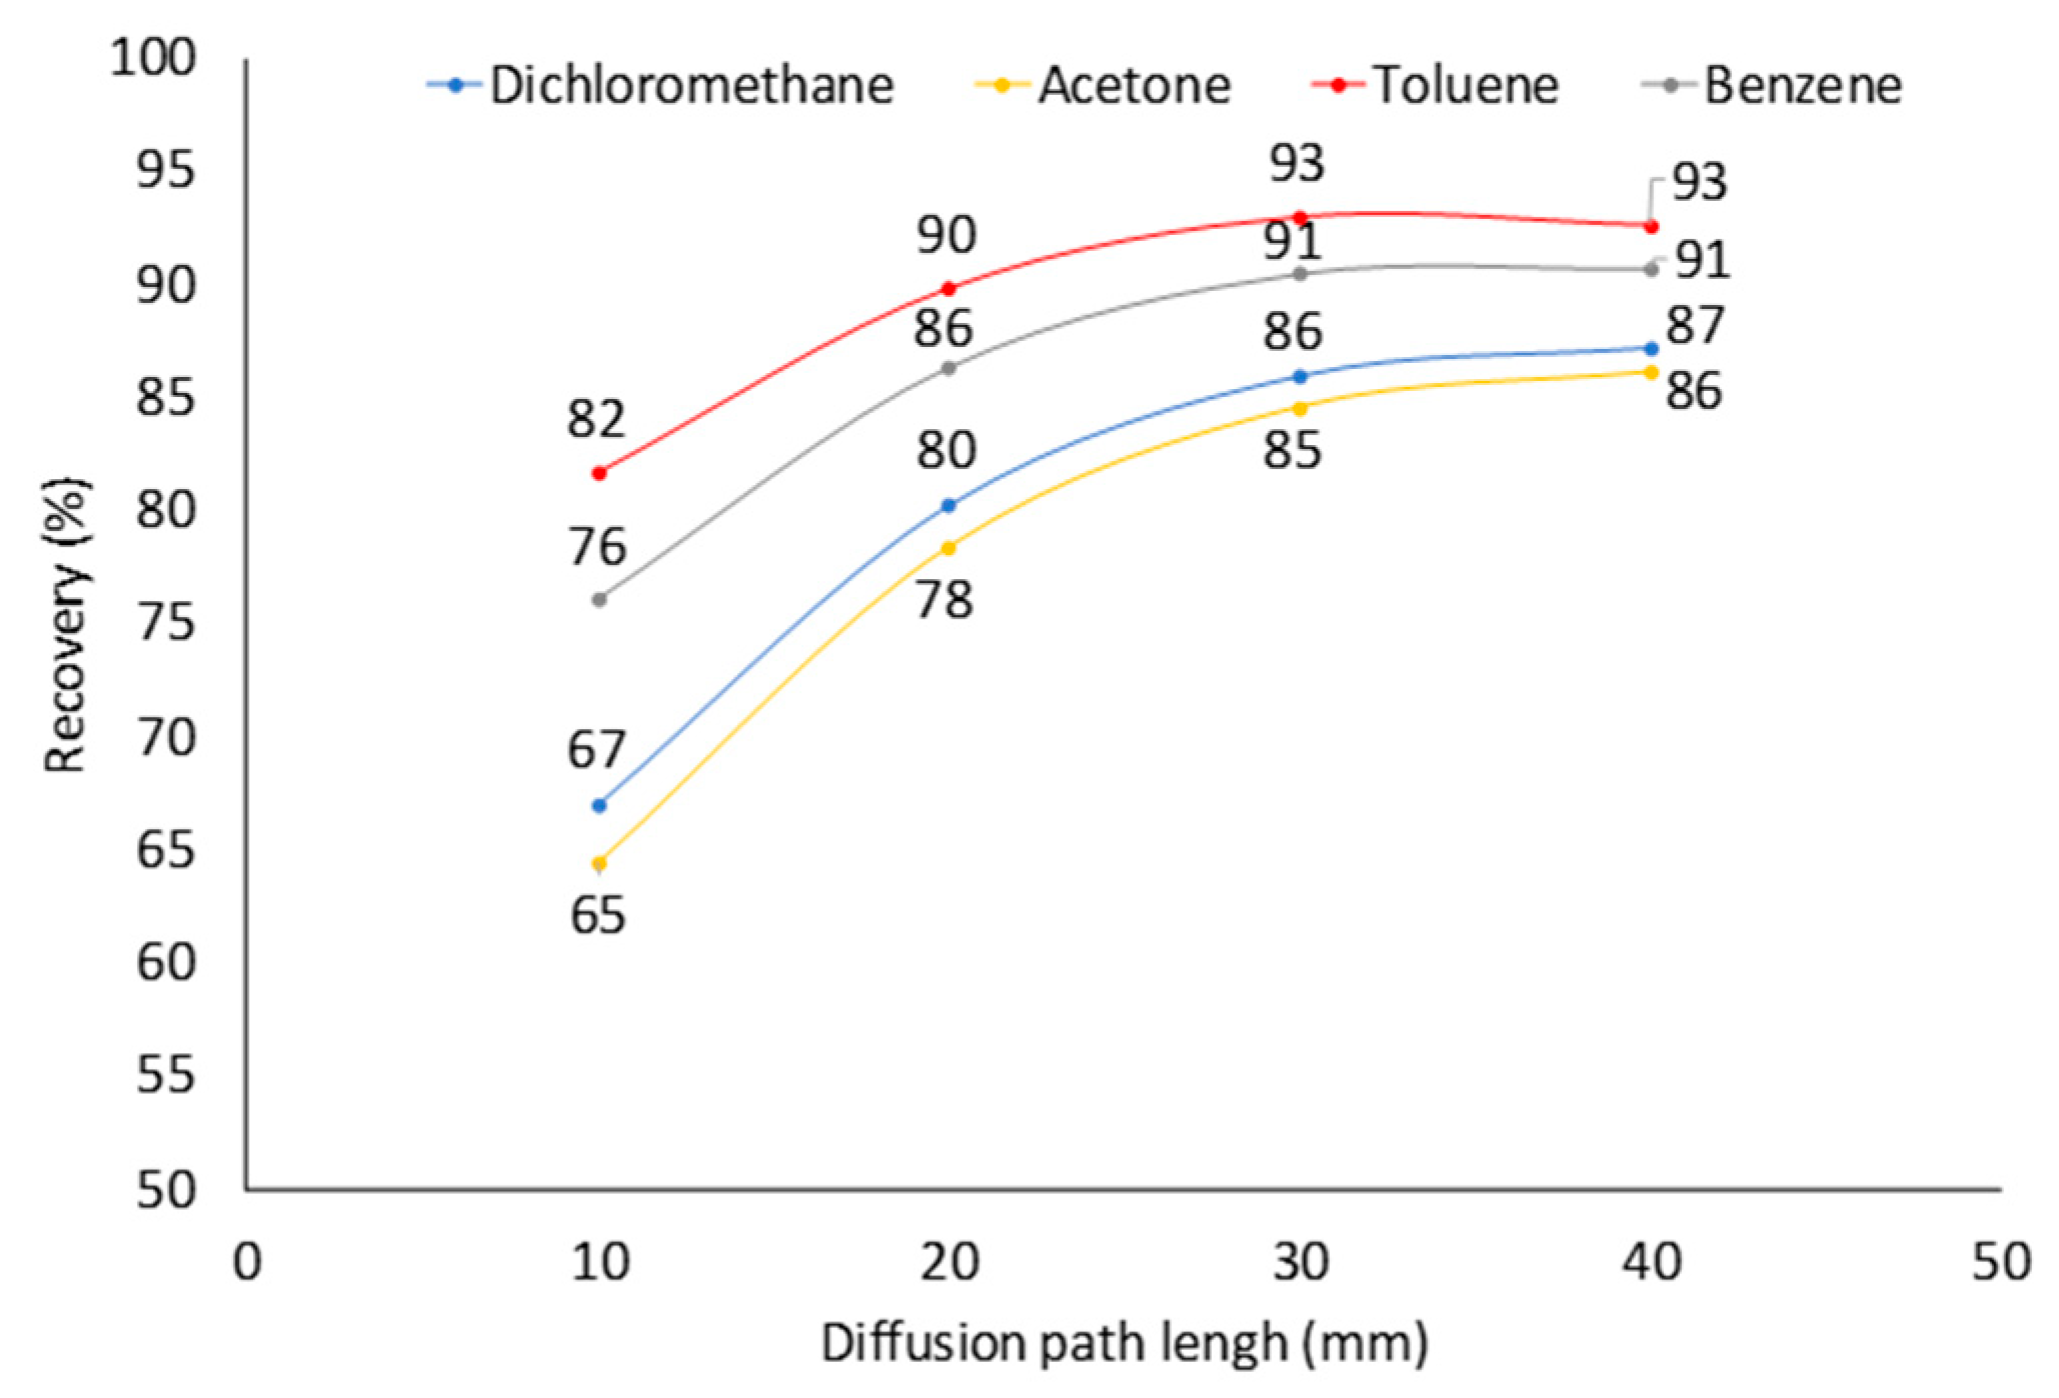
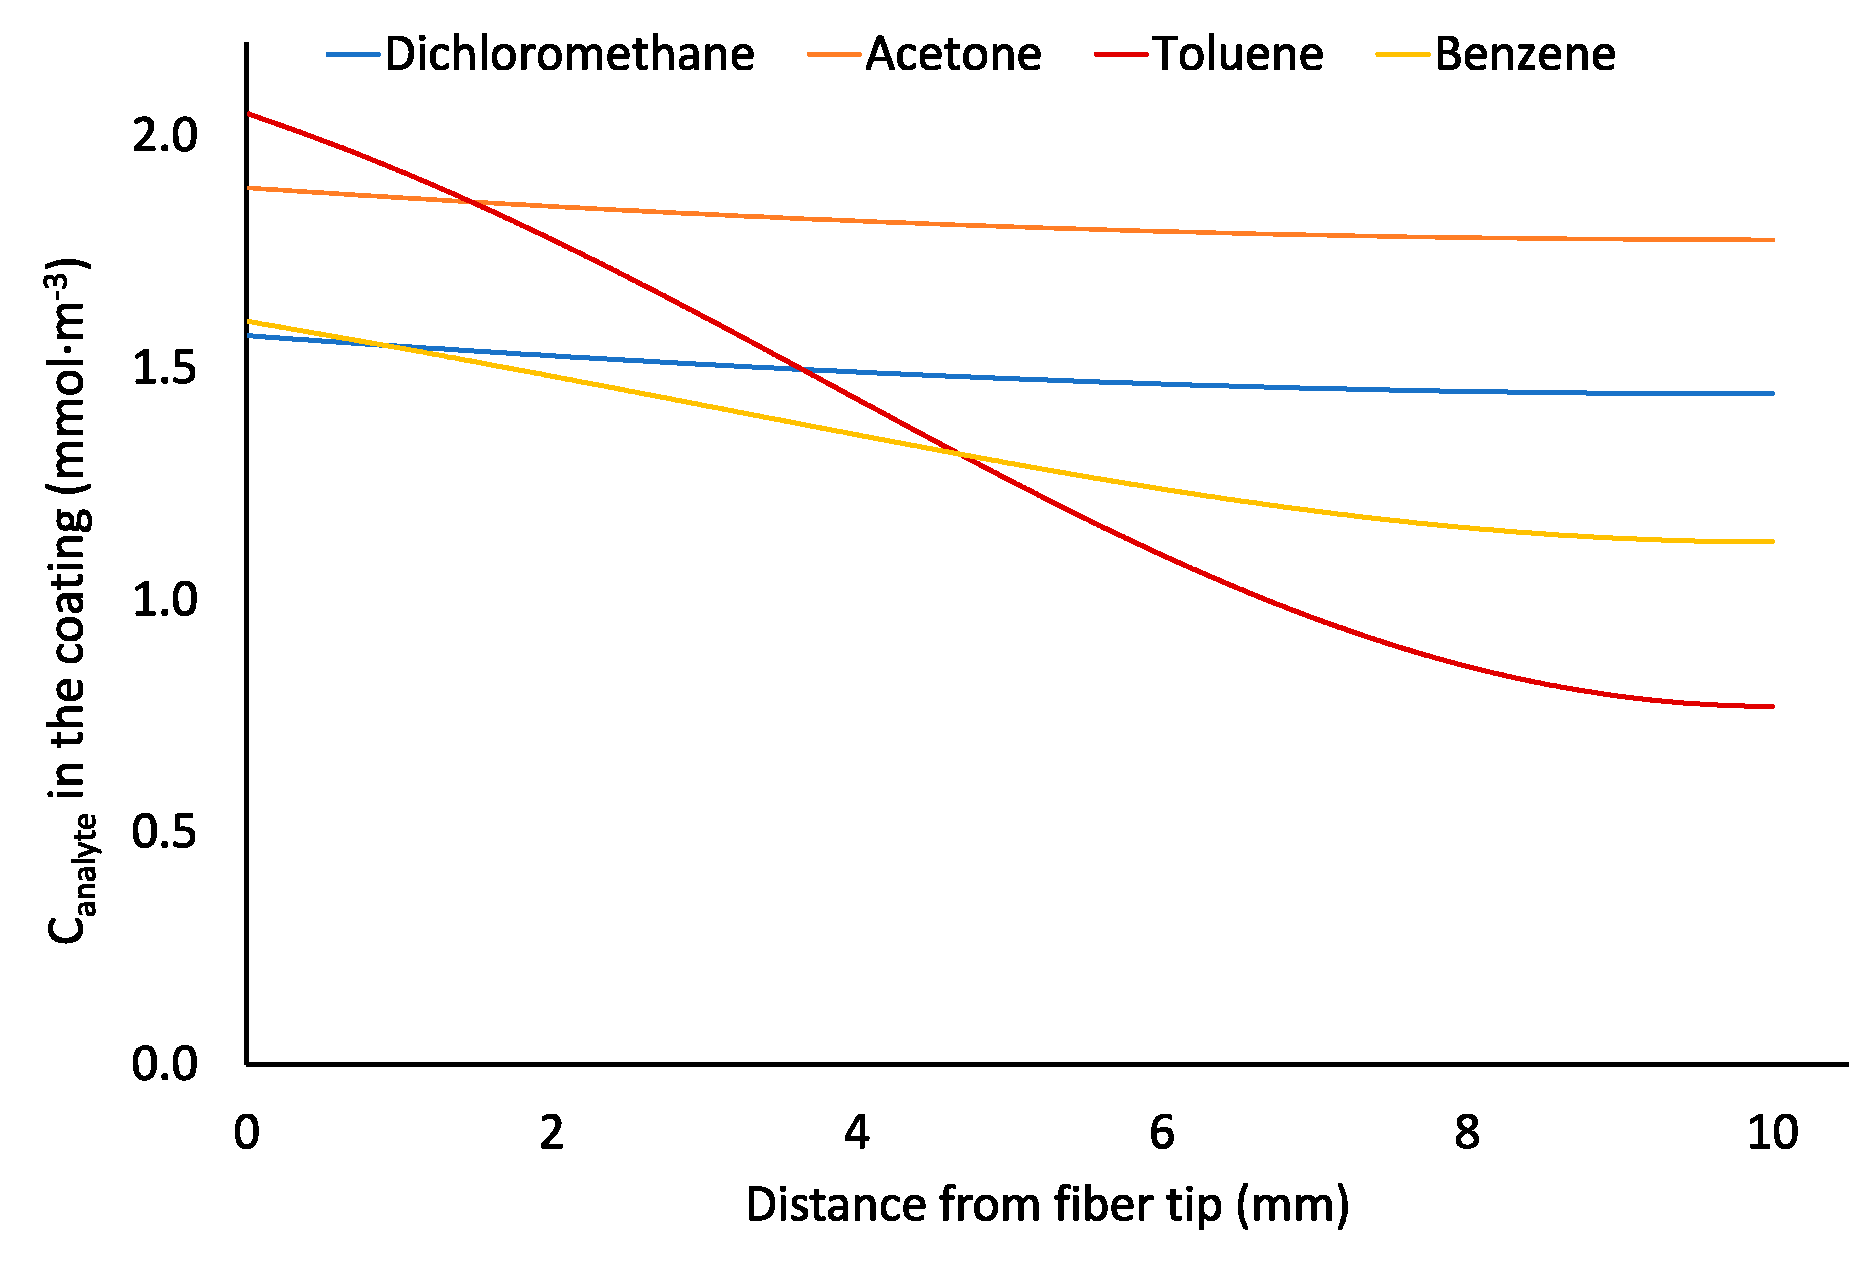
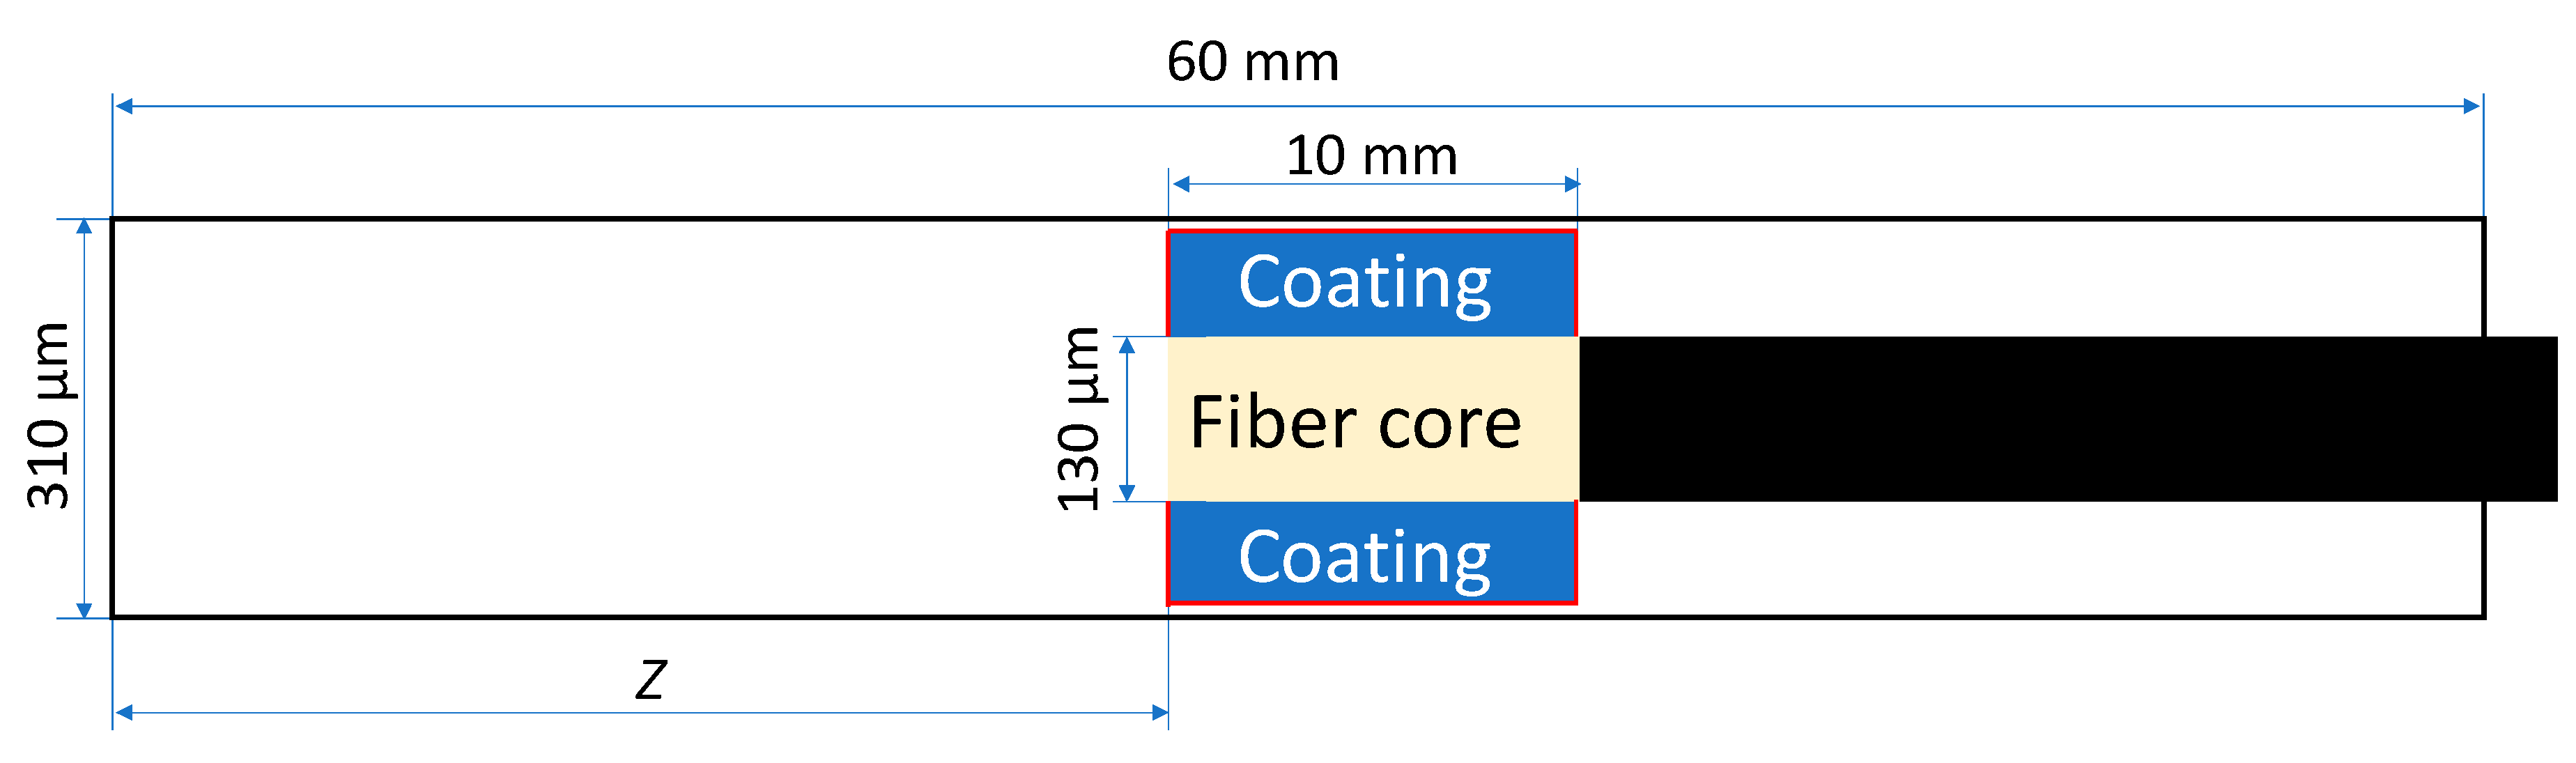
2.4. Effect of Diffusion Path (Z) at Constant Analyte Concentration in Sampled Air
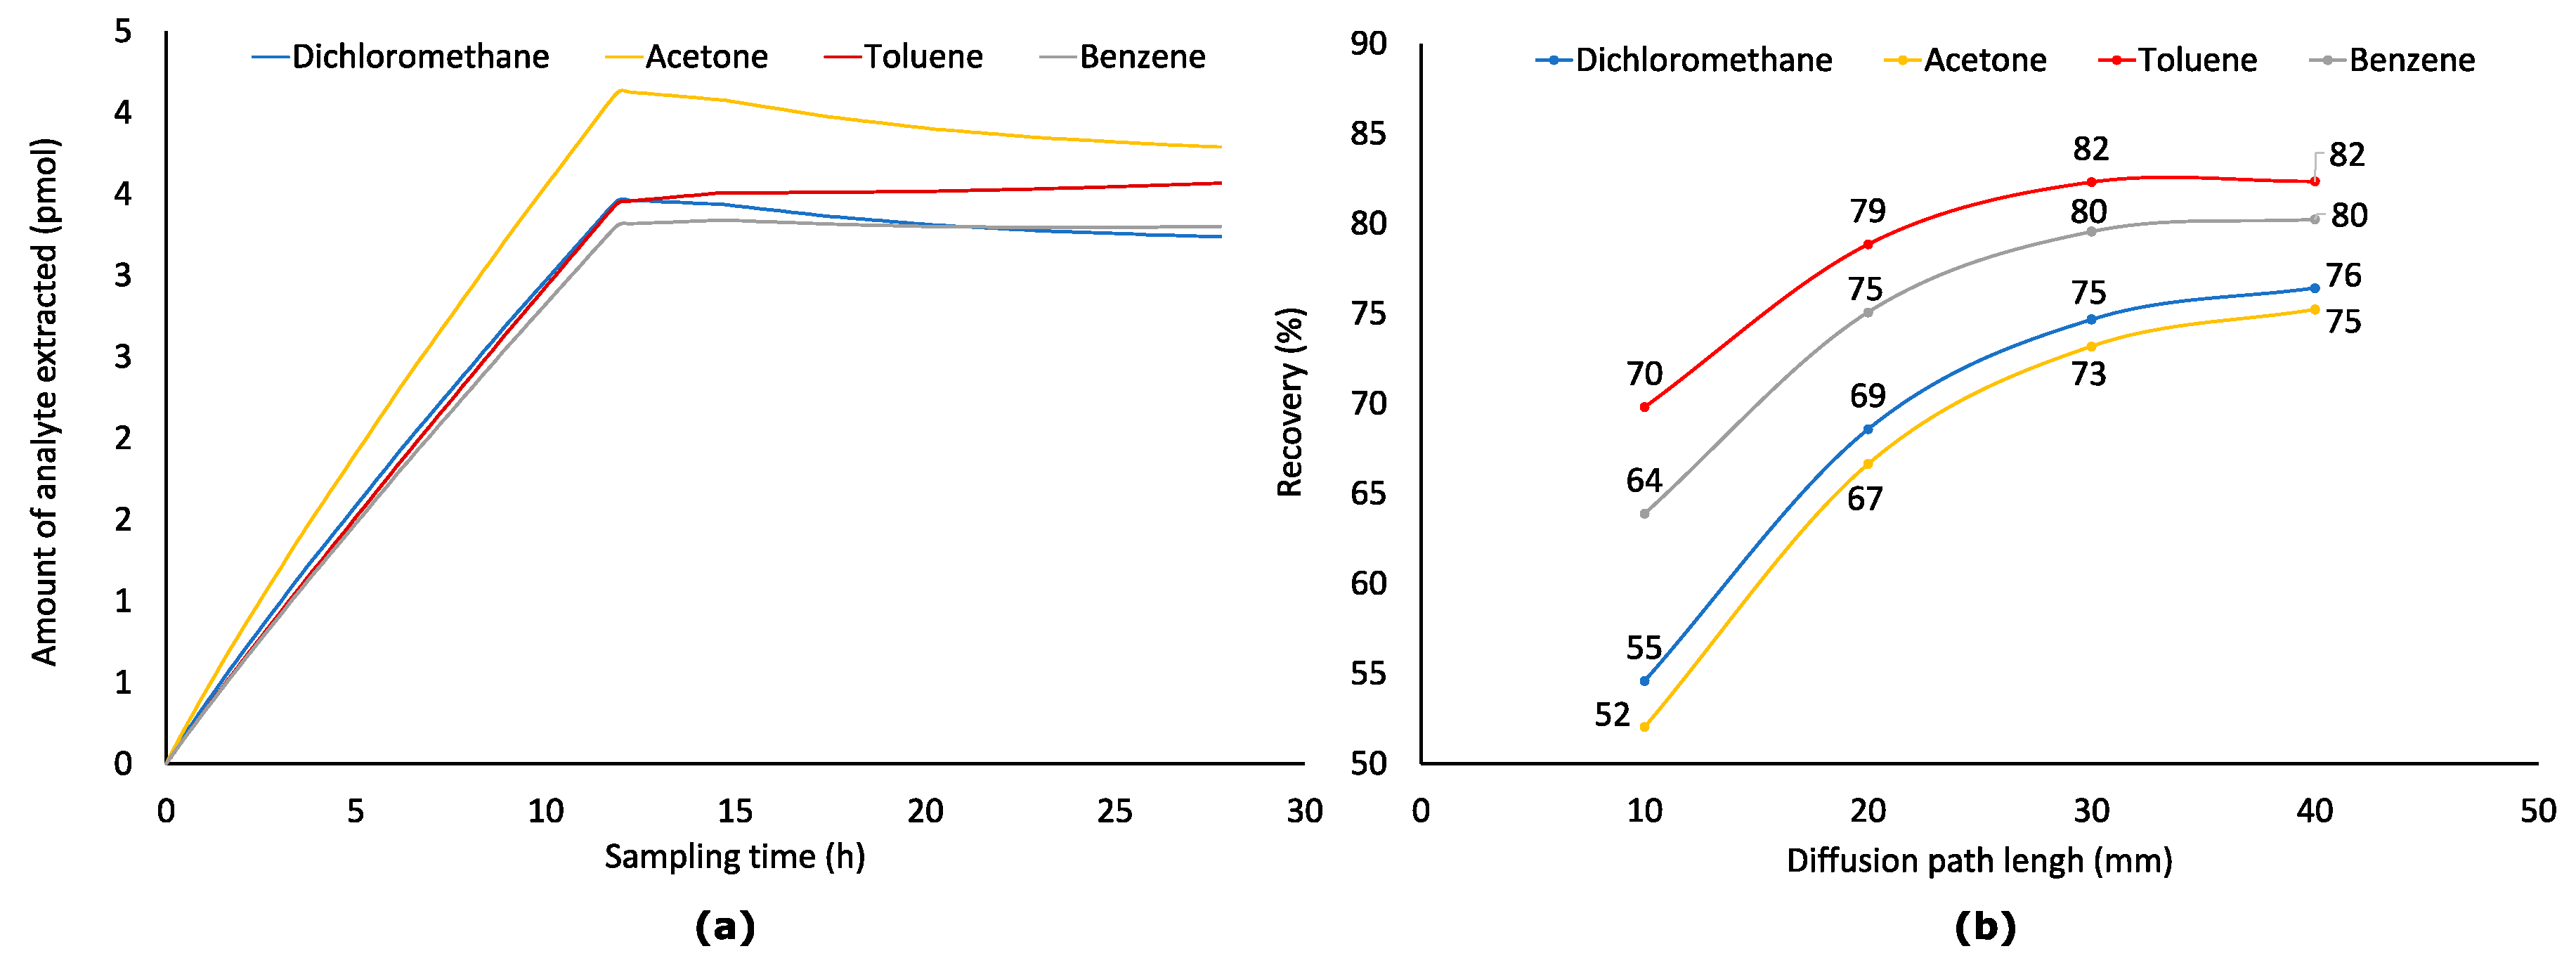
2.5. Effect of Diffusion Path (Z) at Variable Analyte Concentration in Sampled Air (Worst-Case Scenario)
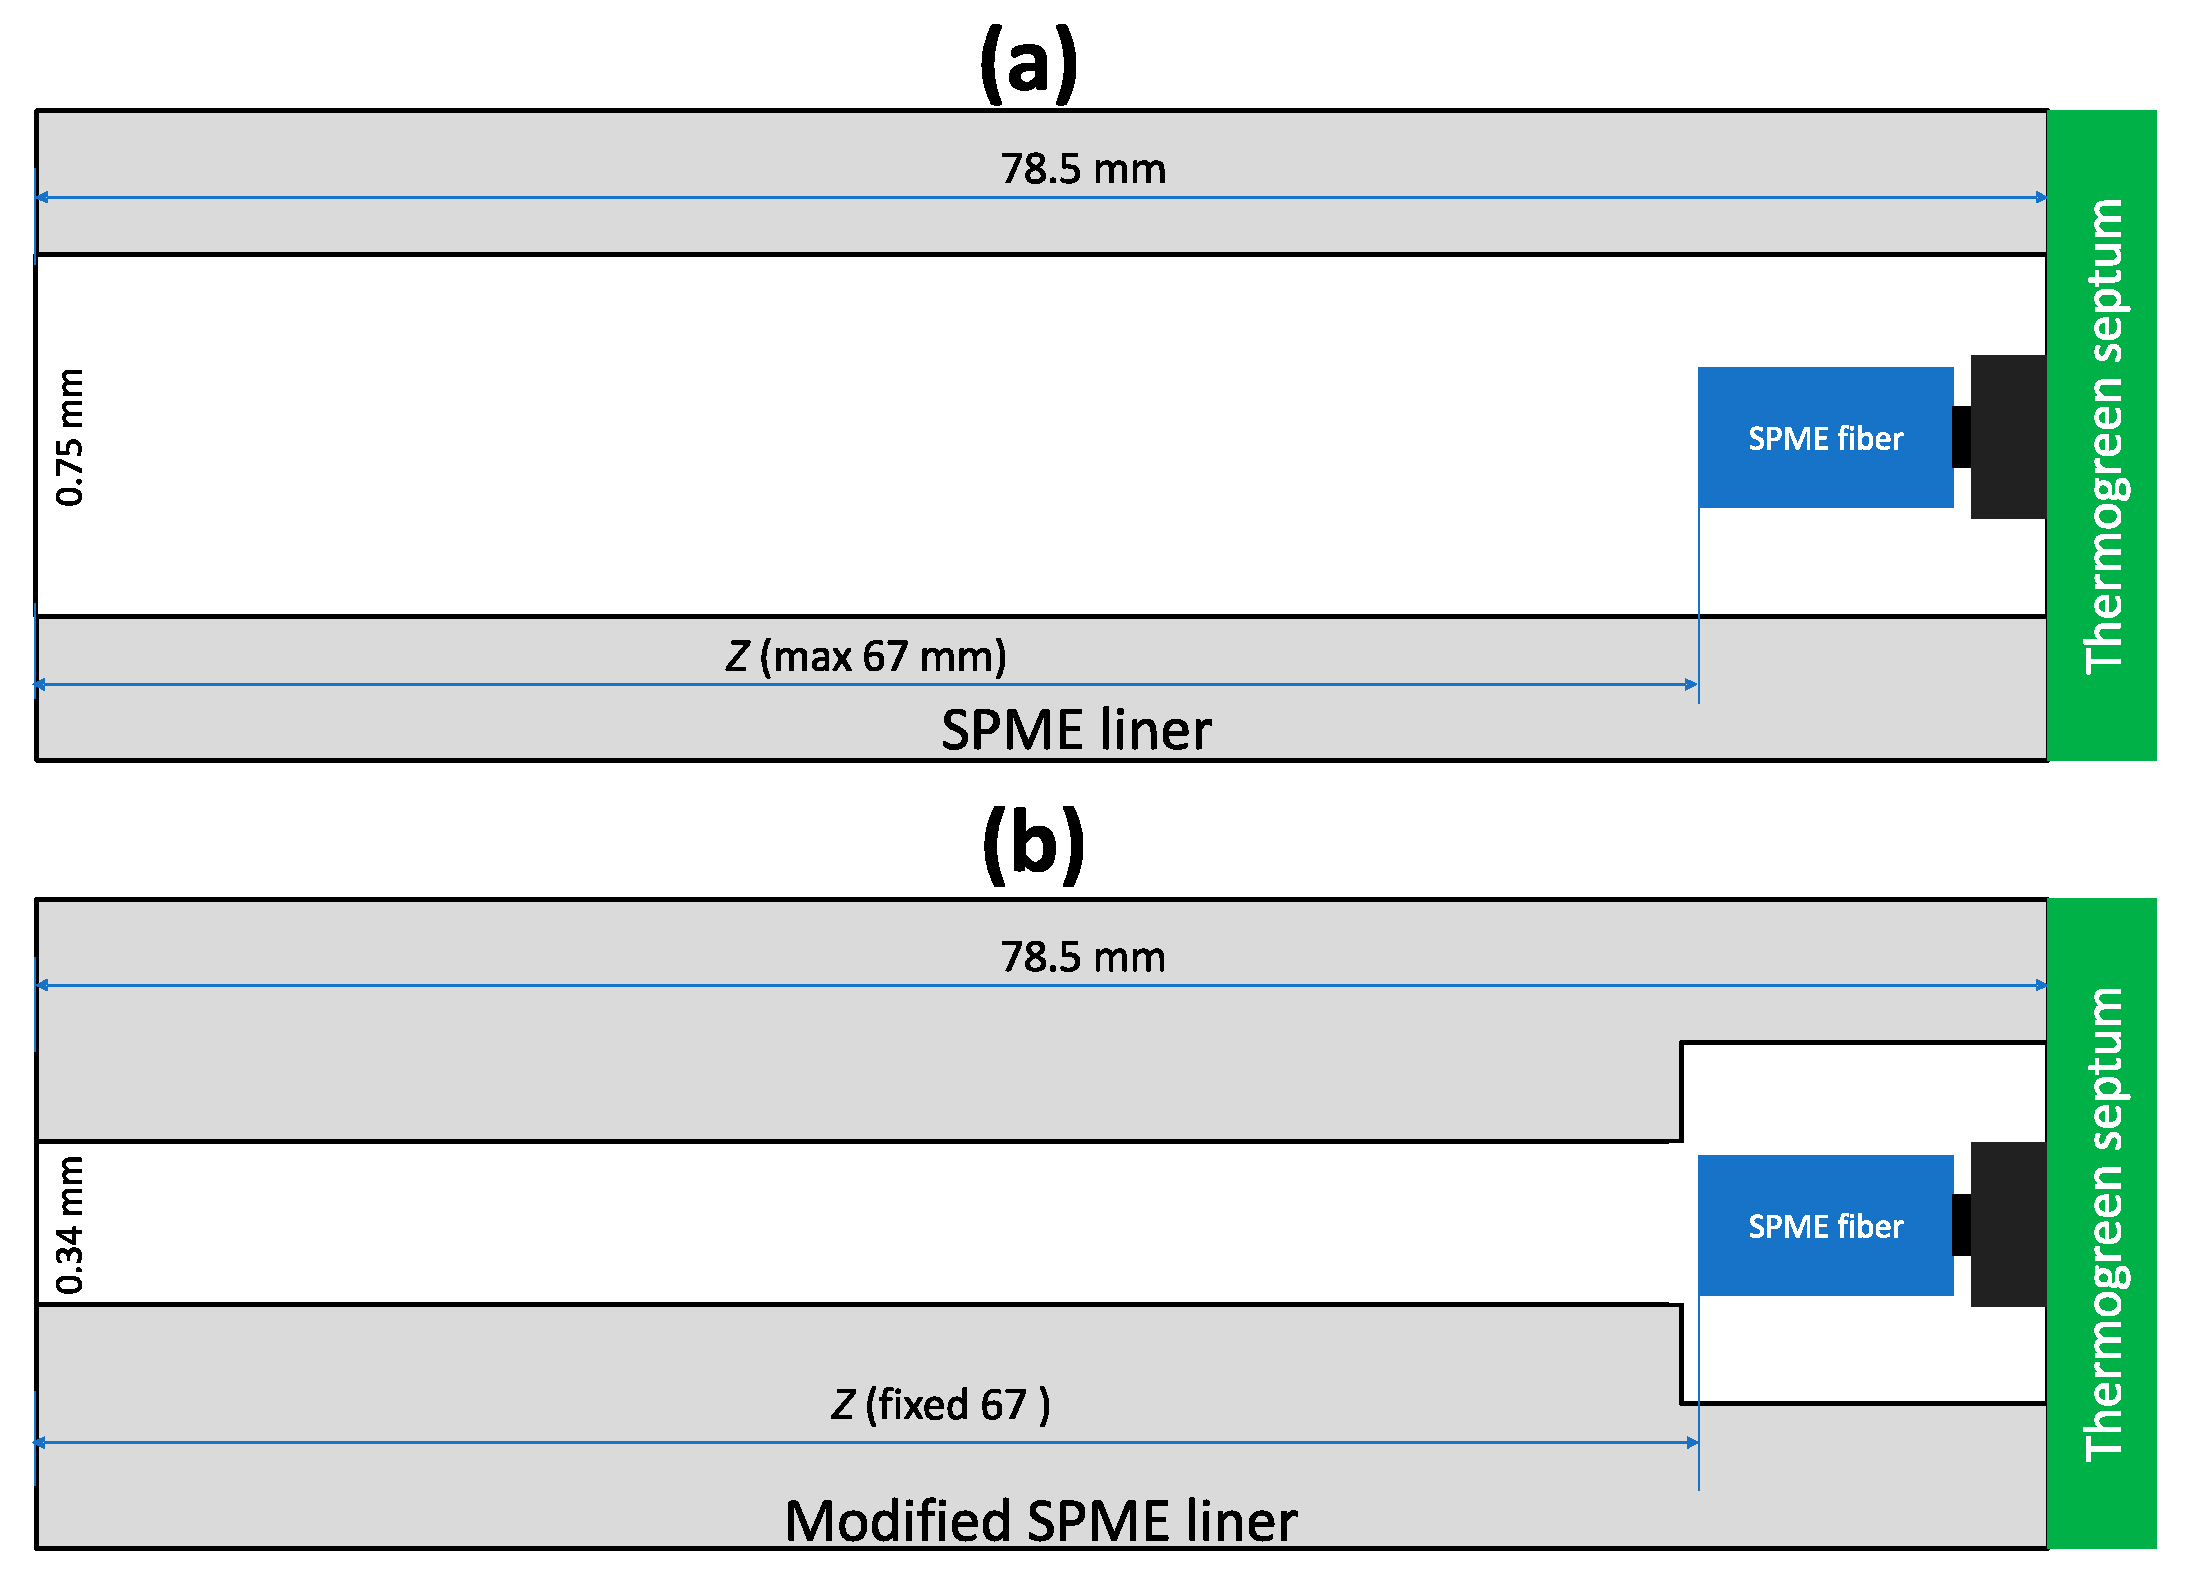
2.6. Alternative Geometries for TWA SPME Sampling
3. Materials and Methods
3.1. General Parameters of Modeling
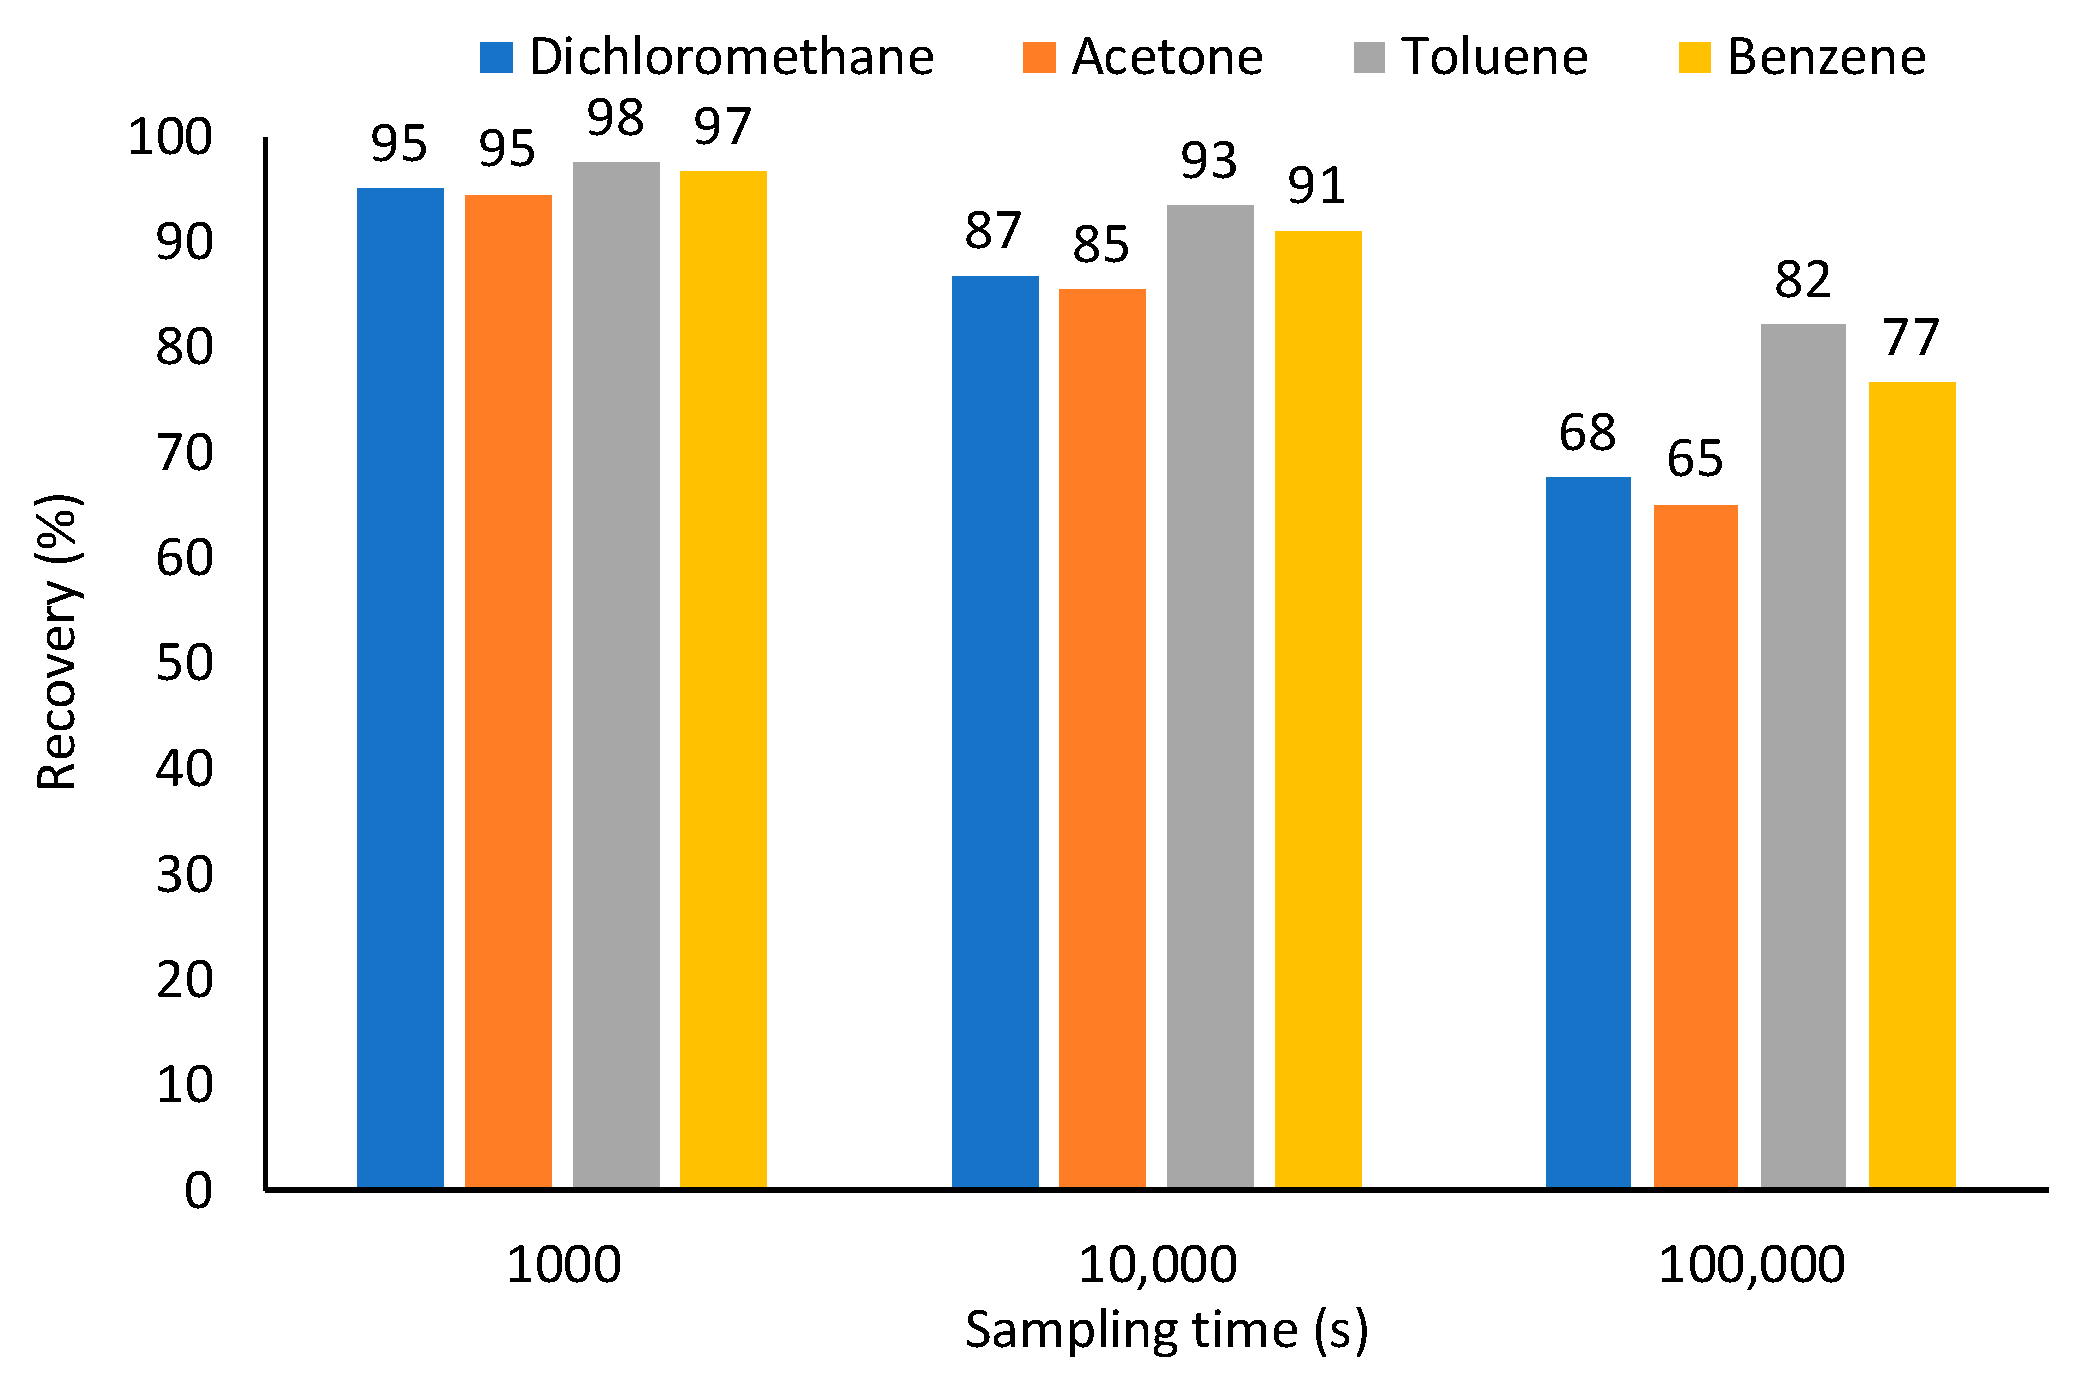
3.2. Sampling Using Absorptive Coatings
3.3. Sampling Using Adsorptive Coatings
4. Conclusions
Supplementary Materials
Author Contributions
Funding
Acknowledgments
Conflicts of Interest
References
- Pienaar, J.J.; Beukes, J.P.; Van Zyl, P.G.; Lehmann, C.M.B.; Aherne, J. Passive diffusion sampling devices for monitoring ambient air concentrations. In Comprehensive Analytical Chemistry; Forbes, P.B.C., Ed.; Elsevier: Amsterdam, The Netherlands, 2015; Volume 70, pp. 13–52. ISBN 9780444635532. [Google Scholar]
- Grandy, J.; Asl-Hariri, S.; Pawliszyn, J. Novel and emerging air-sampling devices. In Comprehensive Analytical Chemistry; Forbes, P.B.C., Ed.; Elsevier: Amsterdam, The Netherlands, 2015; Volume 70, ISBN 9780444635532. [Google Scholar]
- Martos, P.A.; Pawliszyn, J. Time-weighted average sampling with solid-phase microextraction device: Implications for enhanced personal exposure monitoring to airborne pollutants. Anal. Chem. 1999, 71, 1513–1520. [Google Scholar] [CrossRef] [PubMed]
- Khaled, A.; Pawliszyn, J. Time-weighted average sampling of volatile and semi-volatile airborne organic compounds by the solid-phase microextraction device. J. Chromatogr. A 2000, 892, 455–467. [Google Scholar] [CrossRef]
- Pawliszyn, J. Handbook of Solid Phase Microextraction, 1st ed.; Elsevier: Amsterdam, The Netherlands, 2012; ISBN 9780124160170. [Google Scholar]
- Gałuszka, A.; Migaszewski, Z.M.; Konieczka, P.; Namieśnik, J. Analytical Eco-Scale for assessing the greenness of analytical procedures. Trends Anal. Chem. 2012, 37, 61–72. [Google Scholar] [CrossRef]
- Płotka-Wasylka, J. A new tool for the evaluation of the analytical procedure: Green Analytical Procedure Index. Talanta 2018, 181, 204–209. [Google Scholar] [CrossRef] [PubMed]
- Koziel, J.; Jia, M.; Pawliszyn, J. Air sampling with porous solid-phase microextraction fibers. Anal. Chem. 2000, 72, 5178–5186. [Google Scholar] [CrossRef] [PubMed]
- Augusto, F.; Koziel, J.; Pawliszyn, J. Design and validation of portable SPME-devices for rapid field air. Anal. Chem. 2001, 73, 481–486. [Google Scholar] [CrossRef] [PubMed]
- Koziel, J.A.; Nguyen, L.T.; Glanville, T.D.; Ahn, H.; Frana, T.S.; van Leeuwen, J. Method for sampling and analysis of volatile biomarkers in process gas from aerobic digestion of poultry carcasses using time-weighted average SPME and GC–MS. Food Chem. 2017, 232, 799–807. [Google Scholar] [CrossRef] [PubMed]
- Baimatova, N.; Koziel, J.; Kenessov, B. Passive sampling and analysis of naphthalene in internal combustion engine exhaust with retracted SPME device and GC-MS. Atmosphere 2017, 8, 130. [Google Scholar] [CrossRef]
- Koziel, J.; Jia, M.; Khaled, A.; Noah, J.; Pawliszyn, J. Field air analysis with SPME device. Anal. Chim. Acta 1999, 400, 153–162. [Google Scholar] [CrossRef]
- Koziel, J.A.; Pawliszyn, J. Air sampling and analysis of volatile organic compounds with solid phase microextraction. J. Air Waste Manag. Assoc. 2001, 51, 173–184. [Google Scholar] [CrossRef] [PubMed]
- Koziel, J.A.; Noah, J.; Pawliszyn, J. Field sampling and determination of formaldehyde in indoor air with solid-phase microextraction and on-fiber derivatization. Environ. Sci. Technol. 2001, 35, 1481–1486. [Google Scholar] [CrossRef] [PubMed]
- Chen, Y.; Pawliszyn, J. Time-weighted average passive sampling with a solid-phase microextraction device. Anal. Chem. 2003, 75, 2004–2010. [Google Scholar] [CrossRef] [PubMed]
- Chen, Y.; Pawliszyn, J. Solid-phase microextraction field sampler. Anal. Chem. 2004, 76, 6823–6828. [Google Scholar] [CrossRef] [PubMed]
- Woolcock, P.J.; Koziel, J.A.; Cai, L.; Johnston, P.A.; Brown, R.C. Analysis of trace contaminants in hot gas streams using time-weighted average solid-phase microextraction: Proof of concept. J. Chromatogr. A 2013, 1281, 1–8. [Google Scholar] [CrossRef] [PubMed]
- Woolcock, P.J.; Koziel, J.A.; Johnston, P.A.; Brown, R.C.; Broer, K.M. Analysis of trace contaminants in hot gas streams using time-weighted average solid-phase microextraction: Pilot-scale validation. Fuel 2015, 153, 552–558. [Google Scholar] [CrossRef]
- Baimatova, N.; Koziel, J.A.; Kenessov, B. Quantification of benzene, toluene, ethylbenzene and o-xylene in internal combustion engine exhaust with time-weighted average solid phase microextraction and gas chromatography mass spectrometry. Anal. Chim. Acta 2015, 873, 38–50. [Google Scholar] [CrossRef] [PubMed]
- Tursumbayeva, M. Simple and Accurate Quantification of Odorous Volatile Organic Compounds in Air with Solid Phase Microextraction and Gas Chromatography—Mass Spectrometry. Master’s Thesis, Iowa State University, Ames, IA, USA, 2017. [Google Scholar]
- Semenov, S.N.; Koziel, J.A.; Pawliszyn, J. Kinetics of solid-phase extraction and solid-phase microextraction in thin adsorbent layer with saturation sorption isotherm. J. Chromatogr. A 2000, 873, 39–51. [Google Scholar] [CrossRef]
- Zhao, W. Solid Phase Microextraction in Aqueous Sample Analysis. Ph.D. Thesis, University of Waterloo, Waterloo, ON, Canada, 2008. [Google Scholar]
- Alam, M.N.; Ricardez-Sandoval, L.; Pawliszyn, J. Numerical modeling of solid-phase microextraction: binding matrix effect on equilibrium time. Anal. Chem. 2015, 87, 9846–9854. [Google Scholar] [CrossRef] [PubMed]
- Alam, M.N.; Ricardez-Sandoval, L.; Pawliszyn, J. Calibrant free sampling and enrichment with solid phase microextraction: computational simulation and experimental verification. Ind. Eng. Chem. Res. 2017, 56, 3679–3686. [Google Scholar] [CrossRef]
- Souza-Silva, E.A.; Gionfriddo, E.; Alam, M.N.; Pawliszyn, J. Insights into the effect of the PDMS-layer on the kinetics and thermodynamics of analyte sorption onto the matrix-compatible SPME coating. Anal. Chem. 2017, 89, 2978–2985. [Google Scholar] [CrossRef] [PubMed]
- Alam, M.N.; Pawliszyn, J. Numerical simulation and experimental validation of calibrant-loaded extraction phase standardization approach. Anal. Chem. 2016, 88, 8632–8639. [Google Scholar] [CrossRef] [PubMed]
- Alam, M.N.; Nazdrajić, E.; Singh, V.; Tascon, M.; Pawliszyn, J. Effect of transport parameters and device geometry on extraction kinetics and efficiency in direct immersion solid-phase microextraction. Anal. Chem. 2018, 90, 11548–11555. [Google Scholar] [CrossRef] [PubMed]
- Baimatova, N.; Kenessov, B.; Koziel, J.A.; Carlsen, L.; Bektassov, M.; Demyanenko, O.P. Simple and accurate quantification of BTEX in ambient air by SPME and GC–MS. Talanta 2016, 154, 46–52. [Google Scholar] [CrossRef] [PubMed]
- Cocheo, V.; Boaretto, C.; Sacco, P. High uptake rate radial diffusive sampler suitable for both solvent and thermal desorption. Ind. Hyg. Assoc. 1996, 57, 897–904. [Google Scholar] [CrossRef]
- Chao, K.-P.; Wang, V.-S.; Yang, H.-W.; Wang, C.-I. Estimation of effective diffusion coefficients for benzene and toluene in PDMS for direct solid phase microextraction. Polym. Test. 2011, 30, 501–508. [Google Scholar] [CrossRef]
- Prikryl, P.; Sevcik, J.G.K. Characterization of sorption mechanisms of solid-phase microextraction with volatile organic compounds in air samples using a linear solvation energy relationship approach. J. Chromatogr. A 2008, 1179, 24–32. [Google Scholar] [CrossRef] [PubMed]
- Mackay, D.; Leinonen, P.J. Rate of evaporation of low-solubility contaminants from water bodies to atmosphere. Environ. Sci. Technol. 1975, 9, 1178–1180. [Google Scholar] [CrossRef]
- Mocho, P.; Desauziers, V. Static SPME sampling of VOCs emitted from indoor building materials: Prediction of calibration curves of single compounds for two different emission cells. Anal. Bioanal. Chem. 2011, 400, 859–870. [Google Scholar] [CrossRef] [PubMed]
- Tuduri, L.; Desauziers, V.; Fanlo, J.L. Potential of solid-phase microextraction fibers for the analysis of volatile organic compounds in air. J. Chromatogr. Sci. 2001, 39, 521–529. [Google Scholar] [CrossRef] [PubMed]
Sample Availability: Samples of the compounds are not available from the authors. |


© 2018 by the authors. Licensee MDPI, Basel, Switzerland. This article is an open access article distributed under the terms and conditions of the Creative Commons Attribution (CC BY) license (http://creativecommons.org/licenses/by/4.0/).
Share and Cite
Kenessov, B.; Koziel, J.A.; Baimatova, N.; Demyanenko, O.P.; Derbissalin, M. Optimization of Time-Weighted Average Air Sampling by Solid-Phase Microextraction Fibers Using Finite Element Analysis Software. Molecules 2018, 23, 2736. https://doi.org/10.3390/molecules23112736
Kenessov B, Koziel JA, Baimatova N, Demyanenko OP, Derbissalin M. Optimization of Time-Weighted Average Air Sampling by Solid-Phase Microextraction Fibers Using Finite Element Analysis Software. Molecules. 2018; 23(11):2736. https://doi.org/10.3390/molecules23112736
Chicago/Turabian StyleKenessov, Bulat, Jacek A. Koziel, Nassiba Baimatova, Olga P. Demyanenko, and Miras Derbissalin. 2018. "Optimization of Time-Weighted Average Air Sampling by Solid-Phase Microextraction Fibers Using Finite Element Analysis Software" Molecules 23, no. 11: 2736. https://doi.org/10.3390/molecules23112736
APA StyleKenessov, B., Koziel, J. A., Baimatova, N., Demyanenko, O. P., & Derbissalin, M. (2018). Optimization of Time-Weighted Average Air Sampling by Solid-Phase Microextraction Fibers Using Finite Element Analysis Software. Molecules, 23(11), 2736. https://doi.org/10.3390/molecules23112736