The Utility of Supertype Clustering in Prediction for Class II MHC-Peptide Binding

1
Department of Bioinformatics, Shantou University Medical College, Shantou 515000, China
2
Department of Computer Science, Guangzhou University, Guangzhou 510000, China
3
Computer Network Information Center, Chinese Academy of Sciences, Beijing 100190, China
*
Author to whom correspondence should be addressed.
Molecules 2018, 23(11), 3034; https://doi.org/10.3390/molecules23113034
Submission received: 16 October 2018
/
Revised: 14 November 2018
/
Accepted: 16 November 2018
/
Published: 20 November 2018
Abstract
:Motivation: Extensive efforts have been devoted to understanding the antigenic peptides binding to MHC class I and II molecules since they play a fundamental role in controlling immune responses and due their involvement in vaccination, transplantation, and autoimmunity. The genes coding for the MHC molecules are highly polymorphic, and it is difficult to build computational models for MHC molecules with few know binders. On the other hand, previous studies demonstrated that some MHC molecules share overlapping peptide binding repertoires and attempted to group them into supertypes. Herein, we present a framework of the utility of supertype clustering to gain more information about the data to improve the prediction accuracy of class II MHC-peptide binding. Results: We developed a new method, called superMHC, for class II MHC-peptide binding prediction, including three MHC isotypes of HLA-DR, HLA-DP, and HLA-DQ, by using supertype clustering in conjunction with RLS regression. The supertypes were identified by using a novel repertoire dissimilarity index to quantify the difference in MHC binding specificities. The superMHC method achieves the state-of-the-art performance and is demonstrated to predict binding affinities to a series of MHC molecules with few binders accurately. These results have implications for understanding receptor-ligand interactions involved in MHC-peptide binding.
1. Introduction
Major histocompatibility complex (MHC) molecules, called human leukocyte antigen (HLA) in humans, act as cell surface vessels, which hold antigen fragments within their binding groove for recognition by T cells. There are two main classes of MHC molecules: class I and II, which differ in terms of which cells express them, in the source of the antigens they bind to, and in terms of which T cells they present antigen pieces to [1,2]. Class I MHC molecules exist on the surface of nearly all nucleated cells and specialize in displaying antigenic peptides that originate from the cytosol. CD8 T cells recognize the complex of the class I MHC molecules plus antigenic peptides and kill cells expressing such intracellular antigens. On the other hand, class II MHC molecules are predominantly expressed on antigen-presenting cells (B cells, macrophages, and dendritic cells) and specialize in displaying antigen fragments that originate from extracellular spaces. CD4 T cells recognize those foreign peptides in complex with class II MHC molecules and then produce a large number of cytokines to activate various cells toward destroying extracellular invaders [3].
Class II MHC molecules are composed of two different chains: (33 kDa) and (28 kDa), each of which consists of two external domains: and domains in the chain and and domains in the chain. The peptide-binding cleft of class II MHC molecule is formed by the and domains. X-ray crystallographic study reveals that the binding clefts of class I and II MHC molecules are different at both ends: MHC class I is closed at both ends, while MHC class II is open at both ends. The reason is class I MHC molecules have conserved residues that bind to the terminal residues of antigenic peptides, while these kinds of conserved residues do not exist in the class II MHC molecules. Class II MHC molecules can accommodate longer peptides than class I MHC molecules, which results in increased difficulty in performing accurate prediction for class II MHC-peptide binding. In humans, the and chains of class II MHC molecules are encoded by the DP, DQ, and DR loci. Each MHC locus encodes numerous allele variants [2]. By May 2018, the IPD-IMGT/HLA database [4] release listed 2450 DRB (the abbreviation for the gene encoding the class II HLA-DR -chain) alleles, 1193 DQB (HLA-DQ -chain) alleles, and 974 DPB (HLA-DP -chain) alleles. Such high levels of polymorphism presumably enhance the probability of whole species survival via a wide range of infectious diseases, but cause difficulty for the designation of high population coverage vaccines. The supertype identification problem essentially is to identify peptides that can bind to a set of MHC molecules, aiming at reducing the total number of epitopes for multi-epitope vaccines’ design without compromising population coverage [5,6]. The first class I HLA supertypes were proposed by [5], who defined nine supertypes based on clustering the structural motifs derived from experimentally-determined binding data. Some MHC molecules share significant peptide-binding repertoires despite apparent motif differences [7]; thus, some methods have been developed to classify HLA molecules into supertypes by considering the peptide-binding repertoires [8,9,10,11]. However, most of these works studied peptide-binding specificities by using peptide-binding repertoires predicted by computational approaches, such as the position-specific scoring matrix (PSSM) [8] or neural networks [10,11]. The work described in [9] used actual peptide-binding measurements, but the binding repertoire was less than 90 peptides for each molecule.
The interactions of T cells with MHC-peptide complexes play a vital role for the T or B lymphocytes to proliferate and differentiate into effector cells or memory cells [2]. Previous studies have clarified that the MHC-peptide binding strength has a strong correlation with peptide immunogenicity [12,13]. Many different approaches for the prediction of class II MHC-peptide binding have been developed, including TEPITOPE [14], TEPITOPEpan [15], NetMHCII [16], NetMHCIIpan [17], KernelRLS, and KernelRLSPan [18]; however, a few methods among them [10,11] can make the prediction for HLA-DP and HLA-DQ molecules.
In this study, a large-scale dataset derived from quantitative MHC binding assays was employed to characterize supertypes from the 41 most common class II HLA molecules covering the DR, DP, and DQ loci. To make meaningful comparisons between peptide-binding repertoires, we developed a novel repertoire dissimilarity index (RDI) as a measure of distance between them to quantify the difference in MHC binding specificities. Furthermore, we explored the utility of supertype clustering in prediction for class II MHC-peptide binding, including three class II HLA isotypes of HLA-DR, HLA-DP, and HLA-DQ.
2. Results and Discussion
2.1. Identification of HLA II Supertypes
In the present study, a large-scale dataset derived from quantitative MHC binding assays was employed to characterize supertypes from 41 class II HLA molecules covering the DR, DP, and DQ loci. This dataset (see Table 1 for more details) contained 96,674 class II MHC-peptide pairs with IC measurements, in which 46,113 pairs were associated with good (IC nM) or intermediate binding (50 nM < IC nM).
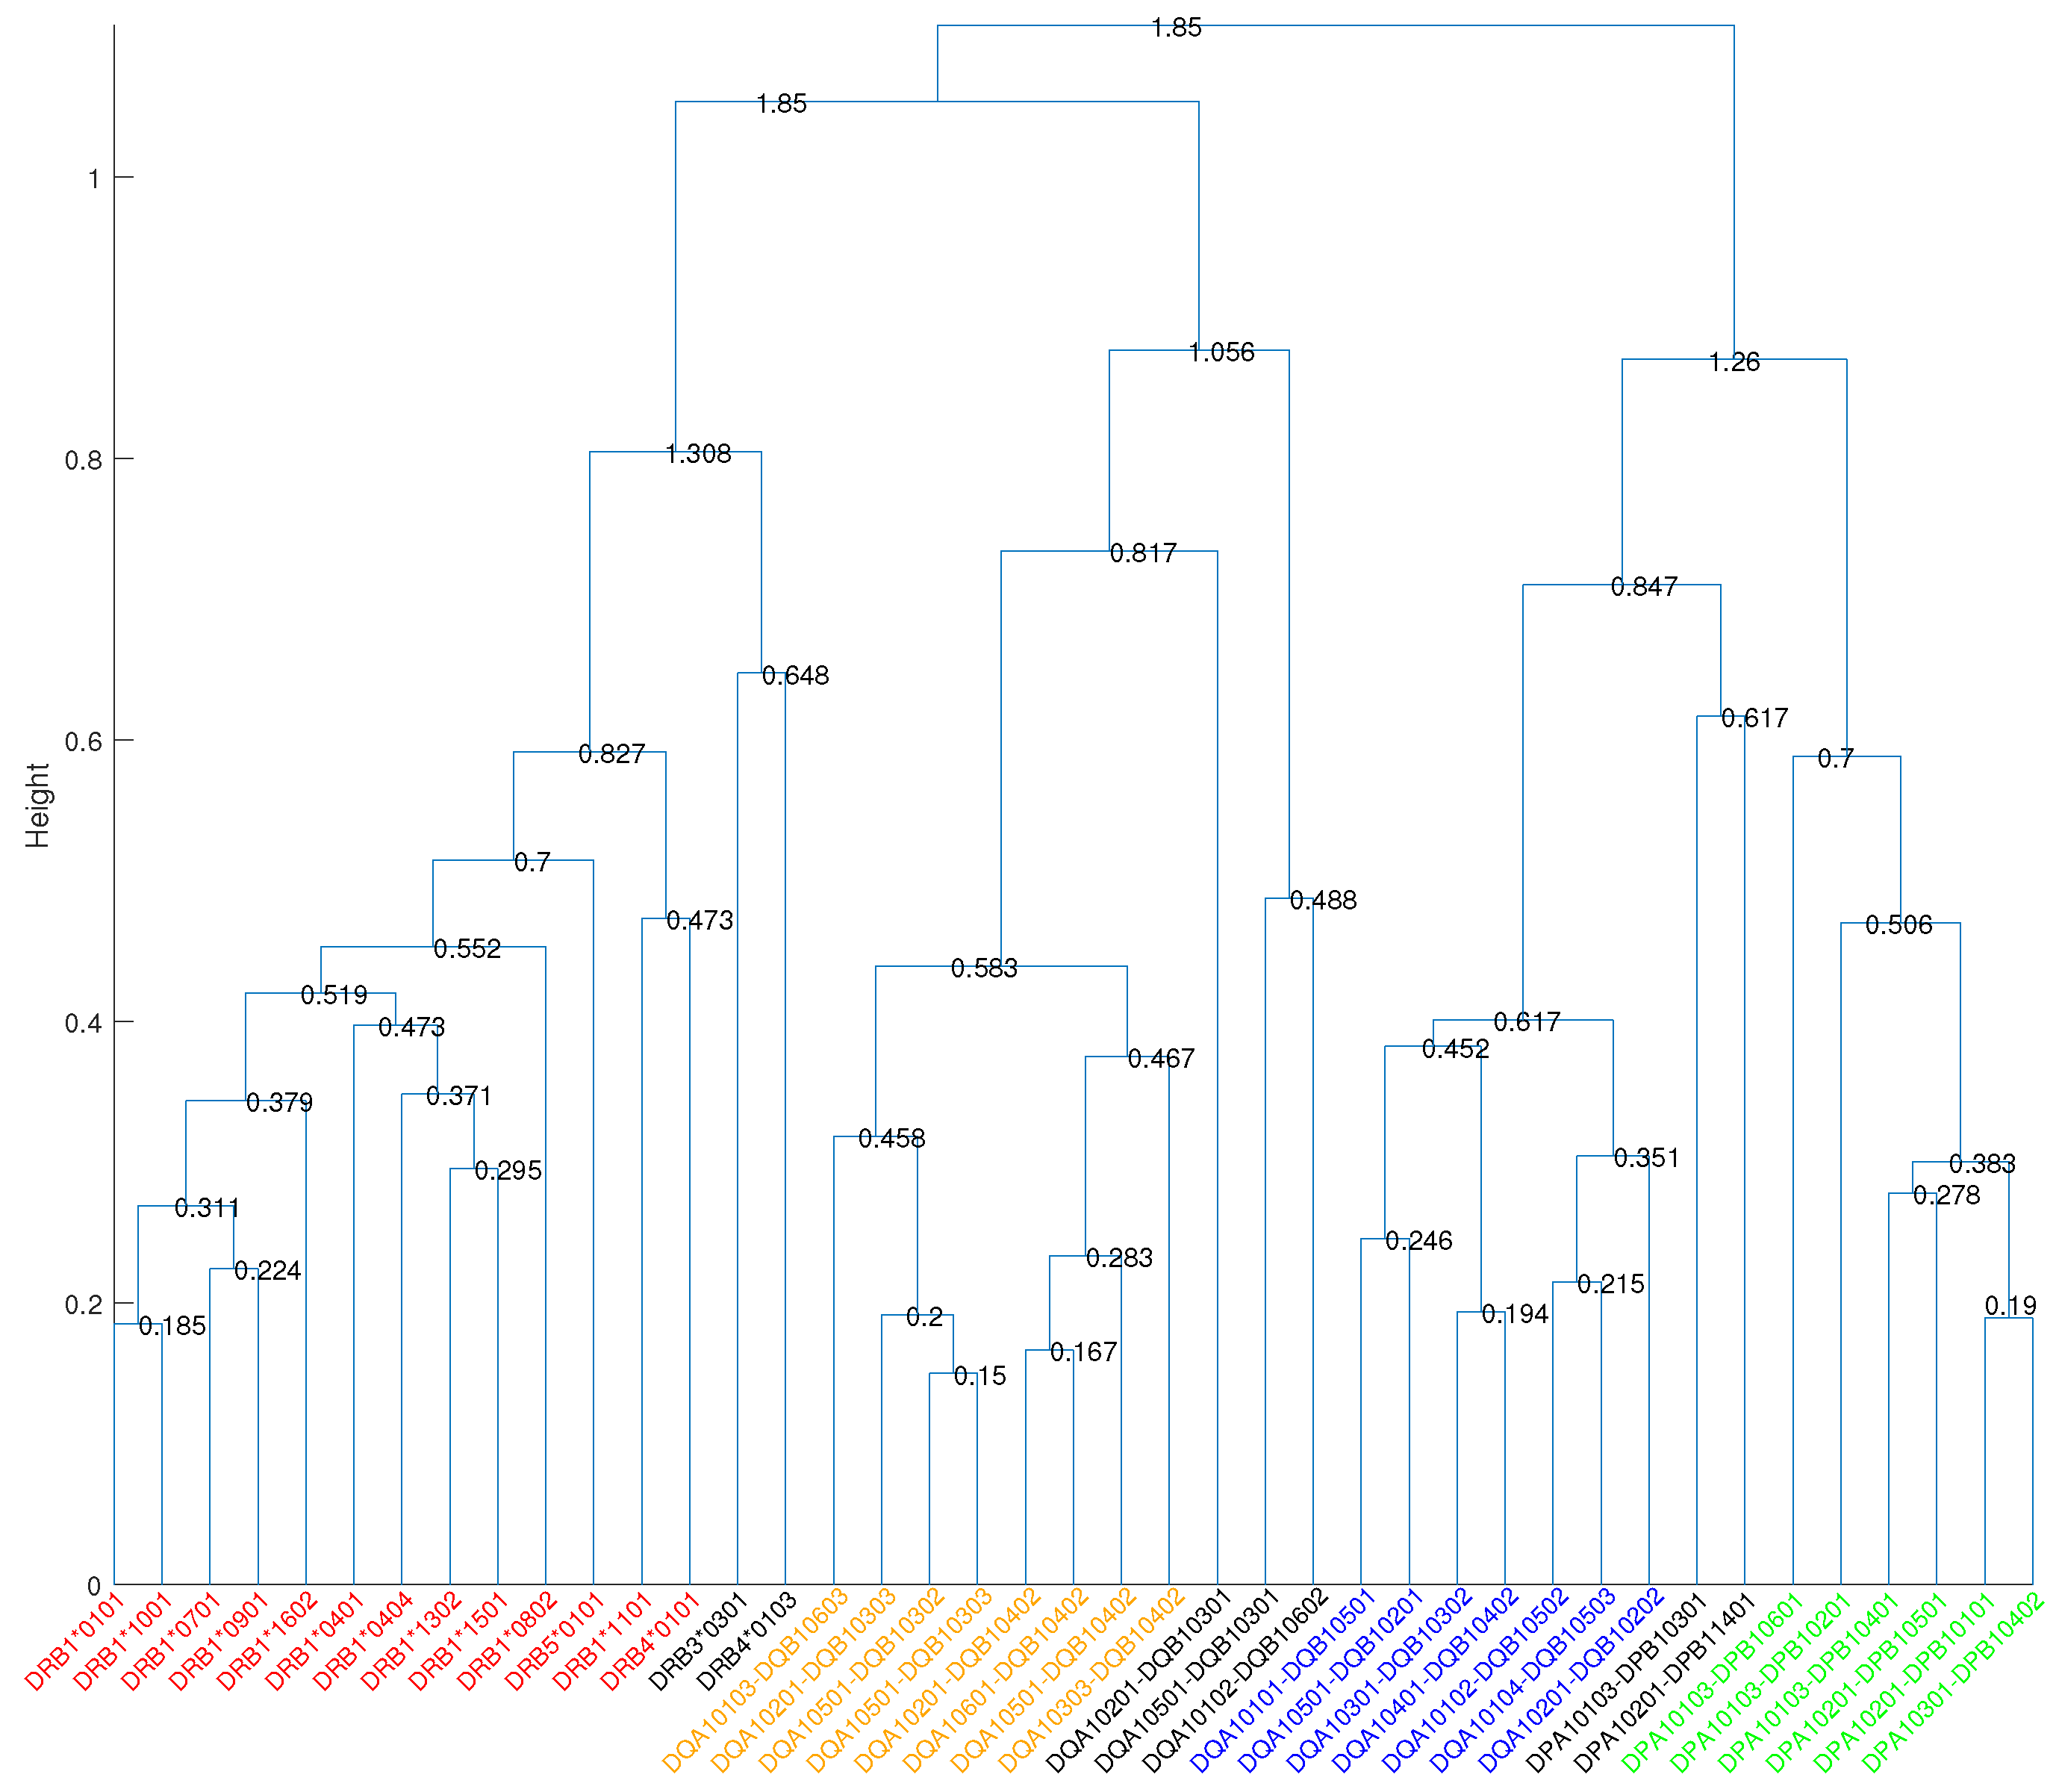
To quantify the overlapping MHC-peptide binding repertoires, we developed the RDI as a measure of distance between repertoires. This metric uses Kendall’s rank correlation coefficient [19] to ascertain the degree of association among a given set of peptide-binding repertoires for two MHC molecules. Using the RDI, we generated a dissimilarity matrix whose entries quantified the difference in MHC binding specificities. Hierarchical clustering [20] of this dissimilarity matrix revealed four main supertypes covering the 34 most common HLA DR, DP, and DQ molecules (Figure 1). The cut-off distance for the formation of clusters was set to 0.7 to exclude negative and weaker correlations. We can see that cutting the cluster tree at this level separates HLA molecules at different loci. As shown in Figure 2, the high variance in different MHC peptide-binding repertoires resulted in orders of magnitude difference in counts of sharing binding peptides (Figure 2a), while the matrix of RDI clearly displayed four blocks on the diagonal, which was in accordance with the four main supertypes (Figure 2b).
We identified two main supertypes for HLA-DQ and one each for HLA-DR and HLA-DP. The HLA molecules within the supertypes are all encoded by either the DR, DP, or DQ locus, and no cross-loci supertypes were found, which is consistent with the earlier findings [9,10,11]. The cluster tree in Figure 1 shows that the main DQ1 supertype was closer to the main DR supertype, while the main DQ2 supertype was closer to the main DP supertype. The average Kendall’s correlation coefficient for molecules between main DQ2 and main DP was 0.169, and it was close to zero or negative for molecules between other main supertypes, indicating very weak positive correlations between distinct main supertypes. Furthermore, we assigned split supertypes to certain HLA molecules in the cluster tree based on the common binding motifs previously described [11]. Table 2 lists the broad supertypes in connection with the split supertypes and the corresponding peptide motifs.
For class II MHC molecules, the chain is much more polymorphic than the chain; thus, we compared the sequence motifs of the polymorphic pocket residues on the chain, as shown in Figure 3. For the HLA-DR chain, pockets 4, 6, 7, and 9 are responsible for the peptide binding specificity and are mainly formed by the polymorphic residues, as described in the work of Tiziana et al. [14]. Pocket 1 plays an important role in determining the binding core. The HLA-DP and HLA-DQ molecules were demonstrated to have minor variations from HLA-DR in the peptide-binding domain [10]; therefore, we investigated their anchor pockets by using the same residues as the HLA-DR’s. Residue 86 takes part in the formation of pocket 1. From the sequence logos in Figure 3, the chains of HLA-DR, -DQ, and -DP have Gly/Val, Glu/Ala, and Asp/Gly, respectively. In contrast to Gly/Val making up a deep and nonpolar pocket, pocket 1 with Glu and Asp was more shallow and negatively charged; however, all class II MHC isotypes share a strong preference for large hydrophobic residues in position 1 of the peptide binding core (see Table 2). In contrast, the P4, P6, P7, and P9 motifs are more diverse across different isotypes and are described in the following subsections.
2.2. HLA-DR Supertypes
In our analysis, the molecules included in the main DR cluster matched very well to the previously described “main DR supertype” [6,9]. The study in [6] demonstrated that a set of seven HLA-DR molecules (DRB1*0101, DRB1*0401, DRB1*0701, DRB5*0101, DRB1*1501, DRB1*0901, and DRB1*1302) shared overlapping peptide binding repertoires by using a panel of quantitative assays. The main DR supertype described in this study identified a larger set of HLA-DR molecules, characterized by overlapping peptide-binding repertoires, which not only covered all of those seven molecules described earlier, but also identified six additional HLA-DR molecules (DRB1*0404, DRB1*0802, DRB1*1001, DRB1*1602, DRB1*1101 and DRB4*0101). The average Kendall’s correlation coefficient between molecules within the main DR supertype was 0.526. The cluster tree (Figure 1) describing the HLA-DR molecules was characterized by three split supertypes, called DR1, DR52, and DR53, based on common binding motifs predicted in [11]. As shown in Table 2, the DR1 cluster comprising DRB1*0101, DRB1*1001, DRB1*0701, DRB1*0901, DRB1*1602, DRB1*0401, DRB1*0404, and DRB1*1501, can be characterized by a shared preference for hydrophobic residues (F, Y, I, L) in position 1 [9], small and/or aliphatic residues (L, A, I, S, T) in position 4, small residues (A, S, G, P, T) in position 6, and hydrophobic and aliphatic residues (L, V) in position 9 of the 9-mer binding core. The DR52 cluster includes DRB3*0301 and DRB1*1302, while the DR53 cluster includes DRB1*0802, DRB5*0101, DRB1*1101, DRB4*0101, and DRB4*0103. Both DR52 and DR53 clusters showed a strong preference for hydrophobic residues in position 1, as well. The DR52 cluster was characterized by a preference for peptides bearing hydrophilic residues (N, S) in position 4. The DR53 cluster was observed to prefer positively-charged amino acid R in position 2 and the positions near the C-terminal end of the binding core (P5–P9). The anchor positions 1, 4, 6, and 9 at the binding core were identified to govern the binding strength of peptides with class II MHC molecules [3] and were observed to dominate the HLA-DR peptide binding specificities, as well.
2.3. HLA-DQ Supertypes
The data presented herein suggest that there are two main supertypes for HLA-DQ molecules, called main DQ1 and main DQ2. The average Kendall’s correlation coefficient between molecules within main DQ1 and main DQ2 was 0.643 and 0.638, respectively, while it was 0.009, near zero, for molecules between main DQ1 and main DQ2. From the sequence logos shown in Figure 3, the residues 70/71/74 composing pocket 4, 30/71 in pocket 7, and 9/57 in pocket 9 play an important role in DQ classification.
The HLA-DQ molecules were grouped into five split supertypes, as summarized in Table 2, which is highly consistent with the groups in the distance tree presented in [11]. All split supertypes shared strong specificities for hydrophobic residues in position 1. The anchor positions of DQ7 cluster were in positions 1, 3, 4, 6, and 9. The peptide motifs of the DQ7 cluster comprising DQA1*0501-DQB1*0301, DQA1*0201-DQB1*0301, DQA1*0102-DQB1*0602, DQA1*0103-DQB1*0603, DQA1*0201-DQB1*0303, DQA1*0501-DQB1*0302, and DQA1*0501-DQB1*0303 were observed to bear small and/or hydrophobic residues in positions 3, 4, 6, and 9. The DQ4 cluster (DQA1*0201-DQB1*0402, DQA1*0303-DQB1*0402, DQA1*0601-DQB1*0402, and DQA1*0501-DQB1*0402) recognized a broad motif characterized by hydrophobic residues (F, A, W) in position 4, small and/or hydrophobic residues in positions 6 and 9, and positively-charged residue R and amino acid A in position 7. The DQ5 cluster included DQA1*0102-DQB10502, DQA1*0104-DQB10503, and DQA1*0101-DQB10501, whose peptide motifs were characterized by a shared preference for aromatic residues in position 4 and acidic amino acid D in positions 6 and 7. The clusters DQ2 and DQ8 preferred acidic residues (D, E) in the positions P4–P9 and P7–P9, respectively.
2.4. HLA-DP Supertypes
The cluster tree grouped most HLA-DP molecules into a main HLA-DP supertype that comprises DPA1*0103-DPB1*0401, DPA1*0201-DPB1*0101, DPA1*0201-DPB1*0501, DPA1*0301-DPB1*0402, DPA1*0103-DPB1*0201, and DPA1*0103-DPB1*0601. The average Kendall’s correlation coefficient between molecules within the main DP cluster was 0.590. In our analysis, the HLA-DP molecules were classified into two split supertypes, called DP1 and DP3. The DP1 cluster was characterized by a consensus motif including large hydrophobic residues (F, L, Y, I) in positions 1 and 6 and amino acid L in positions 7 and 9. The DP3 cluster, including DPA1*0103-DPB1*0301, and DPA1*0201-DPB1*1401, also favors large hydrophobic resides in position 1, but strongly prefers positively-charged residues (R, K) in position 2 and small and/or hydrophobic residues in positions 4, 6, and 7.
2.5. Class II MHC-Peptide Binding Prediction
In the following section, we present the results of a novel ensemble method, called superMHC, for class II MHC-peptide binding prediction, including three class II HLA isotypes of HLA-DR, HLA-DP, and HLA-DQ. The NetMHCIIpan-3.2 dataset was used for evaluation. The superMHC method is a pan-allele approach, which can make accurate predictions of those class II HLA molecules with few binders available by making use of those MHC-peptide pairs having experimental measurements. A schematic overview of the superMHC model construction is shown in Figure 4. Basically, the model construction was composed of two steps. First, we classified the training set into five clusters. In Section 2.1, four main supertypes are identified for molecules from the HLA-DR, HLA-DP, and HLA-DQ loci. Based on the broad supertype classification, all the samples in the training set were partitioned into five parts by mapping their MHC molecules to the main supertypes, in which four parts were associated with the corresponding four main supertypes and the remaining samples were associated with a single cluster, named diverse cluster, molecules that have no broad supertype classification herein. Second, a separate regularized least squares (RLS) regression [21] model was then trained on each of these five clusters. After five base learners were produced, making a prediction of a point from the test set was as illustrated in Figure 5, which involved two steps:
- If the MHC molecule of the test point belongs to one of the five existing clusters, then use the corresponding cluster model to perform prediction for the test point.
- Otherwise, identify the MHC isotype of the test point. The base learners Model 1 and Model 5 associated with the main DR and diverse clusters respectively were combined to make a prediction for the test point from the HLA-DR isotype. Since about 66% of data points associated with the diverse cluster in the training set were from the HLA-DR isotype, Model 1 was combined with Model 5 to perform the prediction. The base learner Model 2 associated with the main DP cluster was applied to perform prediction for the test point from HLA-DP isotype. The base learners Model 3 and Model 4 associated with the main DQ1 and main DQ2 clusters, respectively, were combined to perform prediction for the test point from the HLA-DQ isotype.
We validated superMHC on the NetMHCIIpan-3.2 dataset through five-fold cross-validation. The NetMHCIIpan-3.2 dataset was partitioned into the same five folds as [11]. In each test, we merged four parts of the data objects as the training set and left the other part as the test set. The pan-allele kernel in Equation (8) was defined by using and , as suggested in [18], to define and , while for and for RLS were chosen from sets . We found that the model performed best with and . The predictive performances of superMHC compared with the NetMHCIIpan-3.2, NetMHCII-2.3, and their consensus method are shown in Table 3. The performance of superMHC was significantly better than NetMHCII-2.3 (, paired t-test). The average AUC scores over all 54 MHC molecules were 0.840 and 0.857 for NetMHCII-2.3 and superMHC, respectively. The performance of superMHC was comparable to those of NetMHCIIpan-3.2 and the consensus method.
To investigate the generalization ability of the superMHC method, we used the whole NetMHCIIpan-3.2 dataset for training and tested its predictive performance on a new dataset. To avoid overlapping between the training and testing sets, those MHC-peptide pairs overlapping with the training set were removed. The performance of superMHC in comparison with the NetMHCII-2.3, NetMHCIIpan-3.2, and their consensus method is given in Table 4. Since some molecules in the test set were insufficient to define the AUC scores, we compared the algorithm performance in terms of RMSE, which is a better measure than AUC, as suggested in [18]. The NetMHCII-2.3 and consensus method could only make the prediction in 9 out of 33 MHC molecules. For these 9 molecules, the performance of superMHC in comparison with the other three methods was comparable. Both superMHC and NetMHCIIpan-3.2 were able to perform prediction for all 33 molecules. Comparing the performance of superMHC with NetMHCIIpan-3.2, we found that their RMSE scores were not significantly different (, paired t-test). Specifically, among the four predicted methods, superMHC achieved the best performance for 15 molecules and NetMHCIIpan-3.2 performed the best for 14 molecules. The smallest RMSE score for each molecule is highlighted in bold in Table 4.
3. Materials and Methods
3.1. Datasets
3.1.1. MHC II-Peptide Binding Repertoires
A large-scale peptide-binding dataset containing 72 human class II MHC molecules was considered in this study. This dataset was obtained from the NetMHCIIpan-3.2 web server [11], and all mouse H-2 molecules were excluded. The NetMHCIIpan-3.2 dataset covers 131,008 MHC-peptide pairs, in which there are 36 HLA-DR, 27 HLA-DQ, and 9 HLA-DP molecules, which were used as the training set in this study.
A new test set of class II HLA-peptide binding data was downloaded from the Immune Epitope Database (IEDB) [22] to verify the performance of the superMHC method. We retrieved all quantitative data by including either radioactivity or fluorescence competition binding assays with half maximal inhibitory concentration (IC) response. To avoid overlapping between the training and testing sets, those MHC-peptide pairs overlapping with the training set were removed. Since both the NetMHCII-2.3 and NetMHCIIpan-3.2 methods cannot perform the prediction for peptides of less than 9 amino acids, those MHC-peptide pairs with a peptide length less than 9 were excluded as well. In addition, we just included those MHC molecules with more than five measured peptides. Finally, the new test set was composed of 33 MHC molecules and 8892 pairs covering the HLA-DR, HLA-DP, and HLA-DQ loci. Most publicly-available peptide-binding data from the HLA-DP and HLA-DQ loci have been included in the training set; hence, the new test set covers limited data from these two loci. The IC scores usually lie between zero and 50,000 nanomolar (nM), which measured the binding strength of a peptide binding to an MHC molecule, and are normalized by Equation (1).
3.1.2. MHC II Sequences
The aligned protein sequences of the class II MHC molecules were downloaded from the IMGT/HLA Sequence Database. Two markers listed in Table 5 were used to identify the polymorphic part of a class II MHC allele, each of which consists of three amino acids. For each allele, we only consider the amino acids located from the “start marker” to the “end marker” since this region constitutes the whole of exon 2. The class II MHC gene exon 2 encodes the peptide-binding sites, thereby contributing to the diversity in antigen presentation [23,24,25]. The DRA (HLA-DR -chain) allele is very monomorphic; in contrast, both the DQA (HLA-DQ -chain) and DPA (HLA-DP -chain) alleles contain the polymorphisms specifying the peptide binding specificities [26], so we therefore considered the polymorphisms of both the and chains in the superMHC model development.
3.2. Methods
3.2.1. Analysis of Peptide-Binding Repertoire Dissimilarity
In this study, the large-scale dataset studied in [11] was utilized to generate the peptide-binding repertoires. The peptide-binding dataset contains 41 class II HLA molecules and 96,674 MHC-peptide pairs, as shown in Table 1. All MHC-peptide pairs in the dataset have an IC score between 1 nM and 50,000 nM. Furthermore, each MHC molecule in the dataset has at least 200 peptides with known binding affinities. We developed the RDI as a measure of distance between repertoires to quantify the difference in MHC binding specificities. There are a number of challenges associated with the quantification of overlapping peptide-binding repertoires. First, the high variance in different MHC peptide-binding repertoires can often result in orders of magnitude difference in counts of sharing peptides. In addition, MHC molecules with small binding repertoires display very limited overlap with other molecules. To account for these challenges and to make meaningful comparisons between repertoires, the RDI was defined in three steps.
- Let and be finite sets of peptides and MHCs, respectively. Suppose is a sample set of peptide-binding repertoires with and ; for each MHC molecule , represents the normalized binding affinity (see Equation (1)) between peptide p and MHC molecule . Here, the number of peptides shared by MHC molecules and is denoted by , where .
- Calculate the average absolute difference between the normalized binding affinities given by the two MHC molecules , and their shared peptides. The difference is defined as:
- Subsequently, we defined the RDI to quantify the dissimilarity in binding specificity by transforming Kendall’s rank correlation coefficient, which is more robust to outliers compared to Pearson correlation [27]. This metric employs Kendall’s rank correlation coefficient to evaluate the degree of similarity between two sets of ranks given to the same set of objects. The value of the correlation coefficient varies between and 1.where is a set of pairs of differences between MHC molecules and , as defined in Equation (2). This coefficient depends on only the order of the pairs.The RDI is given by:
3.2.2. Identification of Supertypes for MHC II Molecules
Class II HLA supertypes were obtained by clustering the peptide-binding repertoires. First, the RDI was utilized to measure the difference in peptide-binding specificities for all distinct pairs of class II HLA molecules. WPGMA (weighted pair-group method using arithmetic averages) linkage was used to measure the proximity between clusters. Suppose and are merged into a new cluster P, then the proximity between P and another cluster Q is defined as follows:
Then, hierarchical agglomerative clustering was applied to build a cluster tree, which is a tree on which every node represents the cluster of the set of all leaves descending from that node, and the relationship was visualized in the form of a cluster tree. Finally, class II HLA supertypes were identified by cutting the cluster tree at a proper height to classify the molecules into disjoint subsets.
3.2.3. Ensemble Learning
Following from the previous section, clustering the MHC molecules gives a compressed representation, the MHC molecules assigned in the same supertype displaying higher functional similarity, while the MHC molecules in different supertypes displaying very limited functional overlap. This transformation tells us something interesting about the structure of the data, and in this study, we exploited it to improve the predictive performance of class II MHC-peptide binding. We trained a separate predictor on each cluster rather than training a single predictor on the entire dataset. The separate predictors were then properly combined to generate an ensemble predictor. We regard ensemble learning as sets of machine learning approaches whose decisions are integrated in a proper way to enhance the whole system’s performance [28,29,30]. The generalization ability of an ensemble is usually much better than that of a single learner [31,32].
The construction of an ensemble predictor comprises the following three steps:
- The whole training set of peptide-binding repertoires was clustered into K ( herein) disjoint subsets.
- For each subset, the RLS supervised learning algorithm was trained on the data objects inside it. We then obtained a set of K separate predictors.
- An ensemble predictor was generated by combining the separate predictors derived from the same MHC isotype by uniform averaging.
3.2.4. Pan-Allele Kernel and RLS Regression
According to the definition of a string kernel in [18], it can be used as a measure of similarity between amino acid sequences, and two sequences are considered similar if they contain many high-score local alignments. We briefly review the kernel definition herein. Given two amino acid sequences f and g, the string kernel is defined as:
where represents the frequency of a x to y amino acids substitution in the alignment blocks to generate a BLOSUM62 substitution matrix [33], , is a set of 20 amino acids, and u and v are substrings of f and g, respectively, of the same length k.
With correlation normalization:
Each HLA class II molecule consists of two chains of and . For HLA-DR, the chain is highly polymorphic, while the chain is closely monomorphic. Different from HLA-DR, both HLA-DP and HLA-DQ contain the polymorphism in and chains, which specify the peptide binding specificities. Therefore, for HLA-DP and HLA-DQ, both and chains should be taken into account to predict peptide binding. The pan-allele kernel proposed in [18] solely considered the chain of the MHC molecules. In this study, this pan-allele kernel was further explored to take both and chains into account. For all HLA-DR molecules, the same chain of DRA*01:01 was adopted.
Let and be finite sets of amino acid sequences representing the MHC II and chains, respectively. Let be a set of peptides. We define the pan-allele kernel on the product space of as:
The kernel was implemented with RLS for MHC-peptide binding prediction. Let a set of data be given, where for each i, with , and is the normalized binding affinity of peptide to class II MHC molecule . The problem comes to solve:
where , and is the predicted binding affinity of peptide to class II MHC molecule .
The prediction at a data point will be given by [21]:
3.2.5. Performance Measures
Predictive performance of MHC II peptide binding was evaluated using the root mean squared error (RMSE), as well as the area under the receiver operating characteristics curve (AUC). A smaller RMSE or higher AUC score reflects a better performance. We used a binding threshold of 500 nM to evaluate the AUC score, which is between 0 and 1, where the AUC score is equal to 1 for a perfect classifier and 0.5 for a random classifier.
A paired t-test was used for statistical comparison, and the score comparison result is considered to be statistically significant if p is less than 0.05.
4. Conclusions
The T lymphocytes are one type of the central cells of adaptive immunity, typically of cell-mediated immunity. T cell receptors only recognize antigenic peptides that are bound to MHC molecules, thus peptides displayed by MHC molecules comprise a pivotal process to activate T cells. The binding measurement by chemical and biological experiments is time consuming and expensive; hence, many computational tools have been developed for this binding prediction. In the present study, we have developed a new method, called superMHC, for class II MHC-peptide binding prediction by using supertype clustering in conjunction with RLS regression. By using the kernel-based RLS, we need to create the kernel matrix K by computing all pairwise similarities, which is memory intensive and speed consuming for very large datasets. The conjunction of RLS regression with supertype clustering enables building individual RLS regression models on a much smaller subset of the data, thus reducing the memory and speed usage.
We utilized a large-scale dataset derived from quantitative MHC binding assays to identify clusters, or supertypes, from the 41 most common class II human MHC molecules covering the DR, DP, and DQ loci. The dissimilarity in the binding specificity of any two MHC molecules was quantified by a novel RDI based on Kendall’s rank correlation coefficient. Our results identified two main supertypes for HLA-DQ and one each for HLA-DR and HLA-DP. However, we did not include all class II MHC molecules in the cluster tree construction; therefore, more supertypes might be identified in the future when more MHC molecules are considered. The identification of supertypes provides a compressed representation, and the MHC molecules assigned in different main supertypes display very limited binding repertoire overlap or functional overlap. The supertype clustering was done in a completely unsupervised way without any regard to the target. These four main supertypes and a diverse cluster have been employed to derive five base learners. The superMHC method is a more complex model that contains five base learners herein. An important issue about the ensemble method was choosing which predictions to average. The methodology chosen in this study was a uniform averaging of the predictions made by the base learners derived from the same MHC isotype. The choice of combining the predictors derived from the same MHC isotype was due to the observation that class II MHC molecules from different loci display very limited binding repertoire overlap.
There are very limited methods available for pan-allele HLA-DR, HLA-DP, and HLA-DQ binding prediction. It is more difficult to develop a cross-loci method for class II MHC molecules due to the differences of the polymorphisms and binding motifs of different loci. The superMHC method is a pan-allele method that is able to make accurate prediction for the three isotypes of HLA-DR, HLA-DP, and HLA-DQ. Both HLA-DP and HLA-DQ molecules contain the polymorphism in and chains that contributes to the diversity in antigen presentation; thus, the superMHC method considers both the and chains in the model construction by defining a pan-allele kernel on the product space of MHC chains, chains, and peptides. In addition, only a few MHC molecules have sufficient measured peptides for construction of a reliable prediction model up to date, and the pan-allele kernel enabled us to make an accurate prediction of those MHC molecules with few binders available. We compared the superMHC method with the state-of-the-art NetMHCII-2.3 and NetMHCIIpan-3.2 methods, both of which have been shown to be among the best methods for MHC II binding prediction [11,34]. Both the NetMHCII-2.3 and NetMHCIIpan-3.2 methods are based on artificial neural networks. The NetMHCII-2.3 method is a fixed-allele method that can only make predictions of 25 HLA-DR, 9 HLA-DP, and 20 HLA-DQ molecules. The same as the superMHC method, the NetMHCIIpan-3.2 method is a pan-allele method, which integrates information of both peptides and MHC molecules and is capable of predicting binding affinities to all class II HLA molecules with a known primary sequence. The NetMHCIIpan-3.2 method considered information of class II MHC molecules using a binding pocket pseudo-sequence of 34 residues in length; however, the superMHC method incorporated the continuous region covering the whole of exon 2, which encodes the peptide-binding sites. We first evaluated superMHC on the NetMHCIIpan-3.2 dataset by five-fold cross-validation, and the results show that the performance of superMHC is significantly better than NetMHCII-2.3, while comparable with NetMHCIIpan-3.2 and the consensus method of NetMHCII-2.3 and NetMHCIIpan-3.2. Next, we used the whole NetMHCIIpan-3.2 dataset for training and validated superMHC on a new test set downloaded from the Immune Epitope Database (IEDB). This test set has no MHC-peptide pairs overlapping with the training set. The NetMHCII-2.3 and the consensus method of NetMHCII-2.3 and NetMHCIIpan-3.2 can only make the prediction in 9 out of 33 MHC molecules in the test set, while superMHC and NetMHCIIpan-3.2 can make the prediction for the whole test set covering three MHC II isotypes. The performance of superMHC in comparison to NetMHCIIpan-3.2 is not significantly different in terms of RMSE (P > 0.05, paired t-test). Specifically, the superMHC method achieves the best performance in 15 out of 33 MHC molecules among the four compared methods.
In summary, the purpose of this work was to present a framework of the utility of supertype clustering to gain more information about the data to improve the prediction accuracy of class II MHC-peptide binding. The results show that the ensemble method superMHC achieves the state-of-the-art performance. This ensemble learning framework of combining supertype clustering with RLS regression is applicable to other base learning algorithms, which can be support vector machines, neural networks, or other kinds of machine learning algorithms.
Author Contributions
Conceptualization, W.-J.S. and X.Z. Data curation, W.-J.S. and X.Z. Formal analysis, W.-J.S., X.Z., S.Z., C.L., and W.C. Funding acquisition, W.-J.S. and S.Z. Methodology, W.-J.S., X.Z., and C.L. Project administration, W.-J.S. Software, X.Z. and C.L. Supervision, W.-J.S. Validation, W.-J.S. and W.C. Visualization, W.-J.S. and X.Z. Writing, original draft, W.-J.S. and S.Z. Writing, review and editing, W.-J.S. and S.Z.
Funding
The work was supported by the National Natural Science Foundation of China (Grant No. 61502292), the Scientific and Technological Project of Guangzhou (Project No. 201607010053), and the Postgraduate Educational Reform project of Guangdong Province (No. 2017JGXM-MS45).
Conflicts of Interest
The authors declare no conflict of interest.
References
- Germain, R.N. MHC-dependent antigen processing and peptide presentation: Providing ligands for T lymphocyte activation. Cell 1994, 76, 287–299. [Google Scholar] [CrossRef]
- Kindt, T.J.; Goldsby, R.A.; Osborne, B.A.; Kuby, J. Kuby Immunology; Macmillan: London, UK, 2007. [Google Scholar]
- Lund, O.; Nielsen, M.; Brunak, S.; Lundegaard, C.; Kesmir, C. Immunol. Bioinform.; MIT Press: Cambridge, MA, USA, 2005. [Google Scholar]
- Robinson, J.; Waller, M.J.; Parham, P.; Groot, N.D.; Bontrop, R.; Kennedy, L.J.; Stoehr, P.; Marsh, S.G. IMGT/HLA and IMGT/MHC: Sequence databases for the study of the major histocompatibility complex. Nucleic Acids Res. 2003, 31, 311–314. [Google Scholar] [CrossRef] [PubMed]
- Sette, A.; Sidney, J. Nine major HLA class I supertypes account for the vast preponderance of HLA-A and-B polymorphism. Immunogenetics 1999, 50, 201–212. [Google Scholar] [CrossRef] [PubMed]
- Southwood, S.; Sidney, J.; Kondo, A.; del Guercio, M.F.; Appella, E.; Hoffman, S.; Kubo, R.T.; Chesnut, R.W.; Grey, H.M.; Sette, A. Several common HLA-DR types share largely overlapping peptide binding repertoires. J. Immunol. 1998, 160, 3363–3373. [Google Scholar] [PubMed]
- Sidney, J.; Steen, A.; Moore, C.; Ngo, S.; Chung, J.; Peters, B.; Sette, A. Divergent motifs but overlapping binding repertoires of six HLA-DQ molecules frequently expressed in the worldwide human population. J. Immunol. 2010, 185, 4189–4198. [Google Scholar] [CrossRef] [PubMed]
- Reche, P.A.; Reinherz, E.L. Definition of MHC supertypes through clustering of MHC peptide-binding repertoires. In Immunoinformatics; Springer: Berlin, Germany, 2007; pp. 163–173. [Google Scholar]
- Greenbaum, J.; Sidney, J.; Chung, J.; Brander, C.; Peters, B.; Sette, A. Functional classification of class II human leukocyte antigen (HLA) molecules reveals seven different supertypes and a surprising degree of repertoire sharing across supertypes. Immunogenetics 2011, 63, 325–335. [Google Scholar] [CrossRef] [PubMed]
- Karosiene, E.; Rasmussen, M.; Blicher, T.; Lund, O.; Buus, S.; Nielsen, M. NetMHCIIpan-3. 0, a common pan-specific MHC class II prediction method including all three human MHC class II isotypes, HLA-DR, HLA-DP and HLA-DQ. Immunogenetics 2013, 65, 711–724. [Google Scholar] [CrossRef] [PubMed]
- Jensen, K.K.; Andreatta, M.; Marcatili, P.; Buus, S.; Greenbaum, J.A.; Yan, Z.; Sette, A.; Peters, B.; Nielsen, M. Improved methods for predicting peptide binding affinity to MHC class II molecules. Immunology 2018, 154, 394–406. [Google Scholar] [CrossRef] [PubMed]
- Al-Attiyah, R.; Mustafa, A. Computer-assisted prediction of HLA-DR binding and experimental analysis for human promiscuous Th1-cell peptides in the 24 kDa secreted lipoprotein (LppX) of Mycobacterium tuberculosis. Scand. J. Immunol. 2004, 59, 16–24. [Google Scholar] [CrossRef] [PubMed]
- Mustafa, A.S.; Shaban, F.A. ProPred analysis and experimental evaluation of promiscuous T-cell epitopes of three major secreted antigens of Mycobacterium tuberculosis. Tuberculosis 2006, 86, 115–124. [Google Scholar] [CrossRef] [PubMed]
- Sturniolo, T.; Bono, E.; Ding, J.; Raddrizzani, L.; Tuereci, O.; Sahin, U.; Braxenthaler, M.; Gallazzi, F.; Protti, M.P.; Sinigaglia, F.; et al. Generation of tissue-specific and promiscuous HLA ligand databases using DNA microarrays and virtual HLA class II matrices. Nat. Biotechnol. 1999, 17, 555. [Google Scholar] [CrossRef] [PubMed]
- Zhang, L.; Chen, Y.; Wong, H.S.; Zhou, S.; Mamitsuka, H.; Zhu, S. TEPITOPEpan: extending TEPITOPE for peptide binding prediction covering over 700 HLA-DR molecules. PLoS ONE 2012, 7, e30483. [Google Scholar] [CrossRef] [PubMed]
- Nielsen, M.; Lund, O. NN-align. An artificial neural network-based alignment algorithm for MHC class II peptide binding prediction. BMC Bioinform. 2009, 10, 296. [Google Scholar] [CrossRef] [PubMed] [Green Version]
- Andreatta, M.; Karosiene, E.; Rasmussen, M.; Stryhn, A.; Buus, S.; Nielsen, M. Accurate pan-specific prediction of peptide-MHC class II binding affinity with improved binding core identification. Immunogenetics 2015, 67, 641–650. [Google Scholar] [CrossRef] [PubMed] [Green Version]
- Shen, W.J.; Wong, H.S.; Xiao, Q.W.; Guo, X.; Smale, S. Introduction to the Peptide Binding Problem of Computational Immunology: New Results. Found. Comput. Math. 2013, 14, 951–984. [Google Scholar] [CrossRef]
- Kendall, M.G. Rank correlation methods. Math. Stat. Psychol. 1955, 68. [Google Scholar] [CrossRef]
- Day, W.H.; Edelsbrunner, H. Efficient algorithms for agglomerative hierarchical clustering methods. J. Classif. 1984, 1, 7–24. [Google Scholar] [CrossRef]
- Rifkin, R.M.; Lippert, R.A. Notes on Regularized Least Squares. 2007. Available online: http://cbcl.mit.edu/publications/ps/MIT-CSAIL-TR-2007-025.pdf (accessed on 17 November 2018).
- Vita, R.; Zarebski, L.; Greenbaum, J.A.; Emami, H.; Hoof, I.; Salimi, N.; Damle, R.; Sette, A.; Peters, B. The immune epitope database 2.0. Nucleic Acids Res. 2009, 38, D854–D862. [Google Scholar] [CrossRef] [PubMed]
- Stern, L.J.; Brown, J.H.; Jardetzky, T.S.; Gorga, J.C.; Urban, R.G.; Strominger, J.L.; Wiley, D.C. Crystal structure of the human class II MHC protein HLA-DR1 complexed with an influenza virus peptide. Nature 1994, 368, 215. [Google Scholar] [CrossRef] [PubMed]
- Norimine, J.; Brown, W.C. Intrahaplotype and interhaplotype pairing of bovine leukocyte antigen DQA and DQB molecules generate functional DQ molecules important for priming CD4+ T-lymphocyte responses. Immunogenetics 2005, 57, 750–762. [Google Scholar] [CrossRef] [PubMed]
- Yin, B.C.; Yue, F.; Ye, B.C. Construction of microarrays for genotyping of DQA using unmodified 45-mer oligonucleotide. Mol. Biotechnol. 2007, 36, 142–150. [Google Scholar] [CrossRef] [PubMed]
- Wang, P.; Sidney, J.; Kim, Y.; Sette, A.; Lund, O.; Nielsen, M.; Peters, B. Peptide binding predictions for HLA DR, DP and DQ molecules. BMC Bioinform. 2010, 11, 568. [Google Scholar] [CrossRef] [PubMed] [Green Version]
- Croux, C.; Dehon, C. Influence functions of the Spearman and Kendall correlation measures. Stat. Methods Appl. 2010, 19, 497–515. [Google Scholar] [CrossRef] [Green Version]
- Hansen, L.K.; Salamon, P. Neural network ensembles. IEEE Trans. Pattern Anal. Mach. Intell. 1990, 12, 993–1001. [Google Scholar] [CrossRef] [Green Version]
- Kuncheva, L.I.; Whitaker, C.J. Measures of diversity in classifier ensembles and their relationship with the ensemble accuracy. Mach. Learn. 2003, 51, 181–207. [Google Scholar] [CrossRef]
- Trivedi, S.; Pardos, Z.A.; Heffernan, N.T. The utility of clustering in prediction tasks. arXiv, 2015; arXiv:1509.06163. [Google Scholar]
- Wang, G.; Hao, J.; Ma, J.; Jiang, H. A comparative assessment of ensemble learning for credit scoring. Expert Syst. Appl. 2011, 38, 223–230. [Google Scholar] [CrossRef]
- Zhang, S.; Yang, Z.; Xing, X.; Gao, Y.; Xie, D.; Wong, H.S. Generalized Pair-Counting Similarity Measures for Clustering and Cluster Ensembles. IEEE Access 2017, 5, 16904–16918. [Google Scholar] [CrossRef]
- Henikoff, S.; Henikoff, J.G. Amino acid substitution matrices from protein blocks. Proc. Natl. Acad. Sci. USA 1992, 89, 10915–10919. [Google Scholar] [CrossRef] [PubMed]
- Zhang, L.; Udaka, K.; Mamitsuka, H.; Zhu, S. Toward more accurate pan-specific MHC-peptide binding prediction: A review of current methods and tools. Brief. Bioinform. 2011, 13, 350–364. [Google Scholar] [CrossRef] [PubMed]
Figure 1.
Cluster tree on 41 class II HLA molecules. The height of each horizontal line corresponds to the distance between the two clusters it merges. The numbers given in the figure are the diameters of the corresponding unions of clusters. Four main clusters, main DR, main DQ1, main DQ2, and main DP, are highlighted in red, orange, blue, and green, respectively.

Figure 2.
Comparison of the number of peptide binders with repertoire dissimilarity index (RDI) values of class II HLA molecules. (a) Heatmap of the number of peptide binders shared by HLA molecules; (b) heatmap of the RDI values between HLA molecules.
Figure 2.
Comparison of the number of peptide binders with repertoire dissimilarity index (RDI) values of class II HLA molecules. (a) Heatmap of the number of peptide binders shared by HLA molecules; (b) heatmap of the RDI values between HLA molecules.

Figure 3.
Sequence logos for anchor pocket residues of MHC II chains. The residues making up anchor pockets 1, 4, 6, 7, and 9 are separated by gray vertical lines. Pocket 1 consists of residue 86. Pocket 4 consists of residues 13, 70, 71, 74, and 78. Pocket 6 consists of residue 11. Pocket 7 consists of residues 28, 30, 47, 61, 67, and 71. Pocket 9 consists of residues 9, 37, 57, 60, and 61. The residues are numbered based on the HLA-DR chain.

Figure 4.
Schematic illustration of generating multiple prediction models.

Figure 5.
Schematic illustration of making a prediction on a test point.


Table 1.
Overview of the class II MHC peptide-binding repertoires.
| Allele | #Peptides | #Binders |
|---|---|---|
| DRB1_0101 | 9605 | 6049 |
| DRB1_0401 | 5834 | 2984 |
| DRB1_0404 | 3361 | 1846 |
| DRB1_0701 | 5857 | 3418 |
| DRB1_0802 | 4160 | 2023 |
| DRB1_0901 | 4090 | 2146 |
| DRB1_1001 | 1995 | 1485 |
| DRB1_1101 | 5320 | 2646 |
| DRB1_1302 | 4061 | 2178 |
| DRB1_1501 | 4374 | 2051 |
| DRB1_1602 | 1643 | 977 |
| DRB3_0301 | 778 | 504 |
| DRB4_0101 | 3634 | 1520 |
| DRB4_0103 | 700 | 522 |
| DRB5_0101 | 4495 | 2381 |
| HLA-DPA10103-DPB10201 | 674 | 139 |
| HLA-DPA10103-DPB10301 | 1280 | 566 |
| HLA-DPA10103-DPB10401 | 2251 | 637 |
| HLA-DPA10103-DPB10601 | 437 | 240 |
| HLA-DPA10201-DPB10101 | 2272 | 808 |
| HLA-DPA10201-DPB10501 | 2119 | 710 |
| HLA-DPA10201-DPB11401 | 2017 | 844 |
| HLA-DPA10301-DPB10402 | 2381 | 879 |
| HLA-DQA10101-DQB10501 | 2489 | 815 |
| HLA-DQA10102-DQB10502 | 643 | 156 |
| HLA-DQA10102-DQB10602 | 2599 | 1253 |
| HLA-DQA10103-DQB10603 | 255 | 90 |
| HLA-DQA10104-DQB10503 | 723 | 105 |
| HLA-DQA10201-DQB10202 | 793 | 119 |
| HLA-DQA10201-DQB10301 | 624 | 374 |
| HLA-DQA10201-DQB10303 | 554 | 265 |
| HLA-DQA10201-DQB10402 | 570 | 238 |
| HLA-DQA10301-DQB10302 | 2812 | 568 |
| HLA-DQA10303-DQB10402 | 323 | 117 |
| HLA-DQA10401-DQB10402 | 2707 | 928 |
| HLA-DQA10501-DQB10201 | 2663 | 873 |
| HLA-DQA10501-DQB10301 | 3474 | 1809 |
| HLA-DQA10501-DQB10302 | 680 | 203 |
| HLA-DQA10501-DQB10303 | 461 | 179 |
| HLA-DQA10501-DQB10402 | 614 | 336 |
| HLA-DQA10601-DQB10402 | 352 | 132 |
| Total | 96,674 | 46,113 |
Table 2.
Broad supertypes, split supertypes, and binding motifs.
| Broad Supertype | Split Supertype | HLA Molecule | Common Binding Motifs | ||||||||
|---|---|---|---|---|---|---|---|---|---|---|---|
| p1 | p2 | p3 | p4 | p5 | p6 | p7 | p8 | p9 | |||
| DRB3*0301 | |||||||||||
| DR52 | DRB1*1302 | ILVF | NS | ASN | VIL | ||||||
| DRB1*0101 | |||||||||||
| DRB1*1001 | |||||||||||
| DRB1*0701 | |||||||||||
| DRB1*0901 | |||||||||||
| DR1 | DRB1*1602 | FYIL | LAIST | ASGPT | LV | ||||||
| DRB1*0401 | |||||||||||
| DRB1*0404 | |||||||||||
| main DR | DRB1*1501 | ||||||||||
| DRB1*0802 | |||||||||||
| DRB5*0101 | |||||||||||
| DR53 | DRB1*1101 | ||||||||||
| DRB4*0101 | FILY | R | LAIV | R | AR | RL | R | R | |||
| DRB4*0103 | |||||||||||
| HLA-DQA10501-DQB10301 | |||||||||||
| HLA-DQA10201-DQB10301 | |||||||||||
| HLA-DQA10102-DQB10602 | |||||||||||
| HLA-DQA10103-DQB10603 | |||||||||||
| DQ7 | HLA-DQA10201-DQB10303 | AVI | AGTS | AS | AVPI | ASVG | |||||
| HLA-DQA10501-DQB10302 | |||||||||||
| HLA-DQA10501-DQB10303 | |||||||||||
| HLA-DQA10201-DQB10402 | |||||||||||
| main DQ1 | HLA-DQA10303-DQB10402 | ||||||||||
| DQ4 | HLA-DQA10601-DQB10402 | FLIV | FAW | AVPIT | RA | ASLV | |||||
| HLA-DQA10501-DQB10402 | |||||||||||
| HLA-DQA10301-DQB10302 | |||||||||||
| DQ8 | HLA-DQA10401-DQB10402 | AVI | AVI | EAL | EAD | ED | |||||
| HLA-DQA10102-DQB10502 | |||||||||||
| DQ5 | HLA-DQA10104-DQB10503 | LIF | FYW | F | DLIV | D | |||||
| main DQ2 | HLA-DQA10101-DQB10501 | ||||||||||
| HLA-DQA10501-DQB10201 | |||||||||||
| DQ2 | HLA-DQA10201-DQB10202 | FLIV | AVILD | AVID | ED | ED | ELD | ||||
| HLA-DPA10103-DPB10401 | |||||||||||
| HLA-DPA10201-DPB10101 | |||||||||||
| HLA-DPA10201-DPB10501 | |||||||||||
| main DP | DP1 | HLA-DPA10301-DPB10402 | FLYI | FLYI | LF | L | |||||
| HLA-DPA10103-DPB10201 | |||||||||||
| HLA-DPA10103-DPB10601 | |||||||||||
| HLA-DPA10103-DPB10301 | |||||||||||
| DP3 | HLA-DPA10201-DPB11401 | FLRIY | RK | ALS | APVSI | AL | |||||
Table 3.
The performance of superMHC in comparison with NetMHCII-2.3, NetMHCIIpan-3.2, and their consensus method on the NetMHCIIpan-3.2 dataset in terms of AUC.
Table 3.
The performance of superMHC in comparison with NetMHCII-2.3, NetMHCIIpan-3.2, and their consensus method on the NetMHCIIpan-3.2 dataset in terms of AUC.
| MHC Molecules | # of Peptides | NetMHCII-2.3 | NetMHCIIpan-3.2 | Consensus (Net) | superMHC (AUC) | superMHC (RMSE) |
| DRB1_0101 | 10412 | 0.829 | 0.832 | 0.838 | 0.835 | 0.197 |
| DRB1_0103 | 42 | 0.250 | 0.678 | 0.599 | 0.697 | 0.178 |
| DRB1_0301 | 5352 | 0.816 | 0.816 | 0.826 | 0.831 | 0.183 |
| DRB1_0401 | 6317 | 0.798 | 0.809 | 0.813 | 0.809 | 0.199 |
| DRB1_0402 | 53 | 0.633 | 0.701 | 0.649 | 0.663 | 0.229 |
| DRB1_0403 | 59 | 0.644 | 0.841 | 0.787 | 0.830 | 0.140 |
| DRB1_0404 | 3657 | 0.787 | 0.812 | 0.808 | 0.811 | 0.189 |
| DRB1_0405 | 3962 | 0.839 | 0.827 | 0.846 | 0.836 | 0.173 |
| DRB1_0701 | 6325 | 0.877 | 0.875 | 0.885 | 0.880 | 0.173 |
| DRB1_0801 | 937 | 0.834 | 0.844 | 0.854 | 0.834 | 0.170 |
| DRB1_0802 | 4465 | 0.834 | 0.834 | 0.844 | 0.842 | 0.182 |
| DRB1_0901 | 4318 | 0.832 | 0.833 | 0.843 | 0.831 | 0.175 |
| DRB1_1001 | 2066 | 0.912 | 0.923 | 0.924 | 0.910 | 0.157 |
| DRB1_1101 | 6045 | 0.867 | 0.864 | 0.873 | 0.865 | 0.175 |
| DRB1_1201 | 2384 | 0.891 | 0.868 | 0.892 | 0.883 | 0.146 |
| DRB1_1301 | 1034 | 0.828 | 0.857 | 0.856 | 0.855 | 0.225 |
| DRB1_1302 | 4477 | 0.889 | 0.885 | 0.895 | 0.883 | 0.184 |
| DRB1_1501 | 4850 | 0.833 | 0.834 | 0.842 | 0.842 | 0.188 |
| DRB1_1602 | 1699 | 0.879 | 0.883 | 0.888 | 0.883 | 0.154 |
| DRB3_0101 | 4633 | 0.898 | 0.888 | 0.900 | 0.891 | 0.160 |
| DRB3_0202 | 3334 | 0.887 | 0.869 | 0.886 | 0.873 | 0.183 |
| DRB3_0301 | 884 | 0.824 | 0.840 | 0.845 | 0.818 | 0.198 |
| DRB4_0101 | 3961 | 0.837 | 0.822 | 0.844 | 0.852 | 0.171 |
| DRB4_0103 | 846 | 0.839 | 0.841 | 0.861 | 0.867 | 0.193 |
| DRB5_0101 | 5125 | 0.849 | 0.849 | 0.858 | 0.854 | 0.192 |
| HLA-DPA10103-DPB10201 | 787 | 0.910 | 0.917 | 0.921 | 0.920 | 0.144 |
| HLA-DPA10103-DPB10301 | 1563 | 0.914 | 0.902 | 0.916 | 0.914 | 0.165 |
| HLA-DPA10103-DPB10401 | 2725 | 0.935 | 0.935 | 0.939 | 0.936 | 0.144 |
| HLA-DPA10103-DPB10402 | 45 | 0.497 | 0.710 | 0.636 | 0.515 | 0.186 |
| HLA-DPA10103-DPB10601 | 584 | 0.996 | 0.995 | 0.995 | 0.996 | 0.105 |
| HLA-DPA10201-DPB10101 | 2447 | 0.903 | 0.903 | 0.909 | 0.899 | 0.145 |
| HLA-DPA10201-DPB10501 | 2470 | 0.914 | 0.911 | 0.919 | 0.915 | 0.153 |
| HLA-DPA10201-DPB11401 | 2302 | 0.937 | 0.930 | 0.938 | 0.940 | 0.151 |
| HLA-DPA10301-DPB10402 | 2641 | 0.906 | 0.904 | 0.910 | 0.900 | 0.158 |
| HLA-DQA10101-DQB10501 | 2946 | 0.917 | 0.900 | 0.917 | 0.916 | 0.144 |
| HLA-DQA10102-DQB10501 | 833 | 0.867 | 0.839 | 0.874 | 0.869 | 0.192 |
| HLA-DQA10102-DQB10502 | 800 | 0.850 | 0.835 | 0.859 | 0.868 | 0.157 |
| HLA-DQA10102-DQB10602 | 2747 | 0.905 | 0.890 | 0.906 | 0.893 | 0.152 |
| HLA-DQA10103-DQB10603 | 462 | 0.816 | 0.861 | 0.855 | 0.856 | 0.186 |
| HLA-DQA10104-DQB10503 | 883 | 0.844 | 0.805 | 0.844 | 0.840 | 0.145 |
| HLA-DQA10201-DQB10202 | 944 | 0.851 | 0.814 | 0.853 | 0.838 | 0.133 |
| HLA-DQA10201-DQB10301 | 827 | 0.864 | 0.849 | 0.871 | 0.857 | 0.195 |
| HLA-DQA10201-DQB10303 | 761 | 0.887 | 0.894 | 0.899 | 0.891 | 0.150 |
| HLA-DQA10201-DQB10402 | 768 | 0.858 | 0.860 | 0.875 | 0.857 | 0.186 |
| HLA-DQA10301-DQB10301 | 207 | 0.761 | 0.839 | 0.814 | 0.875 | 0.183 |
| HLA-DQA10301-DQB10302 | 3111 | 0.849 | 0.810 | 0.842 | 0.854 | 0.125 |
| HLA-DQA10303-DQB10402 | 567 | 0.836 | 0.820 | 0.855 | 0.835 | 0.176 |
| HLA-DQA10401-DQB10402 | 2890 | 0.894 | 0.883 | 0.897 | 0.894 | 0.117 |
| HLA-DQA10501-DQB10201 | 2897 | 0.889 | 0.876 | 0.888 | 0.882 | 0.133 |
| HLA-DQA10501-DQB10301 | 3585 | 0.922 | 0.915 | 0.924 | 0.922 | 0.143 |
| HLA-DQA10501-DQB10302 | 847 | 0.831 | 0.822 | 0.840 | 0.824 | 0.136 |
| HLA-DQA10501-DQB10303 | 564 | 0.884 | 0.876 | 0.892 | 0.887 | 0.132 |
| HLA-DQA10501-DQB10402 | 749 | 0.857 | 0.868 | 0.876 | 0.863 | 0.166 |
| HLA-DQA10601-DQB10402 | 565 | 0.845 | 0.848 | 0.872 | 0.859 | 0.187 |
| Average | 0.840 | 0.854 | 0.861 | 0.857 | 0.167 |
Consensus (Net) represents the consensus method by averaging the prediction scores from NetMHCII-2.3 and NetMHCIIpan-3.2. The performance of superMHC in terms of RMSE is given in the last column.
Table 4.
Predictive performance of the superMHC method compared with those of NetMHCII-2.3, NetMHCIIpan-3.2, and their consensus method on the new test set in terms of RMSE.
Table 4.
Predictive performance of the superMHC method compared with those of NetMHCII-2.3, NetMHCIIpan-3.2, and their consensus method on the new test set in terms of RMSE.
| MHC Molecules | #Peptides | NetMHCII-2.3 | NetMHCIIpan-3.2 | Consensus (Net) | superMHC |
| DRB1_0101 | 1427 | 0.241 | 0.244 | 0.240 | 0.249 |
| DRB1_0301 | 912 | 0.235 | 0.222 | 0.224 | 0.230 |
| DRB1_0302 | 148 | 0.260 | 0.233 | ||
| DRB1_0401 | 1392 | 0.210 | 0.221 | 0.212 | 0.238 |
| DRB1_0402 | 6 | 0.351 | 0.238 | 0.288 | 0.292 |
| DRB1_0404 | 34 | 0.211 | 0.203 | 0.203 | 0.178 |
| DRB1_0405 | 14 | 0.202 | 0.236 | 0.213 | 0.229 |
| DRB1_0701 | 125 | 0.284 | 0.277 | 0.277 | 0.278 |
| DRB1_0801 | 9 | 0.186 | 0.126 | 0.153 | 0.105 |
| DRB1_0806 | 118 | 0.363 | 0.326 | ||
| DRB1_0813 | 1370 | 0.251 | 0.229 | ||
| DRB1_0819 | 116 | 0.213 | 0.206 | ||
| DRB1_0901 | 28 | 0.200 | 0.256 | 0.223 | 0.260 |
| DRB1_1101 | 163 | 0.338 | 0.350 | ||
| DRB1_1104 | 7 | 0.339 | 0.292 | ||
| DRB1_1201 | 115 | 0.335 | 0.340 | ||
| DRB1_1202 | 124 | 0.370 | 0.353 | ||
| DRB1_1301 | 9 | 0.352 | 0.399 | ||
| DRB1_1302 | 17 | 0.371 | 0.423 | ||
| DRB1_1402 | 125 | 0.255 | 0.237 | ||
| DRB1_1404 | 30 | 0.198 | 0.193 | ||
| DRB1_1412 | 116 | 0.310 | 0.313 | ||
| DRB1_1501 | 132 | 0.298 | 0.300 | ||
| DRB1_1502 | 6 | 0.361 | 0.447 | ||
| DRB1_1601 | 16 | 0.240 | 0.233 | ||
| DRB3_0101 | 41 | 0.281 | 0.242 | ||
| DRB3_0301 | 159 | 0.297 | 0.313 | ||
| DRB4_0101 | 18 | 0.193 | 0.207 | ||
| DRB5_0101 | 1331 | 0.226 | 0.237 | ||
| DRB5_0102 | 8 | 0.231 | 0.219 | ||
| DRB5_0202 | 16 | 0.190 | 0.233 | ||
| HLA-DPA10103-DPB10201 | 751 | 0.126 | 0.118 | ||
| HLA-DQA10302-DQB10301 | 9 | 0.203 | 0.045 | ||
| Average I | 8892 | 0.236 | 0.225 | 0.226 | 0.229 |
| Average II | 0.261 | 0.259 |
“Average I” is calculated over 9 MHC molecules covered by NetMHCII-2.3. “Average II” is calculated over all 33 MHC molecules. The smallest RMSE score in each row is marked in bold.
Table 5.
Start and end markers to identify the polymorphic region of an allele.
| Alpha Chain | Beta Chain | |||||
| Loci | DPA | DQA | DRA | DPB | DQB | DRB |
| Start | DHV | DHV | EHV | NYL/NYV | DFV | RFL |
| End | AAN/ATN | ATN | ITN | QRR | QRR | QRR |
“Start marker” represents the location of its first occurrence in the allele. “End marker” represents the location of its last occurrence in the allele.
© 2018 by the authors. Licensee MDPI, Basel, Switzerland. This article is an open access article distributed under the terms and conditions of the Creative Commons Attribution (CC BY) license (http://creativecommons.org/licenses/by/4.0/).
Share and Cite
MDPI and ACS Style
Shen, W.-J.; Zhang, X.; Zhang, S.; Liu, C.; Cui, W. The Utility of Supertype Clustering in Prediction for Class II MHC-Peptide Binding. Molecules 2018, 23, 3034. https://doi.org/10.3390/molecules23113034
AMA Style
Shen W-J, Zhang X, Zhang S, Liu C, Cui W. The Utility of Supertype Clustering in Prediction for Class II MHC-Peptide Binding. Molecules. 2018; 23(11):3034. https://doi.org/10.3390/molecules23113034
Chicago/Turabian StyleShen, Wen-Jun, Xun Zhang, Shaohong Zhang, Cheng Liu, and Wenjuan Cui. 2018. "The Utility of Supertype Clustering in Prediction for Class II MHC-Peptide Binding" Molecules 23, no. 11: 3034. https://doi.org/10.3390/molecules23113034