Analysis of the Literature and Patents on Solid Dispersions from 1980 to 2015

Abstract
:1. Introduction
2. Data Source and Analytical Methods
2.1. Data Source
- For SCIE:
- Topics = “solid dispersion” OR “solid dispersions”,
- The publication period = “1980 to 2015”, (Retrieved date 30-04-2016).
- For DII:
- Topics = “solid dispersion*” AND
- Derwent Manual Code = “B*”
- The publication period = “1980 to 2015”, (Retrieved date 30-04-2016).
2.2. Analytical Methods
- (a)
- Years per slice: 6 years as the length of a single time slice;
- (b)
- Threshold selection: the most cited references per time slice was selected to map the global cooperation of the top 50 countries and institutes; the references with the most citing numbers per time slice were selected to map the top 10% co-cited journals and literature.
- (c)
- Pruning and merging: the pathfinder approach.
3. Result
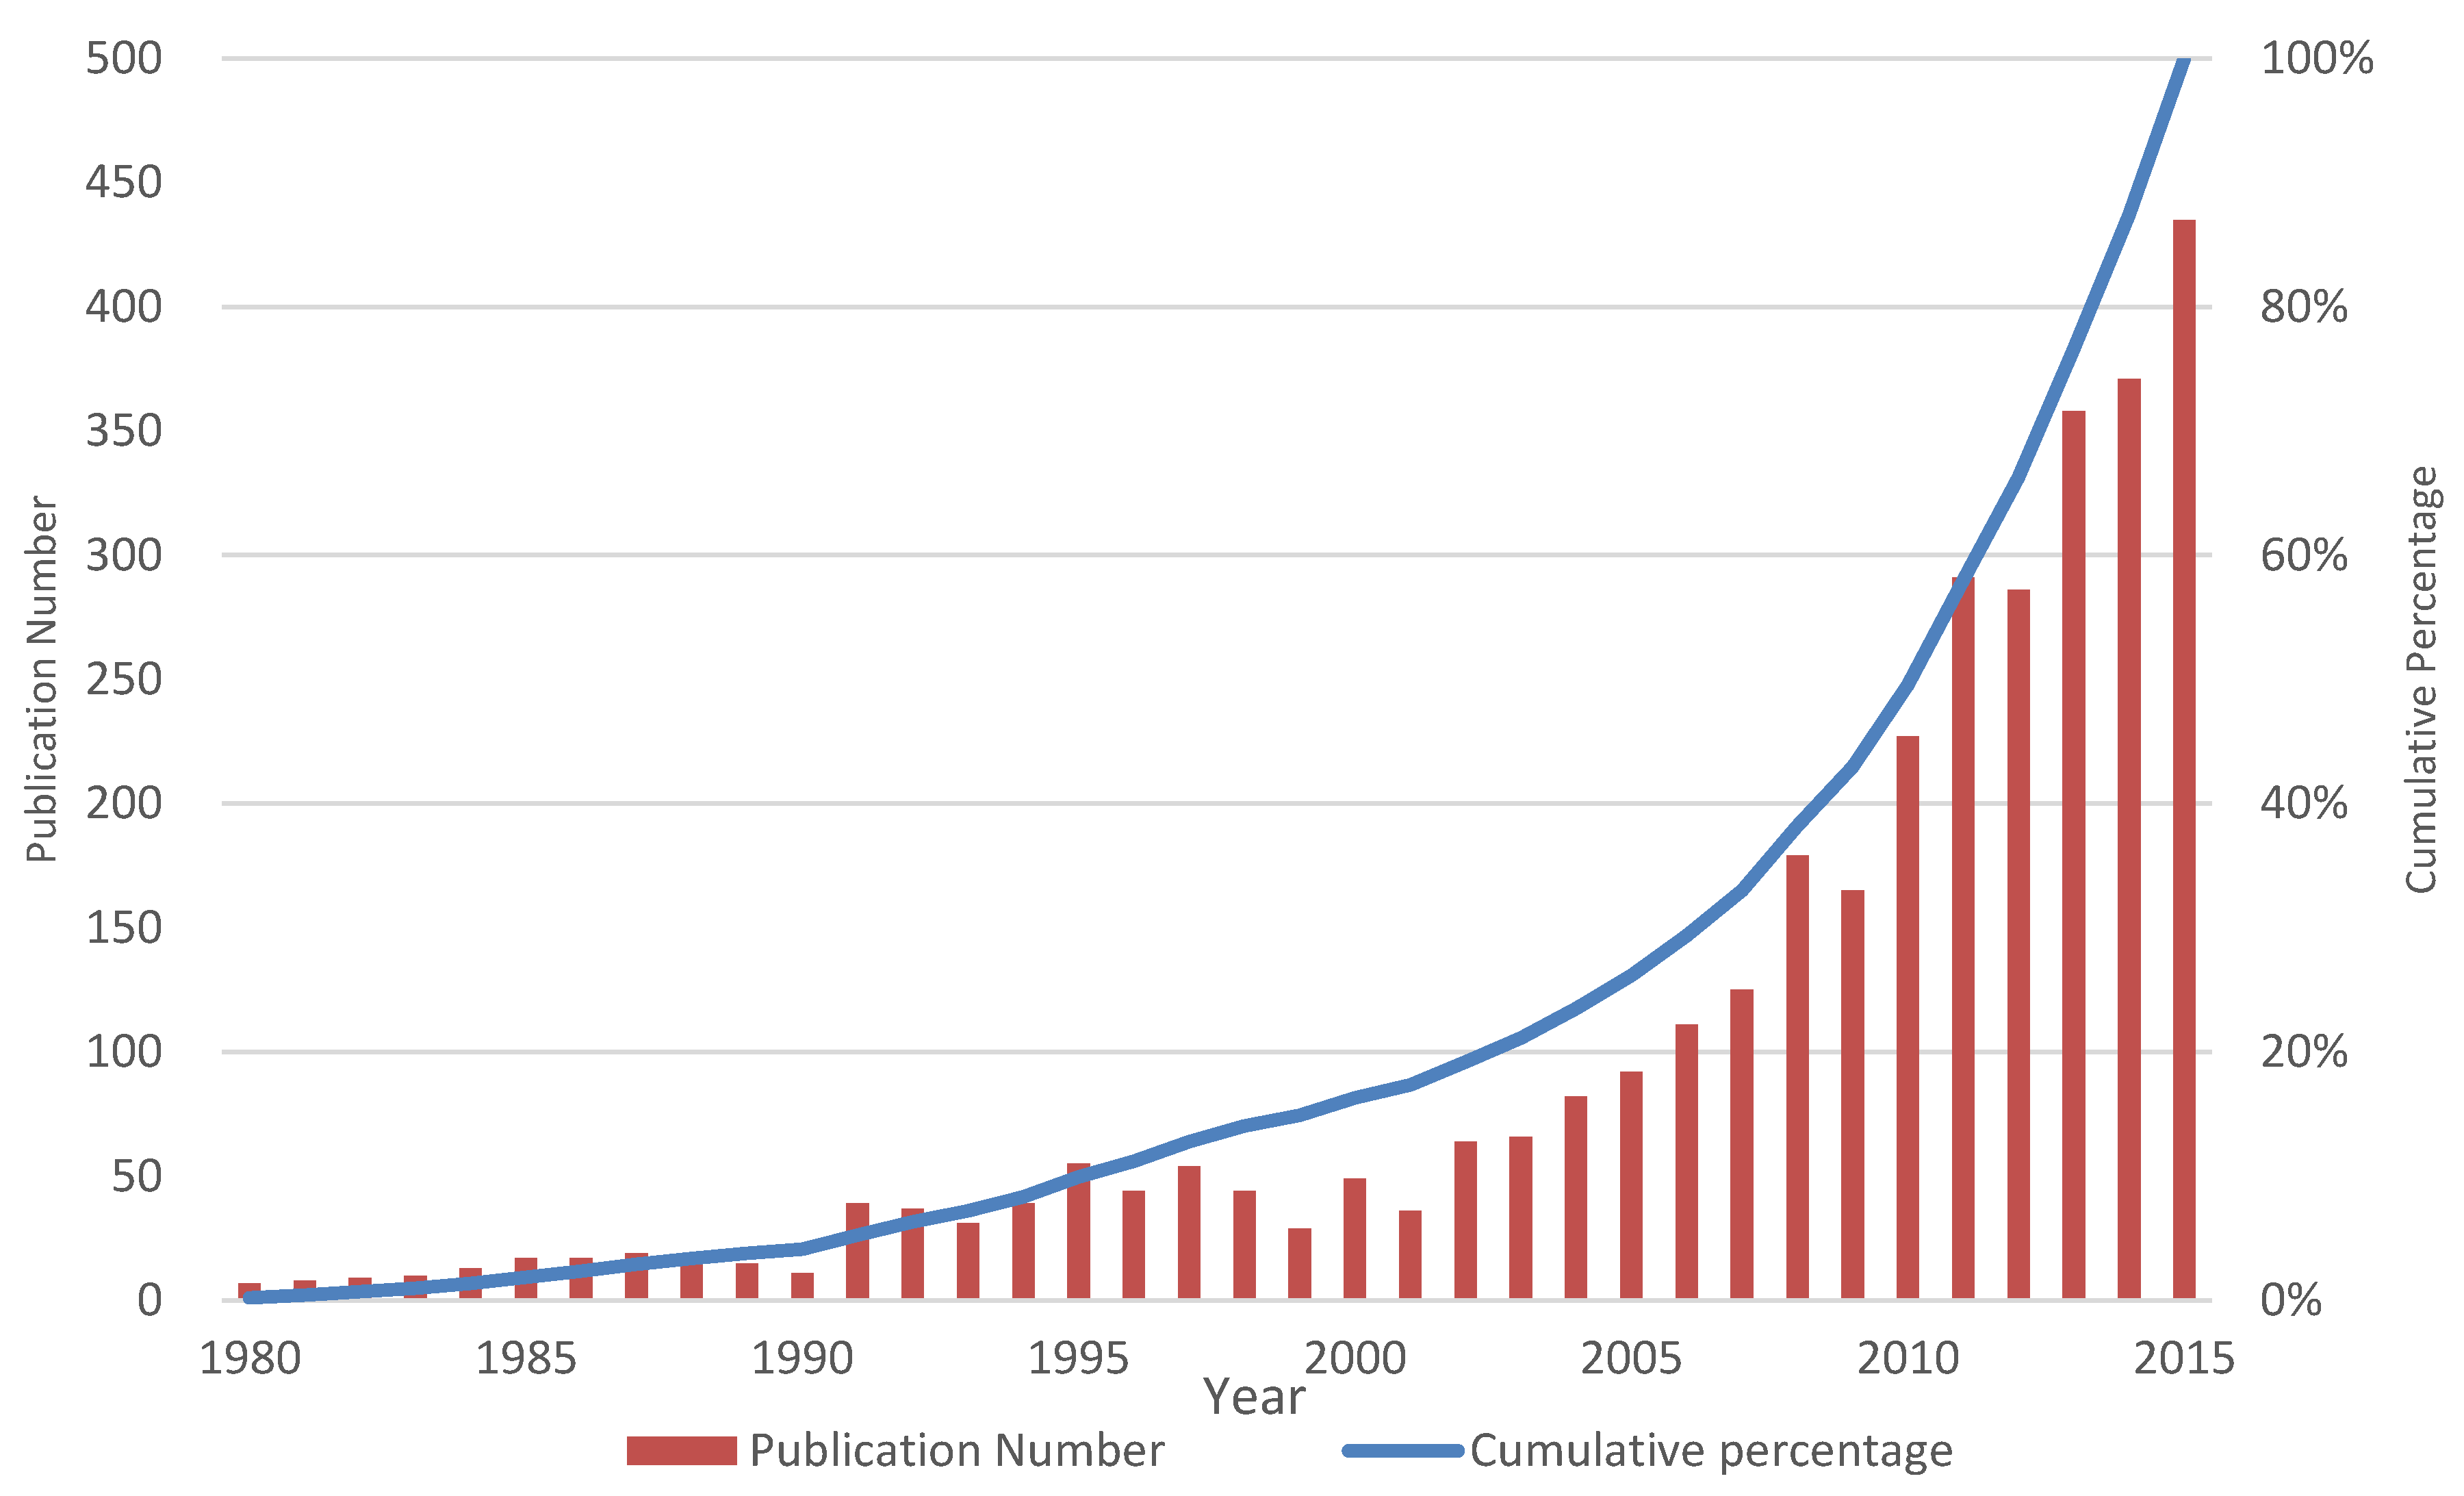
3.1. Characteristics of Publication Output about Solid Dispersions from 1980 to 2015
3.2. Analysis and Mapping of International Contribution
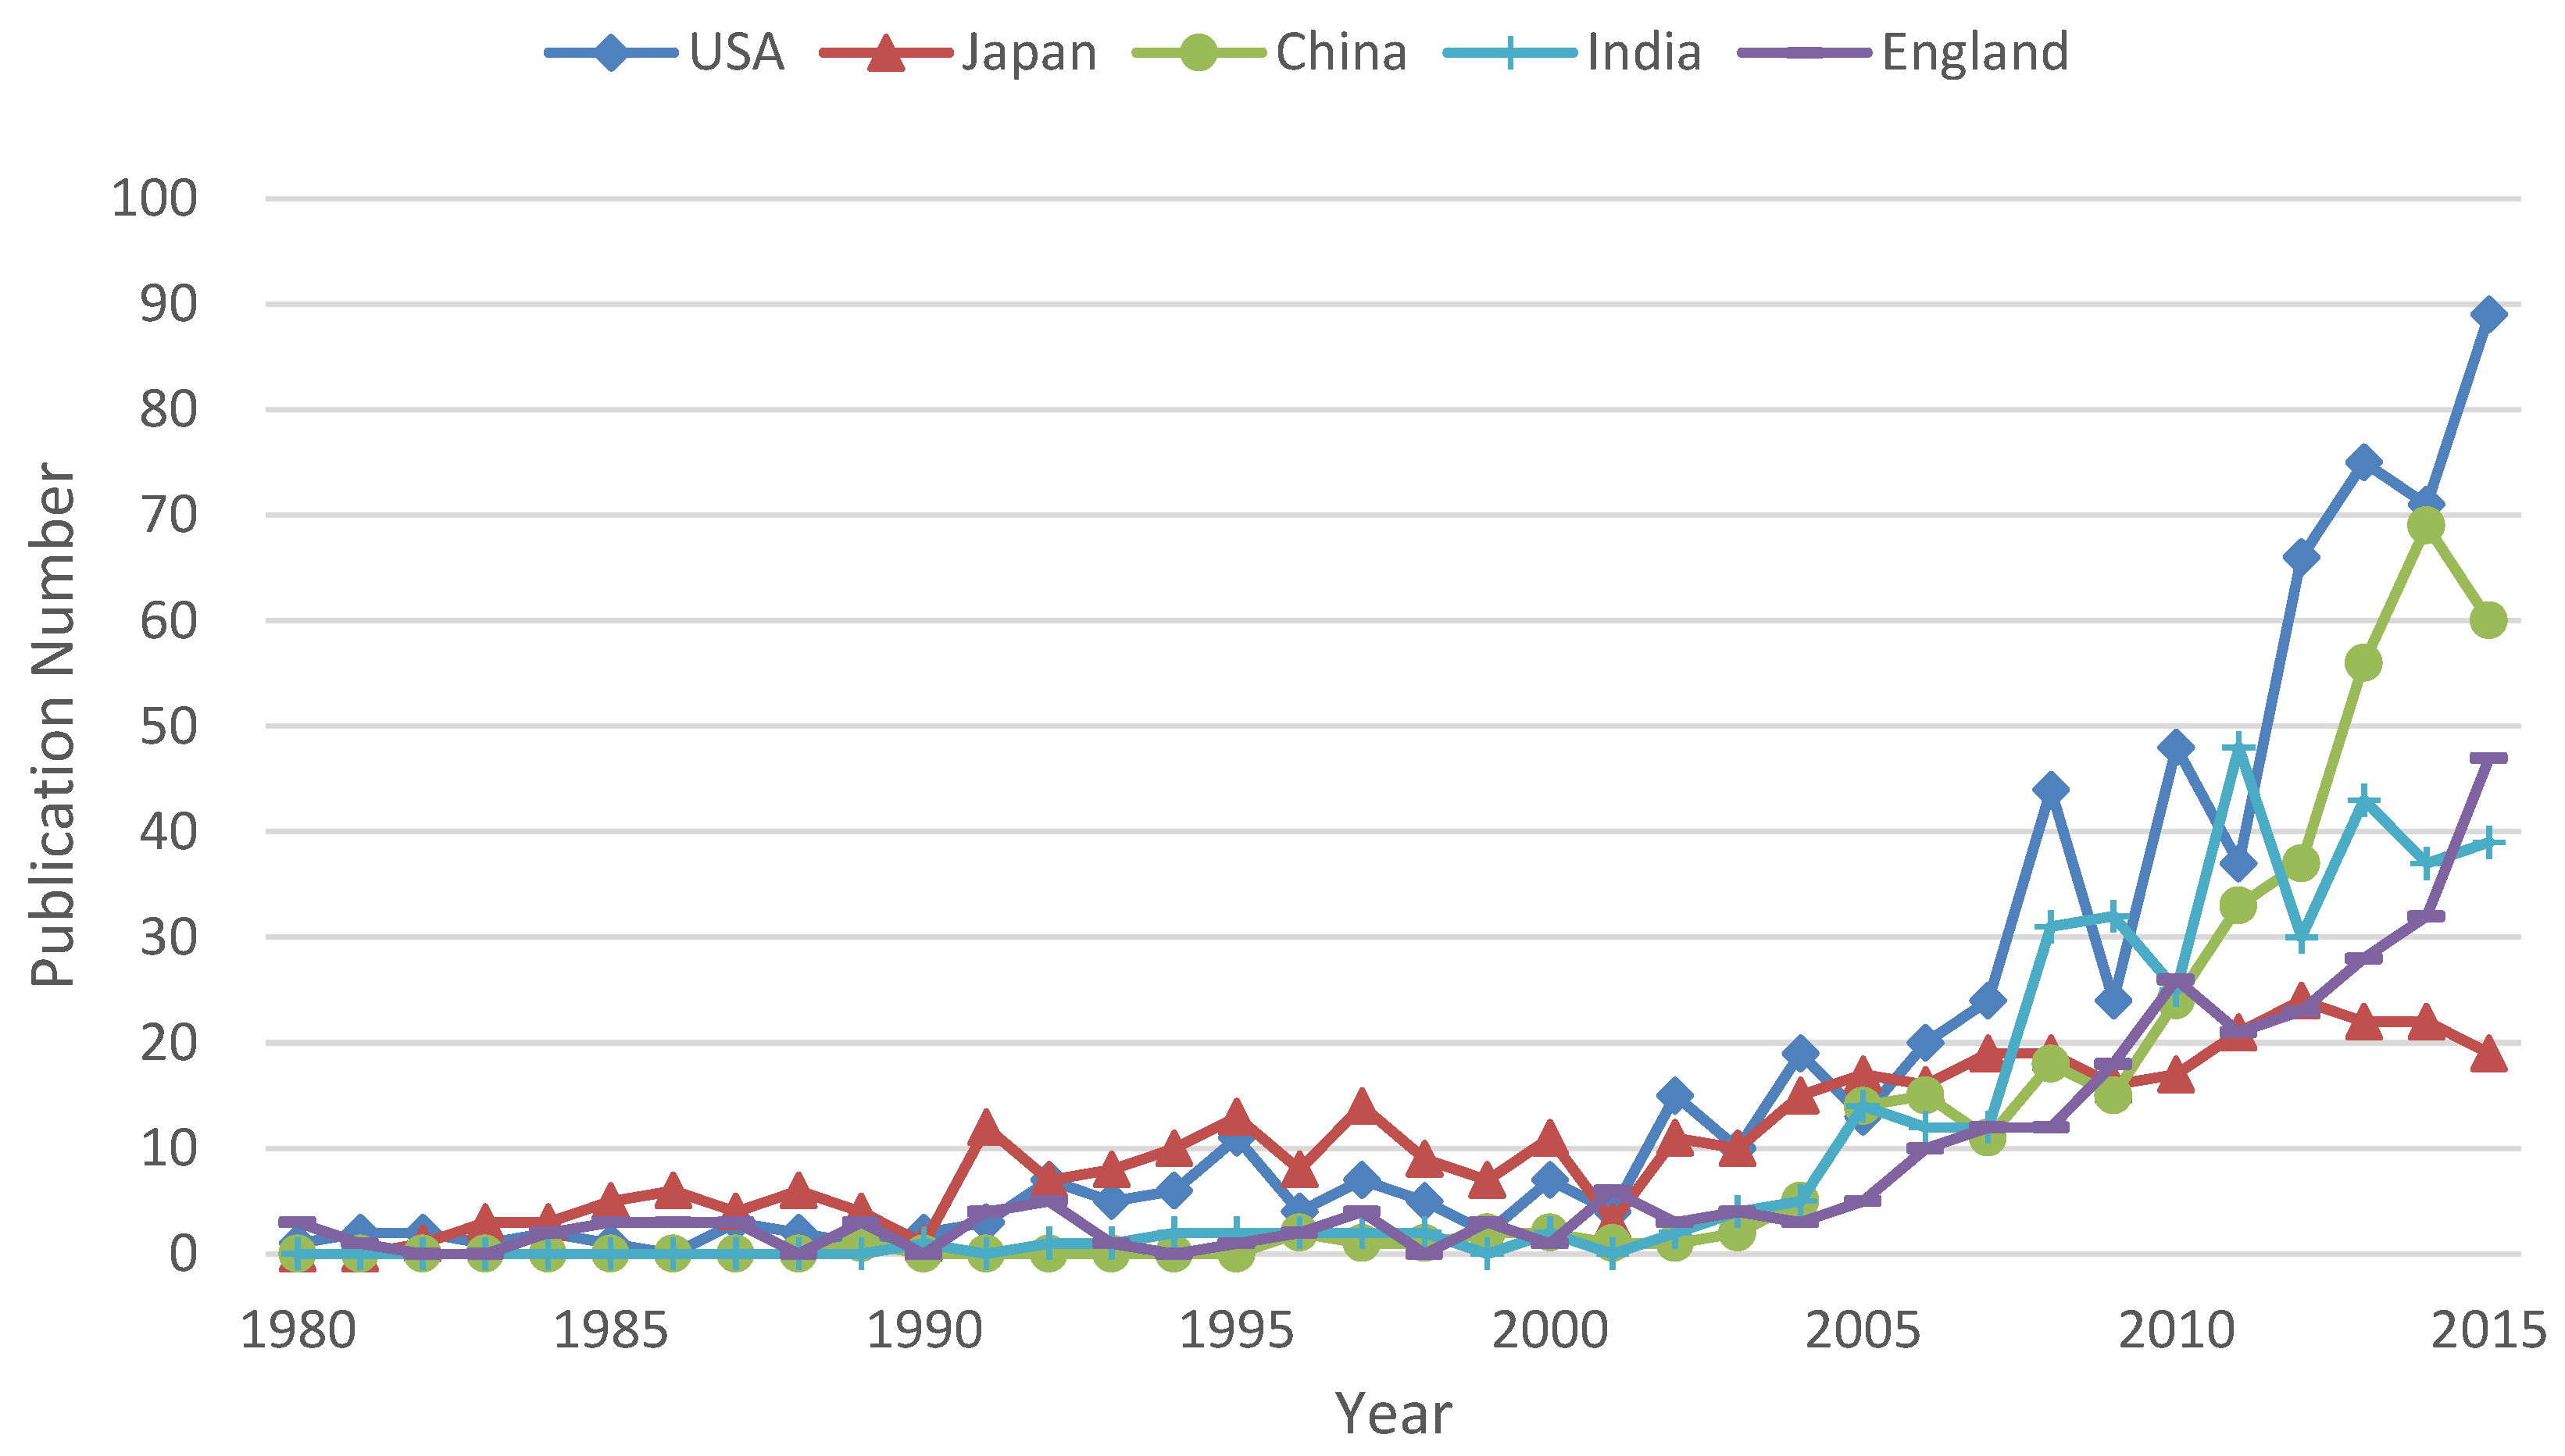
3.2.1. Main Countries
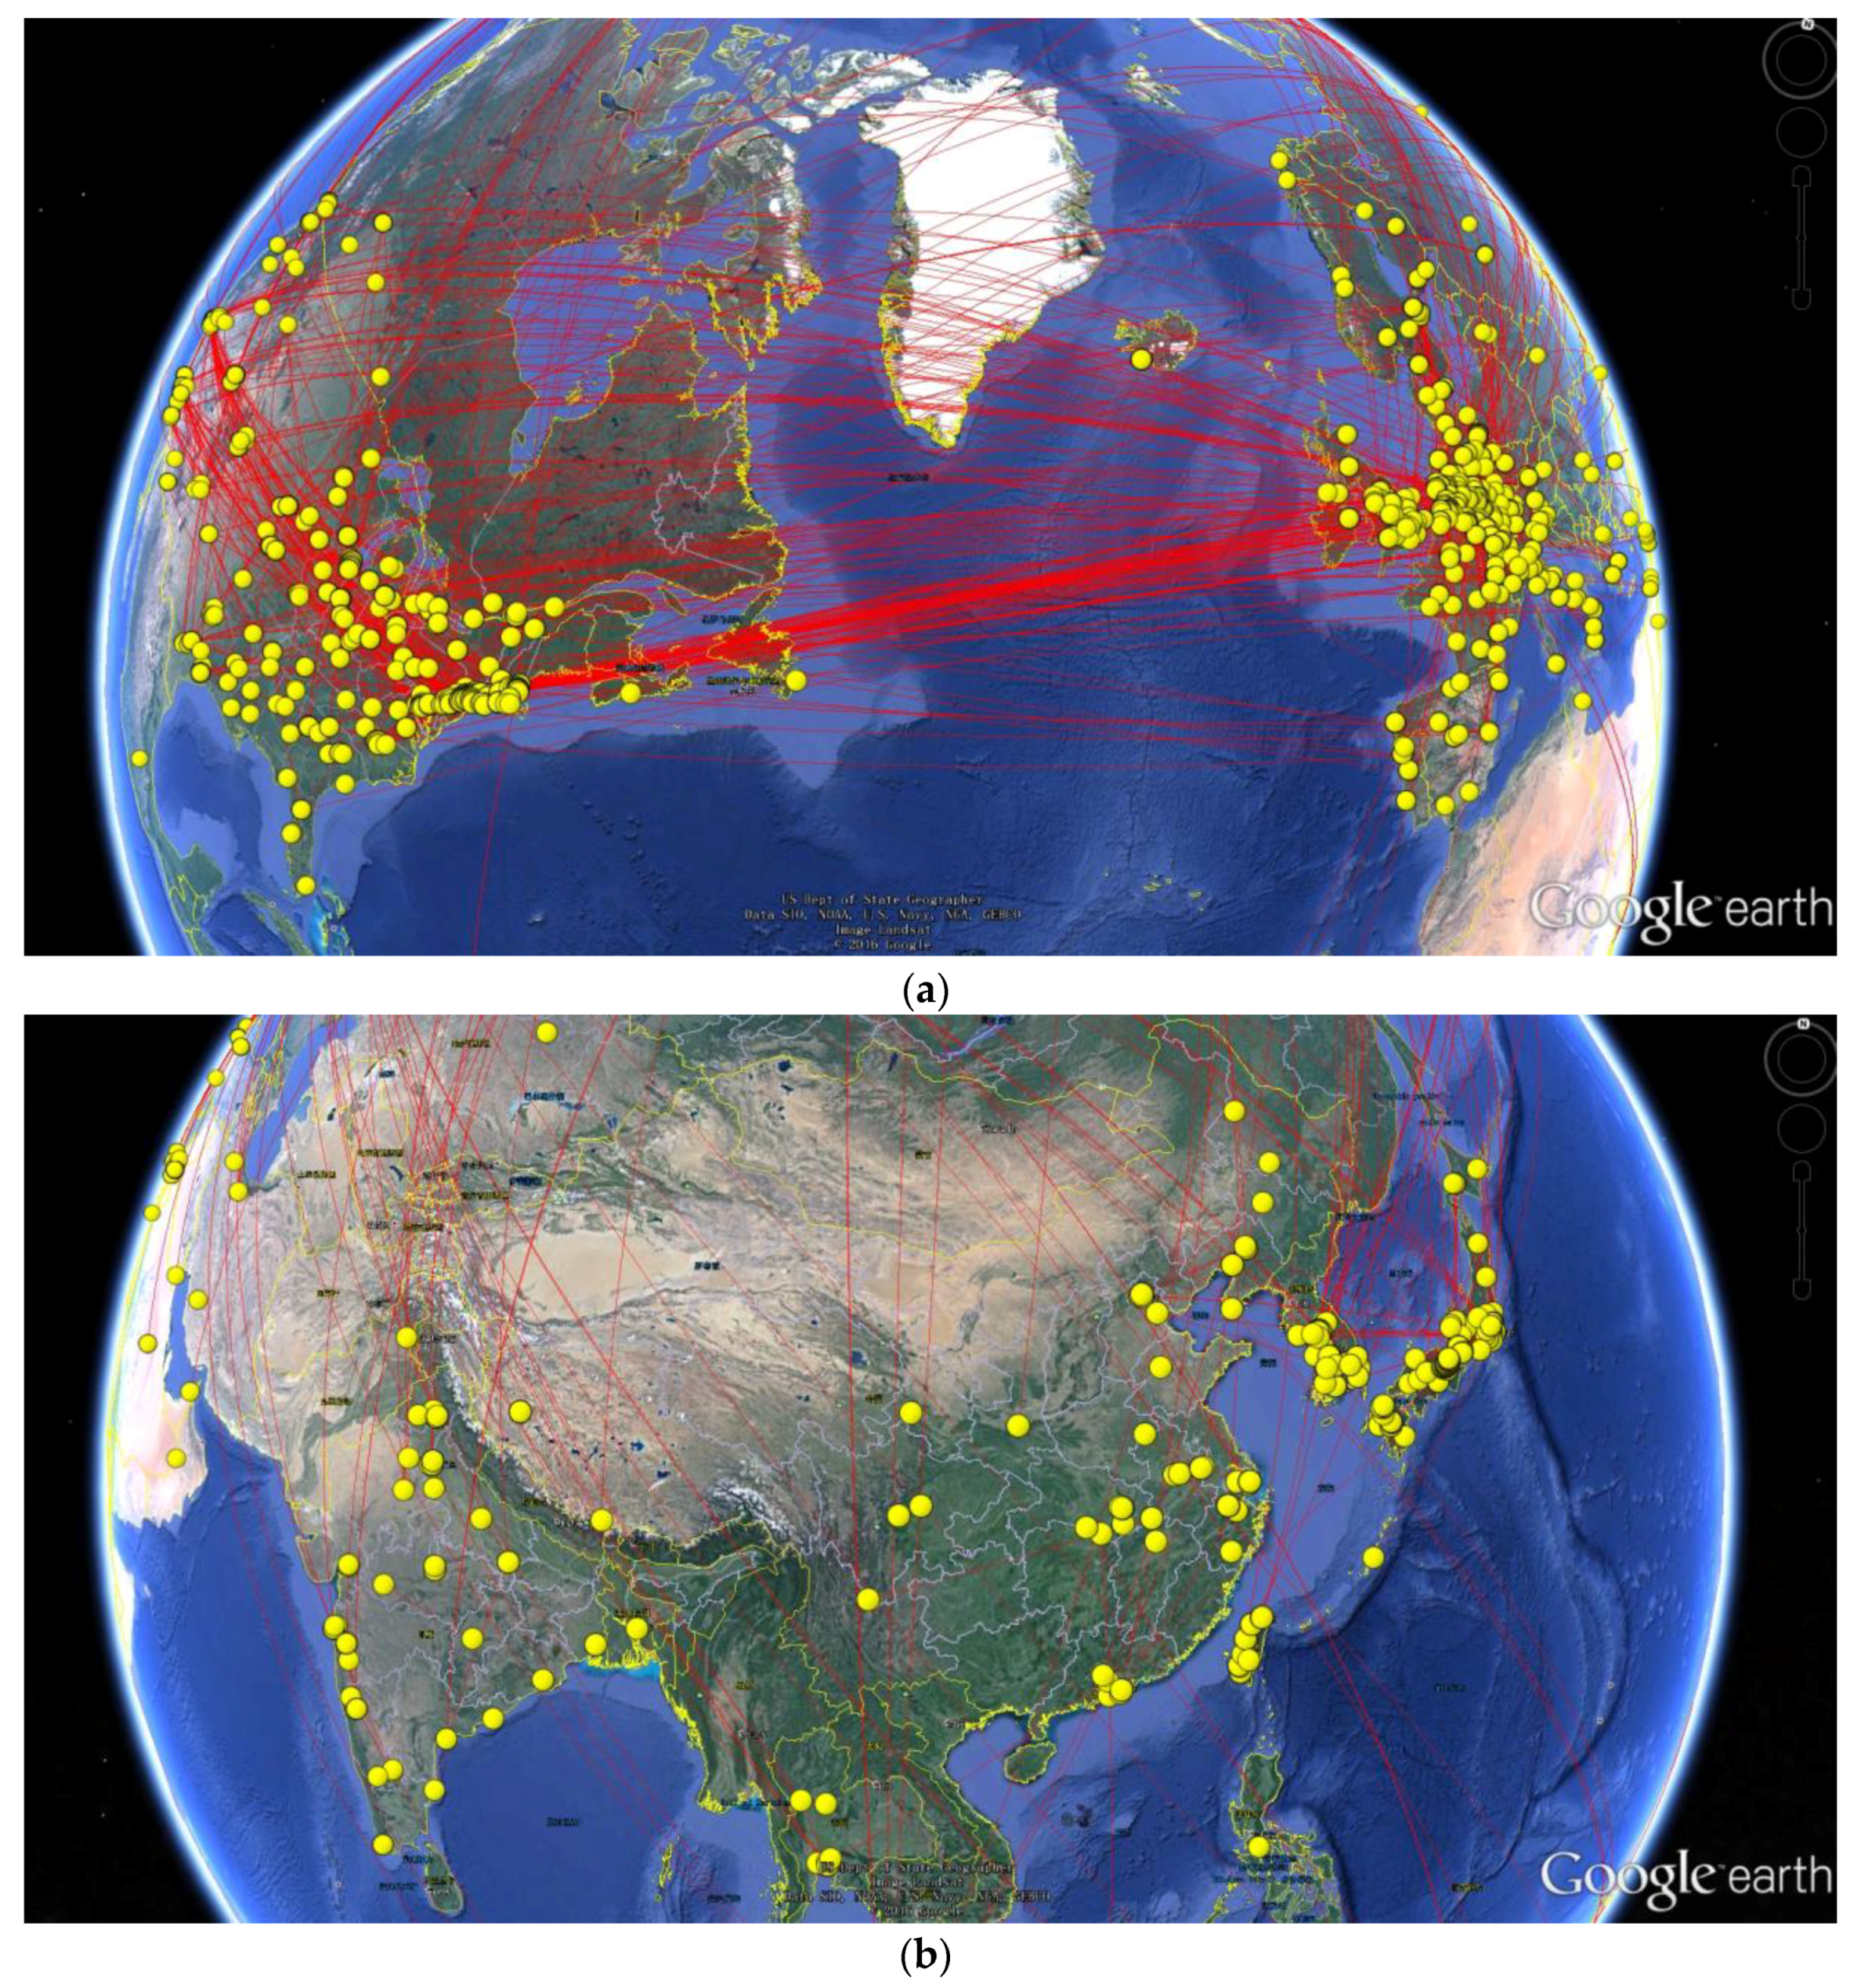
3.2.2. Global Network of Cooperation
3.3. Analysis and Mapping of the Institution Distribution
3.3.1. Network of the Institution Cooperation
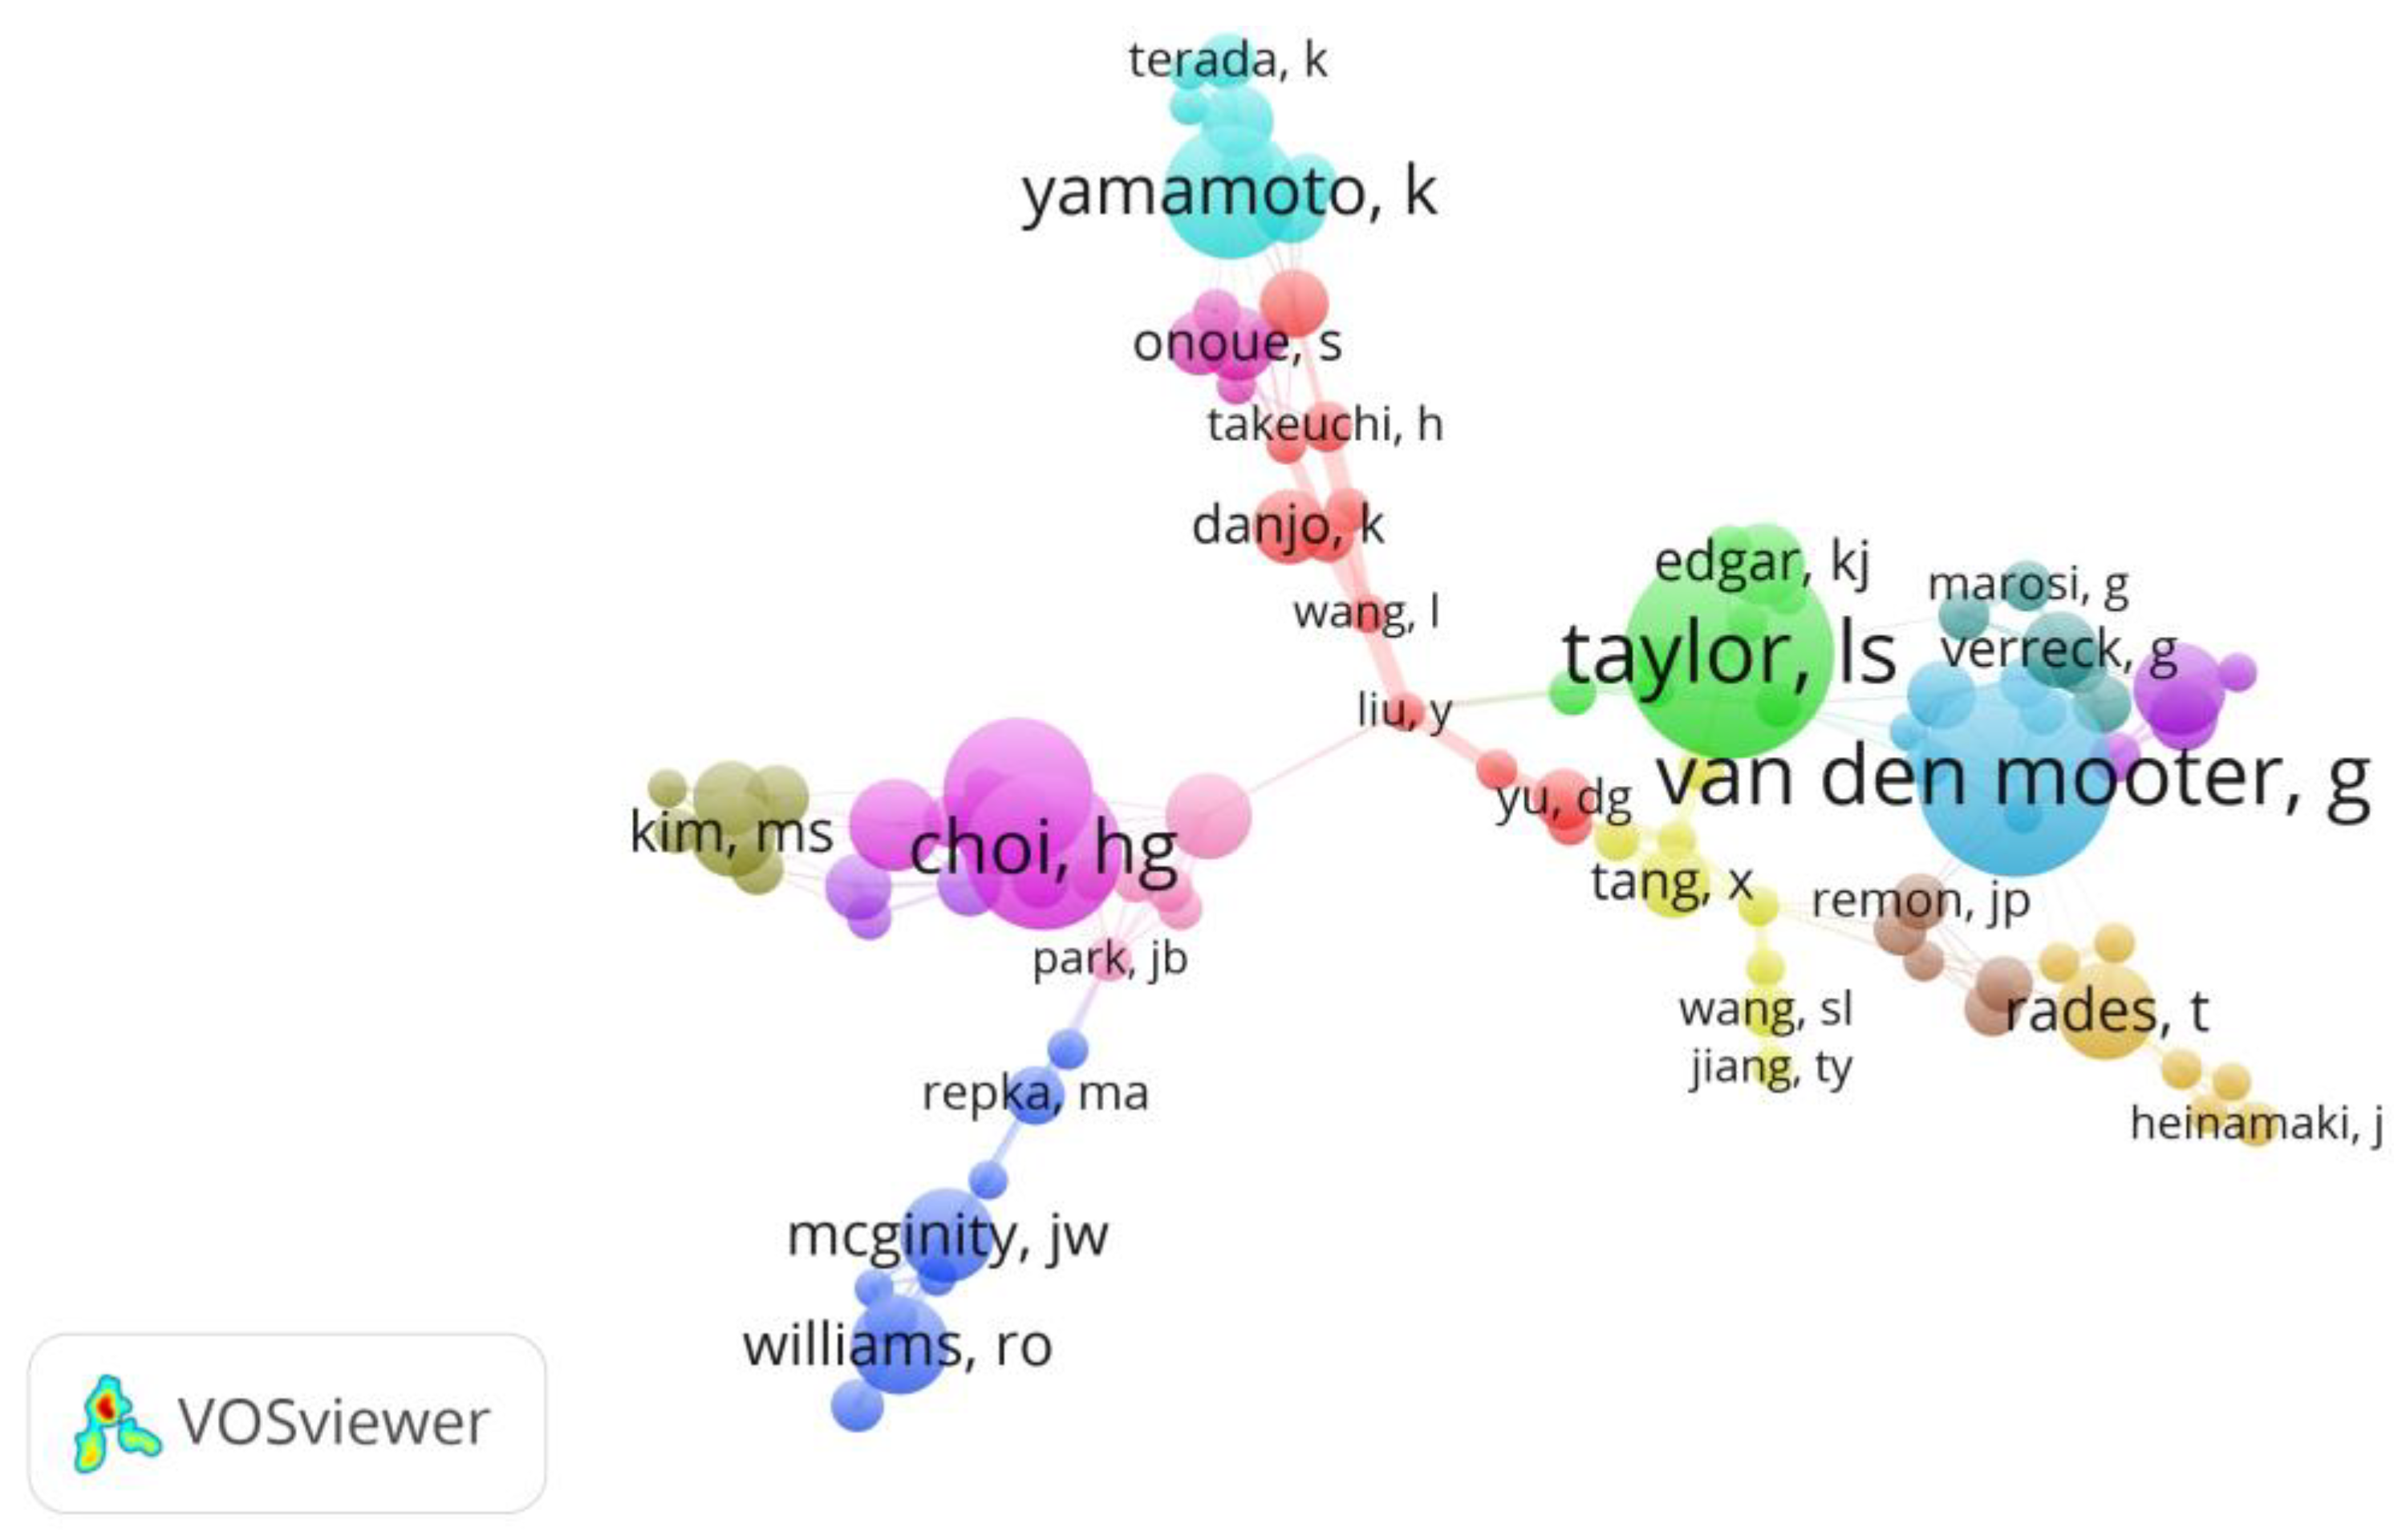
3.3.2. Network of Authors’ Cooperation
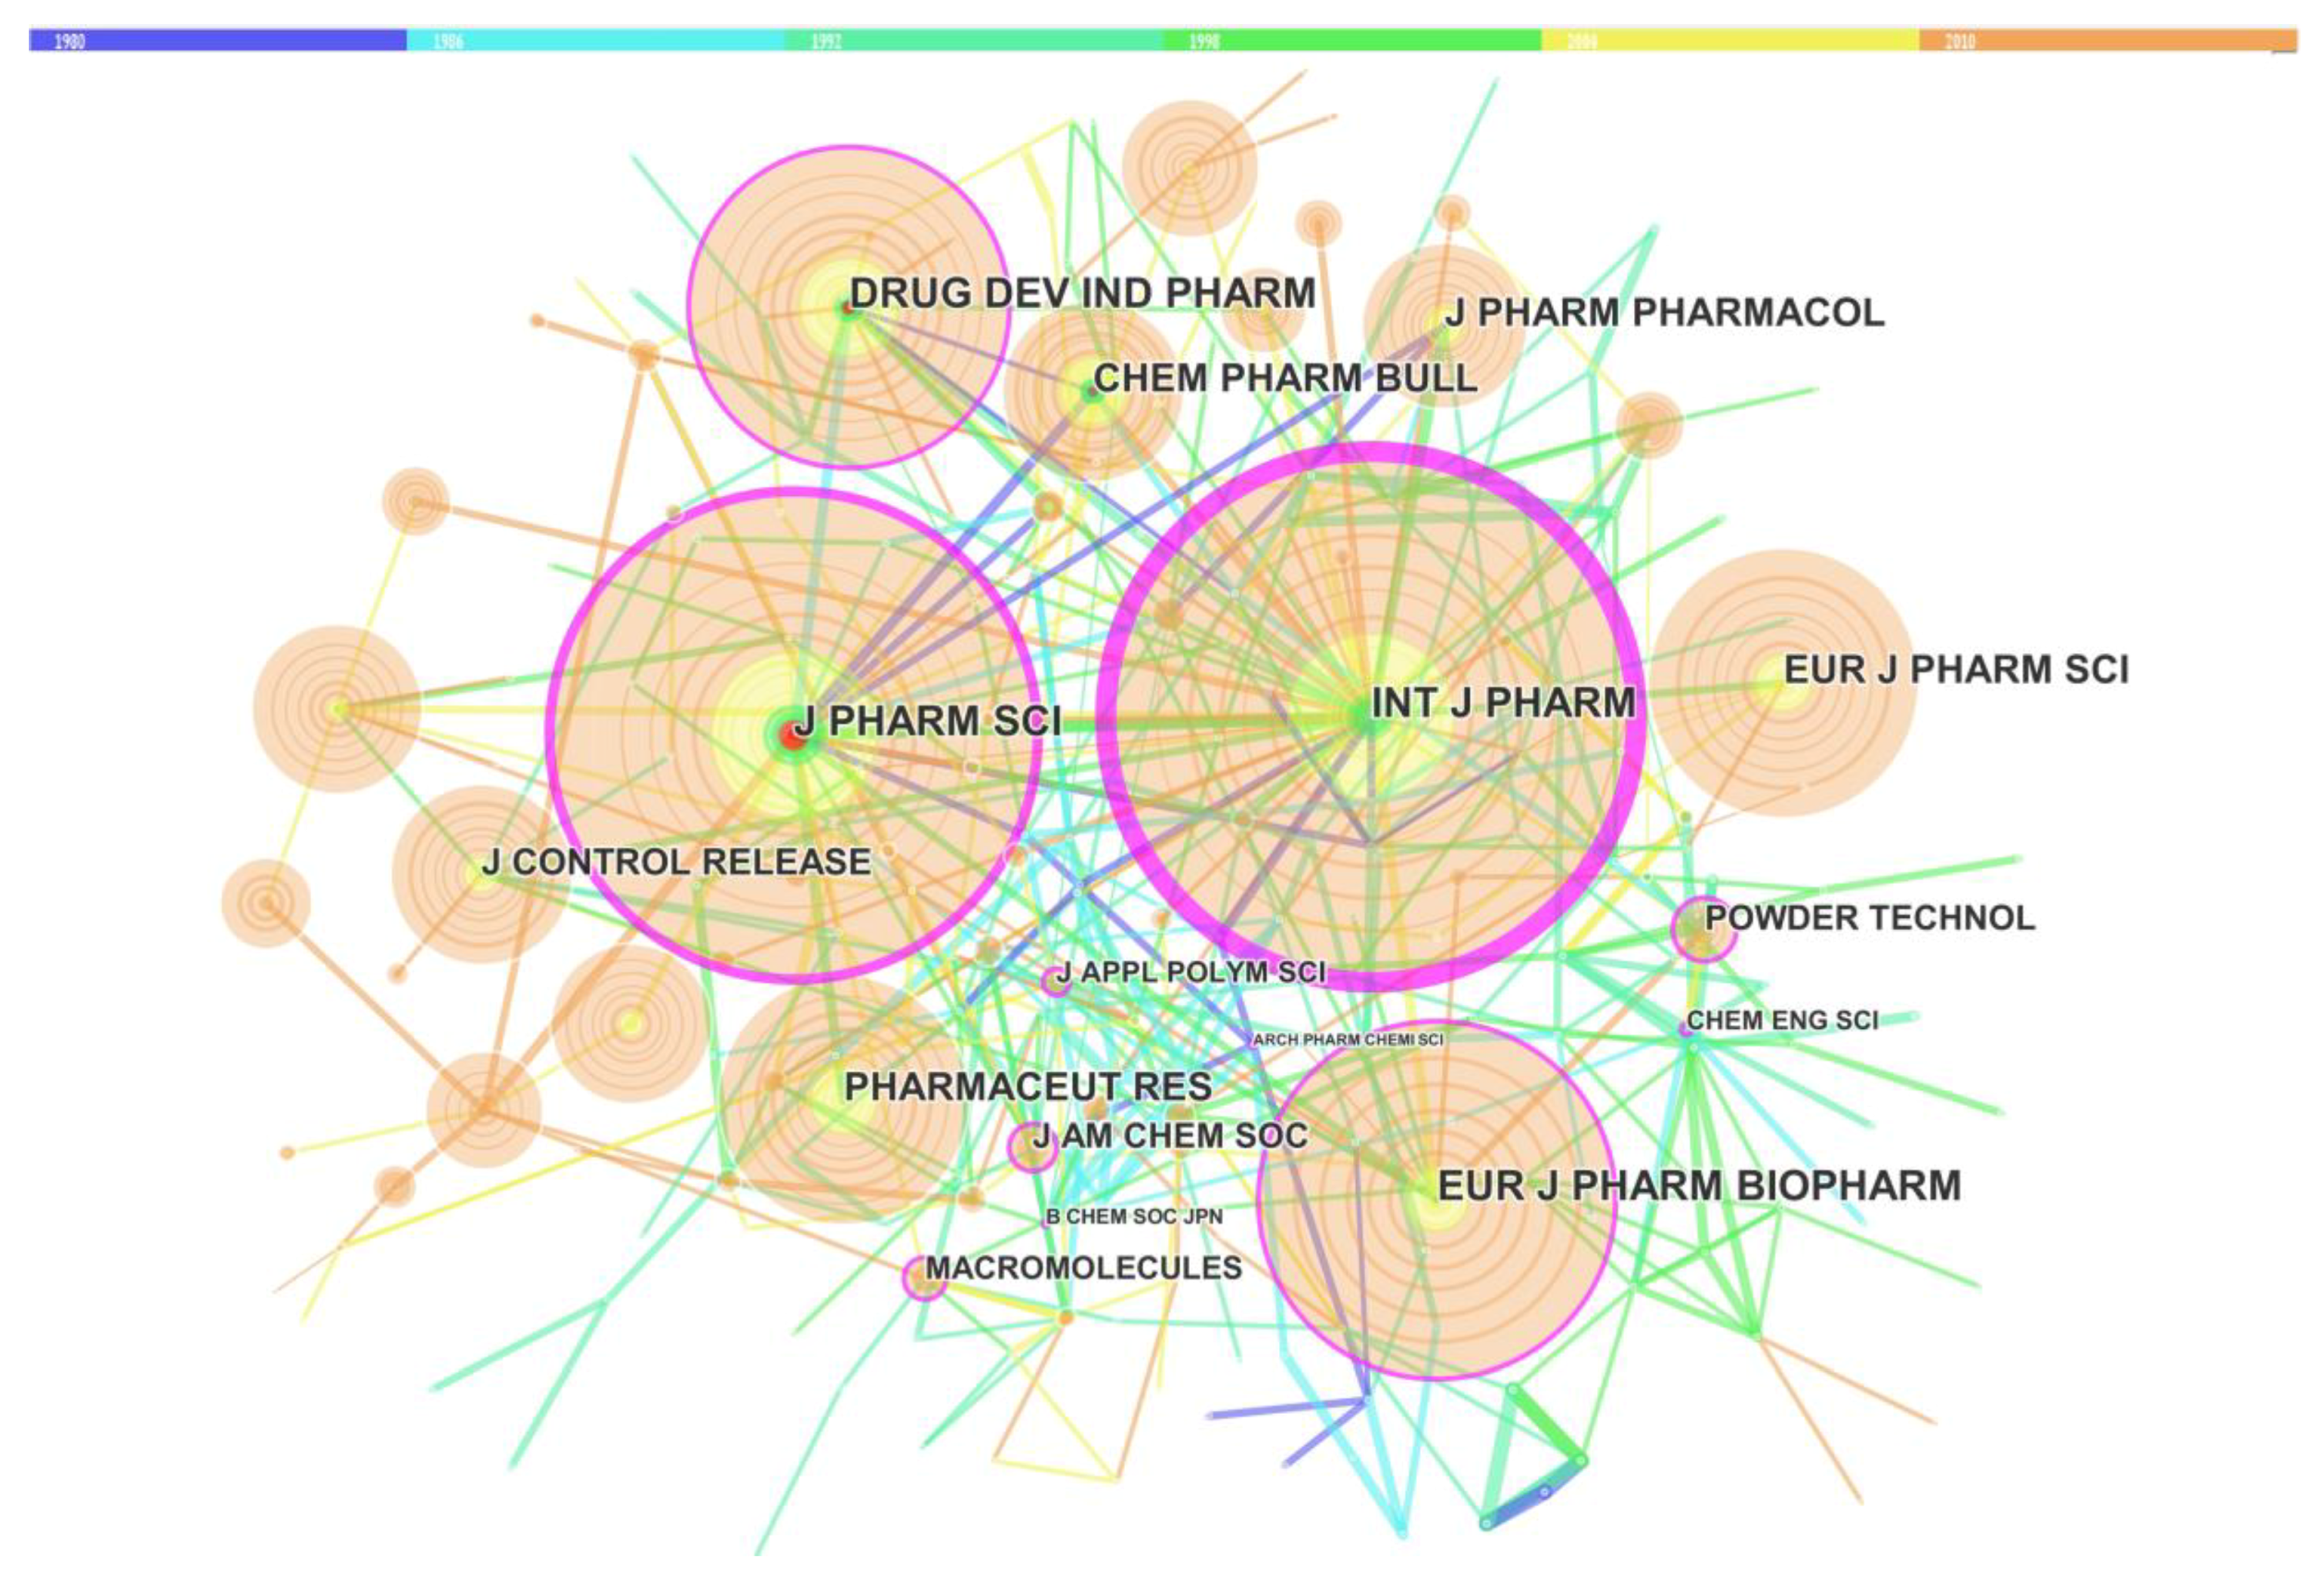
3.4. The Network of Core Journals
3.5. Research Frontiers Trend Shifts
- Model drugs: diazepam, paracetamol, zolpidem, felodipine, sibutramine, kinetisola, itraconazole, ketoprofen, glibenclamide, nifedipine, hydroflumethiazide, griseofulvin, tolbutamide, triamterene, oxazepam, ethenzamide, albendazole, naproxen, temazepam, diflunisal, carbamazepine, rofecoxib, ibuprofen, piroxicam, sulfathiazole, glucosamine, megestrol acetate, tranilast and curcumin;
- Carriers: (1) polymeric carriers: hydroxypropyl methylcellulose, Eudragit, polyethlene glycol, ethyl cellulose, povidone, hydroxypropyl cellulose, poly (ethylene oxide), chitosan, etc.; (2) amphiphilicity carriers: sodium lauryl sulfate, phosphatidylcholine, gelucire 44/14; (3) saccharides carriers: lactose, beta-cyclodextrin.
- Preparation methods: hot melt method, solvent evaporation approach, the spray-drying method and supercritical fluid method.
- Characterization approaches: differential scanning calorimetry, X-ray powder diffraction, atomic force microscopy and NMR.
- Mechanism: controlled release, eutectic mixture, melt agglomeration, amorphous drug stabilization, sustained-release, thermal behavior, dissolution behavior, solid nano-dispersion system, binary dispersion, quantifying drug crystallinity, in vivo drug absorption, drug-release properties, ab initio polymer selection, physical stability studies, amorphous solid dispersion, glassy form, drug-carrier interaction, heterogeneity, excipient distribution, phase diagram, enthalpy relaxation, moisture, miscibility.
4. Discussion
5. Conclusions
Author Contributions
Funding
Acknowledgments
Conflicts of Interest
References
- Baird, J.A.; Taylor, L.S. Evaluation of amorphous solid dispersion properties using thermal analysis techniques. Adv. Drug Deliv. Rev. 2012, 64, 396–421. [Google Scholar] [CrossRef] [PubMed]
- Lipinski, C.A.; Lombardo, F.; Dominy, B.W.; Feeney, P.J. Experimental and computational approaches to estimate solubility and permeability in drug discovery and development settings. Adv. Drug Deliv. Rev. 2012, 64, 4–17. [Google Scholar] [CrossRef]
- Mooter, G.V.D. The use of amorphous solid dispersions: A formulation strategy to overcome poor solubility and dissolution rate. Drug Discov. Today Technol. 2012, 9, e71–e74. [Google Scholar]
- Chen, X.; Liu, M.X.; Yan, G.Y. Drug—Target interaction prediction by random walk on the heterogeneous network. Mol. BioSyst. 2012, 8, 1970–1978. [Google Scholar] [CrossRef] [PubMed]
- Huang, Y.; You, Z.; Chen, X. A systematic prediction of drug-target interactions using molecular fingerprints and protein sequences. Curr. Protein Pept. Sci. 2018, 19, 468–478. [Google Scholar] [CrossRef] [PubMed]
- Wang, L.; You, Z.H.; Chen, X.; Yan, X.; Liu, G.; Zhang, W. RFDT: A rotation forest-based prediction for predicting drug-target interactions using drug structure and protein sequence information. Curr. Protein Pept. Sci. 2018, 19, 445–454. [Google Scholar] [CrossRef] [PubMed]
- Rautio, J.; Kumpulainen, H.; Heimbach, T.; Oliyai, R.; Oh, D.; Jarvinen, T.; Savolainen, J. Prodrugs: Design and clinical applications. Nat. Rev. Drug Discov. 2008, 7, 255–270. [Google Scholar] [CrossRef] [PubMed]
- Loftsson, T.; Duchene, D. Cyclodextrins and their pharmaceutical applications. Int. J. Pharm. 2007, 329, 1–11. [Google Scholar] [CrossRef] [PubMed]
- Müller, R.H.; Peters, K. Nanosuspensions for the formulation of poorly soluble drugs: I. Preparation by a size-reduction technique. Int. J. Pharm. 1998, 160, 229–237. [Google Scholar] [CrossRef]
- Lavasanifar, A.; Samuel, J.; Kwon, G.S. Poly (ethylene oxide)-block-poly (lamino acid) micelles for drug delivery. Adv. Drug Deliv. Rev. 2002, 54, 169–190. [Google Scholar] [CrossRef]
- Berge, S.M.; Bighley, L.D.; Monkhouse, D.C. Pharmaceutical salts. J. Pharm. Sci. 1977, 66, 1–19. [Google Scholar] [CrossRef] [PubMed]
- Rabinow, B.E. Nanosuspensions in drug delivery. Nat. Rev. Drug Discov. 2004, 3, 785–796. [Google Scholar] [CrossRef] [PubMed]
- Jain, S.; Patel, N.; Lin, S. Solubility and dissolution enhancement strategies: Current understanding and recent trends. Drug Dev. Ind. Pharm. 2015, 41, 875–887. [Google Scholar] [CrossRef] [PubMed]
- He, Y.; Ho, C. Amorphous Solid Dispersions: Utilization and Challenges in Drug Discovery and Development. J. Pharm. Sci. 2015, 104, 3237–3258. [Google Scholar] [CrossRef] [PubMed]
- Vo, C.L.; Park, C.; Lee, B.J. Current trends and future perspectives of solid dispersions containing poorly water-soluble drugs. Eur. J. Pharm. Biopharm. 2013, 85, 799–813. [Google Scholar] [CrossRef] [PubMed]
- Vasconcelos, T.; Sarmento, B.; Costa, P. Solid dispersions as strategy to improve oral bioavailability of poor water soluble drugs. Drug Discov. Today 2007, 12, 1068–1075. [Google Scholar] [CrossRef] [PubMed]
- Keiji Sekiguchi, N.O. Studies on Absorption of Eutectic Mixture. I. A Comparison of the Behavior of Eutectic Mixture of Sulfathiazole and that of Ordinary Sulfathiazole in Man. Chem. Pharm. Bull. 1961, 9, 866–872. [Google Scholar] [CrossRef]
- Cobo, M.J.; Lopez-Herrera, A.G.; Herrera-Viedma, E.; Herrera, F. Science mapping software tools: Review, analysis, and cooperative study among tools. J. Am. Soc. Inf. Sci. Technol. 2011, 62, 1382–1402. [Google Scholar] [CrossRef] [Green Version]
- White, M.D. RefViz 2 (Review). Libr. Acad. 2008, 8, 343–344. [Google Scholar] [CrossRef]
- Chen, C. CiteSpace II: Detecting and Visualizing Emerging Trends and Transient Patterns in Scientific Literature. J. Am. Soc. Inf. Sci. Technol. 2006, 57, 359–377. [Google Scholar] [CrossRef]
- Eck, N.J.V.; Waltman, L. VOS: A New Method for Visualizing Similarities Between Objects; Springer: Heidelberg, Germany, 2007. [Google Scholar]
- Van Eck, N.J.; Waltman, L. Software survey: VOSviewer, a computer program for bibliometric mapping. Scientometrics 2010, 84, 523–538. [Google Scholar] [CrossRef] [PubMed]
- Sci2 Team. Science of Science (Sci2) Tool; Indiana University and SciTech Strategies: Bloomington, IN, USA, 2009. [Google Scholar]
- Garfield, E. Historiographic Mapping of Knowledge Domains Literature. J. Inf. Sci. 2004, 30, 119–145. [Google Scholar] [CrossRef]
- Zhou, X.; Zhao, G. Global liposome research in the period of 1995–2014: A bibliometric analysis. Scientometrics 2015, 105, 231–248. [Google Scholar] [CrossRef]
- Lee, Y.-C.; Chen, C.; Tsai, X.-T. Visualizing the Knowledge Domain of Nanoparticle Drug Delivery Technologies: A Scientometric Review. Appl. Sci. 2016, 6, 11. [Google Scholar] [CrossRef]
- Deng, J.; Sitou, K.; Zhang, Y.; Yan, R.; Hu, Y. Analyzing the Chinese landscape in anti-diabetic drug research: Leading knowledge production institutions and thematic communities. Chin. Med. 2016, 11, 1–10. [Google Scholar] [CrossRef] [PubMed]
- Tang, X.; Du, J. Natural products against cancer: A comprehensive bibliometric study of the research projects, publications, patents and drugs. J. Cancer Res. Ther. 2014, 1, 27–37. [Google Scholar] [CrossRef] [PubMed]
- Chen, C.; Zhang, J.; Vogeley, M.S. Visual analysis of scientific discoveries and knowledge diffusion. In Proceedings of the 12th International Conference on Scientometrics and Informetrics, Rio de Janeiro, Brazil, 14–17 July 2009. [Google Scholar]
- Synnestvedt, M.B.; Chen, C.; Holmes, J.H. 2 Citespace II: Visualization and knowledge discovery in bibliographic databases. Ann. Symp. Proc. 2005, 2005, 724–728. [Google Scholar]
- Zhao, Q.; Zhang, W.; Wang, R.; Wang, Y.; Ouyang, D. Research advances in molecular modeling in cyclodextrins. Curr. Pharm. Des. 2017, 23, 522–531. [Google Scholar] [CrossRef] [PubMed]
- Alam, M.A.; Al-Jenoobi, F.I.; Al-Mohizea, A.M. Commercially bioavailable proprietary technologies and their marketed products. Drug Discov. Today 2013, 18, 936–949. [Google Scholar] [CrossRef] [PubMed]
- Veugelers, R.; Cassiman, B. R&D cooperation between firms and universities. Some empirical evidence from Belgian manufacturing. Int. J. Ind. Organ. 2005, 23, 355–379. [Google Scholar] [Green Version]
- Perkmann, M.; Walsh, K. University–industry relationships and open innovation: Towards a research agenda. Int. J. Manag. Rev. 2007, 9, 259–280. [Google Scholar] [CrossRef] [Green Version]
- Howells, J. The location and organisation of research and development: New horizons. Res. Policy 1990, 19, 133–146. [Google Scholar] [CrossRef]
- Calero, C.; van Leeuwen, T.N.; Tijssen, R.J.W. Research cooperation within the bio-pharmaceutical industry: Network analyses of co-publications within and between firms. Scientometrics 2007, 71, 87–99. [Google Scholar] [CrossRef] [Green Version]
- Taylor, L.S.; Zografi, G. Spectroscopic characterization of interactions between PVP and indomethacin in amorphous molecular dispersions. Pharm. Res. 1997, 14, 1691–1698. [Google Scholar] [CrossRef] [PubMed]
- Van den Mooter, G.; Augustijns, P.; Blaton, N.; Kinget, R. Physico-chemical characterization of solid dispersions of temazepam with polyethylene glycol 6000 and PVP K30. Int. J. Pharm. 1998, 164, 67–80. [Google Scholar] [CrossRef]
- McCain, K.W. Core Journal Networks and Cocitation Maps: New Bibliometric Tools for Serials Research and Management. Libr. Q. Inf. Community Policy 1991, 61, 311–316. [Google Scholar] [CrossRef]
- Chen, C.; Dubin, R.; Kim, M.C. Emerging trends and new developments in regenerative medicine: A scientometric update (2000–2014). Expert Opin. Biol. Ther. 2014, 14, 1295–1317. [Google Scholar] [CrossRef] [PubMed]
- Ford, J.L.; Rubinstein, M.H. Phase equilibria and stability characteristics of chlorpropamide-urea solid dispersions. J. Pharm. Pharmacol. 1977, 29, 209–211. [Google Scholar] [CrossRef] [PubMed]
- Allen, L.V.; Levinson, R.S.; De Martono, D. Dissolution rates of hydrocortisone and prednisone utilizing sugar solid dispersion systems in tablet form. J. Pharm. Sci. 1978, 67, 979–981. [Google Scholar] [CrossRef] [PubMed]
- Thiry, J.; Broze, G.; Pestieau, A.; Tatton, A.S.; Baumans, F.; Damblon, C.; Krier, F.; Evrard, B. Investigation of a suitable in vitro dissolution test for itraconazole-based solid dispersions. Eur. J. Pharm. Sci. 2016, 85, 94–105. [Google Scholar] [CrossRef] [PubMed]
- Tian, Y.; Jones, D.S.; Andrews, G.P. An investigation into the role of polymeric carriers on crystal growth within amorphous solid dispersion systems. Mol. Pharm. 2015, 12, 1180–1192. [Google Scholar] [CrossRef] [PubMed]
- Bikiaris, D.N. Solid dispersions, Part II: New strategies in manufacturing methods for dissolution rate enhancement of poorly water-soluble drugs. Expert Opin. Drug Deliv. 2011, 8, 1663–1680. [Google Scholar] [CrossRef] [PubMed]
- Bikiaris, D.N. Solid dispersions, Part I: Recent evolutions and future opportunities in manufacturing methods for dissolution rate enhancement of poorly water-soluble drugs. Expert Opin. Drug Deliv. 2011, 8, 1501–1519. [Google Scholar] [CrossRef] [PubMed]
- Repka, M.A.; Shah, S.; Lu, J.; Maddineni, S.; Morott, J.; Patwardhan, K.; Mohammed, N.N. Melt extrusion: Process to product. Expert Opin. Drug Deliv. 2012, 9, 105–125. [Google Scholar] [CrossRef] [PubMed]
- Vasconcelos, T.; Marques, S.; das Neves, J.; Sarmento, B. Amorphous solid dispersions: Rational selection of a manufacturing process. Adv. Drug Deliv. Rev. 2016, 100, 85–101. [Google Scholar] [CrossRef] [PubMed]
- Palermo, R.N.; Anderson, C.A.; Drennen Iii, J.K. Review: Use of thermal, diffraction, and vibrational analytical methods to determine mechanisms of solid dispersion stability. J. Pharm. Innov. 2012, 7, 2–12. [Google Scholar] [CrossRef]
- Bhardwaj, S.P.; Arora, K.K.; Kwong, E.; Templeton, A.; Clas, S.D.; Suryanarayanan, R. Mechanism of amorphous itraconazole stabilization in polymer solid dispersions: Role of molecular mobility. Mol. Pharm. 2014, 11, 4228–4237. [Google Scholar] [CrossRef] [PubMed]
- Karavas, E.; Georgarakis, E.; Sigalas, M.P.; Avgoustakis, K.; Bikiaris, D. Investigation of the release mechanism of a sparingly water-soluble drug from solid dispersions in hydrophilic carriers based on physical state of drug, particle size distribution and drug-polymer interactions. Eur. J. Pharm. Biopharm. 2007, 66, 334–347. [Google Scholar] [CrossRef] [PubMed]
- Baghel, S.; Cathcart, H.; O’Reilly, N.J. Polymeric Amorphous Solid Dispersions: A Review of Amorphization, Crystallization, Stabilization, Solid-State Characterization, and Aqueous Solubilization of Biopharmaceutical Classification System Class II Drugs. J. Pharm. Sci. 2016, 105, 2527–2544. [Google Scholar] [CrossRef] [PubMed]
- Craig, D.Q.M. The mechanisms of drug release from solid dispersions in water-soluble polymers. Int. J. Pharm. 2002, 231, 131–144. [Google Scholar] [CrossRef]
- Janssens, S.; Van den Mooter, G. Review: Physical chemistry of solid dispersions. J. Pharm. Pharmacol. 2009, 61, 1571–1586. [Google Scholar] [CrossRef] [PubMed]
- Alam, M.A.; Ali, R.; Al-Jenoobi, F.I.; Al-Mohizea, A.M. Solid dispersions: A strategy for poorly aqueous soluble drugs and technology updates. Expert Opin. Drug Deliv. 2012, 9, 1419–1440. [Google Scholar] [CrossRef] [PubMed]
- Wegiel, L.A.; Mauer, L.J.; Edgar, K.J.; Taylor, L.S. Crystallization of amorphous solid dispersions of resveratrol during preparation and storage-Impact of different polymers. J. Pharm. Sci. 2013, 102, 171–184. [Google Scholar] [CrossRef] [PubMed]
- Qian, F.; Huang, J.; Hussain, M.A. Drug-polymer solubility and miscibility: Stability consideration and practical challenges in amorphous solid dispersion development. J. Pharm. Sci. 2010, 99, 2941–2947. [Google Scholar] [CrossRef] [PubMed]
- Guo, Y.; Shalaev, E.; Smith, S. Physical stability of pharmaceutical formulations: Solid-state characterization of amorphous dispersions. TrAC—Trends Anal. Chem. 2013, 49, 137–144. [Google Scholar] [CrossRef]
- Qi, S.; McAuley, W.J.; Yang, Z.; Tipduangta, P. Physical stabilization of low-molecular-weight amorphous drugs in the solid state: A material science approach. Ther. Deliv. 2014, 5, 817–841. [Google Scholar] [CrossRef] [PubMed]
- Meng, F.; Gala, U.; Chauhan, H. Classification of solid dispersions: Correlation to (i) stability and solubility (II) preparation and characterization techniques. Drug Dev. Ind. Pharm. 2015, 41, 1401–1415. [Google Scholar] [CrossRef] [PubMed]
- Ouyang, D. Investigating the molecular structures of solid dispersions by the simulated annealing method. Chem. Phys. Lett. 2012, 554, 177–184. [Google Scholar] [CrossRef]
- Chen, X.; Ren, B.; Chen, M.; Liu, M.X.; Ren, W.; Wang, Q.X.; Zhang, L.X.; Yan, G.Y. ASDCD: Antifungal Synergistic Drug Combination Database. PLoS ONE 2014, 9, e86499. [Google Scholar] [CrossRef] [PubMed]
- Chen, X.; Ren, B.; Chen, M.; Wang, Q.; Zhang, L.; Yan, G. NLLSS: Predicting Synergistic Drug Combinations Based on Semi-supervised Learning. PLoS Comput. Biol. 2016, 12, e1004975. [Google Scholar] [CrossRef] [PubMed]
- Chen, X.; Yan, C.C.; Zhang, X.; Zhang, X.; Dai, F.; Yin, J.; Zhang, Y. Drug-target interaction prediction: Databases, web servers and computational models. Brief. Bioinform. 2016, 17, 696–712. [Google Scholar] [CrossRef] [PubMed]
- Sun, X.; Bao, J.; You, Z.; Chen, X.; Cui, J. Modeling of signaling crosstalk-mediated drug resistance and its implications on drug combination. Oncotarget 2016, 7, 63995–64006. [Google Scholar] [CrossRef] [PubMed] [Green Version]


| Rank | Countries/Territories | TP (%) | TC | ACP |
|---|---|---|---|---|
| 1 | USA | 633(18.34) | 15,096 | 23.85 |
| 2 | Japan | 383(11.10) | 6506 | 16.99 |
| 3 | China | 370(10.72) | 3890 | 10.51 |
| 4 | India | 349(10.11) | 3219 | 9.22 |
| 5 | England | 289(8.37) | 5495 | 19.01 |
| 6 | South Korea | 212(6.14) | 2728 | 12.87 |
| 7 | Germany | 151(4.38) | 3770 | 24.97 |
| 8 | Belgium | 146(4.23) | 3929 | 26.91 |
| 9 | Egypt | 124(3.59) | 808 | 6.52 |
| 10 | Italy | 118(3.42) | 2359 | 19.99 |
| Ranking | Institutes | Country | Records | Average Citation |
|---|---|---|---|---|
| 1 | Purdue University | USA | 107 | 26.79 |
| 2 | Catholic University of Louvain | Belgium | 92 | 34.67 |
| 3 | Shenyang Pharmaceutical University | China | 73 | 12.96 |
| 4 | Yeungnam University | South Korea | 58 | 12.98 |
| 5 | University of Texas Austin | USA | 55 | 32.54 |
| 6 | University of London | UK | 46 | 17.44 |
| 7 | Johnson & Johnson | USA | 45 | 37.42 |
| 8 | Chiba University | Japan | 42 | 12.55 |
| 9 | University of Copenhagen | Denmark | 42 | 14.83 |
| 10 | Roche Holding | Swiss | 41 | 18.51 |
| 11 | Novartis | Swiss | 38 | 23.08 |
| 12 | Aristotle University of Thessaloniki | Greece | 37 | 30.27 |
| 13 | Chungnam National University | South Korea | 37 | 23.38 |
| 14 | Meijo University | Japan | 36 | 18.25 |
| 15 | University of Greenwich | UK | 36 | 11.06 |
| 16 | Hanyang University | South Korea | 35 | 8.31 |
| 17 | AstraZeneca | UK | 34 | 21.12 |
| 18 | King Saud University | Saudi Arabia | 32 | 5.81 |
| 19 | Tabriz University MED SCI | Azerbaijan | 31 | 18.94 |
| 20 | Bristol Myers SQUIBB Co. | USA | 30 | 25.50 |
| Ranking | Assignee Name | Assignee Code | Records |
|---|---|---|---|
| 1 | Abbott GmbH & Co. KG | ABBO-C | 46 |
| 2 | Reddys Lab Ltd. | REDY-C | 20 |
| 3 | Vertex Pharmaceuticals | VERT-C | 17 |
| 4 | Hetero Research Foundation | HETE-N | 16 |
| 5 | Hanmi Pharmaceutical Co., Ltd. | HANM-C | 15 |
| 6 | Dow Global Technologies LLC | DOWC-C | 14 |
| 7 | Pfizer Inc. | PFIZ-C | 13 |
| 8 | AbbVie Deutschland GmbH & Co. KG | ABBV-N | 12 |
| 9 | AstraZeneca UK | ASTR-C | 12 |
| 10 | Novartis International AG | NOVS-C | 12 |
| 11 | Cadila Healthcare | CDLA-C | 11 |
| 12 | Sandoz AG | SANO-C | 11 |
| 13 | Shenyang Pharmaceutical University | UYSH-N | 10 |
| 14 | Ranbaxy Laboratories Limited | RANB-C | 10 |
| 15 | Sun Yat-Sen University | UYSY-C | 10 |
| 16 | Bend Research | BEND-N | 9 |
| 17 | China Pharmaceutical University | UYCP-C | 9 |
| 18 | Xinjiang Medical University | UYXI-N | 8 |
| 19 | Astellas Pharma US, Inc. | ASTE-C | 8 |
| 20 | Takeda Pharmaceutical Company Limited | TAKE-C | 8 |
| Order | Source Titles | Publication Number |
|---|---|---|
| 1 | International Journal of Pharmaceutics | 519 |
| 2 | Drug Development and Industrial Pharmacy | 303 |
| 3 | Journal of Pharmaceutical Sciences | 240 |
| 4 | European Journal of Pharmaceutics and Biopharmaceutics | 125 |
| 5 | Molecular Pharmaceutics | 121 |
| 6 | Chemical Pharmaceutical Bulletin | 119 |
| 7 | European Journal of Pharmaceutical Sciences | 107 |
| 8 | Pharmaceutical Research | 105 |
| 9 | AAPS PharmSciTech | 93 |
| 10 | Journal of Pharmacy and Pharmacology | 91 |
| Keywords | Strength | Begin | End | 1991–2015 |
|---|---|---|---|---|
| polyethylene glycol | 22.4985 | 1991 | 2007 | ▃▃▃▃▃▃▃▃▃▃▃▃▃▃▃▃▃▃▃▃▃▃▃▃▃ |
| nifedipine | 17.5424 | 1991 | 2006 | ▃▃▃▃▃▃▃▃▃▃▃▃▃▃▃▃▃▃▃▃▃▃▃▃▃ |
| eudragit | 3.6793 | 1991 | 2006 | ▃▃▃▃▃▃▃▃▃▃▃▃▃▃▃▃▃▃▃▃▃▃▃▃▃ |
| hydroflumethiazide | 4.7328 | 1991 | 2005 | ▃▃▃▃▃▃▃▃▃▃▃▃▃▃▃▃▃▃▃▃▃▃▃▃▃ |
| coprecipitate | 7.7031 | 1991 | 2004 | ▃▃▃▃▃▃▃▃▃▃▃▃▃▃▃▃▃▃▃▃▃▃▃▃▃ |
| differential scanning calorimetry | 4.7786 | 1991 | 2004 | ▃▃▃▃▃▃▃▃▃▃▃▃▃▃▃▃▃▃▃▃▃▃▃▃▃ |
| X-ray powder diffraction | 4.5573 | 1991 | 2004 | ▃▃▃▃▃▃▃▃▃▃▃▃▃▃▃▃▃▃▃▃▃▃▃▃▃ |
| phosphatidylcholine | 8.2027 | 1991 | 2001 | ▃▃▃▃▃▃▃▃▃▃▃▃▃▃▃▃▃▃▃▃▃▃▃▃▃ |
| enteric coating agent | 7.4571 | 1991 | 2001 | ▃▃▃▃▃▃▃▃▃▃▃▃▃▃▃▃▃▃▃▃▃▃▃▃▃ |
| griseofulvin | 9.8475 | 1991 | 1996 | ▃▃▃▃▃▃▃▃▃▃▃▃▃▃▃▃▃▃▃▃▃▃▃▃▃ |
| sodium dodecyl sulfate | 4.486 | 1991 | 1996 | ▃▃▃▃▃▃▃▃▃▃▃▃▃▃▃▃▃▃▃▃▃▃▃▃▃ |
| coevaporate | 4.8627 | 1992 | 2008 | ▃▃▃▃▃▃▃▃▃▃▃▃▃▃▃▃▃▃▃▃▃▃▃▃▃ |
| ethyl cellulose | 3.7864 | 1993 | 2009 | ▃▃▃▃▃▃▃▃▃▃▃▃▃▃▃▃▃▃▃▃▃▃▃▃▃ |
| tolbutamide | 5.6716 | 1993 | 2006 | ▃▃▃▃▃▃▃▃▃▃▃▃▃▃▃▃▃▃▃▃▃▃▃▃▃ |
| triamterene | 7.1155 | 1993 | 2004 | ▃▃▃▃▃▃▃▃▃▃▃▃▃▃▃▃▃▃▃▃▃▃▃▃▃ |
| hydroxypropyl cellulose | 5.7617 | 1993 | 2001 | ▃▃▃▃▃▃▃▃▃▃▃▃▃▃▃▃▃▃▃▃▃▃▃▃▃ |
| oxazepam | 3.6394 | 1993 | 1998 | ▃▃▃▃▃▃▃▃▃▃▃▃▃▃▃▃▃▃▃▃▃▃▃▃▃ |
| ethenzamide | 4.8554 | 1994 | 2006 | ▃▃▃▃▃▃▃▃▃▃▃▃▃▃▃▃▃▃▃▃▃▃▃▃▃ |
| poly(ethylene oxide) | 3.5901 | 1995 | 2007 | ▃▃▃▃▃▃▃▃▃▃▃▃▃▃▃▃▃▃▃▃▃▃▃▃▃ |
| albendazole | 3.5638 | 1995 | 2003 | ▃▃▃▃▃▃▃▃▃▃▃▃▃▃▃▃▃▃▃▃▃▃▃▃▃ |
| Naproxen | 4.4423 | 1996 | 2006 | ▃▃▃▃▃▃▃▃▃▃▃▃▃▃▃▃▃▃▃▃▃▃▃▃▃ |
| temazepam | 6.899 | 1998 | 2008 | ▃▃▃▃▃▃▃▃▃▃▃▃▃▃▃▃▃▃▃▃▃▃▃▃▃ |
| diflunisal | 4.2489 | 1998 | 2002 | ▃▃▃▃▃▃▃▃▃▃▃▃▃▃▃▃▃▃▃▃▃▃▃▃▃ |
| ketoprofen | 5.0229 | 1999 | 2007 | ▃▃▃▃▃▃▃▃▃▃▃▃▃▃▃▃▃▃▃▃▃▃▃▃▃ |
| controlled release | 4.4497 | 1999 | 2002 | ▃▃▃▃▃▃▃▃▃▃▃▃▃▃▃▃▃▃▃▃▃▃▃▃▃ |
| gelucire 44/14 | 4.2429 | 2000 | 2003 | ▃▃▃▃▃▃▃▃▃▃▃▃▃▃▃▃▃▃▃▃▃▃▃▃▃ |
| carbamazepine | 3.3727 | 2000 | 2002 | ▃▃▃▃▃▃▃▃▃▃▃▃▃▃▃▃▃▃▃▃▃▃▃▃▃ |
| crospovidone | 4.1851 | 2002 | 2007 | ▃▃▃▃▃▃▃▃▃▃▃▃▃▃▃▃▃▃▃▃▃▃▃▃▃ |
| supercritical carbon dioxide | 6.2183 | 2003 | 2009 | ▃▃▃▃▃▃▃▃▃▃▃▃▃▃▃▃▃▃▃▃▃▃▃▃▃ |
| polyvinylpyrrolidone | 7.6429 | 2004 | 2009 | ▃▃▃▃▃▃▃▃▃▃▃▃▃▃▃▃▃▃▃▃▃▃▃▃▃ |
| eutectic mixture | 4.0659 | 2004 | 2009 | ▃▃▃▃▃▃▃▃▃▃▃▃▃▃▃▃▃▃▃▃▃▃▃▃▃ |
| rofecoxib | 5.144 | 2004 | 2007 | ▃▃▃▃▃▃▃▃▃▃▃▃▃▃▃▃▃▃▃▃▃▃▃▃▃ |
| melt agglomeration | 4.9545 | 2005 | 2010 | ▃▃▃▃▃▃▃▃▃▃▃▃▃▃▃▃▃▃▃▃▃▃▃▃▃ |
| microsphere | 7.1443 | 2006 | 2009 | ▃▃▃▃▃▃▃▃▃▃▃▃▃▃▃▃▃▃▃▃▃▃▃▃▃ |
| chitosan | 4.3876 | 2006 | 2009 | ▃▃▃▃▃▃▃▃▃▃▃▃▃▃▃▃▃▃▃▃▃▃▃▃▃ |
| itraconazole | 4.9696 | 2007 | 2008 | ▃▃▃▃▃▃▃▃▃▃▃▃▃▃▃▃▃▃▃▃▃▃▃▃▃ |
| granulation | 4.2664 | 2007 | 2008 | ▃▃▃▃▃▃▃▃▃▃▃▃▃▃▃▃▃▃▃▃▃▃▃▃▃ |
| ibuprofen | 4.8525 | 2008 | 2009 | ▃▃▃▃▃▃▃▃▃▃▃▃▃▃▃▃▃▃▃▃▃▃▃▃▃ |
| piroxicam | 4.126 | 2009 | 2010 | ▃▃▃▃▃▃▃▃▃▃▃▃▃▃▃▃▃▃▃▃▃▃▃▃▃ |
| beta cyclodextrin | 4.2647 | 2010 | 2011 | ▃▃▃▃▃▃▃▃▃▃▃▃▃▃▃▃▃▃▃▃▃▃▃▃▃ |
| curcumin | 4.7142 | 2013 | 2015 | ▃▃▃▃▃▃▃▃▃▃▃▃▃▃▃▃▃▃▃▃▃▃▃▃▃ |
| Categories | Year | |||
|---|---|---|---|---|
| ~1980 | 1980~1996 | 1997~2003 | 2004~2010 | |
| Model drug | Diflunisal, diazepam | sulfathiazole, paracetamol, zolpidem, glucosamine | sibutramine, tranilast, megestrol acetate | felodipine, kinetisola, itraconazole, ketoprofen, glibenclamide |
| Carrier | polyethlene glycol 6000, amphiphilicity | sodium lauryl sulfate, hydroxypropyl methylcellulose, eudragit, cellulose derivative matrice, lactose, polyethlene glycol, povidone-sodium, cholate-phospholipid mixed micelle | N/A | Polyvinylpyrrolidone |
| Preparation method | N/A | spray | supercritical fluid | fusion production, hot-melt extruded, supercritical antisolvent process |
| Characterizations | N/A | N/A | N/A | thermoanalytical measurement, NMR atomic force microscopy |
| Mechanism | N/A | amorphous drug stabilization, sustained-release, thermal behavior, dissolution behaviour | crystalline property, solid nano dispersion system | binary dispersion, quantifying drug crystallinity, in vivo drug absorption, drug-release properties, ab initio polymer selection, physical stability studies, acidic decomposition characteristic, free amorphous solid dispersion, glassy form, drug-carrier interaction, heterogeneity, excipient distribution, phase diagram, enthalpy relaxation studies, crystal engineering principle, moisture, miscibility |
| Order | Products | API | Excipient | Manufacturing Method | Dosage Form | Company |
|---|---|---|---|---|---|---|
| 1 | Afeditab | Nifedipine | Poloxamer/PVP | Spray drying | Tablet | Elan |
| 2 | Afinitor | Everolimus | Hydroxypropyl methylcellulose | Spray dried | Tablet | Novartis |
| 3 | Certican | Everolimus | Hydroxypropyl methylcellulose | Spray dried | Tablet | Novartis |
| 4 | Cesamet | Nabilone | PVP | - | Tablet | Valeant |
| 5 | Crestor | Rosuvastatin | HPMC | Spray drying | Tablet | AstraZeneca |
| 6 | Florfenicol | Florfenicol | Enteric cellulose | - | Powder | Hebei Huaqiang |
| 7 | Gris-PEG | Griseofulvin | PEG-6000 | Melt-extrusion | Tablet | Pedinol |
| 8 | Incivek | Teleprevir | HPMCAS-M | Spray drying | Tablet | Vertex |
| 9 | Intelence | Etravirin | HPMC | Certican | Tablet | Tibotec |
| 10 | Isoptin | Verapamil | HPC/HPMC | Spray drying | Tablet | Abbvie |
| 11 | Kaletra | Lopinavir | PVP | Melt extrusion | Capsule | Abbvie |
| 12 | Kalydeco | Ivacaftor | HPMCAS | Spray drying | Tablet | Vertex |
| 13 | Nivadil | Nivaldipine | HPMC | Spray drying | Tablet | Fujisawa |
| 14 | Novir | Ritonavir | PVP | Melt-extrusion | Tablet | Abbott |
| 15 | Onmel | Itraconazole | HPMC | Melt-extrusion | Tablet | Sebela |
| 16 | Prograf | Tacrolimus | HPMC | Spray drying | Capsule | Fujisawa |
| 17 | Rezulin | Troglitazone | HPMC | Spray drying | Tablet | Parke Davis |
| 18 | Shuilinjia | Silibinin | Lecithin | - | Capsules | Tianjin Tasly |
| 19 | Sporanox | Itraconazole | HPMC | Spray drying on sugar beads | Capsule | Janssen |
| 20 | Stivarga | Regorafenib | Povidone K25 | - | Tablet | Bayer |
| 21 | Votubia | Everolimus | Hydroxypropyl methylcellulose | Spray dried | Tablet | Novartis |
| 22 | Zelboraf | Vemurafenib | Hypromellose acetate succinate | Precipitation | Tablet | Roche |
| 23 | Zortess | Everolimus | HPMC | Spray drying | Tablet | Novartis |
© 2018 by the authors. Licensee MDPI, Basel, Switzerland. This article is an open access article distributed under the terms and conditions of the Creative Commons Attribution (CC BY) license (http://creativecommons.org/licenses/by/4.0/).
Share and Cite
Zhang, J.; Han, R.; Chen, W.; Zhang, W.; Li, Y.; Ji, Y.; Chen, L.; Pan, H.; Yang, X.; Pan, W.; et al. Analysis of the Literature and Patents on Solid Dispersions from 1980 to 2015. Molecules 2018, 23, 1697. https://doi.org/10.3390/molecules23071697
Zhang J, Han R, Chen W, Zhang W, Li Y, Ji Y, Chen L, Pan H, Yang X, Pan W, et al. Analysis of the Literature and Patents on Solid Dispersions from 1980 to 2015. Molecules. 2018; 23(7):1697. https://doi.org/10.3390/molecules23071697
Chicago/Turabian StyleZhang, Jinglu, Run Han, Weijie Chen, Weixiang Zhang, Ying Li, Yuanhui Ji, Lijiang Chen, Hao Pan, Xinggang Yang, Weisan Pan, and et al. 2018. "Analysis of the Literature and Patents on Solid Dispersions from 1980 to 2015" Molecules 23, no. 7: 1697. https://doi.org/10.3390/molecules23071697