Article

Benzotriazine Di-Oxide Prodrugs for Exploiting Hypoxia and Low Extracellular pH in Tumors

1
Auckland Cancer Society Research Centre, School of Medical Sciences, Faculty of Medical and Health Sciences, University of Auckland, Auckland 1142, New Zealand
2
Maurice Wilkins Centre for Molecular Biodiscovery, University of Auckland, Symonds St, Auckland 1142, New Zealand
3
School of Chemical Sciences, University of Auckland, Auckland 1142, New Zealand
*
Author to whom correspondence should be addressed.
Molecules 2019, 24(14), 2524; https://doi.org/10.3390/molecules24142524
Submission received: 20 June 2019 / Revised: 5 July 2019 / Accepted: 6 July 2019 / Published: 10 July 2019
(This article belongs to the Special Issue Targeted Prodrugs)

Abstract

:
Extracellular acidification is an important feature of tumor microenvironments but has yet to be successfully exploited in cancer therapy. The reversal of the pH gradient across the plasma membrane in cells that regulate intracellular pH (pHi) has potential to drive the selective uptake of weak acids at low extracellular pH (pHe). Here, we investigate the dual targeting of low pHe and hypoxia, another key feature of tumor microenvironments. We prepared eight bioreductive prodrugs based on the benzotriazine di-oxide (BTO) nucleus by appending alkanoic or aminoalkanoic acid sidechains. The BTO acids showed modest selectivity for both low pHe (pH 6.5 versus 7.4, ratios 2 to 5-fold) and anoxia (ratios 2 to 8-fold) in SiHa and FaDu cell cultures. Related neutral BTOs were not selective for acidosis, but had greater cytotoxic potency and hypoxic selectivity than the BTO acids. Investigation of the uptake and metabolism of representative BTO acids confirmed enhanced uptake at low pHe, but lower intracellular concentrations than expected for passive diffusion. Further, the modulation of intracellular reductase activity and competition by the cell-excluded electron acceptor WST-1 suggests that the majority of metabolic reductions of BTO acids occur at the cell surface, compromising the engagement of the resulting free radicals with intracellular targets. Thus, the present study provides support for designing bioreductive prodrugs that exploit pH-dependent partitioning, suggesting, however, that that the approach should be applied to prodrugs with obligate intracellular activation.

Graphical Abstract

1. Introduction

Hypoxia is a common feature of the tumor microenvironment [1] and contributes to tumor progression and resistance to therapy [2,3]. Low extracellular pH (pHe) results from the high glycolytic rates and slow clearance of metabolic acids in poorly perfused regions in tumors [4,5,6,7,8]. Extracellular acidification is an important contributor to tumor invasion and metastasis [9,10,11]. Like hypoxia, acidosis is a potentially exploitable difference between normal tissues and tumors that can be utilized in drug design. Tumor acidification is largely restricted to the extracellular compartment [12,13], and the resulting reversal in the trans-membrane pH gradient will drive the accumulation of weak acids by pH-dependent partitioning [12,14,15]; the predicted pKa dependence of this selective cellular uptake for passively transported weak acids is illustrated in Figure S1. The reversal of the pH gradient across the plasma membrane in regions of acidosis reflects active proton export by carbonic anhydrase IX and by monocarboxylate (lactate), bicarbonate, and proton transporters and their upregulation under hypoxia [16,17]. Much effort has been directed to inhibiting pH regulation to elicit tumor cell killing, but the redundancy of these transporters has led to the conclusion that “we still do not have an effective acid-mediated tumor cell death protocol” [17]. In addition, despite the surge in novel nanoparticle formulations designed to release active agents in tumors [18], pH selective nanoparticles have yet to make an impact clinically [19,20].
The selectivity of weak acids, e.g., chlorambucil (CHL, 1), for cells at low pHe has been experimentally confirmed [21,22,23] but has not yet been exploited for targeting the tumor microenvironment. We sought to exploit this tumor selectivity for weak acids by redesigning a hypoxia-selective bioreductive prodrug, SN30000 (2), to accommodate a weak acid moiety. SN30000 is a second generation benzotriazine di-oxide that undergoes selective activation to a DNA-reactive radical species under hypoxia [24]. It was designed to be a more potent, selective analogue of the clinically evaluated tirapazamine (TPZ, 3) [25,26,27], and to have improved extravascular transport properties [28]. SN30000 displays increased killing of hypoxic cells both in vitro and in vivo when compared to TPZ [29,30].
Our hypothesis is that using pH-driven targeting to deliver a potent cytotoxin, and superimposing this on hypoxic activation, will provide prodrugs with improved tumor selectivity. Here, we explore a series of benzotriazine di-oxide analogues featuring weakly acidic side chains and evaluate their cytotoxicity, cellular uptake, and metabolism under hypoxia and low extracellular pH.

2. Results

2.1. Prodrug Design and Synthesis

We designed a series of weak acid analogues (4a12a) and the corresponding esters (4b12b) based on the benzotriazine di-oxide (BTO) core of compounds 2 and 3 (Figure 1). The initial series (4a7a) consisted of propionic acids with alkyl substituents on the benzo ring. These substituents were selected to modulate lipophilicity and one-electron reduction potentials, thereby affecting rates of diffusion and metabolic activation under hypoxia, thus modulating extravascular transport properties. We also prepared a corresponding series of 3-aminoalkanoic acids (8a12a) for comparison.
A Stille reaction of the appropriate 3-iodobenzotriazine 1-oxides 13 gave the corresponding aldehydes 14 which were oxidized to the respective acids 15 (Scheme 1). Direct oxidation of the BTO 1-oxide acids 15 to the di-oxides 4a7a was not possible. However, protection of the acids 15 as the corresponding esters 16 allowed oxidation to the BTO 1,4-dioxides 4b7b and subsequent acidic hydrolyses gave BTO 1,4-dioxide alkanoic acids 4a7a.
Displacement of the 3-chloro BTO 1-oxides 17 with the appropriate aminoalkyl esters gave the esters 18 which were oxidized to the 1,4-dioxides 8b12b (Scheme 2). These esters were then hydrolyzed to the BTO 1,4-dioxide aminoalkanoic acids 8a12a in good yields, with the exception of 9a, which was not isolated due to decomposition under the reaction conditions.

2.2. Prodrug Physicochemical Properties

The physicochemical properties of the compounds are summarized in Table 1. The BTO acids were consistently more soluble than the corresponding esters in culture medium at pH 7.4, reflecting the contribution of the alkanoic acid moiety which was predominantly ionized under these conditions (pH >> pKa). The pKa value for 7a in 0.15 M KCl, measured by potentiometric titration, was 4.16 ± 0.01, which is similar to that calculated (pKa 4.14) in the software package Chemdraw v17.1.0 (PerkinElmer Informatics Inc., Cambridge, MA, USA). Therefore, we used Chemdraw to estimate pKa for the other acids, including chlorambucil, although we note that the latter value (pKa 4.62) is lower than the widely quoted [21,31,32] experimental estimate of 5.8, which, as originally reported, was potentially compromised by the precipitation of the free acid [33]. The calculated pKa values of the BTO acids covered a range from 3.7 to 4.5 and are thus in a range suitable for exploiting transmembrane pH differentials. These values are lower than the calculated pKa of 4.70 for long-chain (n > 10) alkanoic acids, indicating the modest effect of the BTO nucleus on pKa. However, the cLogP and cLogD values were substantially lower than for chlorambucil in all cases, with cLogD at pHe 7.4, less than −3 in four of the eight BTO acids, suggesting that passive diffusion through membranes could be slow.
One-electron reduction potentials (E0′) were determined from the redox equilibria with methylviologen, MV2+, (E0′ = 447 ± 7 mV, [34]), dimethyldiquat, V212+, (E0′ = 491 ± 6 mV, [35]), or triquat, TQ2+, (E0′ = −548 ± 7 mV [34]). The E0′ for 4a was similar to that of SN30000, 2, suggesting this BTO acid will be an efficient substrate for enzymatic one-electron reduction, even though its E0′ is 36 mV lower than the corresponding methyl ester (4b) reflecting the positive inductive effect of the sidechain and charge on the electronics of the benzotriazine nucleus. Substituting the 3-alkanoic sidechain with the 3-aminoalkanoic sidechain on the BTO 1,4-dioxide lowers the E0′, as does the addition of the cyclopentane ring. The combined effect is seen for 10a, where the E0′ value is −565 mV, which is expected to be too low for significant bioreduction under hypoxia.

2.3. Free Radical Chemistry of BTO Acid 7a

The free radical chemistry of 7a was investigated by pulse radiolysis and electron paramagnetic resonance (EPR). The pKa of the radical anion of 7a (5.69 ± 0.15; Figure S2) was found to be similar to that of SN30000 (5.48 ± 0.26, [24]). The radical anion decayed slowly under anoxia at pH 7 with mixed kinetics (first-order rate constant of 78 ± 4 s−1, second-order rate constant of 3.8 ± 0.7 × 10⁷ M−1 s−1, Figure S3), broadly similar to SN30000 [24]. The second-order rate constant for oxidation of the radical anion of 7a by O2, 5.39 ± 0.40 × 10⁶ M−1 s−1 (Figure S4), is consistent with the known dependence on E0′ for BTOs [37].
An EPR study using the spin trap N-tert-butyl-α-phenylnitrone (PBN) was undertaken to identify possible reactive radicals formed upon the anaerobic reduction of 7a by a soluble form of NADPH-cytochrome P450 oxidoreductase (sPOR) (Figure 2). The spectrum showed a triplet of doublets with wide splitting. Simulation of this spectrum (WINSIM, National Institute of Environmental Health Sciences (NIEHS)) is represented by the combination of two species in the ratio 0.81:0.19 with hyperfine coupling constants (HFC) of (i) aH 3.6 G and aN 16.3 G, and (ii) aH 4.3 G and aN 16.0 G, respectively. The HFCs of the former, (i), indicate the presence of a general carbon-centered radical, while the latter, (ii), matches that of an aryl radical [38,39]. Hence, the formation of a highly reactive aryl radical is a likely candidate for a cytotoxin formed upon the one-electron reduction of 7a, as was found for SN30000 [24]. A similar EPR spectrum was measured in the presence of 2 M DMSO (Figure S5), ruling out the hydroxyl radical being produced, which would be scavenged by the DMSO, leading to the methyl radical being spin-trapped by PBN and a changed EPR spectrum [40].

2.4. pH Regulation by SiHa and FaDu Cells under Acidosis

Prior to testing the pH dependence of the cytotoxicity of BTO acids, we evaluated the regulation of intracellular pH (pHi) when extracellular pH (pHe) was lowered from 7.4 to 6.5 in SiHa and FaDu cell cultures. We determined pHe with a pH microelectrode, and pHi by loading cells with non-fluorescent 2′,7′-bis-(2-carboxyethyl)-5-(and-6)-carboxyfluorescein acetoxymethyl ester (BCECF AM), which hydrolyses intracellularly to the cell-entrapped ratiometric pH-sensitive fluorescent probe BCECF. BCECF fluorescence emission at 535 nm is pH-independent for an excitation at 440 nm and pH-dependent for a 490 nm excitation [41,42,43]. Cells were loaded with 2 μM BCECF AM for 30 min in Hank’s balanced salt solution (HBSS) at pH 7.4 or 6.5, and fluorescence was measured with a microplate reader approximately 3 min after washing with a fresh medium at the same pH in order to remove any extracellular BCECF. pHi values, determined by calibration of the 440 nm/490 nm fluorescence ratio with digitonin-permeabilized cells, are shown in Table 2. Under oxic conditions (20% O2 gas phase), pHi was almost equal to pHe at the standard pHe of 7.4, for both cell lines, while when pHe was acutely lowered to 6.5, pHi was higher than pHe. The pHi values appeared to be somewhat lower under hypoxia (0.2% O2), although these were not significantly different from oxia (20% O2), with P values of 0.243 at pHe 7.4 and 0.192 at pHe 6.5. Similar shifts in pHi were observed under acidosis with cells under oxia, hypoxia (0.2% O2), or anoxia (<0.01% O2). Thus, when pHe was lowered by 0.9 units, pHi fell by approximately 0.4–0.5 units only. In a preliminary experiment, these ΔpHi values for UT-SCC-74B cells under 20% or 0.2% O2 were similar to those for SiHa cells in the same experiment (data not shown). Thus, the cell lines only partially controlled pHi under acute acidosis, which is consistent with other studies in low cell density cultures [44,45].

2.5. pH and Hypoxia Dependence of Prodrug Cytotoxicity

2.5.1. pH Dependence of IC50 Values under Oxia and Anoxia

The inhibition of cell proliferation by the compounds was evaluated following 4 h of exposure under oxia (20% O2) or anoxia (<0.01% O2 gas phase) at pHe 7.4 and 6.5. A representative experiment with SiHa cells, illustrated in Figure 3, demonstrates that chlorambucil (1) is selective for low pHe, with pH cytotoxicity ratios (PCR) of approximately 7, but has no selectivity for anoxia versus oxia. Conversely, SN30000 (2) showed anoxia cytotoxicity ratios (ACR) of approximately 140, with little or no dependence on pHe. BTO acid 4a demonstrates selectivity for both these features of the tumor microenvironment, although the PCR values (~2.5) were less than for chlorambucil and the ACR values (~8) were less than for SN30000. The potency of 4a was low, even under the most favorable conditions (IC50 approximately 50-fold higher than for SN30000 at pHe 6.5 under anoxia).
We evaluated the series of BTO acids and their corresponding esters in this assay, for both SiHa and FaDu cells, with chlorambucil (CHL, 1) and SN30000 (2) used as reference compounds in each experiment. The results are summarized in Table 3 (SiHa) and Table 4 (FaDu), and for the corresponding esters in Table 5 (SiHa) and Table 6 (FaDu). CHL showed greater pH selectivity under oxic than anoxic conditions in SiHa cultures, but this difference was not observed in FaDu cultures. SN30000 (2) and tirapazamine (TPZ, 3) showed consistently high selectivity for anoxia, with greater selectivity for SN30000 than TPZ, as reported for other cell lines [29,30,46,47]. Neither of these BTOs showed pH selectivity, except that SN30000 was significantly less potent at pHe 6.5 than 7.4 under anoxia in both cell lines. The BTO acids (4a12a) showed PCR values >1 in almost all cases for which IC50 values could be determined within solubility constraints, with the exception of the relatively acidic (pKa 3.67) 3-aminoacetic acid 8a, which lacked pH selectivity in both cell lines. As noted above for 4a, the BTO acids all had low anoxia cytotoxicity ratio (ACR) values, with on-scale ratios ranging from 2 to 8.3 for SiHa and 3 to 5.6 for FaDu. The potencies of the BTO acids under anoxia at pHe 6.5 ranged from 97 to 3800 μM, broadly reflecting the E0′ values with 4a (E0′ −399 mV) being the most potent and 10a (E0′ −565 mV) one of the least potent, although 7a (E0′ −463 mV, similar to TPZ) was even less potent than 10a. Notably, these potencies were much lower than for TPZ and SN30000 (range of 2.9–8.6 μM), despite similar E0′ values, suggesting that there may be an impediment to cytotoxicity of the acids that is not due to compromised metabolic one-electron reduction. Overall IC50 ratios, reflecting TME (tumor microenvironment) selectivity (TME ratio, TMR = oxic pHe 7.4/anoxic pHe 6.5), were consistently less for the BTO acids than the reference BTOs.
The corresponding esters (4b12b) were distinctly different from the BTO acids, in that they lacked pH selectivity, with PCR values clustered around unity under both oxia and anoxia (Table 5 and Table 6). This suggests that the pHe selectivity of the BTO acids is likely due to pH-dependent partitioning, as expected. The anoxic potencies of the esters (IC50 values 1.4–20.4 in SiHa, 3.2–43.7 in FaDu) were markedly greater than for the BTO acids in each case, and their ACR values were generally higher, although the anoxic selectivity and overall TME selectivity was still inferior to TPZ and SN30000.
We also evaluated the growth inhibition of the head and neck squamous cell carcinoma line UT-SCC-74B by CHL (1), SN30000 (2) and BTO acid 4a under oxia and anoxia at both pHe values (Supplementary Table S1). This gave similar results to the SiHa and FaDu cell lines, with CHL PCR values of 7.9 under oxia and 5.9 under anoxia, while pH selectivity was significant but lower than CHL for 4a (PCR 2.3 under oxia and 2.9 under hypoxia). Again, 4a showed much lower ACR than for SN30000 at either pHe.

2.5.2. pH Dependence of IC50 Values under Chronic Hypoxia

There are relatively few viable cells in tumors at O2 concentrations as low as in the above anoxic experiments. In addition, extensive changes in gene expression occur under chronic exposure to intermediate O2 concentrations (chronic hypoxia), including the expression of proteins that regulate pHi [48]. Thus, we also determined the IC50 values of CHL, SN30000, and 4a in SiHa cultures grown for 24 h under 0.2% O2 before and during exposure to the drugs for 4 h (Table 7). Under these chronic hypoxic conditions, cell attachment to the plastic was less effective than under oxia or acute anoxia, requiring minor modifications to the IC50 assay method (detailed in Section 4.10). Therefore, oxic and anoxic exposures were also tested in these same experiments. The 24 h adaptation to hypoxia had little effect on the subsequent growth of the cultures at either pHe value (Figure S6).
Despite the changes in methodology, the IC50 values for the oxic and anoxic exposures (Table 7) were generally in good agreement with the previous results (Table 3). Under 0.2% O2, the potency of SN30000 was lower than under anoxia at both pHe values, as expected, with HCR values of approximately 20, in contrast to ACR values in the range 46–156. However, the PCR values for CHL and 4a were not markedly influenced by exposure to hypoxia (or anoxia), with no statistically significant differences in PCR between the three O2 concentrations (P > 0.5 by one-way ANOVA for all three compounds). This finding is consistent with the similar pHi values at each O2 concentration (Table 2), suggesting that pHi regulation in SiHa cells is not markedly improved under chronic hypoxia.

2.6. pH Dependence of Cellular Uptake of SN30000 and BTO Acids

The above cytotoxicity studies were broadly consistent with the cellular uptake of the weakly acidic BTOs by pH-dependent partitioning, but the low potency of the BTO acids relative to neutral BTOs with similar E0′ values suggests the low logD values of the acids might impede uptake. To investigate cellular uptake directly, we measured the intracellular and extracellular concentrations of SN30000 and three BTO acids (4a, 7a, 11a) in aerobic SiHa cell suspensions by HPLC (Figure 4). In these experiments, cell pellets were collected by centrifugation and 3H-mannitol was used as a cell-excluded marker to enable correction for the entrapped extracellular medium. The intracellular concentrations (Ci) of SN30000 were higher than the extracellular concentrations (Ce) at both 5 min and 60 min (Figure 4A), while the Ci of the BTO acids (Figure 4B–D) were much lower than the Ce. However, for the two BTO acids with measurable Ci/Ce ratios (7a,11a), uptake was enhanced at pHe 6.5 relative to pHe 7.4 (Figure 4C,D).
The observed Ci/Ce ratios and the expected values based on pH-dependent partitioning at equilibrium are shown in Table 8. The observed ratios were higher than predicted for SN30000 but lower for the BTO acids. The ratio of intracellular concentrations at the two pHe values were not accurately defined in most cases because of the large uncertainties arising from the subtraction of the drug in extracellular medium in the cell pellets when Ci was less than Ce. However, for two cases in which Ci could be reasonably estimated at both pHe values, the Ci was higher, at pH 6.5 by 3.9 ± 1.3-fold (7a at 5 min) and 4.4 ± 1.2-fold (11a at 60 min). In contrast, the Ci ratio at pHe 6.5/Ci at pHe 7.4 for SN30000 (2) was 1.09 ± 0.09 at 5 min and 0.95 ± 0.07 at 60 min. These ratios were broadly consistent with pH-dependent partitioning theory (Equations (2) and (3), Section 4.6) which gave Ci ratios (pHe 6.5/7.4) of 3.08 and 3.07 for 7a and 11a, respectively, and 0.51 for SN30000. This pH dependence of cell uptake is also broadly consistent with the pH dependence of cytotoxicity (PCR values 2–5) of 7a and 11a by SiHa cells (Table 3).
We next investigated the possible reasons for the lower-than-expected Ci/Ce values for the BTO acids. Given that the BCECF method reports an average pHi in the compartment(s) interrogated by the fluorogenic probe, we asked what pHi value would be needed to account for the low Ci/Ce ratios. For 7a, the observed ratios (~0.1 at pHe 7.4 and ~0.7 at pHe 6.5) could be simulated when the pHi was set at 6.4 for both pHe values, which is implausibly low. Alternatively, the binding of these anionic compounds to bovine serum albumin in FBS could contribute [49] to this, and we have previously shown that the 1-oxide acid 15d, which is a metabolite of SN30000 in mice, is >90% protein bound in mouse plasma [50]. Using the same equilibrium dialysis method, we found that 7a at 100 μM is 62 ± 1% bound in FBS, but binding was not detectable in a culture medium with 5 or 10% FBS (Figure S7), and it thus unlikely to be responsible for low cell uptake. A third possibility is that efflux transporters could be responsible for the low Ci values, but in preliminary experiments we found no effect of overexpression from breast cancer resistance protein (BCRP) or P-glycoprotein (Pgp) efflux transporters (Figure S8) on sensitivity to 4a or 7a (or SN30000 (2)) in MDCK-11 cell lines under anoxia, and no effect from the pan-inhibition of monocarboxylate transporters (MCT) by phenylpyruvate [51] on sensitivity of anoxic SiHa cells to 4a (Figure S9). We also evaluated the temperature dependence of uptake by SiHa cell suspensions. The Ci/Ce ratios for SN30000 (2) showed a minor increase at 4 °C, relative to 37 °C, but 4a was again undetectable at either temperature (data not shown) which also argues against efflux transporters being responsible.

2.7. Anoxic Metabolism of SN30000 and BTO Acids: Metabolite Identification, and Quantitation

A further possible cause of low intracellular concentrations could be the metabolic consumption of the BTO acids, lowering the steady state Ci values. No metabolites of SN30000 or the BTO acids were observed in the above cellular uptake studies under 20% O2 (data not shown), making this unlikely. However, under anoxic conditions, the time-dependent formation of a less polar metabolite was observed in the extracellular medium in each case, as illustrated for 4a in Figure 5A. These metabolites were not formed in any medium without cells under the same conditions and were identified as the corresponding N-1-oxides by their identical retention times and absorbance spectra to the authentic compounds (SN30000 1-oxide, 15a, 15d)
The N-1-oxide metabolites of BTOs are known to have very low cytotoxic potencies [29,50,52,53], reflecting that the active cytotoxic species are the intermediate one-electron reduced radicals [24,52,54,55,56,57]. However, the 1-oxides are of interest in the present context as downstream markers of the reductive activation pathway. Quantitation of 1-oxide formation at 2 h (Figure 5B) demonstrated, surprisingly, that the metabolism by SiHa cells was independent of pHe, and that the rate was significantly higher for the BTO acids 4a and 7a than for SN30000, despite their low Ci values and low one-electron reduction potentials, as noted above.
To investigate the one-electron reductive metabolism of the BTO acids further, we compared the anoxic metabolism between SiHa and SiHa/POR. The latter cell line over-expresses full-length NADPH-cytochrome P450 reductase (POR), which is the major one-electron reductase for SN30000 and other BTOs [30,58,59]. As expected, SiHa/POR metabolized SN30000 to its N-1-oxide more rapidly than the parental SiHa cells, but the rate of metabolism of 4a and 7a was essentially unchanged by the forced expression of POR (Figure 5C). A possible explanation for this is that the BTO acids are not substrates for POR in cells, despite the confirmed reduction of 7a by sPOR in vitro (Figure 2), however, using anoxic S9 preparations from SiHa and SiHa/POR cells, we demonstrated that POR is able to reduce all three compounds to the corresponding 1-oxides when the plasma membrane barrier has been disrupted (Figure 5D).

2.8. Cytotoxicity in Anoxic SiHa and SiHa/POR Cultures

The lack of effect of POR over-expression on the reductive metabolism of the BTO acids in intact cells led us to compare the cytotoxicities of SN30000 (2), 4a, and 7a in SiHa/POR, and the parental line, under anoxia (Figure 6). For SN30000, the IC50 was 6.75-fold lower in the POR cell line, while for 4a and 7a the ratio was 3.4 and 2.7, respectively. This result, in conjunction with the lack of increase in total metabolism by the POR-expressing cells, suggested the hypothesis that the cytotoxicity of the BTO acids under anoxia is due to a minor component of the total reductive metabolism, with the majority of the metabolism to the 1-oxides not contributing to the cytotoxicity (these components are identified with intracellular reduction and extracellular reduction at the cell surface, respectively, in the model presented in Section 3).

2.9. Cellular Uptake and Metabolism of BTO Ester 4b

If the anionic sidechain of the BTO acids results in low intracellular concentrations, with reductive metabolism occurring largely at the cell surface, the corresponding esters would be expected to provide improved delivery to the intracellular compartment (consistent with their higher cytotoxic potencies, as noted in Section 2.5). To test this, we compared the metabolism of ester 4b (Figure 7A) with its corresponding acid 4a (Figure 7B) by monitoring extracellular concentrations in anoxic SiHa suspensions. The rates of metabolism of both compounds were unaffected by pHe, consistent with the results for 4a in Figure 5B. The ester was metabolized more rapidly than the acid, with only a trace of acid 4a detected transiently as an extracellular metabolite (Figure 7A). The major metabolites were the less polar 1-oxide, 15a, and the 1-oxide of the ester, 16a. In separate experiments with higher initial concentrations of 4b, 15a was again the main extracellular metabolite (Figure 7C, left). Notably, the intracellular concentrations of acid 4a were extremely high, reaching a maximum of 4.1 mM at 30 min, while concentrations of its 1-oxide 15a were approximately 10-fold lower (Figure 7C, right). Compound 4b itself was not detected in the intracellular samples, presumably reflecting a lack of retention in cells and the very low intracellular volume, which will compromise analytical sensitivity (only 2 × 10⁶ cells were collected for each analysis in this experiment). These data demonstrate that the relatively polar acid 4a is efficiently entrapped in cells if generated intracellularly from the ester, implying that the low intracellular concentration in cells incubated with 4a itself is not due to efflux pumps.

2.10. WST-1 Inhibition of Anoxic Metabolism of BTO Acids

The above studies demonstrate that the BTO acids are efficiently reduced by anoxic cells, despite poor cellular uptake and lack of additional reduction when POR is over-expressed. One possibility for this is that the BTO acids are reduced to the 1-oxides by an extracellular one-electron reductase. To test this, we evaluated whether the cell-excluded disulfonic acid tetrazolium salt WST-1 could compete with BTO acids for one-electron reduction. WST-1 is a known electron acceptor for one-electron reduction by the plasma membrane electron transport system (PMET) [60] and is widely used as a cell viability assay, although the latter application uses 1-methoxyphenazine methylsulphate (mPMS) as an electron transfer intermediate. Given the possibility that mPMS could cross the plasma membrane itself, we used WST-1 without mPMS to ensure that the electron donor is a cell surface reductase. WST-1 potently inhibited the anoxic reduction of BTO acids 4a and 7a to their respective N-1-oxides, 15a and 15d, by SiHa cells, as assessed by HPLC, with IC50 values of 7.05 μM and 14.3 μM, respectively (Figure 8). In contrast, the metabolic reduction of SN30000 and TPZ was much less efficiently inhibited by WST-1, with IC50 values >1 mM (Figure 8). These results are consistent with most reductions of the BTO acids occurring extracellularly, while most reductions of SN30000 and TPZ occur intracellularly.

3. Discussion

In this study we illustrate the concept of designing prodrugs by superimposing selectivity for acidosis on selectivity for hypoxia in order to exploit these two important features of the tumor microenvironment (TME). Given that both features result from defective microvasculature in solid tumors, regions of hypoxia and low pHe at least partially overlap [61,62], indicating that such dual targeting has potential for enhancing the tumor selectivity of hypoxia activated prodrugs. We provide clear evidence that weakly acidic BTOs offer this dual selectivity in cell culture models, with consistently greater antiproliferative effects at pHe 6.5 than 7.4 (whether under oxia, hypoxia, or anoxia). Importantly, the BTO acids also demonstrate significant selectivity for low oxygen concentrations (Table 3, Table 4, Table 5, Table 6 and Table 7). This dual specificity for acidosis and hypoxia is illustrated by the summary of inferred mechanism of action of the BTO acids in Figure 9.
Neutral (BTO esters and TPZ) or weakly basic BTOs (SN30000) lack the modest pH selectivity of the BTO acids, but it is notable that the latter are much less potent under all conditions tested. In addition, the BTO acids show relatively modest enhancements in potency under anoxia or hypoxia, and their overall TME ratios (potency against hypoxic cells at pHe 6.5 versus oxic cells at pHe 7.4) are consistently less than neutral or basic compounds, at least for the BTO acids that are soluble enough to determine IC50 values under aerobic conditions. For these reasons we do not consider these compounds to be candidates for further development as anticancer agents, but investigation of the factor(s) that compromise their potency was warranted to better understand how this dual targeting approach could ultimately be applied more successfully.
The disappointingly low potency of the BTO acids can be ascribed, at least in part, to their low intracellular concentrations, which were less than extracellular concentrations, even at pHe 6.5. The intracellular concentrations were difficult to measure accurately because of the large correction required for the extracellular drug in the cell pellets, however, they were consistently lower than what was predicted by pH-dependent partitioning. However, the increase in Ci at pHe 6.5 relative to 7.4 was broadly in line with the theory (Table 8). Several mechanisms that could lower Ci below the equilibrium value were considered. The low pKa values of the acids (3.66–4.48) mean that at pHe 6.5, concentrations of the membrane-permeant (neutral) free acids would be ~0.1–1% of the total, while the anions are expected to have negligible membrane permeability [63], resulting in low logD values and slow kinetics of uptake into cells. Despite this, there was no obvious trend in Ci values between 5 min and 60 min (Table 8). Low steady state Ci could be maintained by an intracellular sink such as reductive metabolism, but under the oxic conditions used for the uptake studies we could not detect 1-oxides or any other metabolites. Reversible binding of the weak acids to albumin or other proteins in FBS could potentially limit free drugs available for trans-membrane diffusion, but we were not able to detect significant binding by equilibrium dialysis at the FBS concentrations used for the IC50 or cell uptake/metabolism studies. A limited investigation of efflux transporters, which could also maintain low intracellular concentrations, did not reveal a role for Pgp, BCRP, or MCTs (Figures S6 and S7). In addition, the intracellular generation of acid 4a from ester 4b resulted in very high Ci/Ce ratios of the acid (Figure 7), supporting a model in which the acids have very low membrane permeability. However, this does not preclude the involvement of unidentified transporters that become saturated at the millimolar intracellular concentrations of acid 4a achieved from ester 4b. We note that the roles of passive diffusion versus transporters for the movement of xenobiotics across the plasma membrane remains controversial [64,65], and that it is entirely possible that slow pH-dependent partitioning plus efflux by unidentified transporters both contribute to the low steady state Ci values of the BTO acids. These considerations suggest it may be productive to explore BTO acids with a moderately higher pKa (selectivity for acidosis would decrease with pKa values >6, Figure S1) and greater lipophilicity.
While low intracellular concentrations restrict the potency of the BTO acids, this is clearly not the only limitation in the present series. The lack of the effect of forced expression of the one-electron reductase POR on the metabolism or cytotoxicity of the BTO acids under anoxia, relative to SN30000 (2) (Figure 5 and Figure 6), coupled with the inhibition of reduction of the 1-oxides by the extracellular electron acceptor WST-1 (Figure 8), suggests extensive reduction by extracellular reductase(s), as illustrated in Figure 9. The reductive metabolism of extracellular xenobiotics has little been studied, but the trans-plasma membrane electron transport (PMET) system is a candidate here. The components of this ubiquitous system vary between cell types but utilize intracellular NAD(P)H to reduce extracellular substrates such as WST-1 and ferricyanide via CoQ10-linked oxidoreductases [66,67]. The flavoreductase STEAP4 has been identified recently as capable of reducing the bioreductive prodrug tarloxotinib extracellularly [68]. In the case of BTO bioreductive drugs, the active cytotoxic metabolites are highly reactive DNA-damaging free radicals [54,56,57,69,70,71,72,73]. Both SN30000 [24] and BTO acid 7a (Figure 2) form spin-trappable radicals with EPR features that are suggestive of an aryl radical and not the hydroxyl radical. Aryl radicals are powerful oxidants that induce DNA breaks [74,75,76], but their extreme instability would preclude DNA damage when formed extracellularly. Thus, the extracellular reduction of BTO acids is likely to be an unproductive metabolism, contributing to their low cytotoxic potencies, in contrast to the extracellular reduction of tarloxotinib, which generates a stable, membrane-permeant pan-ErbB inhibitor.
In conclusion, the present study has demonstrated the concept of the dual targeting of hypoxia and low extracellular pH in cell culture models and has identified the key features of the cellular pharmacology and mechanism of action of BTO acids in this context. This investigation suggests that to successfully exploit pH-dependent partitioning in this context, this will require application to bioreductive prodrugs that have good membrane permeability as free acids and that undergo one-electron reduction catalyzed only by intracellular enzymes.

4. Materials and Methods

4.1. General Chemistry Procedures

All final products were analyzed by reverse-phase HPLC, (ZORBAX Eclipse XDB C8 5 μm column, 4.6 × 150 mm; Agilent Technologies, Santa Clara, CA, USA) using an Agilent Technologies 1260 Infinity chromatography system equipped with a diode-array absorbance detector. Mobile phases were gradients of 80% acetonitrile/20% H2O (v/v) in 45 mM of ammonium formate at a pH 3.5 at 0.8 mL/min. Final compound purity was determined by monitoring at 280–380 nm and was >95%, with the exception of 8b (93.7%). Melting points were determined on an Electrothermal 2300 melting point apparatus (Cole-Palmer, Stone, UK). NMR spectra were obtained on a Bruker Avance 400 spectrometer (Bruker Biospin, Alexandria, Australia) at 400 MHz for 1H and 100 MHz for the 13C spectra. Spectra were obtained in CDCl3 unless noted otherwise. The chemical shifts and coupling constants were recorded in units of ppm and Hz, respectively. Low resolution mass spectra were gathered by the direct injection of methanolic solutions into an Agilent 6120 mass spectrometer using an atmospheric pressure chemical ionization (APCI) mode with a fragmentor voltage of 50 V and a drying gas temperature of 250 °C. High resolution mass spectra (HRMS) were measured on an Agilent Technologies 6530 Accurate-Mass Quadrupole Time of Flight (Q-TOF) LC/MS interfaced with an Agilent Jet Stream Electrospray Ionization (ESI) source, allowing the detection of positive or negative ions. Organic solutions were dried over Na2SO4 and solvents were evaporated under reduced pressure on a rotary evaporator. Thin-layer chromatography was carried out on aluminium-backed silica gel plates (Merck 60 F254, Merck KGaA, Darmstadt, Germany) with the visualization of components by UV light (254 nm) or exposure to I2. Column chromatography was carried out on silica gel (Merck 230–400 mesh). DCM refers to dichloromethane, DME refers to dimethoxyethane, DMF refers to dimethylformamide, DMSO refers to dimethyl sulfoxide, EtOAc refers to ethyl acetate, FBS refers to fetal bovine serum, MeOH refers to methanol, NADPH refers to nicotinamide adenine dinucleotide phosphate hydrogen, “pet. ether” refers to the petroleum ether boiling fraction of 40–60 °C, PBN refers to α-phenyl-N-tert-butylnitrone, THF refers to tetrahydrofuran, and TFAA refers to trifluoroacetic anhydride.
Chlorambucil was obtained from Sigma-Aldrich (Merck KGaA, Darmstadt, Germany) while SN30000 (2) and its 1N-oxide [28] and TPZ (3) [77] were prepared as previously described.

4.2. Synthesis of BTO-3-Alkanoic Esters (4b7b) and Acids (4a7a)

4.2.1. Stille Coupling of BTO Iodides (13a13d) with Allyl Alcohol

3-(3-Oxopropyl)benzo[e][1,2,4]triazine 1-oxide (14a). Pd(OAc)2 (447 mg, 1.99 mmol) was added to a degassed mixture of 3-iodobenzo[e][1,2,4]triazine 1-oxide (13a) [78] (5.44 g, 19.9 mmol), NaHCO3 (3.68 g, 43.8 mmol), tetrabutylammonium chloride (5.53 g, 19.9 mmol), and allyl alcohol (6.80 mL, 99.6 mmol) in acetonitrile (200 mL), and the mixture was stirred at reflux temperature for 2 h. The mixture was cooled and the solvent was evaporated. The residue was purified by chromatography, eluting with a gradient (30–50%) of EtOAc/pet. ether, to give aldehyde 14a (2.53 g, 62%) as a tan powder: mp (EtOAc/pet. ether) 86–88 °C; 1H-NMR δ 9.45 (s, 1 H, CHO), 8.45 (br d, J = 8.7 Hz, 1 H, H-8), 7.73–7.98 (m, 2 H, H-5, H-7), 7.70 (ddd, J = 8.5, 6.8 Hz, 1 H, H-6), 3.38 (dd, J = 6.9, 6.7 Hz, 2 H, CH2), 3.14 (dd, J = 6.9, 6.7 Hz, 2 H, CH2); MS m/z 204.1 (MH+, 100%). Anal. calcd for C10H9N3O2: C, 59.11, H, 4.46; N, 20.68. Found: C, 59.11; H, 4.42; N, 20.65%.
7-Methyl-3-(3-oxopropyl)benzo[e][1,2,4]triazine 1-oxide (14b). Similarly, the reaction of 3-iodo-7-methylbenzo[e][1,2,4]triazine 1-oxide (13b) [78] (1.85 g, 6.44 mmol) with Pd(Oac)2 (145 mg, 0.64 mmol), NaHCO3 (1.19 g, 14.2 mmol), tetrabutylammonium chloride (1.79 g, 6.44 mmol) and allyl alcohol (2.20 mL, 32.3 mmol) gave aldehyde 14b (955 mg, 47%) as an grey solid: mp (EtOAc/pet. ether) 69–71 °C; 1H NMR δ 9.94 (s, 1 H, CHO), 8.23 (br s, 1 H, H-8), 7.85 (d, J = 8.6, 1.8 Hz, 1 H, H-5), 7.75 (dd, J = 8.6, 1.8 Hz, 1 H, H-6), 3.37 (t, J = 6.9 Hz, 2 H, CH2), 3.12 (t, J = 6.9 Hz, 2 H, CH2), 2.58 (s, 3 H, 7-CH3); MS m/z 218.1 (MH+, 100%). Anal. calcd for C11H11N3O2: C, 60.82, H, 5.10; N, 19.34. Found: C, 60.72; H, 5.01; N, 19.12%.
6-Methyl-3-(3-oxopropyl)benzo[e][1,2,4]triazine 1-Oxide (14c). Similarly, reaction of 3-iodo-6-methylbenzo[e][1,2,4]triazine 1-oxide (13c) [78] (3.00 g, 10.5 mmol) with Pd(OAc)2 (234 mg, 1.05 mmol), NaHCO3 (1.93 g, 23.0 mmol), tetrabutylammonium chloride (2.89 g, 10.5 mmol) and allyl alcohol (3.56 mL, 52.3 mmol) gave aldehyde 14c (1.40 g, 44%) as an cream powder: mp (EtOAc/pet. ether) 71–72 °C; 1H NMR δ 9.94 (s, 1 H, CHO), 8.32 (d, J = 8.8 Hz, 1 H, H-8), 7.72 (br s, 1 H, H-5), 7.50 (dd, J = 8.8, 1.7 Hz, 1 H, H-7), 3.36 (t, J = 6.9 Hz, 2 H, CH2), 3.12 (t, J = 7.1 Hz, 2 H, CH2), 2.59 (s, 3 H, 6-CH3); MS m/z 218.1 (MH+, 100%). Anal. calcd for C11H11N3O2: C, 60.82, H, 5.10; N, 19.34. Found: C, 60.94; H, 5.06; N, 19.59%.
3-(1-Oxido-7,8-dihydro-6H-indeno[5,6-e][1,2,4]triazin-3-yl)propanal (14d). Similarly, the reaction of 3-iodo-7,8-dihydro-6H-indeno[5,6-e][1,2,4]triazine 1-oxide 13d [78] (7.15 g, 22.8 mmol) with Pd(OAc)2 (516 mg, 2.28 mmol), NaHCO3 (4.23 g, 50.0 mmol), tetrabutylammonium chloride (6.35 g, 22.8 mmol) and allyl alcohol (7.77 mL, 114 mmol) gave aldehyde 14d (3.54 g, 64%) as an off white solid: mp (EtOAc/pet. ether) 72–74 °C; 1H NMR δ 9.93 (t, J = 0.9 Hz, 1 H, CHO), 8.25 (s, 1 H, H-9), 7.73 (s, 1 H, H-5), 3.35 (t, J = 7.0 Hz, 2 H, CH2), 3.07–3.14 (m, 6 H, H-6, H-8, CH2), 2.21 (p, J = 7.5 Hz, 2 H, H-7); 13C NMR δ 200.4, 163.9, 154.8, 149.1, 147.2, 132.3, 122.7, 114.2, 40.5, 33.1, 32.8, 29.4, 25.7; MS m/z 244.2 (MH+, 100%); HRMS (CI, CH3OH) calcd for C13H14N3O2 (MH+) m/z 244.1086, found 244.1088. Anal. calcd for C13H13N3O2: C, 64.2; H, 5.4; N, 17.3. Found: C, 63.9; H, 5.5; N, 17.0%.

4.2.2. Oxidation of Aldehydes (14a14d).

3-(2-Carboxyethyl)benzo[e][1,2,4]triazine 1-Oxide (15a). A solution of NaClO2 (1.59 g, 14.1 mmol) in water (20 mL) was added dropwise to a stirred mixture of aldehyde 14a (1.91 g, 9.39 mmol) in MeCN (80 mL) and KH2PO4 (319 mg, 2.35 mmol) in water (10 mL) and 35% H2O2 (1.15 mL, 11.3 mmol) at 5 °C and the mixture was stirred at 5 °C for 3 h. The mixture was acidified with aqueous HCl (1 M) and extracted with EtOAc (3 × 50 mL). The combined organic fraction was extracted with an aqueous NaOH solution (0.1 M, 3 × 50 mL). The aqueous fraction was acidified with an aqueous HCl solution (1 M) and extracted with EtOAc (3 × 50 mL). The organic fraction was dried and the solvent was evaporated. The residue was purified by chromatography, eluting with a gradient (50–100%) of EtOAc/pet. ether, to give acid 15a (1.82 g, 88%) as a cream powder: mp 152–154 °C (dec.); 1H NMR [(CD3)2SO] δ 12.52 (br s, 1 H, CO2H), 8.37 (dd, J = 8.7, 0.8 Hz, 1 H, H-8), 8.08 (ddd, J = 8.7, 6.8, 1.4 Hz, 1 H, H-7), 8.03 (dd, J = 8.4, 1.4 Hz, 1 H, H-5), 7.89 (ddd, J = 8.4, 6.8, 1.4 Hz, 1 H, H-6), 3.19 (t, J = 7.1 Hz, 2 H, CH2), 2.83 (t, J = 7.1 Hz, 2 H, CH2); MS m/z 204.1 (MH+, 100%). Anal. calcd for C10H9N3O3: C, 54.79; H, 4.14; N, 19.17. Found: C, 55.06; H, 4.00; N, 19.31%.
3-(2-Carboxyethyl)-7-methylbenzo[e][1,2,4]triazine 1-Oxide (15b). Similarly, the reaction of NaClO2 (0.70 g, 6.19 mmol) with aldehyde 14b (0.90 g, 4.12 mmol), KH2PO4 (140 mg, 1.03 mmol) and 30% H2O2 (0.51 mL, 4.94 mmol) gave acid 15b (771 mg, 80%) as white needles: mp 191–193 °C (dec.); 1H NMR [(CD3)2SO] δ 12.24 (br s, 1 H, CO2H), 8.18 (br s, 1 H, H-8), 7.90–7.94 (m, 2 H, H-5, H-6), 3.17 (br t, J = 7.1 Hz, 2 H, CH2), 2.82 (br t, J = 7.1 Hz, 2 H, CH2), 2.55 (s, 3 H, 7-CH3); MS m/z 234.1 (MH+, 100%). Anal. calcd for C11H11N3O3: C, 56.65; H, 4.75; N, 18.02. Found: C, 56.73; H, 4.80; N, 18.16%.
3-(2-Carboxyethyl)-6-methylbenzo[e][1,2,4]triazine 1-Oxide (15c). Similarly, the reaction of NaClO2 (1.00 g, 8.84 mmol) with aldehyde 14c (1.28 g, 5.89 mmol), KH2PO4 (200 mg, 1.47 mmol) and 30% H2O2 (0.72 mL, 7.07 mmol) gave acid 15c (1.32 g, 82%) as a white powder: mp 170–171 °C; 1H NMR [(CD3)2SO] δ 12.24 (br s, 1 H, CO2H), 8.32 (d, J = 8.8 Hz, 1 H, H-8), 7.74 (br s, 1 H, H-5), 7.51 (dd, J = 8.8, 1.7 Hz, 1 H, H-7), 3.35 (t, J = 7.1 Hz, 2 H, CH2), 3.02 (t, J = 7.1 Hz, 2 H, CH2), 2.59 (s, 3 H, 6-CH3); MS m/z 234.1 (MH+, 100%). Anal. calcd for C11H11N3O3: C, 56.65; H, 4.75; N, 18.02. Found: C, 56.92; H, 4.69; N, 18.25%.
3-(2-Carboxyethyl)-7,8-dihydro-6H-indeno[5,6-e][1,2,4]triazine 1-Oxide (15d). Similarly, the reaction of NaClO2 (222 mg, 1.96 mmol) with 3-(1-oxido-7,8-dihydro-6H-indeno[5,6-e][1,2,4] triazin-3-yl)-1-propanal 14d (341 mg, 1.40 mmol) gave acid 15d (261 mg, 72%) as a white powder: mp 215 °C (dec.); 1H NMR δ 8.24 (s, 1 H, H-9), 7.74 (s, 1 H, H-5), 3.34 (br t, J = 7.0 Hz, 2 H, CH2), 3.08–3.14 (m, 4 H, H-6, H-8), 3.01 (t, J = 7.0 Hz, 2 H, CH2), 2.22 (p, J = 7.4 Hz, 2 H, H-7), OH not observed; 13C NMR δ 176.4, 164.0, 155.2, 149.4, 147.2, 132.6, 122.8, 114.6, 33.3, 33.0, 31.4, 31.0, 25.9; MS m/z 260.3 (MH+, 100%); Anal. calcd for C13H13N3O3: C, 60.22; H, 5.05; N, 16.21. Found: C, 60.46; H, 5.08; N, 16.34%.

4.2.3. Esterification of Acids (15a15d).

3-(3-Methoxy-3-oxopropyl)benzo[e][1,2,4]triazine 1-Oxide (16a). cH2SO4 (cat., 0.3 mL) was added to a stirred suspension of acid 15a (2.28 g, 10.4 mmol) in dry MeOH (100 mL) and the mixture was stirred at reflux temperature for 6 h. The mixture was cooled to 20 °C and the solvent was evaporated. The residue was partitioned between EtOAc (100 mL) and water (100 mL). The organic fraction was washed with an aqueous NaOH solution (0.1 M, 50 mL), then washed with water (25 mL), then washed with brine (30 mL), then dried, after which the solvent was evaporated. The residue was purified by chromatography, eluting with 50% EtOAc/pet. ether, to give ester 16a (2.267 g, 94%) as a white powder: mp (EtOAc/pet. ether) 45–47 °C; 1H NMR δ 8.44 (dd, J = 8.6, 1.2 Hz, 1 H, H-8), 7.97 (dd, J = 8.7, 1.4 Hz, 1 H, H-5), 7.93 (ddd, J = 8.6, 6.9, 1.3 Hz, 1 H, H-7), 7.70 (ddd, J = 8.4, 6.9, 1.4 Hz, 1 H, H-6), 3.71 (s, 3 H, OCH3), 3.37 (t, J = 7.2 Hz, 2 H, CH2), 2.99 (t, J = 7.2 Hz, 2 H, CH2); MS m/z 234.2 (MH+, 100%). Anal. calcd for C11H11N3O3: C, 56.65; H, 4.75; N, 18.02. Found: C, 56.86; H, 4.56; N, 18.21%.
3-(3-Methoxy-3-oxopropyl)-7-methylbenzo[e][1,2,4]triazine 1-Oxide (16b). Similarly, the reaction of cH2SO4 (cat., 0.2 mL) with acid 15b (730 mg, 3.13 mmol) in dry MeOH (50 mL) gave ester 16b (740 mg, 96%) as a white powder: mp (EtOAc/pet. ether) 130–132 °C; 1H NMR δ 8.24 (br s, 1 H, H-8), 7.86 (d, J = 8.6 Hz, 1 H, H-5), 7.74 (dd, J = 8.6, 1.8 Hz, 1 H, H-6), 3.70 (s, 3 H, OCH3), 3.35 (t, J = 7.2 Hz, 2 H, CH2), 2.98 (t, J = 7.2 Hz, 2 H, CH2), 2.58 (s, 3 H, 7-CH3); MS m/z 248.2 (MH+, 100%). Anal. calcd for C12H13N3O3: C, 58.29; H, 5.30; N, 16.99. Found: C, 58.18; H, 5.31; N, 17.10%.
3-(3-Methoxy-3-oxopropyl)-6-methylbenzo[e][1,2,4]triazine 1-Oxide (16c). Similarly, the reaction of cH2SO4 (cat., 0.3 mL) with acid 15c (1.09 g, 4.67 mmol) in dry MeOH (50 mL) gave ester 16c (1.12 g, 97%) as white needles: mp (EtOAc/pet. ether) 91–93 °C; 1H NMR δ 8.32 (d, J = 8.8 Hz, 1 H, H-8), 7.73 (br s, 1 H, H-5), 7.50 (dd, J = 8.8, 1.7 Hz, 1 H, H-7), 3.70 (s, 3 H, OCH3), 3.35 (t, J = 7.2 Hz, 2 H, CH2), 2.97 (t, J = 7.2 Hz, 2 H, CH2), 2.59 (s, 3 H, 6-CH3); MS m/z 248.2 (MH+, 100%). Anal. calcd for C12H13N3O3: C, 58.29; H, 5.30; N, 16.99. Found: C, 58.18; H, 5.38; N, 17.18%.
3-(3-Methoxy-3-oxopropyl)-7,8-dihydro-6H-indeno[5,6-e][1,2,4]triazine 1-Oxide (16d). Similarly, the reaction of cH2SO4 (cat., 3 drops) with acid 15d (330 mg, 1.27 mmol) in dry MeOH (30 mL) gave ester 16d (277 mg, 80%) as a white powder: mp (EtOAc/pet. ether) 119–120 °C; 1H NMR δ 8.25 (s, 1 H, H-9), 7.74 (s, 1 H, H-5), 3.70 (s, 3 H, OCH3), 3.34 (t, J = 7.3 Hz, 2 H, CH2), 3.08–3.14 (m, 4 H, H-6, H-8), 2.96 (t, J = 7.3 Hz, 2 H, CH2CO), 2.21 (p, J = 7.5 Hz, 2 H, H-7); MS m/z 274.3 (MH+, 100%). Anal. calcd for C14H15N3O3: C, 61.53; H, 5.53; N, 15.38. Found: C, 61.64; H, 5.48; N, 15.44%.

4.2.4. Oxidation of Benzotriazine 1-Oxides (16a16d)

3-(3-Methoxy-3-oxopropyl)benzo[e][1,2,4]triazine 1,4-Dioxide (4b). H2O2 (30%, 9.8 mL, 95.1 mmol) was added dropwise to a stirred solution of TFAA (14.5 mL, 10.5 mmol) in DCM (30 mL) at 0–5 °C and the mixture was stirred at 20 °C for 1 h. This mixture was added dropwise to a stirred solution of ester 16a (2.218 g, 9.51 mmol) in DCM (30 mL) at 0 °C and the mixture was stirred at 20 °C for 24 h. The mixture was cooled to 0 °C and DMSO (6.75 mL, 95.1 mmol) was added and the mixture was stirred for 5 min. The mixture was carefully neutralized with a concentrated NH3 solution and the mixture was washed with water (3 × 30 mL), then dried, after which the solvent evaporated was. The residue was purified by chromatography, eluting with a gradient (50–100%) of EtOAc/pet. ether, to give di-oxide 4b (1.60 g, 68%) as a yellow powder: mp (EtOAc/pet. ether) 89–91 °C; 1H NMR δ 8.53 (dd, J = 8.7, 0.8 Hz, 1 H, H-8), 8.47 (dd, J = 8.7, 0.8 Hz, 1 H, H-5), 8.02 (ddd, J = 8.7, 7.1, 1.3 Hz, 1 H, H-7), 7.86 (ddd, J = 8.7, 7.1, 1.3 Hz, 1 H, H-6), 3.71 (s, 3 H, OCH3), 3.49 (t, J = 7.1 Hz, 2 H, CH2), 2.98 (t, J = 7.1 Hz, 2 H, CH2); 13C NMR [(CD3)2SO] δ 172.5, 154.1, 139.8, 135.7, 134.9, 132.1, 121.8, 119.7, 52.2, 28.8, 25.7; MS m/z 250.2 (MH+, 100%). Anal. calcd for C11H11N3O4: C, 53.01; H, 4.45; N, 16.86. Found: C, 53.17; H, 4.38; N, 16.93%.
3-(3-Methoxy-3-oxopropyl)-7-methylbenzo[e][1,2,4]triazine 1,4-Dioxide (5b). Similarly, the reaction of H2O2 (30%, 3.0 mL, 28.6 mmol) and TFAA (4.37 mL, 31.4 mmol) with ester 16b (706 mg, 2.86 mmol) gave starting material 16b (44 mg, 6%), spectroscopically identical to above, and di-oxide 5b (586 mg, 78%) as a yellow powder: mp (EtOAc/pet. ether) 165–167 °C; 1H NMR δ 8.40 (d, J = 8.8 Hz, 1 H, H-5), 8.25 (br s, 1 H, H-8), 7.82 (dd, J = 8.8, 1.5 Hz, 1 H, H-6), 3.71 (s, 3 H, OCH3), 3.48 (t, J = 7.1 Hz, 2 H, CH2), 2.97 (t, J = 7.1 Hz, 2 H, CH2), 2.63 (s, 3 H, 7-CH3); 13C NMR δ 172.5, 153.4, 143.8, 138.2, 137.7, 134.7, 120.5, 119.5, 52.2, 28.8, 25.6, 22.0; MS m/z 264.1 (MH+, 100%). Anal. calcd for C12H13N3O4: C, 54.75; H, 4.98; N, 15.96. Found: C, 54.83; H, 4.93; N, 16.23%.
3-(3-Methoxy-3-oxopropyl)-6-methylbenzo[e][1,2,4]triazine 1,4-Dioxide (6b). Similarly, the reaction of H2O2 (30%, 4.0 mL, 38.4 mmol) and TFAA (5.88 mL, 42.3 mmol) with ester 16c (950 mg, 3.84 mmol) gave starting material 16c (81 mg, 9%), spectroscopically identical to above, and di-oxide 6b (812 mg, 80%) as a yellow powder: mp (EtOAc/pet. ether) 166–168 °C; 1H NMR [(CD3)2SO] δ 8.26 (d, J = 8.9 Hz, 1 H, H-8), 8.18 (br s, 1 H, H-5), 7.78 (dd, J = 8.9, 1.6 Hz, 1 H, H-7), 3.63 (s, 3 H, OCH3), 3.27 (dt, J = 7.4, 7.1 Hz, 2 H, CH2), 2.97 (dt, J = 7.4, 7.1 Hz, 2 H, CH2), 2.61 (s, 3 H, 6-CH3); 13C NMR [(CD3)2SO] δ 172.2, 153.3, 147.4, 139.1, 133.9, 132.8, 120.8, 117.5, 51.6, 28.2, 25.2, 21.6; MS m/z 264.1 (MH+, 100%). Anal. calcd for C12H13N3O4: C, 54.75; H, 4.98; N, 15.96. Found: C, 54.51; H, 5.05; N, 16.22%.
3-(3-Methoxy-3-oxopropyl)-7,8-dihydro-6H-indeno[5,6-e][1,2,4]triazine 1,4-Dioxide (7b). Similarly, the reaction of H2O2 (30%, 1.25 mL, 10.0 mmol) and TFAA (1.26 mL, 9.1 mmol) with ester 16d (249 mg, 0.91 mmol) gave di-oxide 7b (200 mg, 76%) as a yellow powder: mp (EtOAc/pet. ether) 170–171 °C; 1H NMR δ 8.31 (s, 1 H, H-9), 8.25 (s, 1 H, H-5), 3.71 (s, 3 H, OCH3), 3.48 (t, J = 7.3 Hz, 2 H, CH2), 3.12–3.20 (m, 4 H, H-6, H-8), 2.97 (t, J = 7.2 Hz, 2 H, CH2CO), 2.26 (p, J = 7.5 Hz, 2 H, H-7); 13C NMR δ 172.6, 155.4, 153.2, 151.0, 139.2, 134.1, 116.1, 114.0, 52.2, 33.6, 33.1, 28.9, 25.8, 25.7; MS m/z 290.3 (MH+, 100%). Anal. calcd for C14H15N3O4: C, 58.13; H, 5.23; N, 14.53. Found: C, 57.91; H, 5.20; N, 14.44%.

4.2.5. Hydrolysis of Esters (4b7b)

3-(2-Carboxyethyl)benzo[e][1,2,4]triazine 1,4-Dioxide (4a). A solution of HCl in dioxane (4 M, 52 mL, 209 mmol) was added dropwise to a stirred suspension of ester 4b (1.30 g, 5.22 mmol) in dioxane (30 mL) and water (1 mL) and the mixture was stirred at 20 °C for 5 d. The mixture was diluted with water (200 mL), extracted with CHCl3 (3 × 100 mL), then the combined organic fraction was dried and the solvent was evaporated. The residue was purified by chromatography, eluting with a gradient (0–5%) of MeOH/DCM, to give starting ester 4b (390 mg, 30%), spectroscopically identical to above, and acid 4a (728 mg, 59%) as a yellow powder: mp (EtOAc) 157 °C (dec.); 1H NMR [(CD3)2SO] δ 12.35 (br s, 1 H, CO2H), 8.35–8.40 (m, 2 H, H-5, H-8), 8.12 (br ddd, J = 8.6, 7.1, 1.4 Hz, 1 H, H-7), 7.96 (br ddd, J = 8.6, 7.1, 1.4 Hz, 1 H, H-6), 3.23 (br t, J = 7.2 Hz, 2 H, CH2), 2.77 (br t, J = 7.2 Hz, 2 H, CH2); 13C NMR [(CD3)2SO] δ 173.2, 153.5, 139.3, 135.7, 134.4, 132.1, 121.1, 118.8, 28.4, 25.3; MS m/z 276.3 (MH+, 100%). Anal. calcd for C10H9N3O4: C, 51.07; H, 3.86; N, 17.87. Found: C, 51.10; H, 3.80; N, 17.58%. HPLC purity 95.1%.
3-(2-Carboxyethyl)-7-methylbenzo[e][1,2,4]triazine 1,4-Dioxide (5a). Similarly, the reaction of HCl in dioxane (4 M, 25 mL, 100 mmol) with ester 5b (522 mg, 1.98 mmol) gave starting ester 5b (249 mg, 48%), spectroscopically identical to above, and acid 5a (200 mg, 40%) as a yellow powder: mp (EtOAc/MeOH) 181–183 °C (dec.); 1H NMR [(CD3)2SO] δ 12.34 (br s, 1 H, CO2H), 8.26 (d, J = 8.8 Hz, 1 H, H-5), 8.18 (br s, 1 H, H-8), 7.95 (dd, J = 8.8, 1.6 Hz, 1 H, H-6), 3.22 (t, J = 7.1 Hz, 2 H, CH2), 2.77 (t, J = 7.2 Hz, 2 H, CH2), 2.57 (s, 3 H, 7-CH3); 13C NMR [(CD3)2SO] δ 173.2, 152.9, 143.1, 137.7, 137.5, 134.2, 119.6, 118.6, 28.4, 25.2, 21.1; MS m/z 250.1 (MH+, 100%). Anal. calcd for C11H11N3O4·¼CH3OH: C, 52.07; H, 4.94; N, 15.84. Found: C, 52.10; H, 4.80; N, 16.19%. HPLC purity 99.1%.
3-(2-Carboxyethyl)-6-methylbenzo[e][1,2,4]triazine 1,4-Dioxide (6a). Similarly, the reaction of HCl in dioxane (4 M, 34 mL, 136 mmol) with ester 6b (714 mg, 2.71 mmol) gave starting ester 6b (289 mg, 40%), spectroscopically identical to above, and acid 6a (385 mg, 57%) as a yellow powder: mp (EtOAc) 173–175 °C (dec.); 1H NMR [(CD3)2SO] δ 12.35 (br s, 1 H, CO2H), 8.25 (d, J = 8.8 Hz, 1 H, H-8), 8.18 (br s, 1 H, H-5), 7.79 (dd, J = 8.8, 1.6 Hz, 1 H, H-7), 3.23 (t, J = 7.2 Hz, 2 H, CH2), 2.76 (t, J = 7.2 Hz, 2 H, CH2), 2.60 (s, 3 H, 6-CH3); 13C NMR [(CD3)2SO] δ 173.2, 153.6, 147.4, 139.1, 133.8, 132.8, 120.8, 117.5, 28.4, 25.3, 21.6; MS m/z 250.1 (MH+, 100%). Anal. calcd for C11H11N3O4: C, 53.01; H, 4.45; N, 16.86. Found: C, 52.94; H, 4.47; N, 16.80%. HPLC purity 99.6%.
3-(2-Carboxyethyl)-7,8-dihydro-6H-indeno[5,6-e][1,2,4]triazine 1,4-Dioxide (7a). Similarly, the reaction of HCl in dioxane (4 M, 4.32 mL, 17.3 mmol) with ester 7b (100 mg, 0.34 mmol) gave starting ester 7b (13 mg, 13%), spectroscopically identical to above, and acid 7a (60 mg, 64%) as a yellow powder: mp (EtOAc) 159 °C (dec.); 1H NMR δ 12.34 (br s, 1 H, CO2H), 8.18 (s, 1 H, H-9), 8.17 (s, 1 H, H-5), 3.22 (t, J = 7.2 Hz, 2 H, CH2), 3.07–3.16 (m, 4 H, H-6, H-8), 2.76 (t, J = 7.2 Hz, 2 H, CH2CO), 2.13 (p, J = 7.5 Hz, 2 H, H-7); 13C NMR δ 173.2, 154.6, 152.7, 150.2, 138.7, 133.5, 115.2, 113.1, 32.8, 32.3, 28.5, 25.2 (2); MS m/z 276.3 (MH+, 100%). Anal. calcd for C13H13N3O4: C, 56.72; H, 4.76; N, 15.27. Found: C, 57.00; H, 4.73; N, 15.08%. HPLC purity 99.7%.

4.2.6. Synthesis of BTO-3-aminoalkanoic Esters (8b12b) and Acids (8a12a)

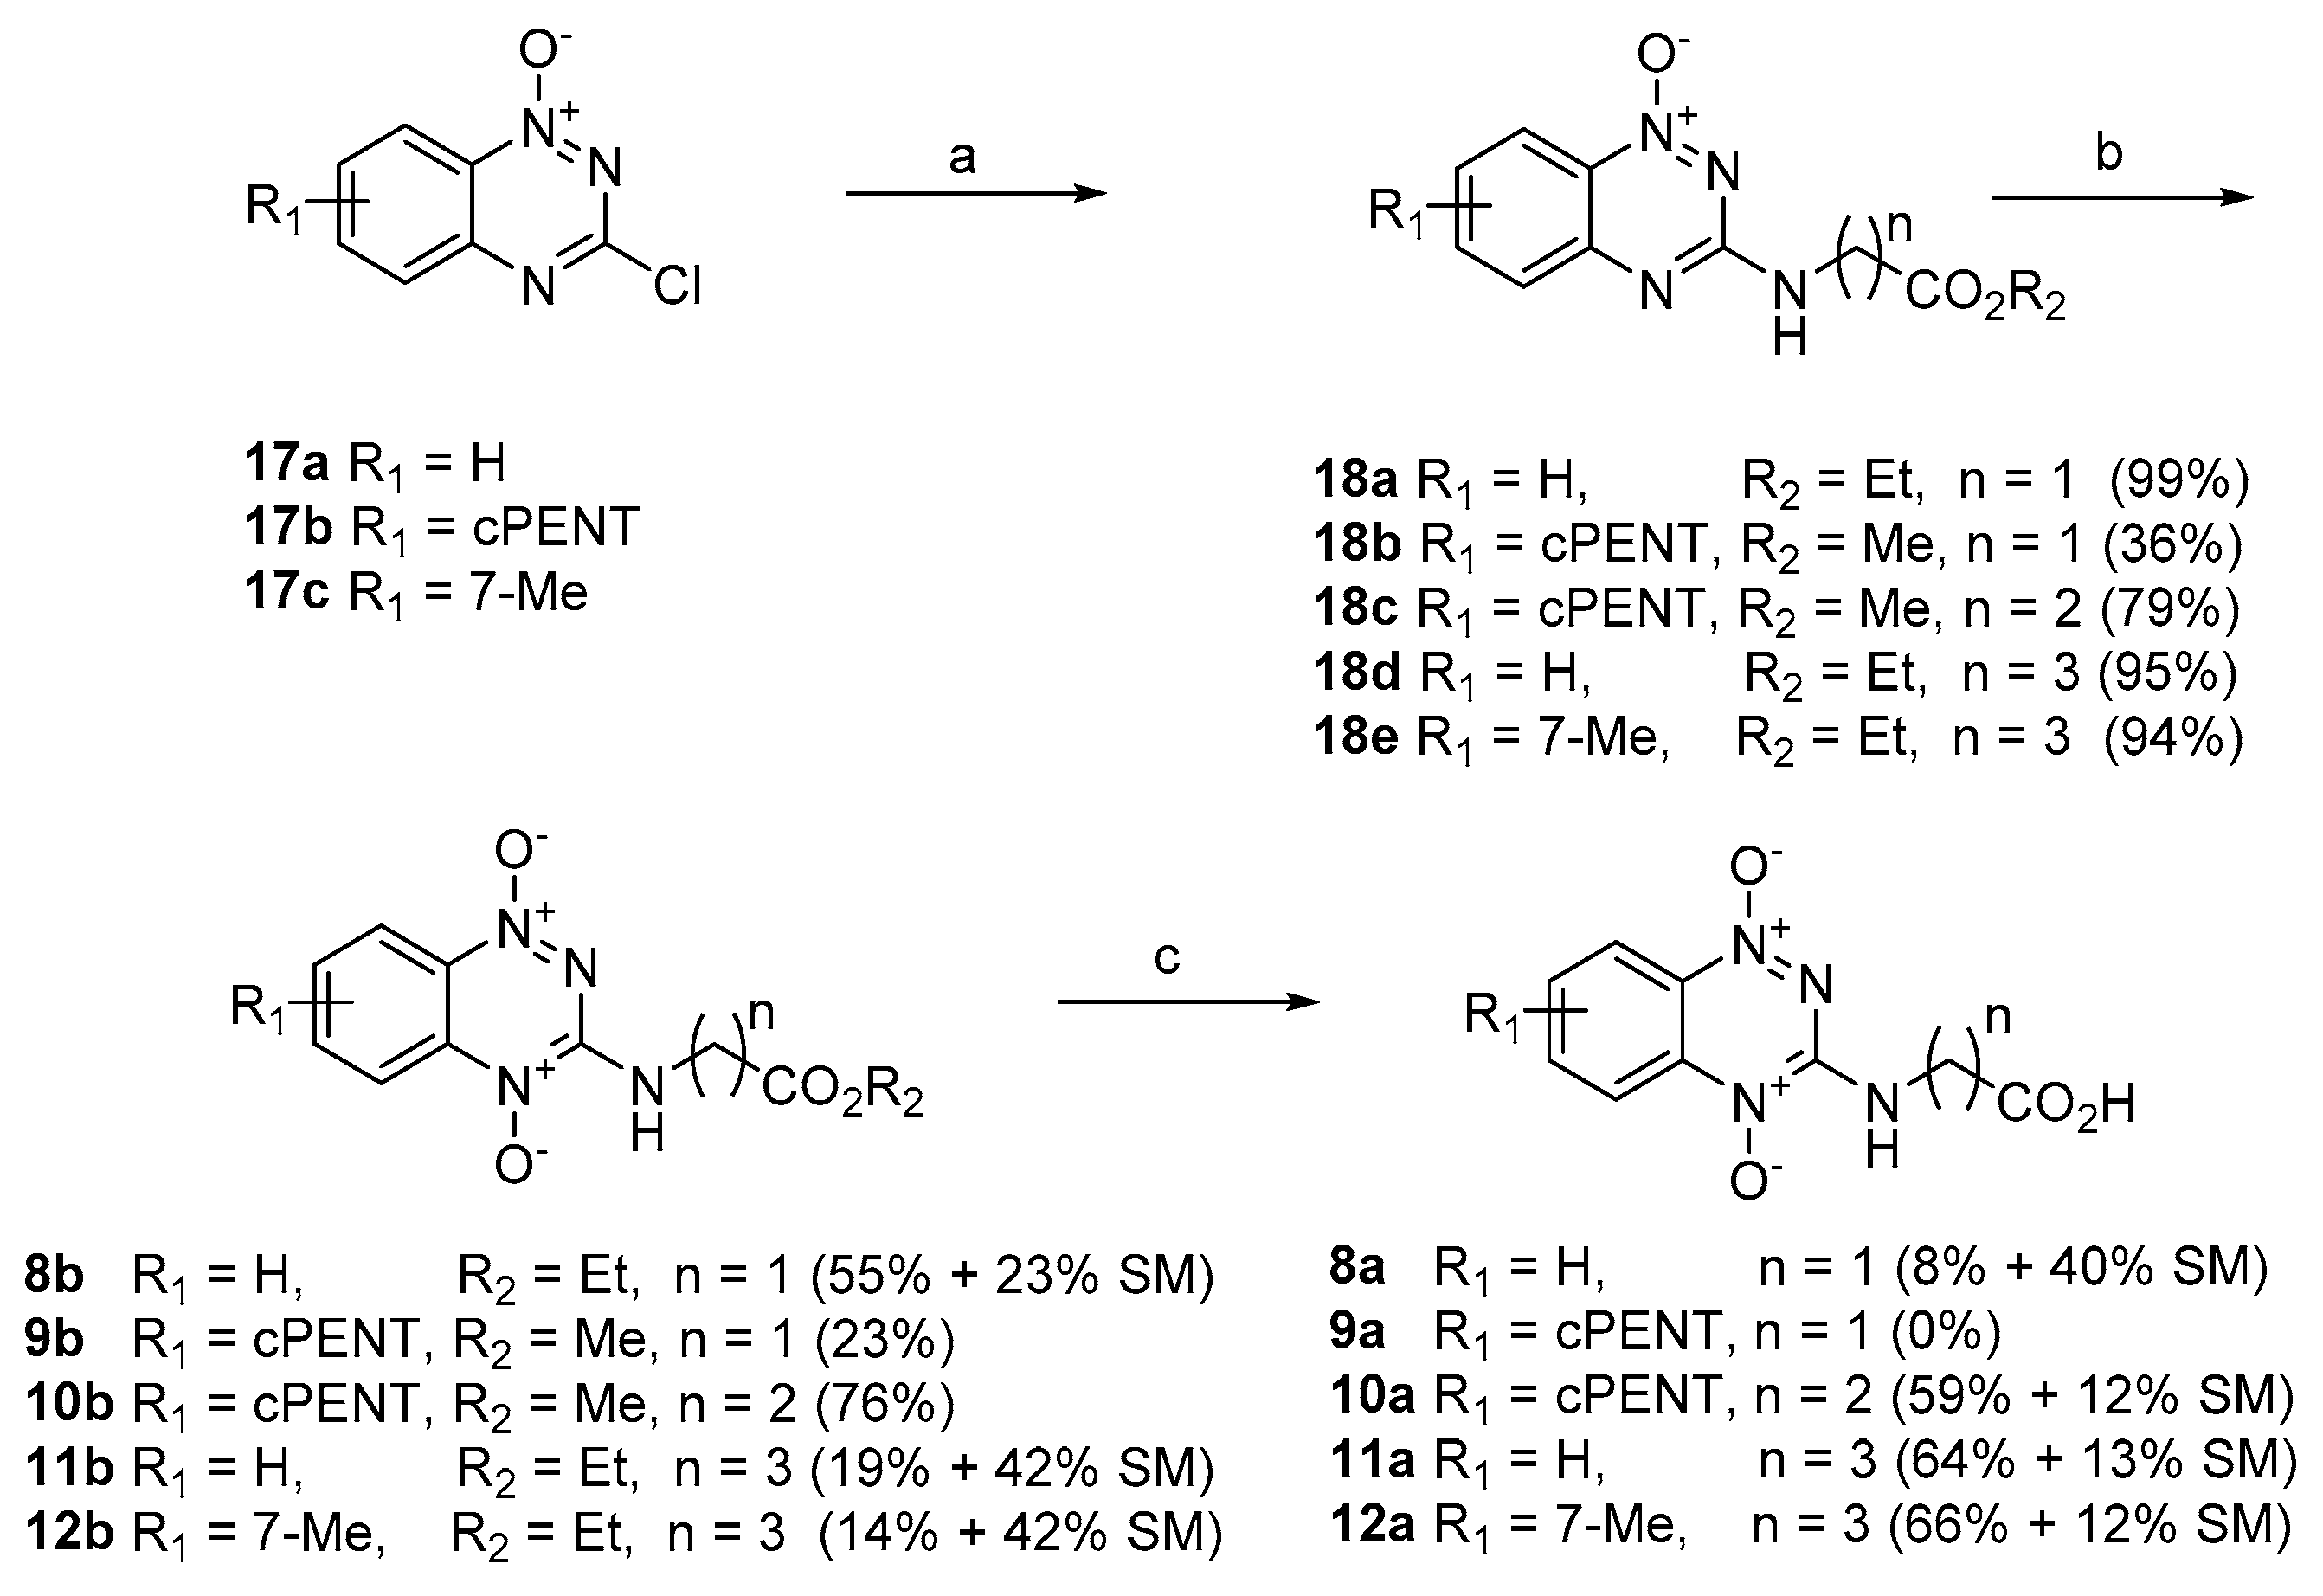
Ethyl [(1-Oxido-1,2,4-benzotriazin-3-yl)amino]acetate (18a). A mixture of 3-chloro-1,2,4-benzotriazine 1-oxide (17a)[78] ( 2.02 g, 11.1 mmol), glycine ethyl ester hydrochloride (2.33 g, 16.7 mmol), and Et3N (4.2 mL, 30 mmol) in DME (100 mL) was heated at reflux temperature for 6 h. The solvent was evaporated and the residue was partitioned between DCM/water (200 mL), then the aqueous fraction extracted with DCM (2 × 50 mL), then the combined organic fraction was dried and the solvent was evaporated. The residue was purified by chromatography, eluting with 10% EtOAc/DCM, to give the ester 18a (2.75 g, 99%) as a yellow solid: mp (EtOAc/DCM) 136–138 °C; 1H NMR δ 8.27 (dd, J = 8.6, 1.0 Hz, 1 H, H 8), 7.72 (ddd, J = 8.5, 7.0, 1.4 Hz, 1 H, H 6), 7.62 (dd, J = 8.5, 1.0 Hz, 1 H, H 5), 7.34 (ddd, J = 8.6, 7.0, 1.0 Hz, 1 H, H 7), 5.87 (br s, 1 H, NH), 4.30 (d, J = 5.7 Hz, 2 H, CH2N), 4.26 (q, J = 7.2 Hz, 2 H, CH2O), 1.31 (t, J = 7.2 Hz, 3 H, CH3); 13C NMR δ 169.9, 158.4, 148.5, 135.6, 131.2, 126.7, 125.5, 120.4, 61.6, 43.2, 14.2; MS m/z 249.2 (MH+, 100%). Anal. calcd for C11H12N4O3: C, 53.2; H, 4.9; N, 22.6. Found: C, 53.4; H, 5.0; N, 22.6%.
3-((2-methoxy-2-oxoethyl)amino)-7,8-dihydro-6H-indeno[5,6-e][1,2,4]triazine 1-oxide (18b). Similarly, the reaction of 3-chloride 17b (0.84 g, 3.79 mmol), glycine methyl ester hydrochloride (0.95 g, 7.59 mmol) and iPr2NEt (2.5 mL, 15.19 mmol) in DME (100 mL) gave ester 18b (0.38 g, 36%) as a yellow powder: mp (MeOH) 182–184 °C; 1H NMR δ 8.10 (s, 1 H, H-9), 7.43 (s, 1 H, H-5), 5.65 (t, J = 5.1 Hz, 1 H, NH), 4.29 (d, J = 5.6 Hz, 2 H, CH2CO), 3.80 (s, 3 H, OCH3), 2.94–3.05 (m, 4 H, H-6, H-8), 2.15 (t, J = 7.4 Hz, 2 H, H-7), 2.15 (pent, J = 7.4 Hz, 2 H, H-7); MS m/z 275.2 (MH+, 100%). Anal. calcd for C13H14N4O3·0.2 CH3OH: C, 56.48; H, 5.31; N, 19.96. Found: C, 56.24; H, 5.03; N, 20.20%.
3-((3-Methoxy-3-oxopropyl)amino)-7,8-dihydro-6H-indeno[5,6-e][1,2,4]triazine 1-Oxide (18c). Similarly the reaction of 3-chloro-7,8-dihydro-6H-indeno[5,6-e][1,2,4]triazine 1-oxide (17b) [79] (1.02 g, 4.60 mmol), β-alanine methyl ester (1.28 g, 9.20 mmol) and iPr2NEt (3.80 mL, 23.0 mmol) in DME (100 mL) gave the ester 18c (1.46 g, 79%) as a yellow solid: mp (EtOAc/DCM) 160–161 °C; 1H NMR δ 8.08 (s, 1 H, H-9), 7.41 (s, 1 H, H-5), 5.56 (t, J = 6.1 Hz, 1 H, NH), 3.81 (dt, J = 6.3, 6.1 Hz, 2 H, CH2N), 3.71 (s, 3 H, OCH3), 2.98–3.06 (m, 4 H, H-6, H-8), 2.71 (t, J = 6.1 Hz, 2 H, CH2O), 2.15 (pent, J = 7.4 Hz, 2 H, H-7); MS m/z 298.2 (MH+, 100%). Anal. calcd for C14H16N4O3: C, 58.32; H, 5.59; N, 19.43. Found: C, 58.41; H, 5.51; N, 19.39%.
3-((4-Ethoxy-4-oxobutyl)amino)benzo[e][1,2,4]triazine 1-Oxide (18d). Similarly, the reaction of chloride 17a (1.26 g, 6.94 mmol), ethyl 4-aminobutanoate hydrochloride (1.51 g, 9.00 mmol) and Et3N (2.90 mL, 20.8 mmol) in DME (100 mL) gave ester 18d (1.83 g, 95%) as a yellow powder: mp (EtOAc/pet. ether) 130–131 °C; 1H NMR δ 8.26 (dd, J = 8.7, 1.4 Hz, 1 H, H-8), 7.70 (ddd, J = 8.7, 6.9, 1.4 Hz, 1 H, H-7), 7.60 (br d, J = 8.4 Hz, 1 H, H-5), 7.29 (ddd, J = 8.4, 6.9, 1.4 Hz, 1 H, H-6), 5.42 (br s, 1 H, NH), 4.15 (q, J = 7.1 Hz, 2 H, CH2O), 3.58 (dd, J = 6.8, 6.2 Hz, 2 H, CH2N), 2.44 (t, J = 7.2 Hz, 2 H, CH2), 2.02 (pent, J = 7.0 Hz, 2 H, CH2), 1.26 (t, J = 7.1 Hz, 3 H, CH3); MS m/z 277.1 (MH+, 100%). Anal. calcd for C13H16N4O3: C, 56.51, H, 5.84; N, 20.28. Found: C, 56.78; H, 5.89; N, 20.47%.
3-((4-Ethoxy-4-oxobutyl)amino)-7-methylbenzo[e][1,2,4]triazine 1-Oxide (18e). Similarly, the reaction of 3-chloro-7-methylbenzo[e][1,2,4]triazine 1-oxide (17b) [78] (2.65 g, 13.5 mmol), ethyl 4-aminobutanoate hydrochloride (3.41 g, 20.3 mmol) and Et3N (5.64 mL, 40.5 mmol) gave ester 18e (3.68 g, 94%) as a yellow powder: mp (EtOAc) 158–159 °C; 1H NMR δ 8.06 (br s, 1 H, H-8), 7.54 (dd, J = 8.7, 1.8 Hz, 1 H, H-6), 7.50 (d, J = 8.7 Hz, 1 H, H-5), 5.34 (br s, 1 H, NH), 4.15 (q, J = 7.1 Hz, 2 H, CH2O), 3.57 (dd, J = 6.8, 6.2 Hz, 2 H, CH2N), 2.46 (s, 3 H, 7-CH3), 2.44 (t, J = 7.2 Hz, 2 H, CH2), 2.02 (pent, J = 7.0 Hz, 2 H, CH2), 1.24 (t, J = 7.1 Hz, 3 H, CH3); MS m/z 290.1 (MH+, 100%). Anal. calcd for C14H18N4O3: C, 57.92, H, 6.25; N, 19.30. Found: C, 57.75; H, 6.34; N, 19.38%.

4.2.7. Oxidation of BTO-3-aminoalkanoic Esters (18a18e)

Ethyl [(1,4-Dioxido-1,2,4-benzotriazin-3-yl)amino]acetate (8b). H2O2 (30%, 10.9 mL, 106 mmol) was added dropwise to a stirred solution of TFAA (16.2 mL, 117 mmol) in DCM (50 mL) at 0–5 °C and the mixture was stirred at 20 °C for 1 h. The mixture was added dropwise to a stirred solution of ester 18a (2.63 g, 10.6 mmol) in DCM (50 mL) at 0 °C and the mixture was stirred at 20 °C for 5 days. The mixture was cooled to 0 °C and DMSO (7.5 mL, 106 mmol) was added. The mixture was carefully neutralized with a concentrated NH3 solution (ca. 15 mL) and the mixture was washed with water (3 × 30 mL), dried and the solvent was evaporated. The residue was purified by chromatography, eluting with a gradient (0–10%) of MeOH/EtOAc, to give (i) starting material 18a (593 mg, 23%), spectroscopically identical with the sample above; and (ii) di-oxide 8b (1.535 g, 55%) as a red powder: mp (EtOAc/pet. ether) 156–158 °C; 1H NMR δ 8.34 (d, J = 8.7 Hz, 2 H, H 5, H 8), 7.91 (br s, 1 H, NH), 7.50–7.61 (m, 2 H, H 6, H 7), 4.37 (br s, 2 H, CH2), 4.26 (q, J = 7.1 Hz, 2 H, CH2), 1.30 (t, J = 7.1 Hz, 3 H, CH3); 13C NMR δ 168.5, 149.7, 138.4, 136.0, 131.0, 129.6, 121.7, 117.6, 61.9, 42.8, 14.1; MS (EI+) m/z 264 (M+, 30%), 284 (40), 175 (100); HRMS (EI+) calc. for C11H12N4O4 (M+) m/z 264.0859, found 264.0852. Anal. calcd for C11H12N4O4: C, 50.0; H, 4.6; N, 21.2. Found: C, 50.8; H, 4.5; N, 21.1%.
3-((2-Methoxy-2-oxoethyl)amino)-7,8-dihydro-6H-indeno[5,6-e][1,2,4]triazine 1,4-dioxide (9b). Similarly, the reaction of H2O2 (30%, 1.4 mL, 14.1 mmol) and TFAA (1.8 mL, 12.8 mmol) with ester 18b (350 mg, 1.28 mmol) gave di-oxide 9b (86 mg, 23%) as a red powder: mp (MeOH/EtOAc) 171–178 °C; 1H NMR δ 8.14 (s, 1 H, H-9), 8.13 (s, 1 H, H-5), 7.40 (br s, 1 H, NH), 4.36 (d, J = 5.9 Hz, 2 H, CH2N), 3.80 (s, 3 H, OCH3), 3.13 (t, J = 7.2 Hz, 2 H, H-8), 3.07 (dt, J = 7.4, 1.0 Hz, 2 H, H-6), 2.12 (p, J = 7.5 Hz, 2 H, H-7); 13C NMR δ 169.3, 156.1, 149.3, 146.9, 138.2, 130.6, 116.0, 112.0, 52.9, 43.0, 33.7, 32.6, 25.8; MS m/z 291.2 (MH+, 100%). Anal. calcd for C13H14N4O4: C, 53.79; H, 4.86; N, 19.30. Found: C, 53.84; H, 4.79; N, 19.41%. HPLC purity 96.4%.
3-((3-Methoxy-3-oxopropyl)amino)-7,8-dihydro-6H-indeno[5,6-e][1,2,4]triazine 1,4-Dioxide (10b). Similarly, the reaction of H2O2 (30%, 1.25 mL, 10.0 mmol) and TFAA (1.26 mL, 9.1 mmol) with ester 18c (249 mg, 0.91 mmol) gave di-oxide 10b (200 mg, 76%) as a yellow powder: mp (EtOAc/pet. ether) 170–171 °C; 1H NMR δ 8.31 (s, 1 H, H-9), 8.25 (s, 1 H, H-5), 3.71 (s, 3 H, OCH3), 3.48 (t, J = 7.3 Hz, 2 H, CH2), 3.12–3.20 (m, 4 H, H-6, H-8), 2.97 (t, J = 7.2 Hz, 2 H, CH2CO), 2.26 (p, J = 7.5 Hz, 2 H, H-7); 13C NMR δ 172.6, 155.4, 153.2, 151.0, 139.2, 134.1, 116.1, 114.0, 52.2, 33.6, 33.1, 28.9, 25.8, 25.7; MS m/z 290.3 (MH+, 100%). Anal. calcd for C14H15N3O4: C, 58.13; H, 5.23; N, 14.53. Found: C, 57.91; H, 5.20; N, 14.44%. HPLC purity 99.3%.
3-((4-Ethoxy-4-oxobutyl)amino)benzo[e][1,2,4]triazine 1,4-Dioxide (11b). Similarly, the reaction of H2O2 (30%, 6.6 mL, 64.4 mmol) and TFAA (9.6 mL, 70.9 mmol) in DCM (40 mL) with ester 18d (1.78 g, 6.44 mmol) gave starting ester 18d (751 mg, 42%), spectroscopically identical to above, and di-oxide 11b (355 mg, 19%) as a red powder: mp (EtOAc) 163–165 °C; 1H NMR δ 8.34 (dd, J = 8.7, 0.8 Hz, 1 H, H-8), 8.30 (dd, J = 8.7, 1.3 Hz, 1 H, H-5), 7.88 (ddd, J = 8.7, 7.0, 1.3 Hz, 1 H, H-7), 7.52 (ddd, J = 8.7, 7.0, 1.0 Hz, 1 H, H-6), 7.30 (br s, 1 H, NH), 4.16 (q, J = 7.1 Hz, 2 H, CH2O), 3.67 (dd, J = 6.8, 6.6 Hz, 2 H, CH2N), 2.46 (t, J = 7.2 Hz, 2 H, CH2), 2.08 (pent, J = 7.1 Hz, 2 H, CH2), 1.26 (t, J = 7.1 Hz, 3 H, CH3); 13C NMR [(CD3)2SO] δ 172.9, 150.0, 138.4, 136.0, 130.7, 127.4, 121.8, 117.5, 60.8, 41.0, 31.5, 24.7, 14.3; MS m/z 293.2 (MH+, 100%). Anal. calcd for C13H16N4O4: C, 53.42; H, 5.52; N, 19.17. Found: C, 53.41; H, 5.49; N, 19.40%. HPLC purity 99.9%.
3-((4-Ethoxy-4-oxobutyl)amino)-7-methylbenzo[e][1,2,4]triazine 1,4-Dioxide (12b). Similarly, the reaction of H2O2 (30%, 5.0 mL, 48.2 mmol) and TFAA (7.4 mL, 53.0 mmol) with ester 18e (1.40 g, 4.82 mmol) gave starting ester 18b (586 mg, 42%), spectroscopically identical to above, and di-oxide 12b (202 mg, 14%) as a red powder: mp (EtOAc) 191–192 °C; 1H NMR δ 8.19 (d, J = 8.9 Hz, 1 H, H-5), 8.13 (br s, 1 H, H-8), 7.70 (dd, J = 8.9, 1.6 Hz, 1 H, H-6), 7.13 (br s, 1 H, NH), 4.16 (q, J = 7.1 Hz, 2 H, CH2O), 3.65 (dd, J = 7.0, 5.7 Hz, 2 H, CH2N), 2.53 (s, 3 H, 7-CH3), 2.45 (t, J = 7.2 Hz, 2 H, CH2), 2.06 (pent, J = 7.0 Hz, 2 H, CH2), 1.26 (t, J = 7.1 Hz, 3 H, CH3); 13C NMR [(CD3)2SO] δ 173.0, 149.7, 138.6, 138.3, 137.0, 130.6, 120.4, 117.3, 60.9, 41.0, 31.6, 24.7, 21.6, 14.4; MS m/z 307.2 (MH+, 100%). Anal. calcd for C14H18N4O4: C, 54.89; H, 5.92; N, 18.29. Found: C, 55.03; H, 5.77; N, 18.50%. HPLC purity 99.9%.

4.2.8. Hydrolysis of Esters (8b12b)

3-((Carboxymethyl)amino)benzo[e][1,2,4]triazine 1,4-dioxide (8a). A solution of HCl in dioxane (4 M, 69 mL, 277 mmol) was added dropwise to a stirred suspension of ester 8b (1.44 g, 5.55 mmol) in dioxane (40 mL) and water (5 drops), and the mixture was stirred at 20 °C for 6 d. The mixture was diluted with water (50 mL) and extracted with CHCl3 (3 × 60 mL), then the combined organic fraction was dried and the solvent was evaporated. The residue was purified by chromatography, eluting with a gradient (0–5%) of MeOH/DCM, to give (i) starting ester 8b (570 mg, 40%), spectroscopically identical to above; and (ii) acid 8a (99 mg, 8%) as a red powder, mp (H2O) 190–191 °C; 1H NMR [(CD3)2SO] δ 8.45 (br s, 1 H, NH), 8.23 (d, J = 8.7 Hz, 1 H, H 8), 8.19 (d, J = 8.5 Hz, 1 H, H 5), 7.99 (ddd, J = 8.5, 7.0, 1.3 Hz, 1 H, H 6), 7.63 (ddd, J = 8.7, 7.0, 1.3 Hz, 1 H, H 7), 4.09 (d, J = 5.4 Hz, 2 H, CH2), OH not observed; 13C NMR [(CD3)2SO] δ 170.5, 149.8, 138.2, 135.8, 130.3, 127.6, 121.1, 117.0, 42.3. Anal calcd for C9H8N4O¼H2O; C, 44.9; H, 3.6; N, 23.3. Found: C, 44.5; H, 3.4; H, 23.4%. HPLC purity 98.4%.
3-((3-Carboxypropyl)amino)benzo[e][1,2,4]triazine 1,4-Dioxide (10a). Similarly, the reaction of HCl in dioxane (4 M, 13 mL, 52 mmol) with ester 10b (298 mg, 1.02 mmol) in dioxane (10 mL) and water (0.5 mL) gave starting ester 10b (36 mg, 12%), spectroscopically identical to above, and acid 10a (158 mg, 59%) as an orange powder: mp (EtOAc) 190–193 °C; 1H NMR [(CD3)2SO] δ 12.06 (br s, 1 H, CO2H), 8.35 (t, J = 6.2 Hz, 1 H, NH), 8.19 (dd, J = 8.7, 0.7 Hz, 1 H, H-8), 8.12 (dd, J = 8.7, 0.7 Hz, 1 H, H-5), 7.92 (ddd, J = 8.7, 6.9, 1.2 Hz, 1 H, H-7), 7.55 (ddd, J = 8.7, 6.9, 1.2 Hz, 1 H, H-6), 3.43 (q, J = 6.4 Hz, 2 H, CH2N), 2.30 (t, J = 7.4 Hz, 2 H, CH2), 1.84 (pent, J = 7.1 Hz, 2 H, CH2); 13C NMR [(CD3)2SO] δ 174.2, 149.8, 138.2, 135.4, 129.9, 126.9, 121.1, 116.9, 40.1, 31.0, 24.1; MS m/z 265.2 (MH+, 100%). Anal. calcd for C11H12N4O4: C, 50.00; H, 4.58; N, 21.20. Found: C, 50.31; H, 4.54; N, 20.82%. HPLC purity 98.6%.
3-((2-Carboxyethyl)amino)-7,8-dihydro-6H-indeno[5,6-e][1,2,4]triazine 1,4-Dioxide (11a). Similarly the reaction of HCl in dioxane (4 M, 4.32 mL, 17.3 mmol) with ester 11b (100 mg, 0.34 mmol) gave starting ester 11b (13 mg, 13%), spectroscopically identical to above, and acid 11a (60 mg, 64%) as a yellow powder: mp (EtOAc) 159 °C (dec.); 1H NMR δ 12.34 (br s, 1 H, CO2H), 8.18 (s, 1 H, H-9), 8.17 (s, 1 H, H-5), 3.22 (t, J = 7.2 Hz, 2 H, CH2), 3.07–3.16 (m, 4 H, H-6, H-8), 2.76 (t, J = 7.2 Hz, 2 H, CH2CO), 2.13 (p, J = 7.5 Hz, 2 H, H-7); 13C NMR δ 173.2, 154.6, 152.7, 150.2, 138.7, 133.5, 115.2, 113.1, 32.8, 32.3, 28.5, 25.2 (2); MS m/z 276.3 (MH+, 100%). Anal. calcd for C13H13N3O4: C, 56.72; H, 4.76; N, 15.27. Found: C, 57.00; H, 4.73; N, 15.08%. HPLC purity 99.7%.
3-((3-Carboxypropyl)amino)-7-methylbenzo[e][1,2,4]triazine 1,4-Dioxide (12a). Similarly, the reaction of HCl in dioxane (4 M, 3.5 mL, 13.8 mmol) with ester 12b (85 mg, 0.27 mmol) gave starting ester 12b (36 mg, 12%), spectroscopically identical to above, and acid 12a (50 mg, 66%) as a red powder: mp (MeOH/H2O) 185–188 °C; 1H NMR [(CD3)2SO] δ 12.06 (br s, 1 H, CO2H), 8.26 (t, J = 6.1 Hz, 1 H, NH), 8.04 (d, J = 8.9 Hz, 1 H, H-5), 8.01 (br s, 1 H, H-8), 7.77 (dd, J = 8.9, 1.5 Hz, 1 H, H-6), 3.40 (q, J = 6.7 Hz, 2 H, CH2N), 2.47 (s, 3 H, 7-CH3), 2.30 (t, J = 7.4 Hz, 2 H, CH2), 1.85 (pent, J = 7.1 Hz, 2 H, CH2); 13C NMR [(CD3)2SO] δ 174.3, 149.5, 137.5, 137.4, 136.8, 129.7, 119.5, 116.8, 40.2, 31.1, 24.1, 20.8; MS m/z 278.2 (MH+, 100%). Anal. calcd for C12H14N4O4·¼H2O: C, 50.97; H, 5.17; N, 19.81. Found: C, 50.73; H, 5.04; N, 19.59%. HPLC purity 98.5%.

4.3. Measurement of pKa of 7a

The pKa of 7a was determined by Sirius Analytical (Forest Row, UK) by potentiometric triple titration from pH 12.0 to 2.0, using three solutions in 0.15 M of KCl at concentrations of 1.2–0.9 mM. No precipitation of the sample from solution was observed and one pKa with an average value of 4.16 ± 0.01 was determined.

4.4. Measurement of One-Electron Reduction Potentials, E0′

Time-resolved optical absorption and kinetic studies were carried out using the University of Auckland’s 4 MeV linear accelerator, which has been previously described [80]. The one-electron reduction potentials of the compounds (A) and couple E0′(A/A), versus normal hydrogen electrode, were determined at pH 7.0 (2.5 mM phosphate) by establishing redox equilibria within 50 μs between three mixtures of one-electron reduced A and the viologen reference compounds, MV2+, TQ2+ and V212+. The determined equilibrium constants were used to calculate the ΔE values using the Nernst equation, correcting for ionic strength effects, as described in the literature [81].

4.5. EPR Characterization of the 7a-Derived Radical Intermediates

The radical intermediates formed following the reduction of 7a by N-terminally truncated (soluble) POR [24] under anoxia were spin-trapped and identified using a JOEL (JES-FA-200) EPR spectrophotometer. The solution preparation procedure and spectrophotometer settings have been previously described [82]. Computer simulation of the obtained composite spectrum was carried out using the WINSIM EPR program, available in the public domain of the NIEHS EPR database.

4.6. Calculation of pH Dependence of logP and Cellular Uptake (Ci/Ce Ratios)

Octan-1-ol/water partition coefficients for the neutral and charged forms of the BTO acids (Pn and Pc respectively) were calculated in ChemDraw (v17.1.0 PerkinElmer Informatics Inc., Cambridge, MA, USA). The mole fraction of the neutral and charged species (fn and fc) were determined using the Henderson-Hasselbalch equation. LogD values were calculated at each pH using:
l o g D = l o g ( f n P n + f c P c )
Ci/Ce values for pH-dependent partitioning were calculated using Equation (2) for weak acids and Equation (3) for the weak base SN30000 [12]:
C i C e = ( 10 p H i + 10 p K a 10 p H e + 10 p K a ) × 10 ( p H i p H e )
C i C e = ( 10 p H i + 10 p K a 10 p H e + 10 p K a )

4.7. Cell Lines

The SiHa and FaDu cell lines were from ATCC and were authenticated in-house by short tandem repeat profiling. Cultures were maintained in αMEM (ThermoFisher) with 5% FBS (Moregate Biotech, Hamilton, NZ) and passaged for up to 3 months without antibiotics. The SiHa/POR line, reported previously [83], was maintained in the same medium with 1 μM puromycin. UT-SCC-54C was sourced, characterized, and maintained in culture as reported [84]. All lines were confirmed to be mycoplasma free using PlasmoTest™ (InvivoGen).

4.8. Titration of Media and Measurement of Extracellular pH (pHe)

The pH of the cell culture medium was determined using an Orion A211 pH meter with a Thermo 3 mm diameter pH microprobe (Fisher Scientific) under an atmosphere of 5% CO2 at 37 °C. The pH of αMEM containing 10% FBS was titrated to pH 6.5 with concentrated HCl while stirring magnetically at 37 °C under flowing humidified 5% CO2. The HCl was added in small aliquots over approximately 6 h to allow HCO3/CO2 re-equilibration whilst maintaining a pH above 6.0 throughout.

4.9. Determination of Intracellular pH (pHi)

For the measurement of pHi under oxia (20% O2), cells were seeded at 2 × 10⁵/well in 0.2 mL αMEM + 10% FBS per well in 96-well plates. After incubation at 37 °C for 18 h in a humidified 5% CO2/20% O2 incubator, the monolayers were washed with a fresh medium to restore the pHe to 7.4, after which they were incubated for a further 60 min and washed with serum-free Hank’s balanced salt solution (HBSS; ThermoFisher 14065) containing 5.6 mM glucose that had been titrated to pH 7.4 or 6.5, as in Section 4.8. The cells were washed with HBSS at pH 7.4 or 6.5, then loaded with BCECF AM (2 μM; Molecular Probes, Invitrogen B1150) in the same buffers for 30 min. To ensure the control of temperature and pHe during this loading step, the plates were incubated on an Eppendorf Thermomixer, with flowing humidified 5% CO2/air under a loose-fitting lid. After the 30 min loading period, fluorescence (excitation of 440 and 490 nm, emission of 535 nm) in this plate (plate A) was immediately measured with an Enspire multimode plate reader (Perkin Elmer). The extracellular medium was then transferred to a second plate (plate B), where fresh HBSS at the same pH was added to plate A and the fluorescence in both plates was determined with the Enspire platereader. The difference in the pH-independent fluorescence intensity at 440 nm between plate A (post-wash) and plate B indicated that typically ~80% of the BCECF in plate A was intracellular pre-wash, but only the post-wash measurements for plate A were used in order to minimize any contribution of extracellular BCECF (incubation for >40 min post-loading resulted in the progressive loss of intracellular BCECF, especially at pHe 6.5, so only the initial timepoint was used for calculation of pHi).
Calibration was achieved by loading with BCECF AM in HBSS at pHe 7.4 as above, in separate plates, washed twice with HBSS then solutions of digitonin (Serva) in PBS, where titrations to pH 6.0, 6.5, 7.0, 7.5, or 8.0 were added at 0.2 mL/well. The fluorescence was measured as above, then the pH in each well was measured with the pH microprobe and the fluorescence ratio (490/440) versus the pH fitted by linear regression.
For the measurement of pHi under hypoxia (0.2% O2), plates were transferred to a hypoxystation (Model H45, Don Whitley Scientific) with a humidified gas phase of 0.2% O2/5% CO2/balance N2 at 37 °C. Twenty-four hours later, cells were loaded with BCEFC AM for 30 min and the pHi was determined as above, with the measurement of fluorescence immediately after removing the plates from the hypoxystation.
For the measurement of pHi under anoxia (<0.01% O2), cells were pelleted by centrifugation, transferred to a Pd/C anaerobic chamber (5% CO2, 5% H2, 90% H2; Shellab, Sheldon Manufacturing Inc. Cornelius, OR), resuspended in αMEM + 10% FBS, and plated as above, using medium and 96-well plates equilibrated in the chamber for 3 days prior to use to remove residual O2. The cells were loaded with BCECF AM as above, with the probe added 4 h after plating (equivalent to the midpoint of the drug exposures in the IC50 assays of Section 4.10).

4.10. IC50 Assays

Cells in log-phase growth were trypsinized, collected by centrifugation, and then resuspended in AlphaMEM with 10% FBS, additional glucose (final concentration 15.6 mM), 2′deoxycytidine (20 μM), penicillin, and streptomycin (“IC50 medium”) that had been titrated to pH 7.4 or 6.5, as above. Cells were seeded in 96-well plates (SiHa or FaDu 1500 cells/well, UT-SCC-74B 800 cells/well) in 100 μL. After incubation for 2 h, the drugs were added in 50 μL of the same titrated medium at 3× the final concentration to duplicate the wells. After a further 4 h the plates were checked for drug precipitation using a phase contrast microscope, then drugs were removed by aspirating and washing with the standard (pH 7.4) medium, then aspirating again and adding 150 μL of the medium. Cultures were then grown for 5 days before staining with sulphorhodamine B and measuring absorbance, with the estimation of IC50 values using 4-parameter logistic regression, as previously carried out [85].
For drug exposures under anoxia (<0.01% O2 gas phase), the pellets were transferred to a Pd/C anaerobic chamber as above, resuspended in IC50 medium, and exposed as above with all steps until the end of drug treatment performed in the chamber, following which the cells were regrown under 20% O2. The medium and plasticware was equilibrated in the chamber for 3 days prior to use. In the anoxia experiments, FaDu cells were plated in poly-L-lysine coated plates (Corning Cat # 356461) to improve attachment.
For drug exposures under chronic hypoxia (0.2% O2 in the Whitley hypoxystation), the following modifications to the above methods were made: Cells were seeded in the hypoxia chamber at 1125 (SiHa) or 600 (UT-SCC-74B) cells/well in the IC50 medium 24 h before drug exposure. To minimize problems with poor cell attachment under chronic hypoxia, the drugs were added from a 3-fold dilution series made in a separate plate, rather than by serial dilution in the plates containing the cells. In addition, the drugs were removed after the 4 h exposure by centrifuging the plates (200g × 5 min) prior to each aspiration. The same modifications were used for the oxic drug exposures in these experiments.

4.11. Drug Metabolism and Cellular Uptake

4.11.1. Cellular Uptake and Metabolism in Single Cell Suspensions

Log-phase cultures were dissociated with trypsin/EDTA, followed by the addition of the medium with DNAase I (Sigma DN-25) at 100 μg/mL for 5 min at 37 °C to minimize clumping. The cell pellets were collected by centrifugation and resuspended in αMEM with 5% FBS at pH 7.4 or 6.5 to 2 × 10⁶ cells/mL. Samples (12 mL) were equilibrated with magnetic stirring at 37 °C under flowing humidified 5% CO2/air or N2 (50–100 mL/min), as previously described [86]. After equilibration for 60 min, the compounds were added in 50 μL of DMSO. The samples (5 mL) were withdrawn 5 and 60 min later, where the cell pellets were then collected by centrifugation and 4 mL of the supernatant was discarded. The pellets were resuspended in the remaining 1 mL, transferred to microcentrifuge tubes containing 7 μL 3H-mannitol (740 GBq/mmol, American Radiolabeled Chemicals Inc., St. Louis, MO) as an extracellular marker, and then centrifuged (11,000g × 30s). The supernatant was removed and frozen at −80 °C (extracellular samples) and the tubes were centrifuged again, and any remaining medium was carefully removed. Ice-cold MeOH (80 μL) was added to the pellets which were disrupted by pipetting and stored at −80 °C (intracellular samples). When these were thawed for HPLC analysis (Section 4.12), the volume of extracellular water trapped in the pellets was determined by the scintillation counting (PerkinElmer Tri-Carb B2910TR Liquid Scintillation) of 25 μL of each extracellular and intracellular sample in 3 mL of Emulsifier-Safe™ scintillation cocktail (PerkinElmer). The extracellular volume in each intracellular sample was used to correct the intracellular drug concentration as previously described [87].

4.11.2. Cellular Metabolism by Anoxic Monolayers in 96-Well Plates

The log-phase cells were trypsinized and the pellets were transferred to the anaerobic chamber and resuspended in equilibrated αMEM + 5% FBS at pH 7.4 and plated (105 cells in 100 μL/well for experiments with WST1, otherwise 2 × 10⁵ cells/well). After incubation at 37 °C for 2 h, 20 μL was replaced with the anoxic medium containing 5× the final concentrations of test compounds with or without WST-1 (1 mM, Toronto Research Chemicals). A cell-free medium used as a control to check for reduction in the anoxic medium. Cultures were mixed gently, incubated for a further 2 h, then the extracellular medium was removed and 200 μL of ice-cold MeOH was added to the monolayers. The MeOH extract was transferred to the medium sample (thus combining the intracellular and extracellular samples). The pooled samples (combining the intracellular and extracellular samples) were removed from anoxic chamber, then centrifuged (13000g, 30 s) and frozen for subsequent HPLC analysis. Cell-free wells were used for single-point calibration of the parent compounds and 1-oxides in each experiment.

4.11.3. Metabolism by Post-Mitochondrial Supernatants (S9 Preparations)

The S9 fractions were prepared from approximately 5 × 10⁷ log-phase SiHa and SiHa/POR cells, as described previously [88]. The protein concentrations were determined with the bicinchoninic acid assay. The S9 preparations were diluted to 50 μg/mL in 1 mM of NADH, 1 mM of NADPH, 7.1 mM of MgCl2, 1.4 mM of Na2EDTA, and a 67 mM phosphate buffer (pH 7.0) in 96-well plates within the anaerobic chamber. After equilibration at 37 °C for 30 min, 10 μL DMSO solutions of the compounds were added. After incubation for a further 30 min the plates were removed from the chamber and the proteins were precipitated with 200 μL of ice-cold MeOH and then frozen for HPLC analysis.

4.12. HPLC Analysis

The samples were analyzed using an Agilent 1200 HPLC with a diode array absorbance detector and autosampler maintained at 4 °C (Agilent Technologies). The frozen samples were thawed, then centrifuged (11,000g × 5 min), and then extracellular samples were injected directly (typically 20 μL), while for the intracellular samples 30 μL was mixed 1:1 with αMEM and 50 μL was injected. The calibration standards for the parent compounds and 1-oxides were prepared freshly in the culture medium (typically 0.3-100 μM) for each analysis. All calibration curves were linear (R2 > 0.999). The column was an Agilent ZORBAX Eclipse (XDB-C18, 5u, 2.1 × 150 mm, Agilent Technologies) with a flow rate of 0.4 mL/min. For SN30000 (2), the mobile phase was a mixture of 80% MeCN/water v/v (A), and a 45 mM formate buffer at a pH 4.5, eluting with a linear gradient of 5–100% A over 18 min. The same method was used for the BTO acids, except for 4a, where the aqueous mobile phase pH was reduced to 3.5. The analytes were quantified using the following wavelengths: 294 nm for SN30000, with a retention time (Rt) of 8.6 min; 404 nm for SN30000 1-oxide, with a Rt of 9.6 min; 400 nm for 4a, with a Rt of 6.5 min; 360 nm for 15a, with a Rt of 8.8 min; 296 nm for 7a, with a Rt of 10.5 min; and 250 nm for 15d, with a Rt 13.1 min.

Supplementary Materials

The following are available online: Table S1: Cytotoxicity of chlorambucil, SN30000 and 4a against UT-SCC-74B, Figure S1: pKa dependence of selectivity of weak acids for acidosis, Figure S2: pH dependence of absorbance of the radical anion of 7a, Figure S3: Decay kinetics of the radical anion of 7a at pH 7.0, Figure S4: Oxygen dependence of the first-order rate constant for the decay of the radical anion of 7a at pH 7.0, Figure S5: EPR spectrum of one-electron reduced 7a in the presence of DMSO, Figure S6: Growth of SiHa cells after exposure to pHe 6.5 or 7.4 under oxia, hypoxia or anoxia, Figure S7: Protein binding of 7a in mouse plasma and FBS, Figure S8: IC50 of SN30000, 4a and 7a in MDCK-II cells with forced expression of BCRP or Pgp, Figure S9: Effect of phenylpyruvate on cytotoxicity of 4a against SiHa cells.

Author Contributions

Conceptualization, M.P.H., R.F.A., K.O.H. and W.R.W.; Funding acquisition, M.P.H. and W.R.W.; Investigation, H.N.S., W.W.W., W.W.S., A.T.D.V., and P.Y.; Methodology, M.P.H., K.O.H. and W.R.W.; Resources, M.P.H.; Supervision, R.F.A., K.O.H. and W.R.W.; Writing—original draft, W.R.W.; Writing—review and editing, M.P.H., W.W.W., R.F.A., K.O.H. and W.R.W..

Funding

This research was funded by the Health Research Council of New Zealand, grant number 14/538 and the University of Auckland Biopharma Research Initiative.

Acknowledgments

We thank Sisira Kumara for measurement of solubility of compounds in culture medium, Monica Yee, Yarong (Diana) Yin and Susan M. Pullen for assistance with determination of IC50 values, and Jagdish Jaiswal for advice on the equilibrium dialysis measurements.

Conflicts of Interest

The authors declare no conflict of interest. The funders had no role in the design of the study; in the collection, analyses, or interpretation of data; in the writing of the manuscript, or in the decision to publish the results.

References

  1. Wilson, W.R.; Hay, M.P. Targeting hypoxia in cancer therapy. Nat. Rev. Cancer 2011, 11, 393–410. [Google Scholar] [CrossRef] [PubMed]
  2. Vaupel, P.; Mayer, A. Hypoxia in cancer: Significance and impact on clinical outcome. Cancer Metastasis Rev. 2007, 26, 225–239. [Google Scholar] [CrossRef] [PubMed]
  3. Dhani, N.; Fyles, A.; Hedley, D.; Milosevic, M. The clinical significance of hypoxia in human cancers. Semin. Nucl. Med. 2015, 45, 110–121. [Google Scholar] [CrossRef] [PubMed]
  4. Gillies, R.J.; Liu, Z.; Bhujwalla, Z. 31P-MRS measurements of extracellular pH of tumors using 3- aminopropylphosphonate. Am. J. Physiol. 1994, 267, C195–C203. [Google Scholar] [CrossRef] [PubMed]
  5. van Sluis, R.; Bhujwalla, Z.M.; Raghunand, N.; Ballesteros, P.; Alvarez, J.; Cerdan, S.; Galons, J.P.; Gillies, R.J. In vivo imaging of extracellular pH using 1H MRSI. Magnetic Resonance Med. 1999, 41, 743–750. [Google Scholar] [CrossRef]
  6. Stubbs, M.; McSheehy, P.M.; Griffiths, J.R.; Bashford, C.L. Causes and consequences of tumour acidity and implications for treatment. Mol. Med. Today 2000, 6, 15–19. [Google Scholar] [CrossRef]
  7. Schornack, P.A.; Gillies, R.J. Contributions of cell metabolism and H+ diffusion to the acidic pH of tumors. Neoplasia 2003, 5, 135–145. [Google Scholar] [CrossRef]
  8. Corbet, C.; Feron, O. Tumour acidosis: from the passenger to the driver’s seat. Nat. Rev. Cancer 2017, 17, 577. [Google Scholar] [CrossRef]
  9. Estrella, V.; Chen, T.; Lloyd, M.; Wojtkowiak, J.; Cornnell, H.H.; Ibrahim-Hashim, A.; Bailey, K.; Balagurunathan, Y.; Rothberg, J.M.; Sloane, B.F.; et al. Acidity generated by the tumor microenvironment drives local invasion. Cancer Res. 2013, 73, 1524–1535. [Google Scholar] [CrossRef] [PubMed]
  10. Martin, N.K.; Gaffney, E.A.; Gatenby, R.A.; Maini, P.K. Tumour-stromal interactions in acid-mediated invasion: a mathematical model. J. Theor. Biol. 2010, 267, 461–470. [Google Scholar] [CrossRef]
  11. Fang, J.S.; Gillies, R.D.; Gatenby, R.A. Adaptation to hypoxia and acidosis in carcinogenesis and tumor progression. Semin. Cancer Biol. 2008, 18, 330–337. [Google Scholar] [CrossRef] [PubMed] [Green Version]
  12. Denny, W.A.; Wilson, W.R. Considerations for the design of nitrophenyl mustards as agents with selective toxicity for hypoxic tumor cells. J. Med. Chem. 1986, 29, 879–887. [Google Scholar] [CrossRef] [PubMed]
  13. Griffiths, J.R. Are cancer cells acidic? Brit. J. Cancer 1991, 64, 425–427. [Google Scholar] [CrossRef] [PubMed] [Green Version]
  14. Gerweck, L.E.; Kozin, S.V.; Stocks, S.J. The pH partition theory predicts the accumulation and toxicity of doxorubicin in normal and low-pH-adapted cells. Brit. J. Cancer 1999, 79, 838–842. [Google Scholar] [CrossRef] [Green Version]
  15. Gerweck, L.E.; Vijayappa, S.; Kozin, S. Tumor pH controls the in vivo efficacy of weak acid and base chemotherapeutics. Mol. Cancer Ther. 2006, 5, 1275–1279. [Google Scholar] [CrossRef]
  16. Neri, D.; Supuran, C.T. Interfering with pH regulation in tumours as a therapeutic strategy. Nat. Rev. Drug Discov. 2011, 10, 767–777. [Google Scholar] [CrossRef] [Green Version]
  17. Parks, S.K.; Chiche, J.; Pouyssegur, J. Disrupting proton dynamics and energy metabolism for cancer therapy. Nat. Rev. Cancer 2013, 13, 611–623. [Google Scholar] [CrossRef]
  18. Alshememry, A.K.; El-Tokhy, S.S.; Unsworth, L.D. Using properties of tumor microenvironments for controlling local, on-demand delivery from biopolymer-based nanocarriers. Curr. Pharmaceut. Design 2017, 23, 5358–5391. [Google Scholar] [CrossRef]
  19. Shi, J.; Kantoff, P.W.; Wooster, R.; Farokhzad, O.C. Cancer nanomedicine: progress, challenges and opportunities. Nat. Rev. Cancer 2016, 17, 20–37. [Google Scholar] [CrossRef]
  20. Du, J.-Z.; Mao, C.-Q.; Yuan, Y.-Y.; Yang, X.-Z.; Wang, J. Tumor extracellular acidity-activated nanoparticles as drug delivery systems for enhanced cancer therapy. Biotechn. Adv. 2014, 32, 789–803. [Google Scholar] [CrossRef]
  21. Brophy, G.T.; Sladek, N.E. Influence of pH on the cytotoxic activity of chlorambucil. Biochem. Pharmacol. 1983, 32, 79–84. [Google Scholar] [CrossRef]
  22. Kozin, S.V.; Shkarin, P.; Gerweck, L.E. The cell transmembrane pH gradient in tumors enhances cytotoxicity of specific weak acid chemotherapeutics. Cancer Res. 2001, 61, 4740–4743. [Google Scholar] [PubMed]
  23. Wilson, W.R.; Stribbling, S.M.; Pruijn, F.B.; Syddall, S.P.; Patterson, A.V.; Liyanage, H.D.S.; Smith, E.; Botting, K.J.; Tercel, M. Nitro-chloromethylindolines: hypoxia-activated prodrugs of potent adenine N3 DNA minor groove alkylators. Mol. Cancer Ther. 2009, 8, 2903–2913. [Google Scholar] [CrossRef] [PubMed]
  24. Anderson, R.F.; Yadav, P.; Patel, D.; Reynisson, J.; Tipparaju, S.R.; Guise, C.P.; Patterson, A.V.; Denny, W.A.; Maroz, A.; Shinde, S.S.; et al. Characterisation of radicals formed by the triazine 1,4-dioxide hypoxia-activated prodrug SN30000. Org. Biomolec. Chem. 2014, 12, 3386–3392. [Google Scholar] [CrossRef] [PubMed]
  25. von Pawel, J.; von Roemeling, R.; Gatzemeier, U.; Boyer, M.; Elisson, L.O.; Clark, P.; Talbot, D.; Rey, A.; Butler, T.W.; Hirsh, V.; et al. Tirapazamine plus cisplatin versus cisplatin in advanced non-small-cell lung cancer: A report of the international CATAPULT I study group. Cisplatin and tirapazamine in subjects with advanced previously untreated non-small-cell lung tumors. J. Clin. Oncol. 2000, 18, 1351–1359. [Google Scholar] [CrossRef]
  26. Rischin, D.; Peters, L.J.; O’Sullivan, B.; Giralt, J.; Fisher, R.; Yuen, K.; Trotti, A.; Bernier, J.; Bourhis, J.; Ringash, J. Tirapazamine, cisplatin, and radiation versus cisplatin and radiation for advanced squamous cell carcinoma of the head and neck (TROG 02.02, HeadSTART): a phase III trial of the Trans-Tasman Radiation Oncology Group. J. Clin. Oncol. 2010, 28, 2989–2995. [Google Scholar] [CrossRef] [PubMed]
  27. DiSilvestro, P.; Ali, S.; Peter, C.; Spirtos, N.; Lucci, J.; Lee, Y.; Cohn, D.; Tewari, K.; Muller, C.; Steinhoff, M. A Gynecologic Oncology Group phase III randomized trial of weekly cisplatin and radiation versus cisplatin and tirapazamine and radiation in stage IB2, IIA, IIIB and IVA cervical carcinoma limited to the pelvis. Gynecol. Oncol. 2012, 125 (Suppl. 11), S3–S4. [Google Scholar] [CrossRef]
  28. Hay, M.P.; Hicks, K.O.; Wilson, W.R. Discovery of the hypoxia-activated prodrug SN30000. In Comprehensive Medicinal Chemistry III, vol 8; Rotella, D., Chackalamannil, S., Ward, S., Eds.; Elsevier: Amsterdam, The Netherlands, 2017. [Google Scholar]
  29. Hicks, K.O.; Siim, B.G.; Jaiswal, J.K.; Pruijn, F.B.; Fraser, A.M.; Patel, R.; Hogg, A.; Liyanage, H.D.S.; Dorie, M.J.; Brown, J.M.; et al. Pharmacokinetic/pharmacodynamic modeling identifies SN30000 and SN29751 as tirapazamine analogues with improved tissue penetration and hypoxic cell killing in tumors. Clin. Cancer Res. 2010, 16, 4946–4957. [Google Scholar] [CrossRef]
  30. Wang, J.; Foehrenbacher, A.; Su, J.; Patel, R.; Hay, M.P.; Hicks, K.O.; Wilson, W.R. The 2-nitroimidazole EF5 is a biomarker for oxidoreductases that activate bioreductive prodrug CEN-209 under hypoxia. Clin. Cancer Res. 2012, 18, 1684–1695. [Google Scholar] [CrossRef]
  31. Mikkelsen, R.B.; Asher, C.; Hicks, T. Extracellular pH, transmembrane distribution and cytotoxicity of chlorambucil. Biochem. Pharmacol. 1985, 34, 2531–2534. [Google Scholar] [CrossRef]
  32. Prescott, D.M.; Charles, H.C.; Poulson, J.M.; Page, R.L.; Thrall, D.E.; Vujaskovic, Z.; Dewhirst, M.W. The relationship between intracellular and extracellular pH in spontaneous canine tumors. Clin. Cancer Res. 2000, 6, 2501–2505. [Google Scholar] [PubMed]
  33. Linford, J.H. The influence of pH on the reactivity of chlorambucil. Biochem. Pharmacol. 1963, 12, 317–324. [Google Scholar] [CrossRef]
  34. Steckhan, E.; Kuwana, T. Spectroelectrochemical study of mediators I. Bipyridylium salts and their electron transfer rates to Cytochrome c. Ber. Bunsenges. Phys. Chem. 1974, 78, 253–259. [Google Scholar]
  35. Anderson, R.F.; Patel, K.B. Radical cations of some low-potential viologen compounds. Reduction potentials and electron-transfer reactions. J. Chem. Soc. Faraday Trans. 1 1984, 80, 2693–2702. [Google Scholar] [CrossRef]
  36. Hay, M.P.; Gamage, S.A.; Kovacs, M.S.; Pruijn, F.B.; Anderson, R.F.; Patterson, A.V.; Wilson, W.R.; Brown, J.M.; Denny, W.A. Structure-activity relationships of 1,2,4-benzotriazine 1,4-dioxides as hypoxia-selective analogues of tirapazamine. J. Med. Chem. 2003, 46, 169–182. [Google Scholar] [CrossRef] [PubMed]
  37. Anderson, R.F.; Shinde, S.S.; Hay, M.P.; Gamage, S.A.; Denny, W.A. Radical properties governing the hypoxia-selective cytotoxicity of antitumor 3-amino-1,2,4-benzotriazine 1,4-dioxides. Org. Biomolec. Chem. 2005, 3, 2167–2174. [Google Scholar] [CrossRef] [PubMed]
  38. Hill, H.A.; Thornalley, P.J. The effect of spin traps on phenylhydrazine-induced haemolysis. Biochim. Biophys. Acta 1983, 762, 44–51. [Google Scholar] [CrossRef]
  39. Janzen, E.G.; Coulter, G.A.; Oehler, U.M.; Bergsma, J.P. Solvent effects on the nitrogen and β-hydrogen hyperfine splitting constants of aminoxyl radicals obtained in spin trapping experiments. Can. J. Chem. 1982, 60, 2725–2733. [Google Scholar] [CrossRef]
  40. Kondo, T.; Riesz, P. Sonochemistry of nitrone spin traps in aqueous solutions. Evidence for pyrolysis radicals from spin traps. Free Radical Biol. Med. 1989, 7, 259–268. [Google Scholar] [CrossRef]
  41. Rink, T.J.; Tsien, R.Y.; Pozzan, T. Cytoplasmic pH and Free Mg2+ in Lymphocytes. J. Cell Biol. 1982, 95, 189–196. [Google Scholar] [CrossRef]
  42. Fukushima, T.; Waddell, T.K.; Grinstein, S.; Goss, G.G.; Orlowski, J.; Downey, G.P. Na+/H+ Exchange Activity during Phagocytosis in Human Neutrophils: Role of Fcγ Receptors and Tyrosine Kinases. J. Cell Biol. 1996, 132, 1037–1052. [Google Scholar] [CrossRef] [PubMed]
  43. Malhotra, D.; Casey, J.R. Intracellular pH Measurement. In eLS; John Wiley & Sons, Ltd.: Chichester, UK, 2015; pp. 1–7. [Google Scholar]
  44. Wang, Z.H.; Chu, G.L.; Hyun, W.C.; Pershadsingh, H.A.; Fulwyler, M.J.; Dewey, W.C. Comparison of DMO and flow cytometric methods for measuring intracellular pH and the effect of hyperthermia on the transmembrane pH gradient. Cytometry 1990, 11, 617–623. [Google Scholar] [CrossRef]
  45. Riemann, A.; Schneider, B.; Ihling, A.; Nowak, M.; Sauvant, C.; Thews, O.; Gekle, M. Acidic environment leads to ROS-induced MAPK signaling in cancer cells. PLoS ONE 2011, 6, e22445. [Google Scholar] [CrossRef] [PubMed]
  46. Hunter, F.W.; Hsu, H.L.; Su, J.; Pullen, S.M.; Wilson, W.R.; Wang, J. Dual targeting of hypoxia and homologous recombination repair dysfunction in triple-negative breast cancer. Mol. Cancer Ther. 2014, 13, 2501–2514. [Google Scholar] [CrossRef] [PubMed]
  47. Hunter, F.W.; Jaiswal, J.K.; Hurley, D.G.; Liyanage, H.D.S.; MacManaway, S.P.; Gu, Y.; Richter, S.; Wang, J.; Tercel, M.; Print, C.G.; et al. The flavoprotein FOXRED2 reductively activates nitro-chloromethylbenzindolines and other hypoxia-targeting prodrugs. Biochem. Pharmacol. 2014, 89, 224–235. [Google Scholar] [CrossRef] [PubMed]
  48. Chiche, J.; Brahimi-Horn, M.C.; Pouyssegur, J. Tumour hypoxia induces a metabolic shift causing acidosis: a common feature in cancer. J. Cell. Mol. Med. 2010, 14, 771–794. [Google Scholar] [CrossRef] [PubMed] [Green Version]
  49. Vallner, J.J. Binding of drugs by albumin and plasma protein. J. Pharmaceut. Sci. 1977, 66, 447–465. [Google Scholar] [CrossRef]
  50. Gu, Y.; Chang, T.T.-A.; Wang, J.; Jaiswal, J.K.; Edwards, D.; Downes, N.J.; Liyanage, H.D.S.; Lynch, C.; Pruijn, F.B.; Hickey, A.J.R.; et al. Reductive metabolism influences the toxicity and pharmacokinetics of the hypoxia-targeted benzotriazine di-oxide anticancer agent SN30000 in mice. Front. Pharmacol. 2017, 8, 531. [Google Scholar] [CrossRef]
  51. Halestrap, A.P.; Meredith, D. The SLC16 gene family—from monocarboxylate transporters (MCTs) to aromatic amino acid transporters and beyond. Pflügers Archiv. 2004, 447, 619–628. [Google Scholar] [CrossRef]
  52. Baker, M.A.; Zeman, E.M.; Hirst, V.K.; Brown, J.M. Metabolism of SR 4233 by Chinese hamster ovary cells: basis of selective hypoxic cytotoxicity. Cancer Res. 1988, 48, 5947–5952. [Google Scholar]
  53. Siim, B.G.; Pruijn, F.B.; Sturman, J.R.; Hogg, A.; Hay, M.P.; Brown, J.M.; Wilson, W.R. Selective potentiation of the hypoxic cytotoxicity of tirapazamine by its 1-N-oxide metabolite SR 4317. Cancer Res. 2004, 64, 736–742. [Google Scholar] [CrossRef] [PubMed]
  54. Laderoute, K.; Wardman, P.; Rauth, A.M. Molecular mechanisms for the hypoxia-dependent activation of 3-amino- 1,2,4-benzotriazine-1,4-dioxide (SR 4233). Biochem. Pharmacol. 1988, 37, 1487–1495. [Google Scholar] [CrossRef]
  55. Junnotula, V.; Sarkar, U.; Sinha, S.; Gates, K.S. Initiation of DNA strand cleavage by 1,2,4-benzotriazine 1,4-dioxide antitumor agents: mechanistic insight from studies of 3-methyl-1,2,4-benzotriazine 1,4-dioxide. J. Am. Chem. Soc. 2009, 131, 1015–1024. [Google Scholar] [CrossRef] [PubMed]
  56. Shinde, S.S.; Hay, M.P.; Patterson, A.V.; Denny, W.A.; Anderson, R.F. Spin trapping of radicals other than the *OH radical upon reduction of the anticancer agent tirapazamine by cytochrome P450 reductase. J. Am. Chem. Soc. 2009, 131, 14220–14221. [Google Scholar] [CrossRef] [PubMed]
  57. Shinde, S.S.; Maroz, A.; Hay, M.P.; Patterson, A.V.; Denny, W.A.; Anderson, R.F. Characterization of radicals formed following enzymatic reduction of 3-substituted analogues of the hypoxia-selective cytotoxin 3-amino-1,2,4-benzotriazine 1,4-dioxide (tirapazamine). J. Am. Chem. Soc. 2010, 132, 2591–2599. [Google Scholar] [CrossRef]
  58. Wang, J.; Guise, C.P.; Dachs, G.U.; Phung, Y.; Hsu, A.H.; Lambie, N.K.; Patterson, A.V.; Wilson, W.R. Identification of one-electron reductases that activate both the hypoxia prodrug SN30000 and diagnostic probe EF5. Biochem. Pharmacol. 2014, 91, 436–446. [Google Scholar] [CrossRef] [PubMed]
  59. Hunter, F.W.; Young, R.J.; Shalev, Z.; Vellanki, R.N.; Wang, J.; Gu, Y.; Joshi, N.; Sreebavan, S.; Weinreb, I.; Goldstein, D.P.; et al. Identification of P450 oxidoreductase as a major determinant of sensitivity to hypoxia-activated prodrugs. Cancer Res. 2015, 75, 4211–4223. [Google Scholar] [CrossRef]
  60. Herst, P.M.; Tan, A.S.; Scarlett, D.J.; Berridge, M.V. Cell surface oxygen consumption by mitochondrial gene knockout cells. Biochim. Biophys. Acta 2004, 1656, 79–87. [Google Scholar] [CrossRef] [Green Version]
  61. Helmlinger, G.; Yuan, F.; Dellian, M.; Jain, R.K. Interstitial pH and pO2 gradients in solid tumors in vivo: high-resolution measurements reveal a lack of correlation. Nat. Med. 1997, 3, 177–182. [Google Scholar] [CrossRef]
  62. Vaupel, P.; Kallinowski, F.; Okunieff, P. Blood flow, oxygen and nutrient supply, and metabolic microenvironment of human tumors: a review. Cancer Res. 1989, 49, 6449–6465. [Google Scholar]
  63. Ebert, A.; Hannesschlaeger, C.; Goss, K.U.; Pohl, P. Passive permeability of planar lipid bilayers to organic anions. Biophys. J. 2018, 115, 1931–1941. [Google Scholar] [CrossRef] [PubMed]
  64. Kell, D.B.; Oliver, S.G. How drugs get into cells: tested and testable predictions to help discriminate between transporter-mediated uptake and lipoidal bilayer diffusion. Front. Pharmacol. 2014, 5, 231. [Google Scholar] [CrossRef] [PubMed]
  65. Smith, D.; Artursson, P.; Avdeef, A.; Di, L.; Ecker, G.F.; Faller, B.; Houston, J.B.; Kansy, M.; Kerns, E.H.; Kramer, S.D.; et al. Passive lipoidal diffusion and carrier-mediated cell uptake are both important mechanisms of membrane permeation in drug disposition. Mol. Pharmacol. 2014, 11, 1727–1738. [Google Scholar] [CrossRef] [PubMed]
  66. Herst, P.M.; Berridge, M.V. Plasma membrane electron transport: a new target for cancer drug development. Curr. Mol. Med. 2006, 6, 895–904. [Google Scholar] [CrossRef] [PubMed]
  67. Gray, J.P.; Eisen, T.; Cline, G.W.; Smith, P.J.S.; Heart, E. Plasma membrane electron transport in pancreatic β-cells is mediated in part by NQO1. Am. J. Physiol.-Endocrinol. Metabol. 2011, 301, E113–E121. [Google Scholar] [CrossRef] [PubMed]
  68. Yu, H.; Silva, S.; Estrada-Bernal, A.; Rivard, C.J.; Hirsch, F.R.; Abbatista, M.; Smaill, J.; Doebele, R.C.; Patterson, A.V.; Vellanki, A.; et al. STEAP4 ISH and IHC diagnostics for tarloxotinib activation in EGFR/HER2 mutant cancers. In Proceedings of the American Association for Cancer Research Annual Meeting 2019, Atlanta, GA, USA, 29 Mar 2019–3 April 2019; Volume 60, p. 1037. [Google Scholar]
  69. Bailey, K.M.; Wojtkowiak, J.W.; Hashim, A.I.; Gillies, R.J. Targeting the metabolic microenvironment of tumors. Adv. Pharmacol. 2012, 65, 63–107. [Google Scholar] [PubMed]
  70. Daniels, J.S.; Gates, K.S. DNA cleavage by the antitumor agent 3-amino-1,2,4-benzotriazine 1,4-dioxide (SR4233): Evidence for involvement of hydroxyl radical. J. Am. Chem. Soc. 1996, 118, 3380–3385. [Google Scholar] [CrossRef]
  71. Anderson, R.F.; Shinde, S.S.; Hay, M.P.; Gamage, S.A.; Denny, W.A. Activation of 3-amino-1,2,4-benzotriazine 1,4-dioxide antitumor agents to oxidizing species following their one-electron reduction. J. Am. Chem. Soc. 2003, 125, 748–756. [Google Scholar] [CrossRef] [PubMed]
  72. Chowdhury, G.; Junnotula, V.; Daniels, J.S.; Greenberg, M.M.; Gates, K.S. DNA strand damage product analysis provides evidence that the tumor cell-specific cytotoxin tirapazamine produces hydroxyl radical and acts as a surrogate for O(2). J. Am. Chem. Soc. 2007, 129, 12870–12877. [Google Scholar] [CrossRef] [PubMed]
  73. Shen, X.; Gates, K.S. Enzyme-activated generation of reactive oxygen species from heterocyclic N-oxides under aerobic and anaerobic conditions and its relevance to hypoxia-selective prodrugs. Chem. Res. Toxicol. 2019, 32, 348–361. [Google Scholar] [CrossRef] [PubMed]
  74. Griffiths, J.; Murphy, J.A. Cleavage of DNA resulting from exposure to phenyl radicals. J. Chem. Soc. Chem. Comm. 1992, 24–26. [Google Scholar] [CrossRef]
  75. Hazlewood, C.; Davies, M.J.; Gilbert, B.C.; Packer, J.E. Electron paramagnetic resonance studies of the reaction of aryl radicals with nucleic acids and their components. J. Chem. Soc. Perkin Trans. 2 1995, 2167–2174. [Google Scholar] [CrossRef]
  76. Hiramoto, K.; Kaku, M.; Kato, T.; Kikugawa, K. DNA strand breaking by the carbon-centered radical generated from 4-(hydroxymethyl) benzenediazonium salt, a carcinogen in mushroom Agaricus bisporus. Chem. Biol. Interact. 1995, 94, 21–36. [Google Scholar] [CrossRef]
  77. Boyd, M.; Hay, M.P.; Boyd, P.D. Complete 1H, 13C and 15N-NMR assignment of tirapazamine and related 1,2,4-benzotriazine N-oxides. Magnetic Resonance Chem. 2006, 44, 948–954. [Google Scholar] [CrossRef] [PubMed]
  78. Pchalek, K.; Hay, M.P. Stille coupling reactions in the synthesis of hypoxia-selective 3-alkyl-1,2,4-benzotriazine 1,4-dioxide anticancer agents. J. Org. Chem. 2006, 71, 6530–6535. [Google Scholar] [CrossRef] [PubMed]
  79. Hay, M.P.; Hicks, K.O.; Pchalek, K.; Lee, H.H.; Blaser, A.; Pruijn, F.B.; Anderson, R.F.; Shinde, S.S.; Wilson, W.R.; Denny, W.A. Tricyclic [1,2,4]triazine 1,4-dioxides as hypoxia selective cytotoxins. J. Med. Chem. 2008, 51, 6853–6865. [Google Scholar] [CrossRef] [PubMed]
  80. Anderson, R.F.; Denny, W.A.; Li, W.; Packer, J.E.; Tercel, M.; Wilson, W.R. Pulse radiolysis studies on the fragmentation of arylmethyl quaternary nitrogen mustards by one-electron reduction in aqueous solution. J. Phys. Chem. 1997, 101, 9704–9709. [Google Scholar] [CrossRef]
  81. Wardman, P. Reduction potentials of one-electron couples involving free radicals in aqueous solution. J. Phys. Chem. Ref. Data 1989, 18, 1637–1755. [Google Scholar] [CrossRef]
  82. Anderson, R.F.; Yadav, P.; Shinde, S.S.; Hong, C.R.; Pullen, S.M.; Reynisson, J.; Wilson, W.R.; Hay, M.P. Radical chemistry and cytotoxicity of bioreductive 3-substituted quinoxaline di-N-oxides. Chem. Res. Toxicol. 2016, 29, 1310–1324. [Google Scholar] [CrossRef]
  83. Guise, C.P.; Wang, A.; Thiel, A.; Bridewell, D.; Wilson, W.R.; Patterson, A.V. Identification of human reductases that activate the dinitrobenzamide mustard prodrug PR-104A: a role for NADPH:cytochrome P450 oxidoreductase under hypoxia. Biochem. Pharmacol. 2007, 74, 810–820. [Google Scholar] [CrossRef] [PubMed]
  84. Jamieson, S.M.; Tsai, P.; Kondratyev, M.K.; Budhani, P.; Liu, A.; Senzer, N.N.; Chiorean, E.G.; Jalal, S.I.; Nemunaitis, J.J.; Kee, D.; et al. Evofosfamide for the treatment of human papillomavirus-negative head and neck squamous cell carcinoma. JCI Insight 2018, 3, e122204. [Google Scholar] [CrossRef] [PubMed]
  85. Bonnet, M.; Hong, C.R.; Wong, W.W.; Liew, L.P.; Shome, A.; Wang, J.; Gu, Y.; Stevenson, R.J.; Qi, W.; Anderson, R.F.; et al. Next-generation hypoxic cell radiosensitizers: nitroimidazole alkylsulfonamides. J. Med. Chem. 2018, 61, 1241–1254. [Google Scholar] [CrossRef] [PubMed]
  86. Siim, B.G.; Atwell, G.J.; Wilson, W.R. Oxygen dependence of the cytotoxicity and metabolic activation of 4- alkylamino-5-nitroquinoline bioreductive drugs. Brit. J. Cancer 1994, 70, 596–603. [Google Scholar] [CrossRef] [PubMed]
  87. Foehrenbacher, A.; Patel, K.; Abbattista, M.; Guise, C.P.; Secomb, T.W.; Wilson, W.R.; Hicks, K.O. The role of bystander effects in the antitumor activity of the hypoxia-activated prodrug PR-104. Front. Oncol. 2013, 3, 1–18. [Google Scholar] [CrossRef] [PubMed]
  88. Su, J.; Gu, Y.; Pruijn, F.B.; Smaill, J.B.; Patterson, A.V.; Guise, C.P.; Wilson, W.R. Zinc finger nuclease knockout of NADPH:cytochrome P450 oxidoreductase (POR) in human tumour cell lines demonstrates that hypoxia-activated prodrugs differ in POR dependence. J. Biol. Chem. 2013, 288, 37138–37153. [Google Scholar] [CrossRef]
Sample Availability: Samples of the compounds 412 are available from the authors.
Figure 1. Reference compounds and benzotriazine di-oxide (BTO) alkanoic acids and esters based on SN30000 (2) and tirapazamine (3).
Molecules 24 02524 g001
Scheme 1. Synthesis of BTO-3-alkanoic acids. Values in parentheses are yields. Reagents: (a) AllylOH, NaHCO3, Pd(OAc)2, nBu4N+Cl, MeCN; (b) NaClO2, KH2PO4, H2O2, MeCN; (c) H2O2, TFAA, DCM (d) cH2SO4, MeOH; (e) 4 M HCl dioxane/water.
Molecules 24 02524 sch001
Scheme 2. Synthesis of BTO-3-aminoalkanoic acids. Values in parentheses are yields. Reagents: (a) Aminoalkyl ester, Et3N, DME; (b) H2O2, TFAA, DCM; (c) 4 M HCl dioxane/water.
Molecules 24 02524 sch002
Figure 2. (a) EPR spectra of radicals obtained upon the reduction of 7a (17 mM) by the N-terminally truncated (soluble) cytochrome P450 oxidoreductase (sPOR) protein (7 ng mL−1) in a solution at 37 °C containing diethylenetriaminepentaacetic acid (DETAPAC) (100 uM), superoxide dismutase (300 units mL−1), catalase (1500 units mL−1), glucose-6-phoshate dehydrogenase (13 units mL−1), glucose-6-phosphate (10 mM), NADPH (1 mM) at pH 7 in the presence of N-tert-butyl-α-phenylnitrone (PBN, 0.1 M); (b) simulated spectrum (NIH WINSIM) of (i) PBN-C centered species (0.81), and (ii) PBN-aryl 0.19, r = 0.966.
Molecules 24 02524 g002
Figure 3. Representative data for the inhibition of proliferation of SiHa cells exposed to compounds for 4 h under oxia or anoxia at pHe 7.4 or 6.5. Cells were subsequently grown under standard cell culture conditions (oxia, pHe 7.4) for 5 days before staining with sulforhodamine B (SRB). (A) Chlorambucil (1). (B) SN30000 (2). (C) BTO acid 4a. Values are means and errors are ranges for duplicate cultures in a single experiment. Fitted curves are 4-parameter logistic regressions. PCR = pH cytotoxicity ratio. ACR = anoxia cytotoxicity ratio. TMR = tumor microenvironment ratio.
Molecules 24 02524 g003
Figure 4. Cellular uptake of SN30000 (A) and BTO acids 4a (B), 7a (C) and 11a (D) in stirred aerobic SiHa cell suspensions (2 × 10⁶ cells/mL). Nominal initial concentrations were 200 μM for SN30000 (2) and 500 μM for the other compounds. Values are mean and SEM for 3 replicates. ND: Not detected.
Molecules 24 02524 g004
Figure 5. Reductive metabolism of BTO acids and SN30000 to the corresponding N-1-oxides by anoxic cultures in 96-well plates. (A) Absorbance chromatogram demonstrating the formation of N-1-oxide 15a from 4a (initially 50 μM) by SiHa cells (2 × 10⁶ cells/mL) after 2 h. All unlabeled peaks were also observed in drug-free controls. (B) Rate of formation of N-1-oxide metabolites in the extracellular medium, as in (A), at two different extracellular pH values. (C) Formation of extracellular N-1-oxides in SiHa and SiHa/POR cultures (2 × 10⁶ and 5 × 10⁵ cells/mL, respectively) at pHe 7.4. (D) Formation of N-1-oxides by post-mitochondrial supernatants from SiHa and SiHa/POR cells under anoxia. Values in (B), (C), and (D) are means and SEM for triplicate cultures. Statistical significance of differences (ns, p > 0.05; **, p < 0.01; ***, p < 0.001) was tested by one-way ANOVA.
Molecules 24 02524 g005
Figure 6. IC50 values for inhibition of proliferation of SiHa and SiHa/POR cells by SN30000 (2) and BTO acids 4a and 7a. Drug exposure was for 4 h under anoxia, at pHe 7.4, with regrowth under aerobic conditions for 5 days before staining with SRB. Values are means and SEM for the two experiments, each with triplicate cultures at each drug concentration.
Molecules 24 02524 g006
Figure 7. Metabolism of BTO ester 4b and the corresponding acid 4a by anoxic SiHa single cell suspensions (2 × 10⁶ cells/mL). (A) Extracellular concentrations following the addition of 4b (50 μM). (B) Extracellular concentrations following the addition of 4a (50 μM). (C) Extracellular (left) and intracellular (right) concentrations following the addition of 4b (150 μM). Values are means and errors are SEM for 3 replicate cultures.
Molecules 24 02524 g007
Figure 8. Inhibition of reduction of BTOs to their N-1-oxides by the cell-excluded electron acceptor WST-1. SiHa cells were seeded in 96-well plates at 106 cells/mL and exposed to the compounds (50 μM) with the indicated concentrations of WST-1 under anoxia for 2 h. Total (pooled intracellular and extracellular) amounts of the 1-oxide metabolites were determined by HPLC. Values are mean and SEM for two experiments with triplicate cultures at each concentration.
Molecules 24 02524 g008
Figure 9. Model for the cellular pharmacology of BTO acids (HA). Extracellular acidification when pHe is reduced from 7.4 to 6.5 leads to a smaller change in pHi (from 7.3 to 6.9), reversing the pH gradient across the plasma membrane and resulting in increased intracellular entrapment as the membrane-impermeable anion (1). This pH-dependent partitioning provides selective uptake and cytotoxicity at a low pHe, but intracellular concentrations of the BTO acids are lower than extracellular, even at pHe 6.5, possibly reflecting the activity of unidentified efflux pump(s) (2) or that equilibrium is not reached during the 4 h exposures to these hydrophilic compounds. Under hypoxia, the intracellular drug is metabolized by one-electron reduction (3) to a radical that can either be reduced further to the sTable 1-oxide metabolite or generate a strongly-oxidizing aryl radical (4) which induces DNA damage and cytotoxicity (5). Oxygen-inhibited reductive metabolism also occurs at the cell surface, potentially by the plasma membrane electron transport (PMET) system (6) or other cell surface one-electron reductases, such as STEAP4. However, extracellularly generated radicals cannot access the presumed intracellular targets responsible for cytotoxicity and thus represent ‘wasted’ metabolism.
Molecules 24 02524 g009
Table 1. Solubility, pKa, lipophilicity, and one-electron reduction potentials of BTO acids and comparator compounds.
CompoundSolubility (mM) apKa bclogP bclogD c pH 6.5clogD c pH 7.4E0′ (mV) d
1 4.619 e3.731.850.97
2 (7.01) f1.09 −401 ± 8 [MV2+] g
3 -−0.58 −456 ± 8 [MV2+] h
4a17.1 [D]4.154−0.67−3.01−3.84−399 ± 7 [MV2+]
4b17.7-−0.29 −363 ± 7 [MV2+]
5a>0.98 [D]4.150−0.17−2.51−3.34
5b>0.95 [D]-0.21
6a>0.96 [D]4.147−0.17−2.51−3.35
6b>0.90 [D]-0.21
7a24.84.141 i0.35−2.01−2.84−463 ± 8 [MV2+, V212+]
7b0.28 -0.72
8a8.73.658−0.30−2.89−3.17−470 ± 9 [MV2+]
8b8.6-0.51
9b0.07 -1.53
10a32.74.2860.90−1.25−1.85−565 ± 8 [TQ2+]
10b0.35-1.38
11a8.1 [D]4.4850.29−1.70−2.44−481 ± 10 [MV2+]
11b1.4 [D]-0.96
12a>0.89 [D]4.4840.79−1.19−1.94
12b0.16 [D]-1.46
Footnotes: a Solubility in AlphaMEM + 5% FBS, pH 7.4, by sonication, or by 100-fold dilution from DMSO stock solutions (signified by [D]). b Calculated using Chemdraw v17.1.0. c Calculated for a monoprotic acid using the equation from [1], see Section 4.6. d One-electron reduction potentials determined by pulse radiolysis, determined from equilibrium with the redox indicators shown in square brackets. MV2+, methylviologen. TQ2+, triquat (7,8-dihydrodipyrido-[1,2-a:2′,1′-c][1,4]diazepinedium). V212+, viologen2+/1+. e Measured pKa ~5.8 [33]. f Basic pKa. g [24]. h [36]. i Measured pKa 4.16 ± 0.01 (this study).
Table 2. Intracellular pH (pHi) of SiHa and FaDu cells at two different extracellular pH (pHe) values, determined after loading cells with BCECF AM.
pHi a
Cell LineGas PhaseN bAt pHe = 7.4At pHe 6.5ΔpHi c
SiHa20% O2 57.34 ± 0.16 6.93 ± 0.110.42 ± 0.08
0.2% O2 d37.00 ± 0.216.61 ± 0.220.40 ± 0.08
<0.01% O2 e17.38 ± 0.01 f6.85 ± 0.02 f0.53 ± 0.03 f
FaDu20% O227.32 ± 0.056.83 ± 0.010.50 ± 0.05
a Values are mean and SEM. b Number of independent experiments. c Mean and SEM of intra-experiment values of (pHi at pHe 7.4)–(pHi at pHe 6.5). d 24 h after initiating cultures under 0.2% O2. e 4 h after initiating cultures under anoxia. f For this condition, SEM values are for three biological replicates in the same experiment.
Table 3. Cytotoxicity of BTO acids and reference compounds against SiHa cells by IC50 assay after 4 h of exposure at pHe 7.4 or 6.5 under oxic or anoxic conditions.
CompoundN apHeOxic IC50 (μM)Anoxic IC50 (μM)ACR bPCR c OxicPCR c AnoxicTMR d
1167.412.7 ± 1.213.6 ± 1.10.94 ± 0.12
6.51.58 ± 0.273.78 ± 1.510.42 ± 0.188.06 ± 1.583.59 ± 1.463.36 ± 1.38
2217.4292 ± 152.87 ± 0.23101 ± 10
6.5253 ± 315.52 ± 2.0146 ± 18.01.15 ± 0.150.52 ± 0.1953 ± 19
357.4162 ± 82.81 ± 0.3057.5 ± 6.8
6.591 ± 212.90 ± 0.3831.4 ± 8.31.77 ± 0.420.97 ± 0.1656 ± 8
4a37.41950 ± 170259 ± 267.54 ± 1.00
6.5798 ± 4397 ± 48.26 ± 0.582.45 ± 0.252.68 ± 0.2920.2 ± 2.0
5a37.4>3000542 ± 113>5.5
6.5449 ± 188225 ± 381.99 ± 0.90>6.72.41 ± 0.64>13
6a47.4>10001180 ± 190>3
6.5>1000364 ± 47>2.7 3.24 ± 0.67>2.7
7a67.43720 ± 830864 ± 2774.31 ± 1.58
6.51886 ± 308428 ± 1524.41 ± 1.731.97 ± 0.552.02 ± 0.978.7 ± 3.6
8a37.4>2000154 ± 26>13
6.5>2000135 ± 18>15 1.14 ± 0.25 >15
10a57.4>2000>2000
6.5>2000416 ± 57>4.8 >4.8>4.8
11a37.42302 ± 92714 ± 1523.22 ± 0.70
6.5551 ± 16145 ± 133.81 ± 0.364.18 ± 0.214.94 ± 1.1415.9 ± 1.6
12a37.4>300>300
6.5>300234 ± 17>1 >1>1
Footnotes: a Number of experiments. b Anoxic cytotoxicity ratio = oxic IC50/anoxic IC50. c pH cytotoxicity ratio = IC50 at pHe 7.4/IC50 at pHe 6.5. d Overall TME ratio = oxic IC50 pHe 7.4/anoxic IC50 pHe 6.5. Values are means and errors are SEM. For ratios, the errors are root mean square SEM.
Table 4. Cytotoxicity of BTO acids and reference compounds against FaDu cells by IC50 assay after 4 h exposure at pHe 7.4 or 6.5 under oxic or anoxic conditions.
CompoundN apHeOxic IC50 (μM)Anoxic IC50 (μM)ACR bPCR c oxicPCR c AnoxicTMR d
1167.415.0 ± 1.613.1 ± 8.71.14 ± 0.14
6.53.19 ± 0.782.26 ± 0.371.41 ± 0.424.70 ± 1.265.82 ± 1.036.64 ± 1.30
2167.4258 ± 154.16 ± 0.3562.0 ± 6.34
6.5277 ± 158.63 ± 1.5532.1 ± 6.040.93 ± 0.080.48 ± 0.1029.8 ± 5.7
357.4182 ± 205.90 ± 0.4830.9 ± 4.2
6.5127 ± 146.96 ± 1.3818.3 ± 4.11.43 ± 0.220.85 ± 0.1826.2 ± 5.9
4a37.41330 ± 136325 ± 184.08 ± 0.48
6.5507 ± 27142 ± 213.58 ± 0.562.62 ± 0.302.29 ± 0.369.36 ± 1.68
5a37.42770 ± 690924 ± 643.00 ± 0.22
6.51100 ± 110203 ± 185.49 ± 0.262.55 ± 0.324.29 ± 0.5513.9 ± 1.7
6a47.4>1000>1000
6.5>1000205 ± 25>5 >5>5
7a27.4>70003260 ± 1070> 2
6.54910 ± 1600885 ± 5155.55 ± 3.70>1.42.68 ± 2.46>7.9
8a37.4>2000289 ± 25>6.9
6.51447 ± 268290 ± 484.99 ± 1.24>11.0 ± 0.19>6.9
10a47.4>2000856 ± 22>3
6.5>2000543 ± 126>4 1.58 ± 0.37>4
11a27.4>4000>4000
6.5>40003806 ± 390> 1 >1>1
12a27.4>300>300
6.5>300271 ± 53>1 >1>1
Footnotes: See Table 3.
Table 5. Cytotoxicity of BTO esters against SiHa cells by IC50 assay after 4 h of exposure at pHe 7.4 or 6.5 under oxic or anoxic conditions.
CompoundN apHeOxic IC50 (μM)Anoxic IC50 (μM)ACR bPCR c OxicPCR c AnoxicTMR d
4b37.434.4 ± 3.51.40 ± 0.1024.6 ± 3.1
6.526.3 ± 7.11.80 ± 0.4614.5 ± 5.41.31 ± 0.380.78 ± 0.2119.1 ± 5.3
7b37.4>2007.3 ± 1.6>27
6.5195 ± 2215.1 ± 3.113.0 ± 3.0>10.48 ± 0.15>13
8b37.435.3 ± 3.11.20 ± 0.3529.4 ± 8.9
6.521.6 ± 5.72.50 ± 0.878.6 ± 3.81.63 ± 0.450.48 ± 0.2214.1 ± 5.1
9b37.4>538.08 ± 2.23>6.5
6.542.2 ± 5.710.9 ± 1.423.87 ±0.73>1.20.74 ± 0.23>4.6
10b37.4249 ± 5020.4 ± 4.812.2 ± 3.8
6.5208 ± 2621.0 ± 4.29.90 ±2.341.20 ± 0.280.97 ± 0.3011.9 ± 3.4
11b37.414.5 ± 0.63.55 ± 0.704.08 ±0.82
6.513.2 ± 0.94.36 ± 0.563.04 ±0.441.10 ± 0.090.81 ± 0.193.32 ± 0.45
Footnotes: See Table 3.
Table 6. Cytotoxicity of BTO esters against FaDu cells by IC50 assay after 4 h of exposure at pHe 7.4 or 6.5 under oxic or anoxic conditions.
CompoundN apHeOxic IC50 (μM)Anoxic IC50 (μM)ACR bPCR c OxicPCR c AnoxicTMR d
4b47.4140 ± 73.20 ± 0.3843.6 ± 5.7
6.598 ± 123.30 ± 0.1129.6 ± 3.81.43 ± 0.190.97 ± 0.1242.3 ± 2.6
7b47.4>20011.5 ± 2.2>17
6.5157 ± 2820.0 ± 5.47.84 ± 2.56>1.20.58 ± 0.19>10
8b47.4102 ± 95.25 ± 1.1819.3 ± 4.7
6.576.1 ± 17.98.55 ± 1.928.89 ± 2.891.34 ± 0.330.61 ± 0.0211.2 ± 2.9
9b37.4>5346.9 ± 3.0>1
6.5>5337.7 ± 8.0>1 1.24 ± 0.28>1.4
10b37.4292 ± 843.7 ± 12.16.69 ± 1.86
6.5262 ± 2940.0 ± 5.86.56 ± 1.191.11 ± 0.131.09 ± 0.347.31 ± 1.08
11b37.4368 ± 9829.0 ± 2.012.7 ± 3.5
6.5274 ± 21036.3 ± 4.87.55 ± 5.871.34 ± 1.090.80 ± 0.1210.1 ± 3.0
Footnotes: See Table 3.
Table 7. Comparison of pHe dependence of chlorambucil, SN30000, and BTO acid 4a against SiHa cells by IC50 assay after 4 h of exposure under oxia (20% O2), hypoxia (0.2% O2), or anoxia (<0.01% O2).
O2RatioIC50 (μM) a
CHL (1)SN30000 (2)Cmpd 4a
pHe 7.4pHe 6.5pHe 7.4pHe 6.5pHe 7.4pHe 6.5
20% 12.0 ± 2.0 (13)1.84 ± 0.48 (10)404 ± 21 (7)207 ± 69 (7)1402 ± 162 (10)707 ± 321 (5)
PCR b:6.5 ± 2.01.95 ± 0.661.98 ± 0.93
0.2% 17.31 ± 2.53 (8)1.75 ± 0.44 (5)17.42 ± 1.02 (6)9.88 ± 2.34 (4)428 ± 57 (5)308 ± 1 (2)
PCR:9.9 ± 2.81.76 ± 0.431.39 ± 0.19
HCR c:0.69 ± 0.151.05 ± 0.3823.2 ± 1.820.1 ± 8.63.28 ± 0.582.30 ± 1.04
<0.01% 11.0 ± 2.1 (5)1.49 ± 0.18 (5)2.59 ± 0.35 (3)3.07 ± 0.38 (3)298 ± 44 (4)160 ± 45 (3)
PCR:7.40 ± 1.640.84 ± 0.151.86 ± 0.59
ACR d:1.09 ± 0.271.23 ± 0.34156 ± 2367 ± 244.70 ± 0.884.42 ± 2.36
Footnotes: a Values are mean and errors are SEM, with the number of experiments in brackets. b pH cytotoxicity ratio (IC50 for pHe 7.4/IC50 for pHe 6.5). c Hypoxic cytotoxicity ratio (IC50 for 20% O2/IC50 for 0.2% O2). d Anoxic cytotoxicity ratio (IC50 for 20% O2/IC50 for <0.01% O2).
Table 8. Calculated Ci/Ce for pH-dependent partitioning based on measured pHi values and the observed Ci and Ce values from Figure 4.
CompoundCi/Ce, pHe 7.4Ci/Ce, pHe 6.5
Calc aObs bCalc aObs b
5 min60 min 5 min60 min
21.04 b2.48± 0.272.49 ± 0.050.532.75 ± 0.072.37 ± 0.02
4a0.87<0.1<0.12.68<0.1<0.1
7a0.870.21 ± 0.08<0.12.680.70 ± 0.030.75 ± 0.03
11a0.87<0.1<0.12.680.17 ± 0.020.29 ± 0.02
Footnotes: a Calculated ratio for pH-dependent partitioning (Equations (1–3), see Section 4.6) assuming pHi = 7.34 when pHe = 7.4 and pHi = 6.93 when pHe = 6.5 (Table 2). Calculated pKa values were from Table 1. b Mean and SEM, from Figure 4.

