
Morphology-Dependent Catalytic Activity of Ru/CeO2 in Dry Reforming of Methane

1
Department of Chemistry and Shanghai Key Laboratory of Molecular Catalysis and Innovative Materials, Collaborative Innovation Center of Chemistry for Energy Materials, Fudan University, Shanghai 200438, China
2
Wolfson Catalysis Centre, Department of Chemistry, University of Oxford, Oxford OX1 3QR, UK
*
Authors to whom correspondence should be addressed.
Molecules 2019, 24(3), 526; https://doi.org/10.3390/molecules24030526
Submission received: 31 December 2018
/
Revised: 24 January 2019
/
Accepted: 29 January 2019
/
Published: 1 February 2019
(This article belongs to the Special Issue Catalysis: Providing Sustainable Solutions to Global Challenges)
Abstract
:Three morphology-controlled CeO2, namely nanorods (NRs), nanocubes (NCs), and nanopolyhedra (NPs), with different mainly exposed crystal facets of (110), (100), and (111), respectively, have been used as supports to prepare Ru (3 wt.%) nanoparticle-loaded catalysts. The catalysts were characterized by H2-temperature programmed reduction (H2-TPR), CO– temperature programmed desorption (CO-TPD), N2 adsorption–desorption, X-ray diffraction (XRD), Raman spectroscopy, X-ray photoelectron spectroscopy (XPS), transmission electron microscopy (TEM), and high-resolution transmission electron microscopy (HRTEM) and energy-dispersive X-ray spectroscopy (XDS). The characterization results showed that CeO2-NRs, CeO2-NCs, and CeO2-NPs mainly expose (110), (100) and (111) facets, respectively. Moreover, CeO2-NRs and CeO2-NCs present higher oxygen vacancy concentration than CeO2-NPs. In the CO2 reforming of methane reaction, Ru/CeO2-NR and Ru/CeO2-NC catalysts showed better catalytic performance than Ru/CeO2-NPs, indicating that the catalysts with high oxygen vacancy concentration are beneficial for promoting catalytic activity.
1. Introduction
As one of the most important emissions of modern industry and life, CO2 has attracted great attention for its influence on global warming [1,2,3]. Many efforts have been made by governments around the world to depress the emission of CO2 [4,5]. Actually, the use of CO2 as a type of C1 resource for further chemical industry is also an efficient way to solve the problem [5,6]. As another important greenhouse gas, CH4 exists extensively in natural resources. However, the current obstacle of the application of CH4 is the activation of CH4 due to its stable structure [7,8,9]. Thus, the studies of various reforming reactions have important industrial values and scientific significance in the application of CH4. Dry reforming of methane attracted more attention in recent years because this reaction could eliminate both greenhouse gases, CO2 and CH4, simultaneously. Furthermore, the products H2 and CO (syngas) of the reaction have a low H2/CO molar ratio of nearly 1, which is more suitable for the subsequent chemical industrial processes [10,11,12].
For the methane dry reforming reaction, many kinds of catalysts have been widely studied by loading active metals on different supports. Ni, Co, Rh, Ru, Pd, Ir, and Pt have been studied for methane dry reforming reaction in recently years [7,13,14,15]. Ni- and Co-based catalysts attracted more interest due to their lower price than noble metals. However, the sintering and coking problems along with the poor activity of the catalysts at relatively low temperature are difficult to solve. As a result, the study of noble metals in methane dry reforming is of great significance and the Rh- or Ru-based catalysts have been considered to have better activity and stability [15,16,17]. On the other hand, a lot of work has focused on the influence of the different metal oxide supports, such as SiO2, γ-Al2O3, MgO, ZrO2, La2O3, and TiO2 [18,19,20,21,22,23,24]. These studies showed that the supports played an important role in their catalytic activity. The supports may not only offer various textures to disperse the active metal components, but also interact strongly with the active species. The interaction between supports and active metals influence on the structure of catalysts, the particle sizes, and the dispersion of active sites consequently influences the catalytic activity of the catalysts [25]. For example, Wang et al. found that the catalytic performance of a series of catalysts for methane dry reforming reaction was related to the redox properties of the supports [26].
CeO2 is a unique metal oxide due to its low redox potential and high oxygen vacancy mobility, which could have a strong interaction with the active metals [27,28,29]. In recent years, CeO2 has been widely used as a catalyst promoter or support for various reactions, such as dry reforming of methane, partial oxidation of methane, dry reforming of propane, and steam reforming of ethanol [30,31,32,33,34]. The studies indicate that the existence of CeO2 in catalysts benefits their resistance to carbon deposition, because the coke on the catalyst could be removed by reacting with the oxygen species on the surface of CeO2. Thus, the release of oxygen species is a crucial process for CeO2-based catalysts. Generally, the surface energy of metal oxides is strongly related with their microstructures, and there are evident differences in surface energy among the faces with various indices of the crystallographic plane. The catalytic activity of shape-dependent CeO2-supported active metal is obviously different [35,36,37,38,39,40]. Therefore, it is reasonable to believe that the use of CeO2 supports specific exposed crystal facets may influence the catalytic behavior of the catalyst in dry reforming of methane.
In this work, we have prepared a series of CeO2 nanorods (CeO2-NRs), nanocubes (CeO2-NCs), and nanopolyhedra (CeO2-NPs) with dominant specific crystal facets (110), (100), and (111), respectively. These morphology-controlled CeO2 were used as supports for Ru as a catalytic active component through precipitation and deposition methods. The catalysts were characterized, and their catalytic behavior for dry reforming of methane was studied. In particular, the influence of the exposed crystal facets of the CeO2 supports on the catalytic activities was investigated in detail.
2. Results and Discussion
2.1. Catalyst Characterization
2.1.1. TEM and High-Resolution Transmission Electron Microscopy (HRTEM) Analysis
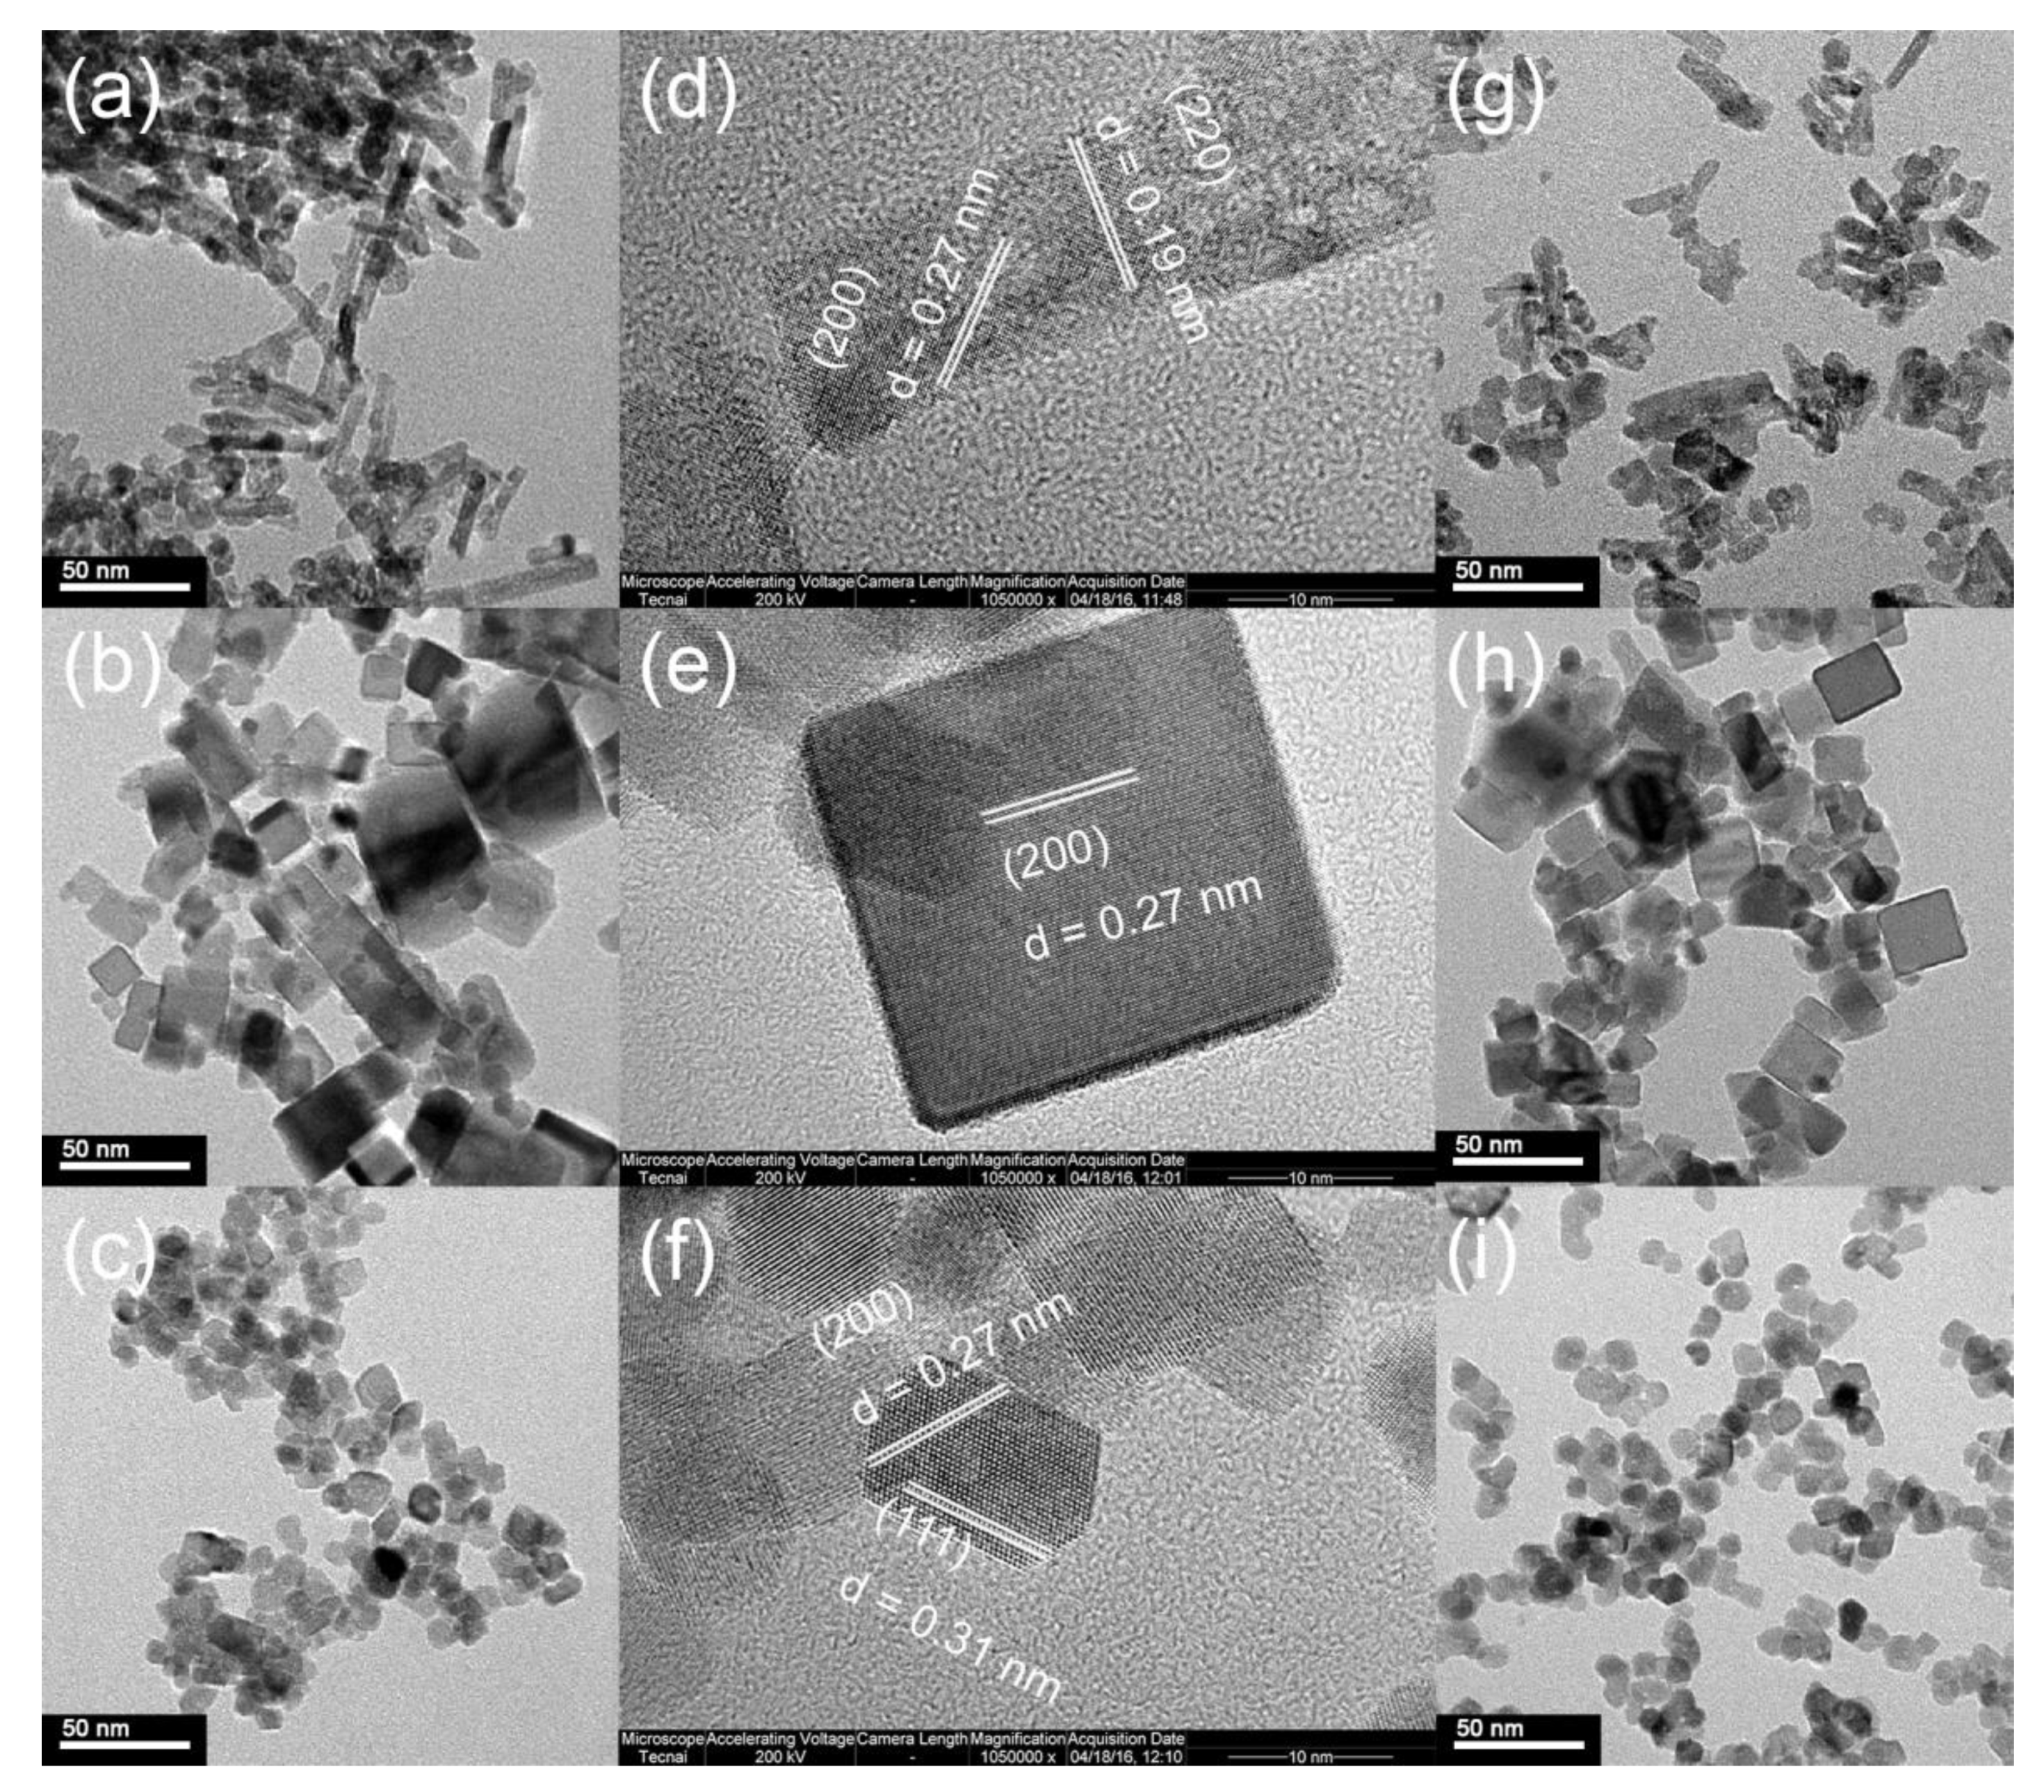
Figure 1 shows the TEM and HRTEM images of the CeO2 supports and Ru/CeO2 catalysts. In Figure 1a–f, three CeO2 samples show different morphologies. CeO2-NRs with the rod-like morphology in Figure 1a,d exhibit a uniform diameter of ca. 10 nm with two obvious interplanar spacings of 0.19 and 0.27 nm, corresponding to the (220) and (200) lattice fringes, respectively. The shape of CeO2-NRs indicates that the nanorods grow along the (110) direction. Figure 1b,e shows that CeO2-NCs possess the cubic morphology with a size of around 10–50 nm and clear (200) lattice fringes with the interplanar spacing of 0.27 nm. Figure 1c,f shows CeO2-NPs in the size range of 10–20 nm and (111) and (200) lattice fringes corresponding to the interplanar spacing of 0.31 and 0.27 nm, respectively [41]. HRTEM results show that only the (100) facet exists in the CeO2-NCs, whereas the (110) and (111) facets are the mainly exposed planes for CeO2-NRs and CeO2-NPs, respectively. Figure 1g–i shows TEM images of 3% Ru/CeO2 catalysts. It can be seen that the morphology of the supports remains after the loading of Ru species and no large aggregation was observed, indicating the high dispersion of the Ru species. The distribution of Ce and Ru was evaluated by EDS analysis. The EDS results are shown in Figures S1–S3 for the Ru/CeO2-NRs, Ru/CeO2-NCs, and Ru/CeO2-NPs, respectively. The elemental mapping results also indicate that Ru species are highly dispersed on the surface of CeO2 supports.
2.1.2. X-ray Diffraction
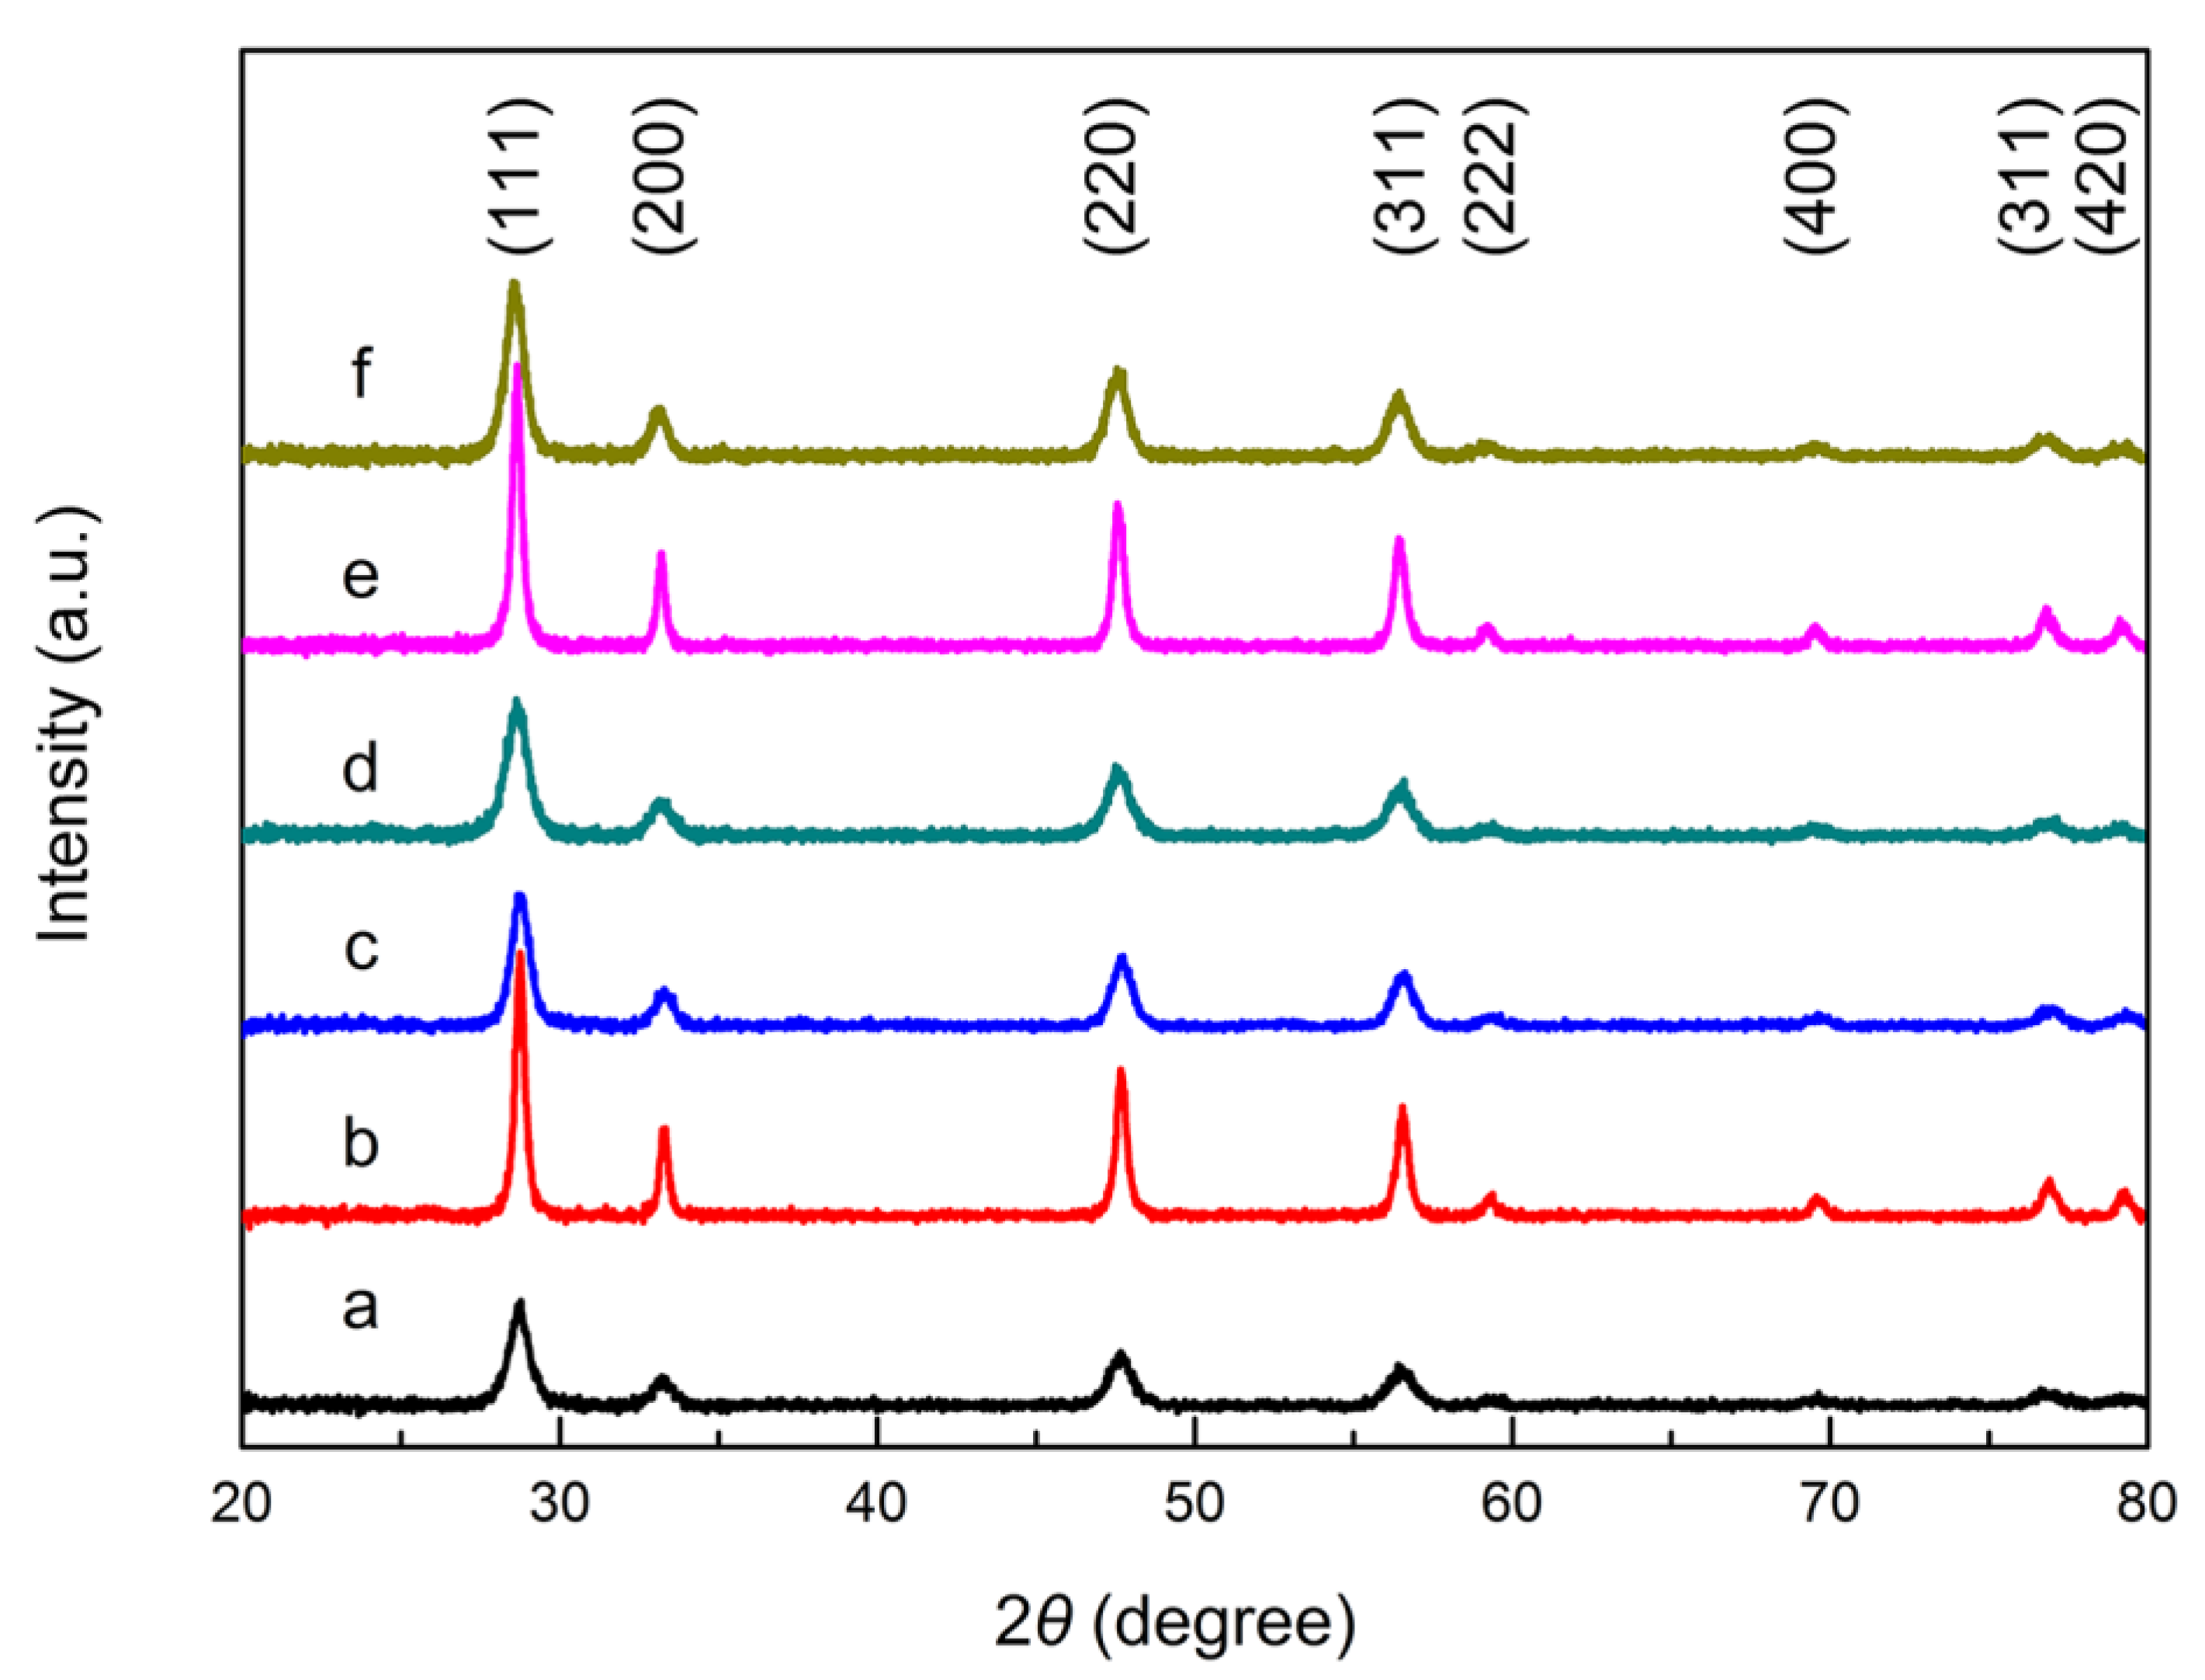
Figure 2 shows the XRD patterns of CeO2 samples with different exposed facets and their corresponding 3% Ru/CeO2 catalysts. The peaks of CeO2-NRs, CeO2-NCs, and CeO2-NPs at 28.7°, 33.2°, 47.6°, 56.5°, 59.1°, 69.4°, 76.6°, and 79.2° are assigned to the diffractions of (111), (200), (220), (311), (222), (400), (311), and (420) of CeO2 indexed to the face-centered cubic fluorite structure with space group Fm-3m (JCPDS 34-0394). The crystalline sizes of different samples calculated by Scherrer formula are listed in Table 1. The results are consistent with TEM images. The diffraction peak positions of the three CeO2 supports are nearly the same, but their relative intensities are different. The different ratios of (I(200)/I(111) + I(220)/I(111)) as 1.00, 1.02, and 0.82 for CeO2-NRs, CeO2-NCs, and CeO2-NPs, respectively, show that the (111) facet exposure in the nanopolyhedra is higher than that in nanorods and nanocubes, which are consistent with the TEM and HRTEM analysis [39]. The XRD patterns of different Ru/CeO2 catalysts are shown in Figure 2d–f, and no significant change of the diffractions of CeO2 can be found, suggesting that the structure of CeO2 supports remains. It is worth to note that from the inductively coupled plasma atomic emission spectrometer (ICP-AES) results (Table 1), Ru/CeO2 samples show close Ru loading to the feeding value of 3 wt.% despite some weight loss. No new diffraction assigned to Ru species appears in the XRD patterns, indicating the high dispersion of metal species on the support. The Ru dispersion calculated from CO-TPD shows that the Ru species are highly dispersed on the CeO2 supports. Ru/CeO2-NRs and Ru/CeO2-NCs display higher Ru dispersion (54% and 59%, respectively) than that of Ru/CeO2-NPs (35.0%) (Table 1). The results are consistent with the EDS mappings results (Supplementary Materials).
2.1.3. N2 Adsorption–Desorption
The N2 adsorption–desorption characterization was performed at 77 K to study the textural properties of CeO2 supports and Ru/CeO2 catalysts. The Brunauer–Emmett–Teller (BET) surface areas of CeO2-NRs, CeO2-NCs, and CeO2-NPs and their corresponding Ru-supported catalysts, Ru/CeO2-NRs, Ru/CeO2-NCs, and Ru/CeO2-NPs are 87.1, 31.7, 67.4, 84.9, 30.1, and 65.8 m2·g−1, respectively. As shown in Table 1, the surface areas of pure CeO2-NRs and CeO2-NPs are higher than those of CeO2-NCs, which is mainly because of smaller particle sizes of the former compared to the latter. The surface areas and particle sizes are merely changed after the addition of Ru species with low loading. It is well known that the surface area has an influence on the catalytic activity for many reactions, and the catalysts with a large surface area would be beneficial to enhance the catalytic activity. However, for some reaction over ceria-based catalysts, the surface area is not the crucial factor based on the previous research [33,36].
2.1.4. H2-Temperature Programmed Reduction
The H2-temperature programmed reduction (H2-TPR) measurements were performed to clarify the reduction characteristics of CeO2 supports and supported Ru/CeO2 catalysts. As shown in Figure 3a, two reduction peaks appear in the temperature range of 250–900 °C for three CeO2 supports with different exposed facets. The first peak below 600 °C is due to the reduction of Ce4+ to Ce3+ on the CeO2 surface with oxygen vacancy, and the second peak is the reduction of Ce4+ to Ce3+ inside the bulk CeO2 [27,40]. After loading the Ru species on the supports, the reduction peak changed significantly. The presence of two sets of peaks at 30–110 °C and 110–200 °C indicates Ru species exist in two different states. The reduction peaks at low temperature are usually assigned to the adsorbed oxygen and well-dispersed Ru species interacting strongly with the CeO2 supports [42]. From the previous research, the surface energies (γ) associated with different crystallographic planes are usually different, and a general sequence is γ(111) < γ(100) < γ(110) [43,44]. Thus, the order of reduction temperature of all catalysts in the range of 30–110 °C is Ru/CeO2-NRs < Ru/CeO2-NCs < Ru/CeO2-NPs, which agrees with the energy order of different facets. The reduction peaks at a relatively high temperature are assigned to the Ru species interacting weakly with CeO2 supports and the surface oxygen of CeO2. It has been reported that the hydrogen consumption is 178–188 μmol·g−1 for the reaction of RuO2 + 2H2 → Ru0 + 2H2O [42]. The total H2 consumption calculated by integrating the peaks is ~754 μmol·g−1 for Ru/CeO2-NRs, ~710 μmol·g−1 for Ru/CeO2-NCs, and ~638 μmol·g−1 for Ru/CeO2-NPs. The high hydrogen consumption of three catalysts should result from the reduction of a large amount of surface oxygen of CeO2 due to the existence of Ru–O–Ce. The low hydrogen consumption of Ru/CeO2-NPs indicates that the Ru species have a weak interaction with CeO2 support compared to those of Ru/CeO2-NRs and Ru/CeO2-NCs.
2.1.5. Raman Spectroscopy
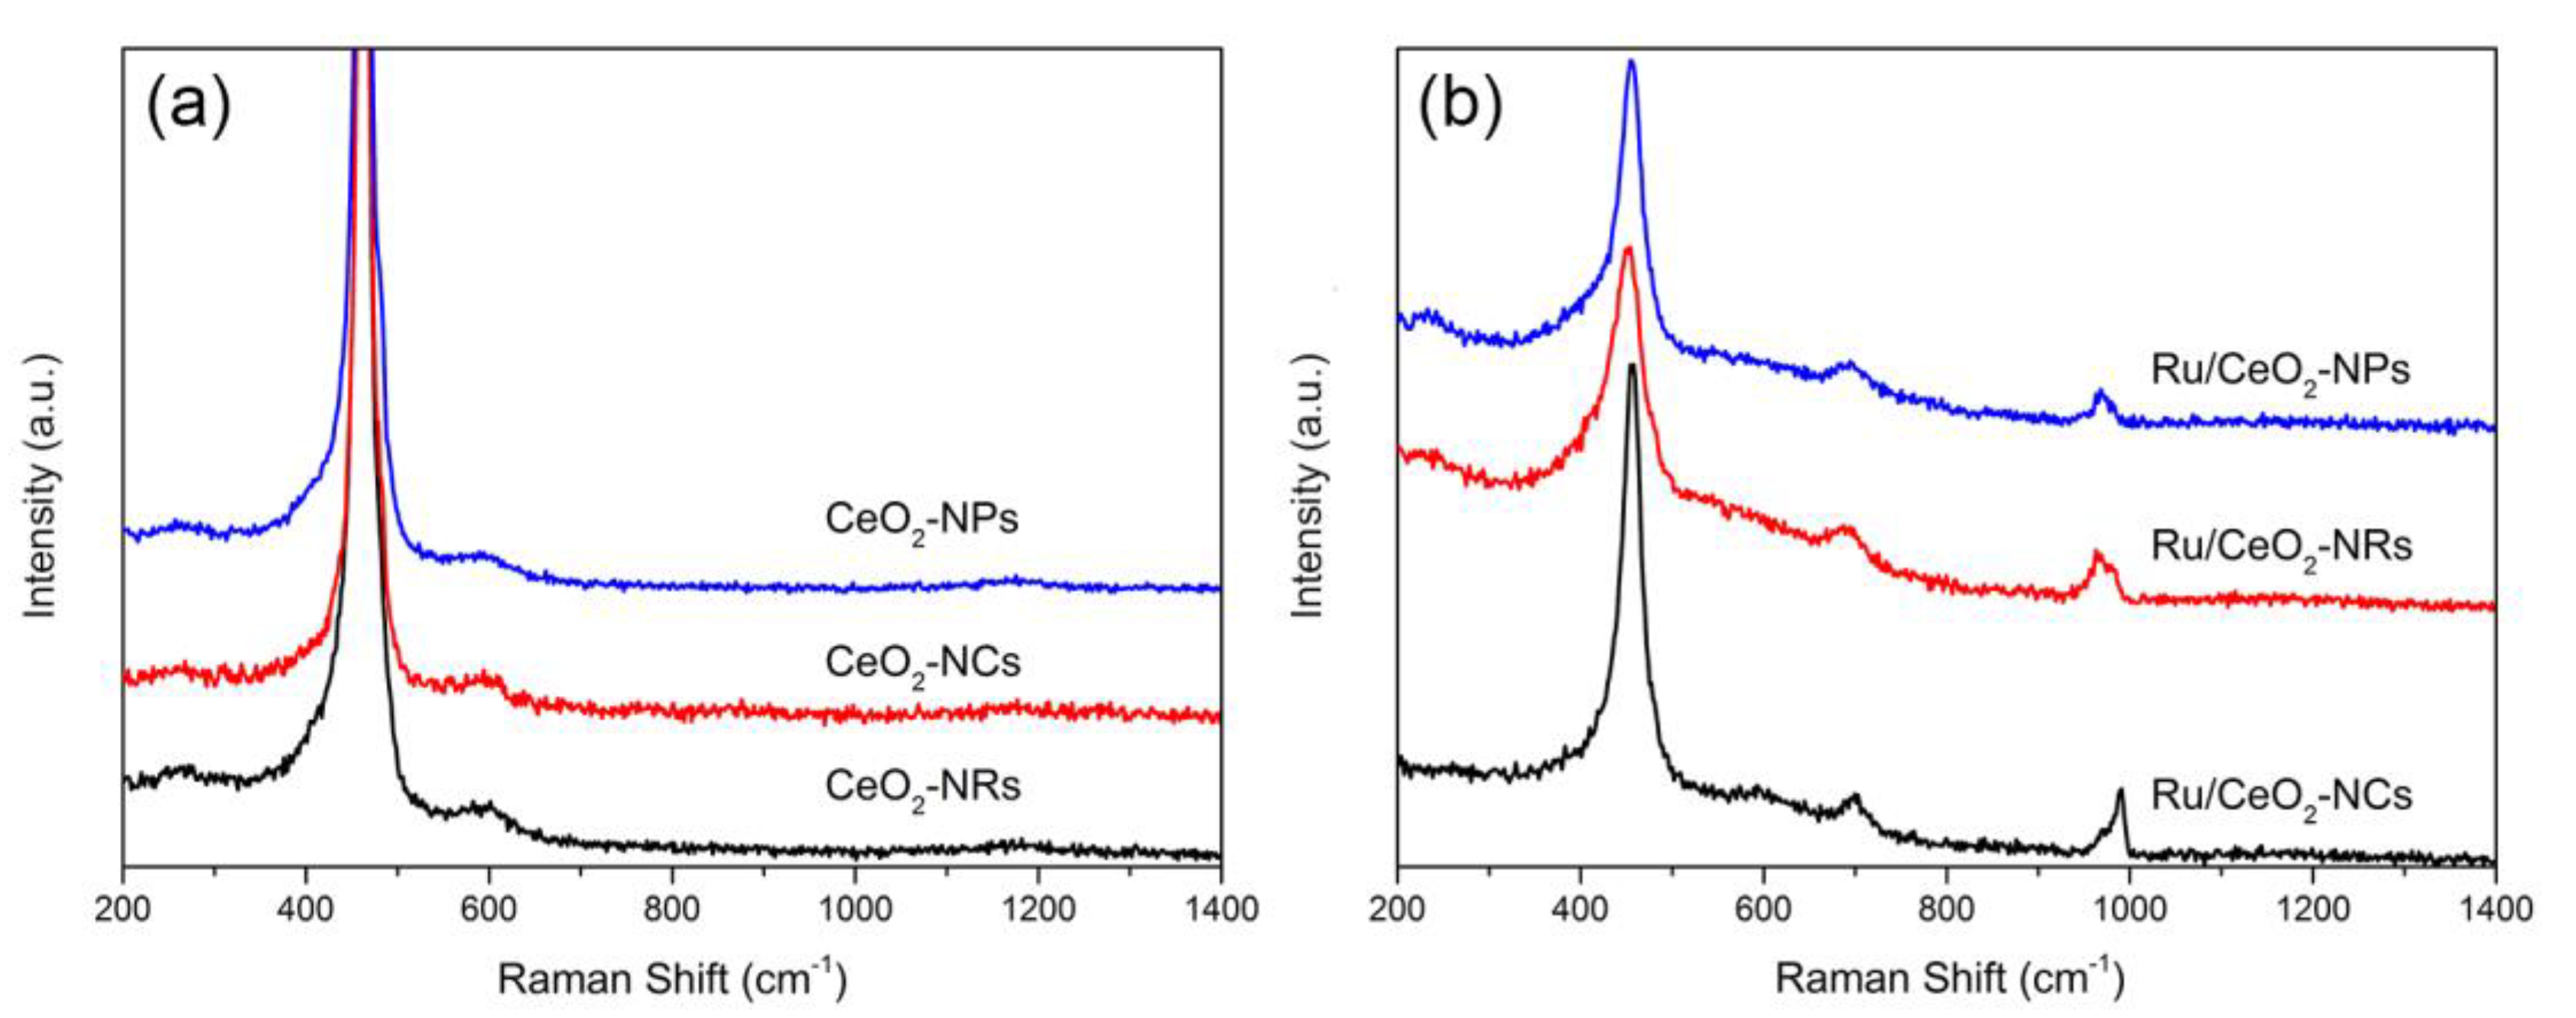
Figure 4 shows Raman spectra of CeO2 supports and Ru/CeO2 catalysts. All three CeO2 supports with different morphologies exhibit a strong peak at around 461 cm−1, which is assigned to the vibration model (F2g) of the CeO2 fluorite phase. Additionally, the other three weak peaks at 257, 594, and 1170 cm−1 are assigned to second-order transverse acoustic (2TA) mode, defect-induced (D) mode, and second-order longitudinal optical (2LO) mode, respectively [35,36,37,38,45]. The relative intensity of I(594+1170)/I461 reflects the intrinsic concentration of defect sites on CeO2 supports, such as oxygen vacancies [38,46]. The calculation results show that the concentration of vacancy sites decreases in the following order of CeO2-NRs > CeO2-NCs > CeO2-NPs (Table 2). This is because the formation energy of vacancy is in a reversed order of surface energies on different facets [43]. After the loading of the Ru species, two new peaks appear at 694 and 968 cm−1 in addition to the peaks of CeO2 supports, which are ascribed to the formation of the Ru–O–Ce bond between metal oxides and supports [38,40]. The relative intensity ratio of I(694+968)/I461 implies that the interaction between Ru and CeO2 supports on Ru/CeO2-NR and Ru/CeO2-NC samples is stronger than that on the Ru/CeO2-NP sample [38], in accordance with the TPR results.
2.1.6. X-ray Photoelectron Spectroscopy (XPS)
Figure 5 shows Ru 3d XPS spectra of Ru/CeO2 samples before H2 reduction. The Ru XPS results of Ru/CeO2-NCs and Ru/CeO2-NPs show three peaks around 277.5, 281.4, and 284.8 eV, which are assigned to Ru0, Ru4+, and Ru6+, respectively. The Ru/CeO2-NRs only exhibit two Ru species, which could be assigned to Ru6+ and Ru4+ [35,38]. Moreover, the content of Ru4+ follows the order: Ru/CeO2-NRs > Ru/CeO2-NCs > Ru/CeO2-NPs (Table 3). The Ru4+ ions may insert into the surface lattice of CeO2 to increase of oxygen vacancy concentration on the CeO2 support [38]. This effect leads to the high concentration of surface oxygen vacancies for Ru/CeO2-NRs and Ru/CeO2-NCs catalysts, and, on the other hand, the decrease of the aggregation of RuO2 particles.
Figure 6 shows the Ce 3d XPS spectra of three Ru/CeO2 samples. There are ten peaks resulting from the pairs of spin orbit doublets, which can be identified through deconvolution. The four peaks around 880.6 (v0), 884.4 (v′), 898.8 (u0), and 901.0 eV (u′) are assigned to Ce3+ species, and six peaks around 882.2 (v), 888.6 (v″), 898.3 (v‴), 900.7 (u), 907.7 (u″), and 916.2 eV (u‴) are assigned to Ce4+ species [36,37,38,47]. The intensity ratio of Ce3+/(Ce3+ + Ce4+) is 22.8%, 21.1%, and 19.8% for Ru/CeO2-NRs, Ru/CeO2-NCs, and Ru/CeO2-NPs, respectively. The appearance of Ce3+ species leads to the formation of oxygen vacancy on the CeO2 surface. The high concentration of Ce3+ on the surface reflects the high concentration of surface oxygen vacancies, which benefits the activation and conversion of reactants in dry reforming of methane reaction [40].
Figure 7 shows O 1s XPS spectra of Ru/CeO2 samples. All three samples mainly exist in two peaks corresponding to two kinds of oxygen species. The peak around 529 eV is ascribed to the oxygen species inside of the CeO2 lattice, marked as the Oα species, and the peak around 531 eV marked Oβ species is mainly ascribed to low coordination oxygen defects on the surface [36,48]. As shown in Table 3, Ru/CeO2-NRs have the highest Oβ/Oα ratio and Ru/CeO2-NPs have the lowest Oβ/Oα ratio. The Oβ/Oα ratio estimated through deconvolution shows that the content of surface oxygen defects on CeO2 is morphology-dependent.
2.2. Catalytic Performance for the Dry Reforming of Methane
The catalytic performance of three CeO2-supported Ru catalysts in the dry reforming of methane under the reaction temperature of 500 °C and 650 °C is shown in Figure 8 and Figure 9. Compared to high CO2 conversion, low CH4 conversion is due to the simultaneous occurrence of a reverse water–gas shift reaction. Moreover, the catalytic activities for all three catalysts remain relatively stable after a 240-min reaction. The conversion trends of CO2 and CH4 are followed by Ru/CeO2-NRs (26.5% of CO2 and 12.3% of CH4) ≈ Ru/CeO2-NCs (26.0% of CO2 and 13.6% of CH4) > Ru/CeO2-NPs (19.3% of CO2 and 6.2% of CH4) after a 240-min reaction process. Both CO2 and CH4 conversions increase for all three catalysts when increasing the temperature to 650 °C (Figure 9). The conversions of CO2 and CH4 over Ru/CeO2-NR and Ru/CeO2-NC samples are much higher than those for Ru/CeO2-NPs.
From the above results, CeO2 exposed with a high energy facet of (110) and (100) have a high catalytic activity in the methane dry reforming reaction. This is due to the strong interaction between Ru species and supports exposed (110) and (100) facets, and the (110) and (100) facets on the CeO2 with high oxygen vacancy concentration benefit the activation of CO2 during the reaction.
3. Experimental Section
3.1. Preparation of CeO2 Samples
Morphology-controlled CeO2 samples were synthesized using the hydrothermal method. For the preparation of CeO2-NCs and CeO2-NPs, 1.82 g of Ce(NO3)3·6H2O was dissolved in 40 mL of distilled water and 16.8 g of NaOH for CeO2-NCs or 0.33 g of NaOH for CeO2-NPs were dissolved in 30 mL of distilled water. The Ce(NO3)3 solution was added into the NaOH solution dropwisely under stirring and stirred for further 30 min to form a milky slurry. Then, the milky slurry was transferred into a 100-mL stainless steel autoclave and hydrothermally treated at 180 °C for 24 h. After the autoclave was cooled to room temperature naturally, the precipitates were separated by centrifugation, washed with distilled water thoroughly, dried at 60 °C for 12 h, and calcined at 500 °C with a heating rate of 1 °C min−1 from room temperature for 4 h to obtain the CeO2-NCs and CeO2-NPs. The synthesis procedure of CeO2-NRs was the same as that of CeO2-NCs, except that the hydrothermal treatment temperature was 100 °C.
3.2. Preparation of Ru/CeO2 Catalysts
The Ru/CeO2 catalysts were prepared using the precipitation and deposition method. A total of 1.0 g of CeO2 was added into a 20 mL of solution containing 0.015 g of RuCl3·3H2O and stirred for 30 min. Then, 0.1 M NH3·H2O aqueous solution was added to adjust the pH of the suspension up to 8.0, and then the suspension was aged at room temperature for 3 h. The catalyst in suspension was separated by centrifugation, washed with distilled water, dried at 60 °C for 12 h, and calcined at 500 °C with a heating rate of 1 °C ·min−1 from room temperature for 4 h. The loading of metal Ru in the catalysts is 3 wt.%.
3.3. Catalyst Characterization
Transmission electron microscopy (TEM) and high-resolution TEM (HRTEM) images were obtained on a JEM-2011 transmission electron microscope (JOEL, Japan) and a FEI Tecnai G2 F20 S-Twin field-emission transmission electron microscope (Hillsboro, OR, USA, respectively. X-ray diffraction (XRD) patterns were obtained on a Bruker D8 Advance diffractometer (Karlsruhe, Germany), using Cu Kα radiation (λ = 1.5418 Å) at 40 kV and 40 mA, a scanning rate of 5o·min−1, a step size of 0.02°, and a 2θ angle ranging from 20° to 80°. The N2 adsorption–desorption characterization was performed using a Micromeritics Tristar 3000 apparatus (Quantachrome, Boynton Beach, FL, USA). Prior to the adsorption measurements, the sample was outgassed at 250 °C for 3 h under vacuum. The specific surface areas were calculated using the Brunauer–Emmett–Teller (BET) method. Elemental analysis was performed on a Thermo Elemental IRIS Intrepid inductively coupled plasma atomic emission spectrometer (ICP-AES, Thermo Elemental, Waltham, MA, USA). X-ray photoelectron spectroscopy (XPS) was performed on a Versa Probe PHI 5000 instrument with Al Kα radiation (Versa Probe, Amreica). The binding energies were calibrated using the containment carbon (C1s = 284.6 eV). H2-temperature programmed reduction (H2-TPR) was performed using a Micromeritics ChemiSorb 2720 apparatus with a thermal conductivity detector (TCD, Micromeritics, Chanhassen, MN, USA). Before measurement, 45.0 mg of sample was placed in a U-shape quartz tube and degassed under flowing He at 200 °C for 2 h, cooled to room temperature, and then switched gas to 10% H2/Ar. The sample was reduced in a stream of 10% H2/Ar (50 mL·min−1) with a heating rate of 10 °C min−1 from room temperature up to 900 °C. CO-temperature programmed desorption (CO-TPD) was performed to determine the dispersion of Ru particles using a Micromeritics ChemiSorb 2720 apparatus with TCD (Micromeritics, Chanhassen, MN, USA). The Ru:CO molar ratio in the chemisorption was taken as 1 [49]. The sample (45.0 mg) was firstly reduced in a stream of 10% H2/Ar (50 mL·min−1) at 500 °C for 2 h. Subsequently, the reduced sample was purged in He (50 mL min−1) at 500 °C for 30 min to remove excess H2 and then cooled down to 40 °C for adsorption of CO for 30 min, and then gas was switched to He to keep 30 min at 40 °C to remove excess CO. Finally, the samples were heated in He with a temperature ramp of 10 °C min−1.
3.4. Catalytic Activity Measurements
The catalytic measurements for dry reforming of methane were carried out in a quartz tube with the inner diameter of 6 mm using a fixed-bed reactor system at atmospheric pressure. The gas flow rate was controlled by mass-flow controllers. A total of 30 mg of 40–60 mesh catalyst was mixed with 250 mg of 40–60 mesh inert quartz sand and placed into the reactor. Before the reaction, the catalyst was reduced in a flow of H2 (30 mL·min−1) at 500 °C for 2 h. Then, the reaction gas mixture consisting of CO2, CH4, and N2 (CO2:CH4:N2 volume ratio of 1:1:3) was introduced into the reaction with the gas hourly space velocity (GHSV) of 24,000 mL·h−1·g−1 (CO2 + CH4 + N2), and the effluent product gases were cooled in an ice-water bath and analyzed by online gas chromatography with a thermal conductivity detector (TCD) using a TDX-01 packed column. The reaction activity of the methane dry reforming reaction was tested at 500 °C and 650 °C.
4. Conclusions
In this work, a series of CeO2 supports, CeO2-NRs, CeO2-NCs, and CeO2-NPs, with different exposed facets were synthesized via the hydrothermal method; the metal Ru was loaded on the CeO2 supports as catalyst for the dry reforming of methane. The CeO2-NR and CeO2-NC supports with mainly (110) and (100) exposed facets contain higher oxygen vacancy concentration than the CeO2-NP supports with (111) exposed facets. The high energy surface structure of the CeO2-NRs and CeO2-NCs enhances the interaction between Ru and CeO2. The catalytic results of the three catalysts for dry reforming of methane are related with the surface energy of the CeO2 supports and the Ru/CeO2-NR and Ru/CeO2-NC catalysts perform a higher catalytic activity than Ru/CeO2-NPs, due to the former containing higher oxygen vacancy concentration.
Supplementary Materials
The following are available online, Figure S1: Ce, Ru, and O mapping with EDS spectrum of the Ru/CeO2-NR catalyst. Figure S2: Ce, Ru, and O mapping with EDS spectrum of the Ru/CeO2-NC catalyst. Figure S3: Ce, Ru, and O mapping with EDS spectrum of the NRu/CeO2-NP catalyst.
Author Contributions
Conceptualization, B.Y. and H.H.; Data curation, Y.R. and Y.F.; Formal analysis, L.H. and Y.F.; Investigation, L.H.; Methodology, L.H. and B.Y.; Project administration, H.H.; Software, Y.R.; Supervision, H.H.; Writing—original draft, L.H.; Writing—review and editing, B.Y., S.C.E.T., and H.H.
Funding
The authors acknowledge the financial supports from the National Natural Science Foundation of China (91645201, 21473036 and 21673046) and the Ministry of Science and Technology (2017YFB0602204).
Conflicts of Interest
The authors declare no conflict of interest.
References
- Florides, G.A.; Christodoulides, P.; Messaritis, V. Reviewing the effect of CO2 and the sun on global climate. Renew. Sustain. Energy Rev. 2013, 26, 639–651. [Google Scholar] [CrossRef]
- Ghoniem, A.F. Needs, resources and climate change: Clean and efficient conversion technologies. Prog. Energy Combust. Sci. 2011, 37, 15–51. [Google Scholar] [CrossRef]
- Appel, A.M.; Bercaw, J.E.; Bocarsly, A.B.; Dobbek, H.; DuBois, D.L.; Dupuis, M.; Ferry, J.G.; Fujita, E.; Hille, R.; Kenis, P.J.A.; et al. Frontiers, opportunities, and challenges in biochemical and chemical catalysis of CO2 fixation. Chem. Rev. 2013, 113, 6621–6658. [Google Scholar] [CrossRef] [PubMed]
- Abdallah, D.; Dang, V.Q.; Lourdes, F.V.; Enas, N.; Mohammad, R.M.A.-Z. Applications of fly ash for CO2 capture, utilization, and storage. J. CO2 Util. 2019, 29, 82–102. [Google Scholar]
- Aresta, M.; Dibenedetto, A.; Angelini, A. The changing paradigm in CO2 utilization. J. CO2 Util. 2013, 3–4, 65–73. [Google Scholar] [CrossRef]
- Kawi, S.; Kathiraser, Y.; Ni, J.; Oemar, U.; Li, Z.; Saw, E.T. Progress in synthesis of highly active and stable nickel-based catalysts for carbon dioxide reforming of methane. ChemSusChem 2015, 8, 3556–3575. [Google Scholar] [CrossRef] [PubMed]
- Spallina, V.; Melchiori, T.; Gallucci, F.; Annaland, M.v.S. Auto-thermal reforming using mixed ion-electronic conducting ceramic membranes for a small-scale H2 production plant. Molecules 2015, 20, 4998–5023. [Google Scholar] [CrossRef]
- Abbas, H.F.; Daud, W.M.A.W. Hydrogen production by methane decomposition: A review. Int. J. Hydrogen Energy 2010, 35, 1160–1190. [Google Scholar] [CrossRef]
- Wang, J.; Yu, H.; Ma, Z.; Zhou, S. Enhanced stability of CaO and/or La2O3 promoted Pd/Al2O3 egg-shell catalysts in partial oxidation of methane to syngas. Molecules 2013, 18, 8289–8297. [Google Scholar] [CrossRef]
- Jiao, F.; Li, J.; Pan, X.; Xiao, J.; Li, H.; Ma, H.; Wei, M.; Pan, Y.; Zhou, Z.; Li, M.; et al. Selective conversion of syngas to light olefins. Science 2016, 351, 1065–1068. [Google Scholar] [CrossRef]
- Ha, K.-S.; Bae, J.W.; Woo, K.-J.; Jun, K.-W. Efficient utilization of greenhouse gas in a gas-to-liquids process combined with carbon dioxide reforming of methane. Environ. Sci. Technol. 2010, 44, 1412–1417. [Google Scholar] [CrossRef] [PubMed]
- Pakhare, D.; Spivey, J. A review of dry (CO2) reforming of methane over noble metal catalysts. Chem. Soc. Rev. 2014, 43, 7813–7837. [Google Scholar] [CrossRef] [PubMed]
- Wang, Y.; Yao, L.; Wang, S.; Mao, D.; Hu, C. Low-temperature catalytic CO2 dry reforming of methane on Ni-based catalysts: A review. Fuel Process. Technol. 2018, 169, 199–206. [Google Scholar] [CrossRef]
- Zhao, Y.; Pan, Y.X.; Xie, Y.B.; Liu, C.J. Carbon dioxide reforming of methane over glow discharge plasma-reduced Ir/Al2O3 catalyst. Catal. Commun. 2008, 9, 1558–1562. [Google Scholar] [CrossRef]
- Singh, S.A.; Madras, G. Sonochemical synthesis of Pt, Ru doped TiO2 for methane reforming. Appl. Catal. A 2016, 518, 102–114. [Google Scholar] [CrossRef]
- Derk, A.R.; Moore, G.M.; Sharma, S.; McFarland, E.W.; Metiu, H. Catalytic dry reforming of methane on ruthenium-doped ceria and ruthenium supported on ceria. Top. Catal. 2014, 57, 118–124. [Google Scholar] [CrossRef]
- Whang, H.S.; Choi, M.S.; Lim, J.; Kim, C.; Heo, I.; Chang, T.-S.; Lee, H. Enhanced activity and durability of Ru catalyst dispersed on zirconia for dry reforming of methane. Catal. Today 2017, 293, 122–128. [Google Scholar] [CrossRef]
- Cai, W.; Ye, L.; Zhang, L.; Ren, Y.; Yue, B.; Chen, X.; He, H. Highly dispersed nickel-containing mesoporous silica with superior stability in carbon dioxide reforming of methane: The effect of anchoring. Materials 2014, 7, 2340–2355. [Google Scholar] [CrossRef]
- Shang, Z.; Li, S.; Li, L.; Liu, G.; Liang, X. Highly active and stable alumina supported nickel nanoparticle catalysts for dry reforming of methane. Appl. Catal. B 2017, 201, 302–309. [Google Scholar] [CrossRef]
- Jafarbegloo, M.; Tarlani, A.; Mesbah, A.W.; Muzart, J.; Sahebdelfar, S. NiO-MgO solid solution prepared by sol-gel method as precursor for Ni/MgO methane dry reforming catalyst: Effect of calcination temperature on catalytic performance. Catal. Lett. 2016, 146, 238–248. [Google Scholar] [CrossRef]
- Wei, J.M.; Xu, B.Q.; Li, J.L.; Cheng, Z.X.; Zhu, Q.M. Highly active and stable Ni/ZrO2 catalyst for syngas production by CO2 reforming of methane. Appl. Catal. A 2000, 196, L167–L172. [Google Scholar] [CrossRef]
- Carrara, C.; Munera, J.; Lombardo, E.A.; Cornaglia, L.M. Kinetic and stability studies of Ru/La2O3 used in the dry reforming of methane. Top. Catal. 2008, 51, 98–106. [Google Scholar] [CrossRef]
- Takanabe, K.; Nagaoka, K.; Nariai, K.; Aika, K. Influence of reduction temperature on the catalytic behavior of Co/TiO2 catalysts for CH4/CO2 reforming and its relation with titania bulk crystal structure. J. Catal. 2005, 230, 75–85. [Google Scholar] [CrossRef]
- Lovell, E.C.; Scott, J.; Amal, R. Ni-SiO2 catalysts for the carbon dioxide reforming of methane: Varying support properties by flame spray pyrolysis. Molecules 2015, 20, 4594–4609. [Google Scholar] [CrossRef] [PubMed]
- Boudart, M. Catalysis by supported metals. Adv. Catal. 1969, 20, 153–166. [Google Scholar]
- Wang, H.Y.; Ruckenstein, E. Carbon dioxide reforming of methane to synthesis gas over supported rhodium catalysts: The effect of support. Appl. Catal. A 2000, 204, 143–152. [Google Scholar] [CrossRef]
- Fu, Q.; Weber, A.; Flytzani-Stephanopoulos, M. Nanostructured Au-CeO2 catalysts for low-temperature water-gas shift. Catal. Lett. 2001, 77, 87–95. [Google Scholar] [CrossRef]
- Kurnatowska, M.; Mista, W.; Mazur, P.; Kepinski, L. Nanocrystalline Ce1-xRuxO2—Microstructure, stability and activity in CO and soot oxidation. Appl. Catal. B 2014, 148, 123–135. [Google Scholar] [CrossRef]
- Devaiah, D.; Reddy, L.H.; Park, S.-E.; Reddy, B.M. Ceria-zirconia mixed oxides: Synthetic methods and applications. Catal. Rev. Sci. Eng. 2018, 60, 177–277. [Google Scholar] [CrossRef]
- Xu, S.; Yan, X.; Wang, X. Catalytic performances of NiO-CeO2 for the reforming of methane with CO2 and O2. Fuel 2006, 85, 2243–2247. [Google Scholar] [CrossRef]
- Hou, T.; Yu, B.; Zhang, S.; Xu, T.; Wang, D.; Cai, W. Hydrogen production from ethanol steam reforming over Rh/CeO2 catalyst. Catal. Commun. 2015, 58, 137–140. [Google Scholar] [CrossRef]
- Fu, Y.; Wu, Y.; Cai, W.; Yue, B.; He, y. Promotional effect of cerium on nickel-containing mesoporous silica for carbon dioxide reforming of methane. Sci. Chin. Chem. 2015, 58, 148–155. [Google Scholar] [CrossRef]
- Liao, Y.; He, L.; Man, C.; Chen, L.; Fu, M.; Wu, J.; Ye, D.; Huang, B. Diameter-dependent catalytic activity of ceria nanorods with various aspect ratios for toluene oxidation. Chem. Eng. J. 2014, 256, 439–447. [Google Scholar] [CrossRef]
- Raju, G.; Devaiah, D.; Reddy, P.S.; Rao, K.N.; Reddy, B.M. Hydrogenolysis of bioglycerol to 1,2-propanediol over Ru/CeO2 catalysts: Influence of CeO2 characteristics on catalytic performance. Appl. Petrochem. Res. 2014, 4, 297–304. [Google Scholar] [CrossRef]
- Li, Y.; Wei, Z.; Gao, F.; Kovarik, L.; Peden, C.H.F.; Wang, Y. Effects of CeO2 support facets on VOx/CeO2 catalysts in oxidative dehydrogenation of methanol. J. Catal. 2014, 315, 15–24. [Google Scholar] [CrossRef]
- Singhania, N.; Anumol, E.A.; Ravishankar, N.; Madras, G. Influence of CeO2 morphology on the catalytic activity of CeO2-Pt hybrids for CO oxidation. Dalton Trans. 2013, 42, 15343–15354. [Google Scholar] [CrossRef] [PubMed]
- Han, J.; Meeprasert, J.; Maitarad, P.; Nammuangruk, S.; Shi, L.; Zhang, D. Investigation of the facet-dependent catalytic performance of Fe2O3/CeO2 for the selective catalytic reduction of NO with NH3. J. Phys. Chem. C 2016, 120, 1523–1533. [Google Scholar] [CrossRef]
- Huang, H.; Dai, Q.; Wang, X. Morphology effect of Ru/CeO2 catalysts for the catalytic combustion of chlorobenzene. Appl. Catal. B 2014, 158, 96–105. [Google Scholar] [CrossRef]
- Gawade, P.; Mirkelamoglu, B.; Ozkan, U.S. The role of support morphology and impregnation medium on the water gas shift activity of ceria-supported copper catalysts. J. Phys. Chem. C 2010, 114, 18173–18181. [Google Scholar] [CrossRef]
- Wang, F.; Li, C.; Zhang, X.; Wei, M.; Evans, D.G.; Duan, X. Catalytic behavior of supported Ru nanoparticles on the {100}, {110}, and {111} facet of CeO2. J. Catal. 2015, 329, 177–186. [Google Scholar] [CrossRef]
- Wang, Z.L.; Feng, X.D. Polyhedral shapes of CeO2 nanoparticles. J. Phys. Chem. B 2003, 107, 13563–13566. [Google Scholar] [CrossRef]
- Wang, R.; Wang, Y.; Ren, M.; Sun, G.; Gao, D.; Chong, Y.R.C.; Li, X.; Chen, G. Effect of ceria morphology on the catalytic activity of Ru/ceria for the dehydrogenation of ammonia borane. Int. J. Hydrogen Energy 2017, 42, 6757–6764. [Google Scholar] [CrossRef]
- Wang, Z.L. Transmission electron microscopy of shape-controlled nanocrystals and their assemblies. J. Phys. Chem. B 2000, 104, 1153–1175. [Google Scholar] [CrossRef]
- Sayle, T.X.T.; Parker, S.C.; Sayle, D.C. Oxidising CO to CO2 using ceria nanoparticles. Phys. Chem. Chem. Phys. 2005, 7, 2936–2941. [Google Scholar] [CrossRef] [PubMed]
- Liu, L.; Yao, Z.; Deng, Y.; Gao, F.; Liu, B.; Dong, L. Morphology and crystal-plane effects of nanoscale ceria on the activity of CuO/CeO2 for NO reduction by CO. ChemCatChem 2011, 3, 978–989. [Google Scholar] [CrossRef]
- Schierbaum, K.D. Ordered ultra-thin cerium oxide overlayers on Pt(111) single crystal surfaces studied by LEED and XPS. Surf. Sci. 1998, 399, 29–38. [Google Scholar] [CrossRef]
- YAO, H.C.; YAO, Y.F.Y. Ceria in automotive exhaust catalysts. J. Catal. 1984, 86, 254–265. [Google Scholar] [CrossRef]
- Weber, W.H.; Bass, K.C.; McBride, J.R. Raman study of CeO2: Second-order scattering, lattice dynamics, and particle-size effects. Phys. Rev. B 1993, 48, 179–184. [Google Scholar] [CrossRef]
- Ji, S.; Xiao, Z.; Zhang, H.; Li, L.; Li, G.; Wang, L.; Liu, G. Catalytic steam reforming of n-dodecane over high surface area Ce0.75Zr0.25O2 supported Ru catalysts. Int. J. Hydrogen Energy 2017, 42, 29484–29497. [Google Scholar] [CrossRef]
Sample Availability: Samples of the compounds are available from the authors. |
Figure 1.
TEM images of (a) CeO2-NRs, (b) CeO2-NCs, and (c) CeO2-NPs; high-resolution transmission electron microscopy (HRTEM) images of (d) CeO2-NRs, (e) CeO2-NCs, and (f) CeO2-NPs; TEM images of (g) Ru/CeO2-NRs, (h) Ru/CeO2-NCs, and (i) Ru/CeO2-NPs.
Figure 1.
TEM images of (a) CeO2-NRs, (b) CeO2-NCs, and (c) CeO2-NPs; high-resolution transmission electron microscopy (HRTEM) images of (d) CeO2-NRs, (e) CeO2-NCs, and (f) CeO2-NPs; TEM images of (g) Ru/CeO2-NRs, (h) Ru/CeO2-NCs, and (i) Ru/CeO2-NPs.

Figure 2.
XRD patterns of (a) CeO2-NRc, (b) CeO2-NCs, (c) CeO2-NPs, (d) Ru/CeO2-NRs, (e) Ru/CeO2-NCs, and (f) Ru/CeO2-NPs.
Figure 2.
XRD patterns of (a) CeO2-NRc, (b) CeO2-NCs, (c) CeO2-NPs, (d) Ru/CeO2-NRs, (e) Ru/CeO2-NCs, and (f) Ru/CeO2-NPs.

Figure 3.
H2-temperature programmed reduction (H2-TPR) curves of (a) CeO2 samples (b) Ru/CeO2 samples.
Figure 3.
H2-temperature programmed reduction (H2-TPR) curves of (a) CeO2 samples (b) Ru/CeO2 samples.

Figure 4.
Raman spectra of (a) CeO2 samples (b) Ru/CeO2 samples.

Figure 5.
Ru 3d X-ray photoelectron spectroscopy (XPS) spectra of (a) Ru/CeO2-NRs, (b) Ru/CeO2-NCs, and (c) Ru/CeO2-NPs.
Figure 5.
Ru 3d X-ray photoelectron spectroscopy (XPS) spectra of (a) Ru/CeO2-NRs, (b) Ru/CeO2-NCs, and (c) Ru/CeO2-NPs.
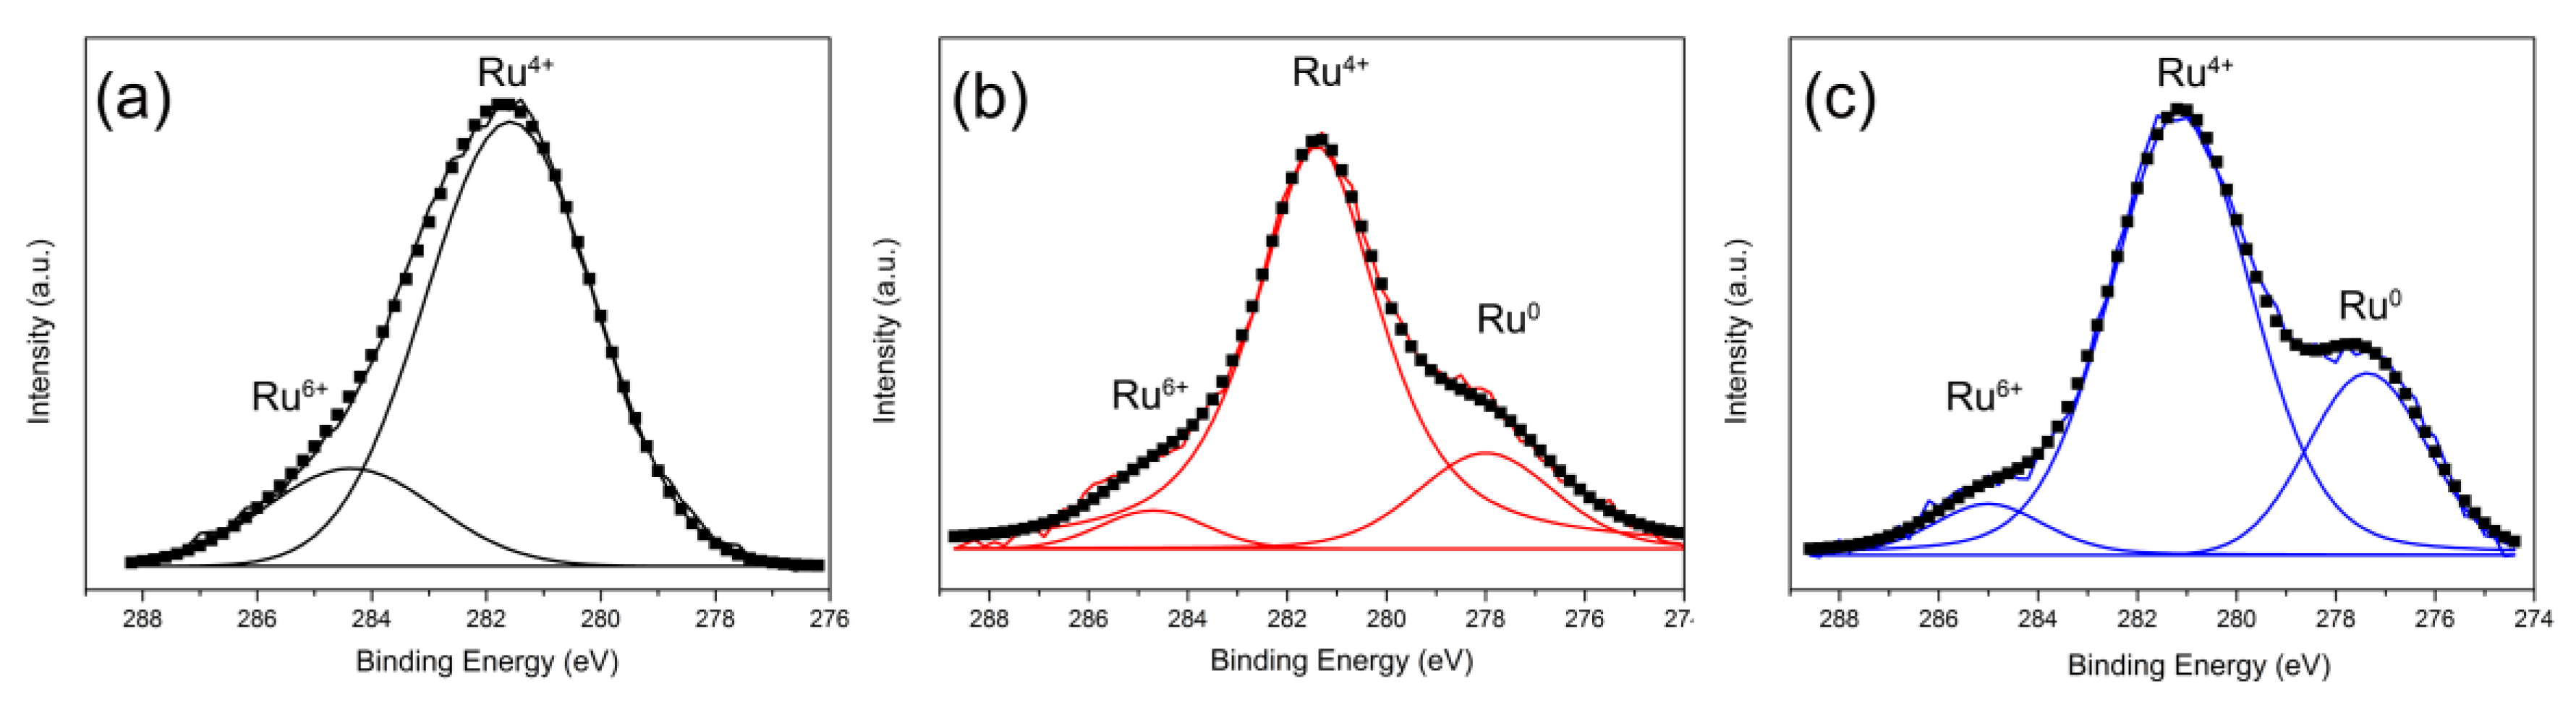
Figure 6.
Ce 3d XPS spectra of (a) Ru/CeO2-NRs, (b) Ru/CeO2-NCs, and (c) Ru/CeO2-NPs.

Figure 7.
O 1s XPS spectra of (a) Ru/CeO2-NRs, (b) Ru/CeO2-NCs, and (c) Ru/CeO2-NPs.
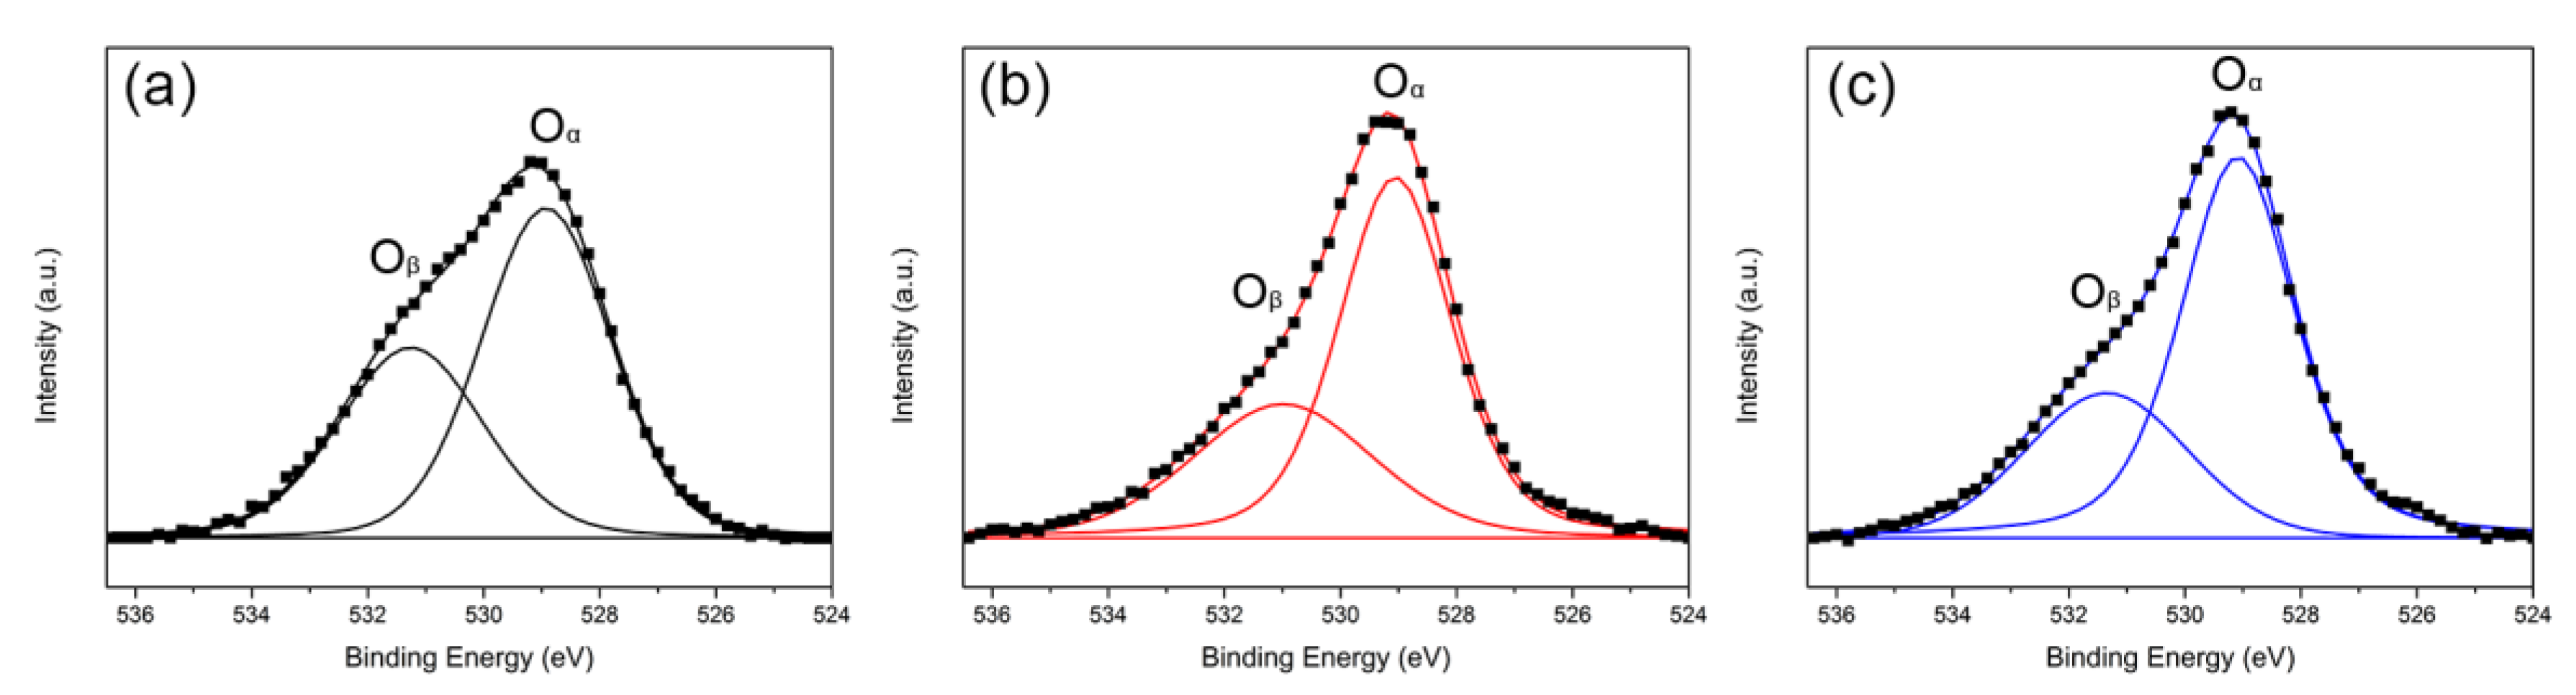
Figure 8.
The CH4 conversion (a) and CO2 conversions (b) of three Ru/CeO2 samples versus time at 500 °C.
Figure 8.
The CH4 conversion (a) and CO2 conversions (b) of three Ru/CeO2 samples versus time at 500 °C.
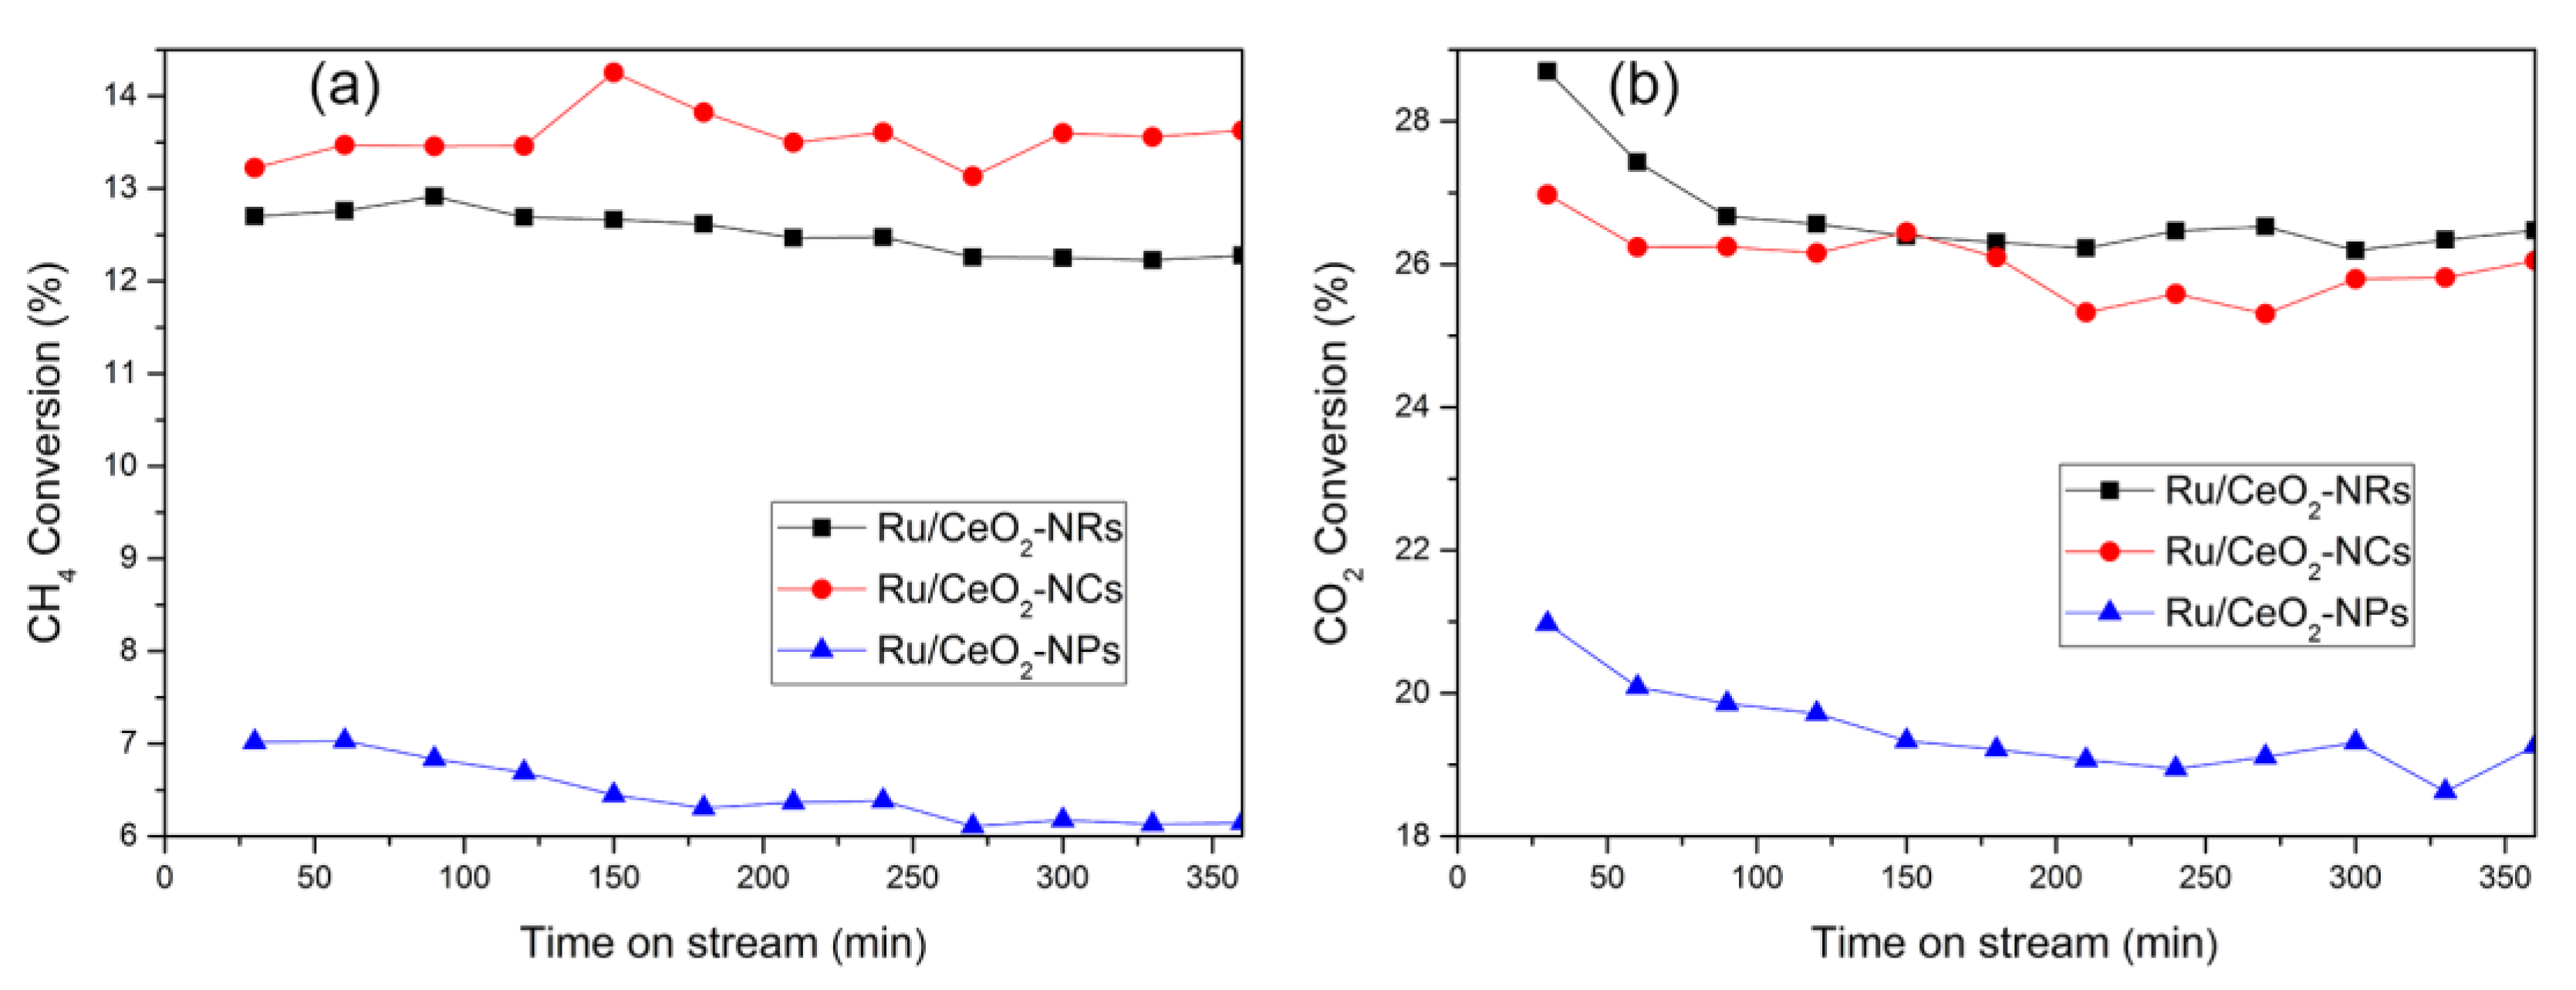
Figure 9.
The CH4 conversion (a) and CO2 conversions (b) of three Ru/CeO2 samples versus time at 650 °C.
Figure 9.
The CH4 conversion (a) and CO2 conversions (b) of three Ru/CeO2 samples versus time at 650 °C.


Table 1.
Physical properties of various samples.
| Sample | Specific Surface Area a (m2·g−1) | Particle Size b (nm) | Mean Sizes c (nm) | Ru d (wt.%) | Ru Dispersion e (%) | |
|---|---|---|---|---|---|---|
| CeO2-NRs | 87.1 | (8 ± 2) × (50 − 100) | 13.6 | - | ||
| CeO2-NCs | 31.7 | 26 ± 15 | 23.0 | - | ||
| CeO2-NPs | 67.4 | 13 ± 5 | 13.9 | - | ||
| Ru/CeO2-NRs | 84.9 | (7 ± 3) × (20 − 100) | 12.1 | 2.4 | 54 | |
| Ru/CeO2-NCs | 30.1 | 24 ± 15 | 23.6 | 2.4 | 59 | |
| Ru/CeO2-NPs | 65.8 | 12 ± 5 | 13.7 | 2.3 | 35 | |
a Surface area determined from N2 isotherm. b Calculated for about 100 nanoparticles from the TEM images. c Estimated by Scherrer equation, applied to the (111) reflection on fluorite CeO2. d Analyzed by inductively coupled plasma atomic emission spectrometer (ICP-AES). e calculated based on the CO-TPD results.
Table 2.
Raman spectral data of CeO2 and Ru/CeO2 samples.
| Sample | I(594 + 1170)/I461 | I(694 + 968)/I461 |
|---|---|---|
| CeO2-NRs | 0.116 | - |
| CeO2-NCs | 0.102 | - |
| CeO2-NPs | 0.057 | - |
| Ru/CeO2-NRs | - | 0.234 |
| Ru/CeO2-NCs | - | 0.187 |
| Ru/CeO2-NPs | - | 0.177 |
Table 3.
XPS data of Ru/CeO2-NR, Ru/CeO2-NC, and Ru/CeO2-NP samples.
| Samples | Ru4+ (%) | Ce3+/(Ce3+ + Ce4+) (%) | Oβ/Oα |
|---|---|---|---|
| Ru/CeO2-NRs | 80.9 | 22.8 | 0.40 |
| Ru/CeO2-NCs | 78.9 | 21.1 | 0.36 |
| Ru/CeO2-NPs | 22.4 | 19.8 | 0.32 |
© 2019 by the authors. Licensee MDPI, Basel, Switzerland. This article is an open access article distributed under the terms and conditions of the Creative Commons Attribution (CC BY) license (http://creativecommons.org/licenses/by/4.0/).
Share and Cite
MDPI and ACS Style
He, L.; Ren, Y.; Fu, Y.; Yue, B.; Tsang, S.C.E.; He, H. Morphology-Dependent Catalytic Activity of Ru/CeO2 in Dry Reforming of Methane. Molecules 2019, 24, 526. https://doi.org/10.3390/molecules24030526
AMA Style
He L, Ren Y, Fu Y, Yue B, Tsang SCE, He H. Morphology-Dependent Catalytic Activity of Ru/CeO2 in Dry Reforming of Methane. Molecules. 2019; 24(3):526. https://doi.org/10.3390/molecules24030526
Chicago/Turabian StyleHe, Lulu, Yuanhang Ren, Yingyi Fu, Bin Yue, Shik Chi Edman Tsang, and Heyong He. 2019. "Morphology-Dependent Catalytic Activity of Ru/CeO2 in Dry Reforming of Methane" Molecules 24, no. 3: 526. https://doi.org/10.3390/molecules24030526