Article

Metal-Ligand Recognition Index Determination by NMR Proton Relaxation Study

1
Department of Biotechnology, Chemistry and Pharmacy, University of Siena, Via Aldo Moro 2, 53100 Siena, Italy
2
Centre for Colloid and Surface Science (CSGI), University of Florence, Via della Lastruccia 3, 50019 Sesto Fiorentino, Firenze, Italy
3
National Interuniversity Consortium of Materials Science and Technology (INSTM), Via G. Giusti 9, 50121 Firenze, Italy
4
Operative Unit, University of Siena, Campo Verde, Calabria, 53100 Siena, Italy
*
Authors to whom correspondence should be addressed.
Molecules 2019, 24(6), 1050; https://doi.org/10.3390/molecules24061050
Submission received: 27 February 2019 / Revised: 14 March 2019 / Accepted: 15 March 2019 / Published: 17 March 2019
(This article belongs to the Special Issue Anti-Inflammatory and Anti-Allergy Agents in Medicinal Chemistry-II)

Abstract

:
In this study, we developed and validated a new proposed parameter quantifying the interaction strength between natural and/or synthetic molecules with paramagnetic metal ions. The Metal ion Recognition Index, Miri, is a quantitative parameter to describe the proton environment and to define their involvement in the inner and/or outer sphere of the paramagnetic metal ion. The method is based on the analysis of NMR proton spin-lattice relaxation rates of a specific ligand in both the diamagnetic and paramagnetic conditions. The proposed procedure is also useful to calculate the ligand proton spin-lattice relaxation rate in the paramagnetic bound conditions, which is typically very difficult to determine experimentally. Miri was used to compare the ligand proton involvement toward different paramagnetic species, in particular the Copper(II)-Piroxicam system. Copper(II)-Piroxicam complex is one of the most active anti-inflammatory and anti-arthritic species. Miri provides an opportunity to improve our knowledge of metal-ligand complexes that play a fundamental role in bioinorganic interactions.

1. Introduction

Theoretical and experimental studies on metal-ligand interactions are an important field of research [1,2,3,4,5]. Metal-ligand complexes are very important for their applications in medicine, biology, chemistry, agriculture, etc. [6,7,8,9,10,11,12,13]. The formation of complexes between bioactive substances and metal ions, can produce different outcomes: (i) increase the pharmacological effects [14,15], (ii) reduce possible toxic side effects [16,17], (iii) modulate biological activities of both ligands and metal ions [18,19], (iv) contribute to the delivery of the bioactive substances towards their biological targets [20,21]. In the latter case, the metal complexing represents one of the possible methods to couple synergic pharmacological contributions and more efficient delivery systems (e.g., the formation of molecular clusters [22], the encapsulation of the metal complex into lipid or liposomal formulations [23,24,25], and the inclusion of complexes in carrier based hydrogels [26].
Natural and synthetic anti-inflammatory molecules have been widely investigated to find more effective compounds being able to interact with specific receptor sites of the biochemical pathway involved in the activation and maintenance of the inflammatory processes [27,28,29,30]. Metal complexes of the most active anti-inflammatory molecules are good candidates to become potent inhibitors of inflammation processes. The presence of a paramagnetic center in solution was used in the past [31,32,33,34,35,36,37], and more recently to investigate the structural and dynamical properties of metal-biopolymer complexes of peptides and proteins [38,39,40,41,42,43,44,45,46,47].
In the present study, a new method to determine the strength of the interaction between a ligand and a paramagnetic metal ion in solution, was developed and validated. The method is based on the analysis of the paramagnetic contributions to the ligand NMR proton spin-lattice relaxation rates. The experimental results obtained in both diamagnetic and paramagnetic systems were used with developing a new parameter, the “Metal Ion Recognition Index”, Miri. This new parameter provides a number of important uses: (a) as a quantitative parameter associated to a specific mathematical and chemical meaning, (b) to discriminate the proton environment around the paramagnetic metal ion and (c) to compare the paramagnetic contributions for different metal-ligand systems. Miri can be determined for any stoichiometry of the metal-ligand complex, it is formally related to the thermodynamic equilibrium constant (Keq). The method offers the possibility to calculate a parameter that is very rarely reported, i.e., the proton spin-lattice relaxation rates in the pure paramagnetic environment (R1m).
The method was validated using Copper(II)-Piroxicam, Cu(II)-Pix, being one of the most active anti-inflammatory and anti-arthritic species [48,49,50,51]. The crystal structure of the Cu(II)-Piroxicam complex is known [49].

2. Results and Discussion

2.1. Theory

Both the proton relaxation rate and line shape analysis suggested that, in a diamagnetic system, Piroxicam underwent fast motion conditions, i.e., ω0τc << 1, where ω0 is the proton Larmor frequency and τc is the correlation time modulating the re-orientational motions. In the presence of the paramagnetic Cu(II) ions, the ligand may exist in either the bound (m) or in the free (f) environments. In the presence of fast chemical exchange between the bound and the free environments, a paramagnetic contribution to the ligand proton relaxation rates can be detected as:
R 1 p = R 1 exp R 1 f
where R1p is the paramagnetic contribution to the relaxation rate, R1exp the experimental relaxation rate in the paramagnetic system, and R1f the relaxation rate in the diamagnetic system.
Considering the following equilibrium:
C u ( I I ) + L C u ( I I ) L
if fast chemical exchange conditions apply, R1exp is defined as:
R 1 exp = χ m R 1 m + χ f R 1 f
where, R1m is the proton relaxation rate of the paramagnetic complex, and χm and χf are the molar fractions of the metal complex and the free ligand, respectively. Assuming that χf is close to 1 (as the Ligand concentration is usually much higher than the paramagnetic ion concentration):
R 1 exp = χ m R 1 m + R 1 f
and
R 1 exp R 1 f = χ m R 1 m
or
R 1 p = χ m R 1 m
χm can be defined as:
χ m = [ C u ( I I ) L ] [ C u ( I I ) ] + [ L ]
where, [Cu(II)–L], is the concentration of the complex, [L] is the concentration of the free ligand, and [Cu(II)] is the concentration of the free metal ion. Considering, as previously pointed out, that the ligand concentration is much higher than the metal ion concentration, [L] >> [Cu(II)], then:
χ m [ C u ( I I ) L ] [ L ]
The thermodynamic equilibrium constant for the Cu(II)-L interaction (at equilibrium) can be defined as:
K e q = [ C u ( I I ) L ] [ C u ( I I ) ] + [ L ] = [ C u ( I I ) L ] ( [ C u ( I I ) 0 ] [ C u ( I I ) L ] ) [ L ]
being the [Cu(II)] concentration equal to: [Cu(II)0] − [Cu(II)-L]. Then:
[ C u ( I I ) L ] = K e q [ C u ( I I ) 0 ] [ L ] 1 + K e q [ L ]
Introducing this equation in Equation (7), then:
χ m = K e q [ C u ( I I ) 0 ] [ L ] ( 1 + K e q [ L ] ) [ L ]
or
χ m = K e q [ C u ( I I ) 0 ] 1 + K e q [ L ]
Substituting χm, in Equation (5), then:
R 1 p = K e q [ C u ( I I ) 0 ] 1 + K e q [ L ] R 1 m
Assuming the term:
K e q 1 + K e q [ L ] R 1 m = M i r i
Miri is then defined as “Metal Ion Recognition Index”. Miri is a constant at constant temperature and constant ligand concentration. From Equation (12):
R 1 p = M i r i [ C u ( I I ) 0 ]
Equation (14) is the equation of a straight line passing through the origin. Plotting the calculated R1p values, as a function of [Cu(II)0], the value of Miri can be calculated from the slope of the linear regression line. Miri measures the strength of the paramagnetic interaction, between the metal ion and a specific proton of the ligand molecule. It also helps define the proton environment around the paramagnetic ion.
In case of the presence of more ligand molecules in the metal coordination site, the equilibrium is defined as:
n L + C u ( I I ) [ C u ( I I ) ( L ) n ]
Following a similar logic:
R 1 p = K e q [ L ] n 1 [ C u ( I I ) 0 ] 1 + K e q [ L ] n R 1 m
which is an equation of a straight line passing through the origin, when R1p vs. [Cu(II)0] is reported (maintaining both the temperature and ligand concentration [L], constants).
Similarly to Equation (14), Equation (15) can be reduced to:
R 1 p = M i r i [ C u ( I I ) 0 ]
where Miri in this case is:
M i r i = K e q [ L ] n 1 1 + K e q [ L ] n R 1 m
Equations (12) and (15) are powerful, in fact Equation (12) can be transformed to:
1 R 1 p = 1 + K e q [ L ] [ C u ( I I ) 0 ] K e q R 1 m
or
1 R 1 p = 1 [ C u ( I I ) 0 ] K e q R 1 m + [ L ] [ C u ( I I ) 0 ] R 1 m
In this case, there is a linear dependence between 1/R1p and [L], as the paramagnetic ion concentration [Cu(II)0], is maintained constant. The slope of the straight line between them leads to the determination of R1m, while the intercept allows for the estimation of the thermodynamic equilibrium constant. In the case of the formation of the metal-ligand complex with a higher stoichiometry, like Cu(II)–(L)n, Equation (15), can be transformed as:
1 R 1 p = 1 + K e q [ L ] n K e q R 1 m [ L ] n 1 [ C u ( I I ) 0 ] = 1 K e q R 1 m [ L ] n 1 [ C u ( I I ) 0 ] + K e q [ L ] n K e q R 1 m [ L ] n 1 [ C u ( I I ) 0 ]
The linearity of 1/R1p versus [L] is lost and both R1m and Keq cannot be calculated directly from geometrical analysis.

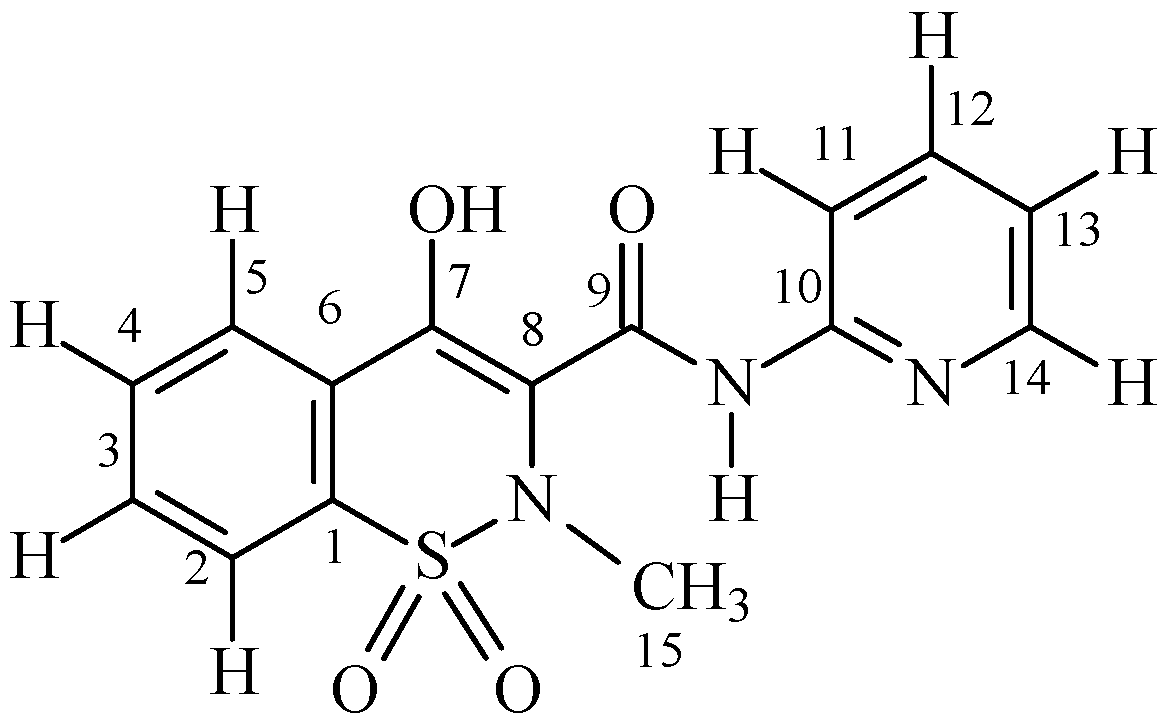
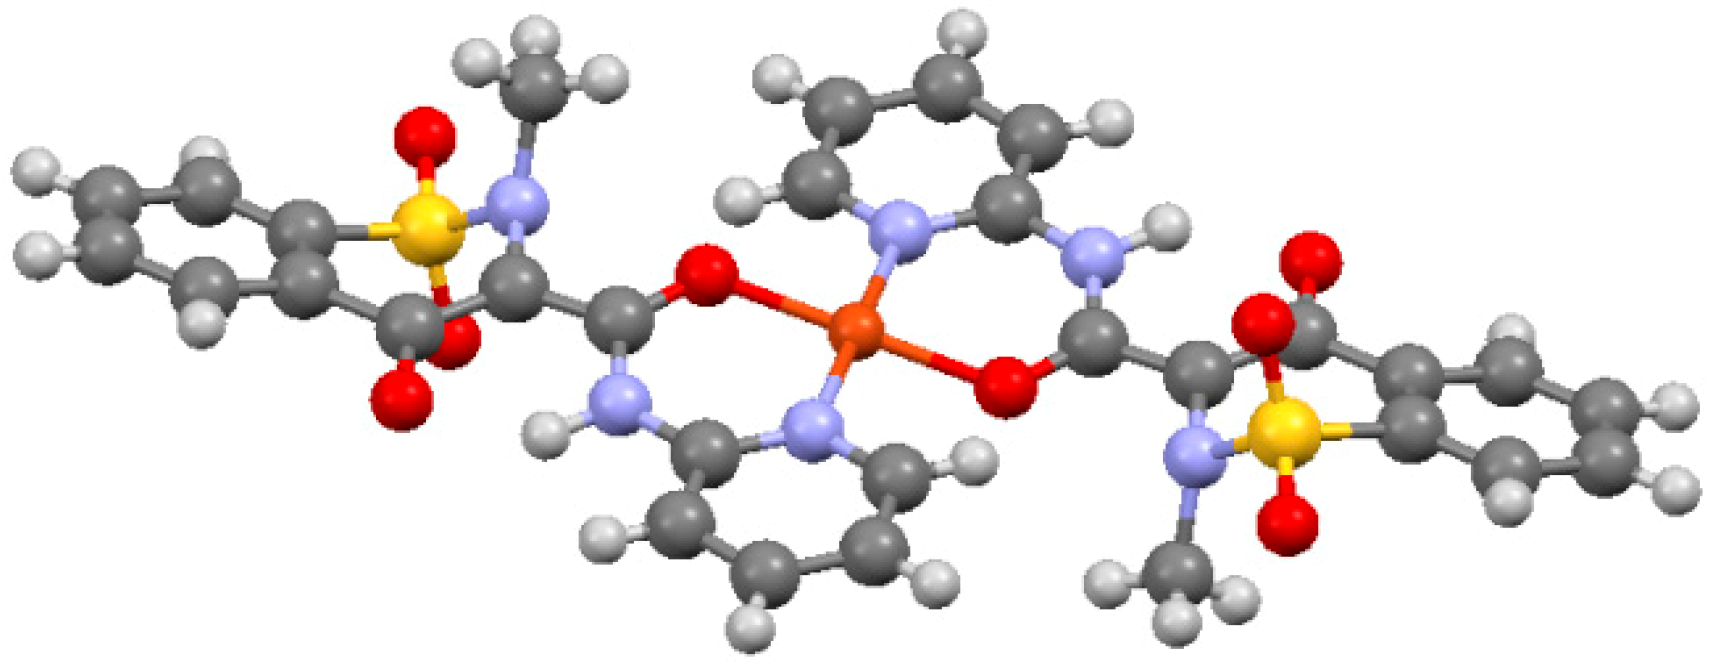
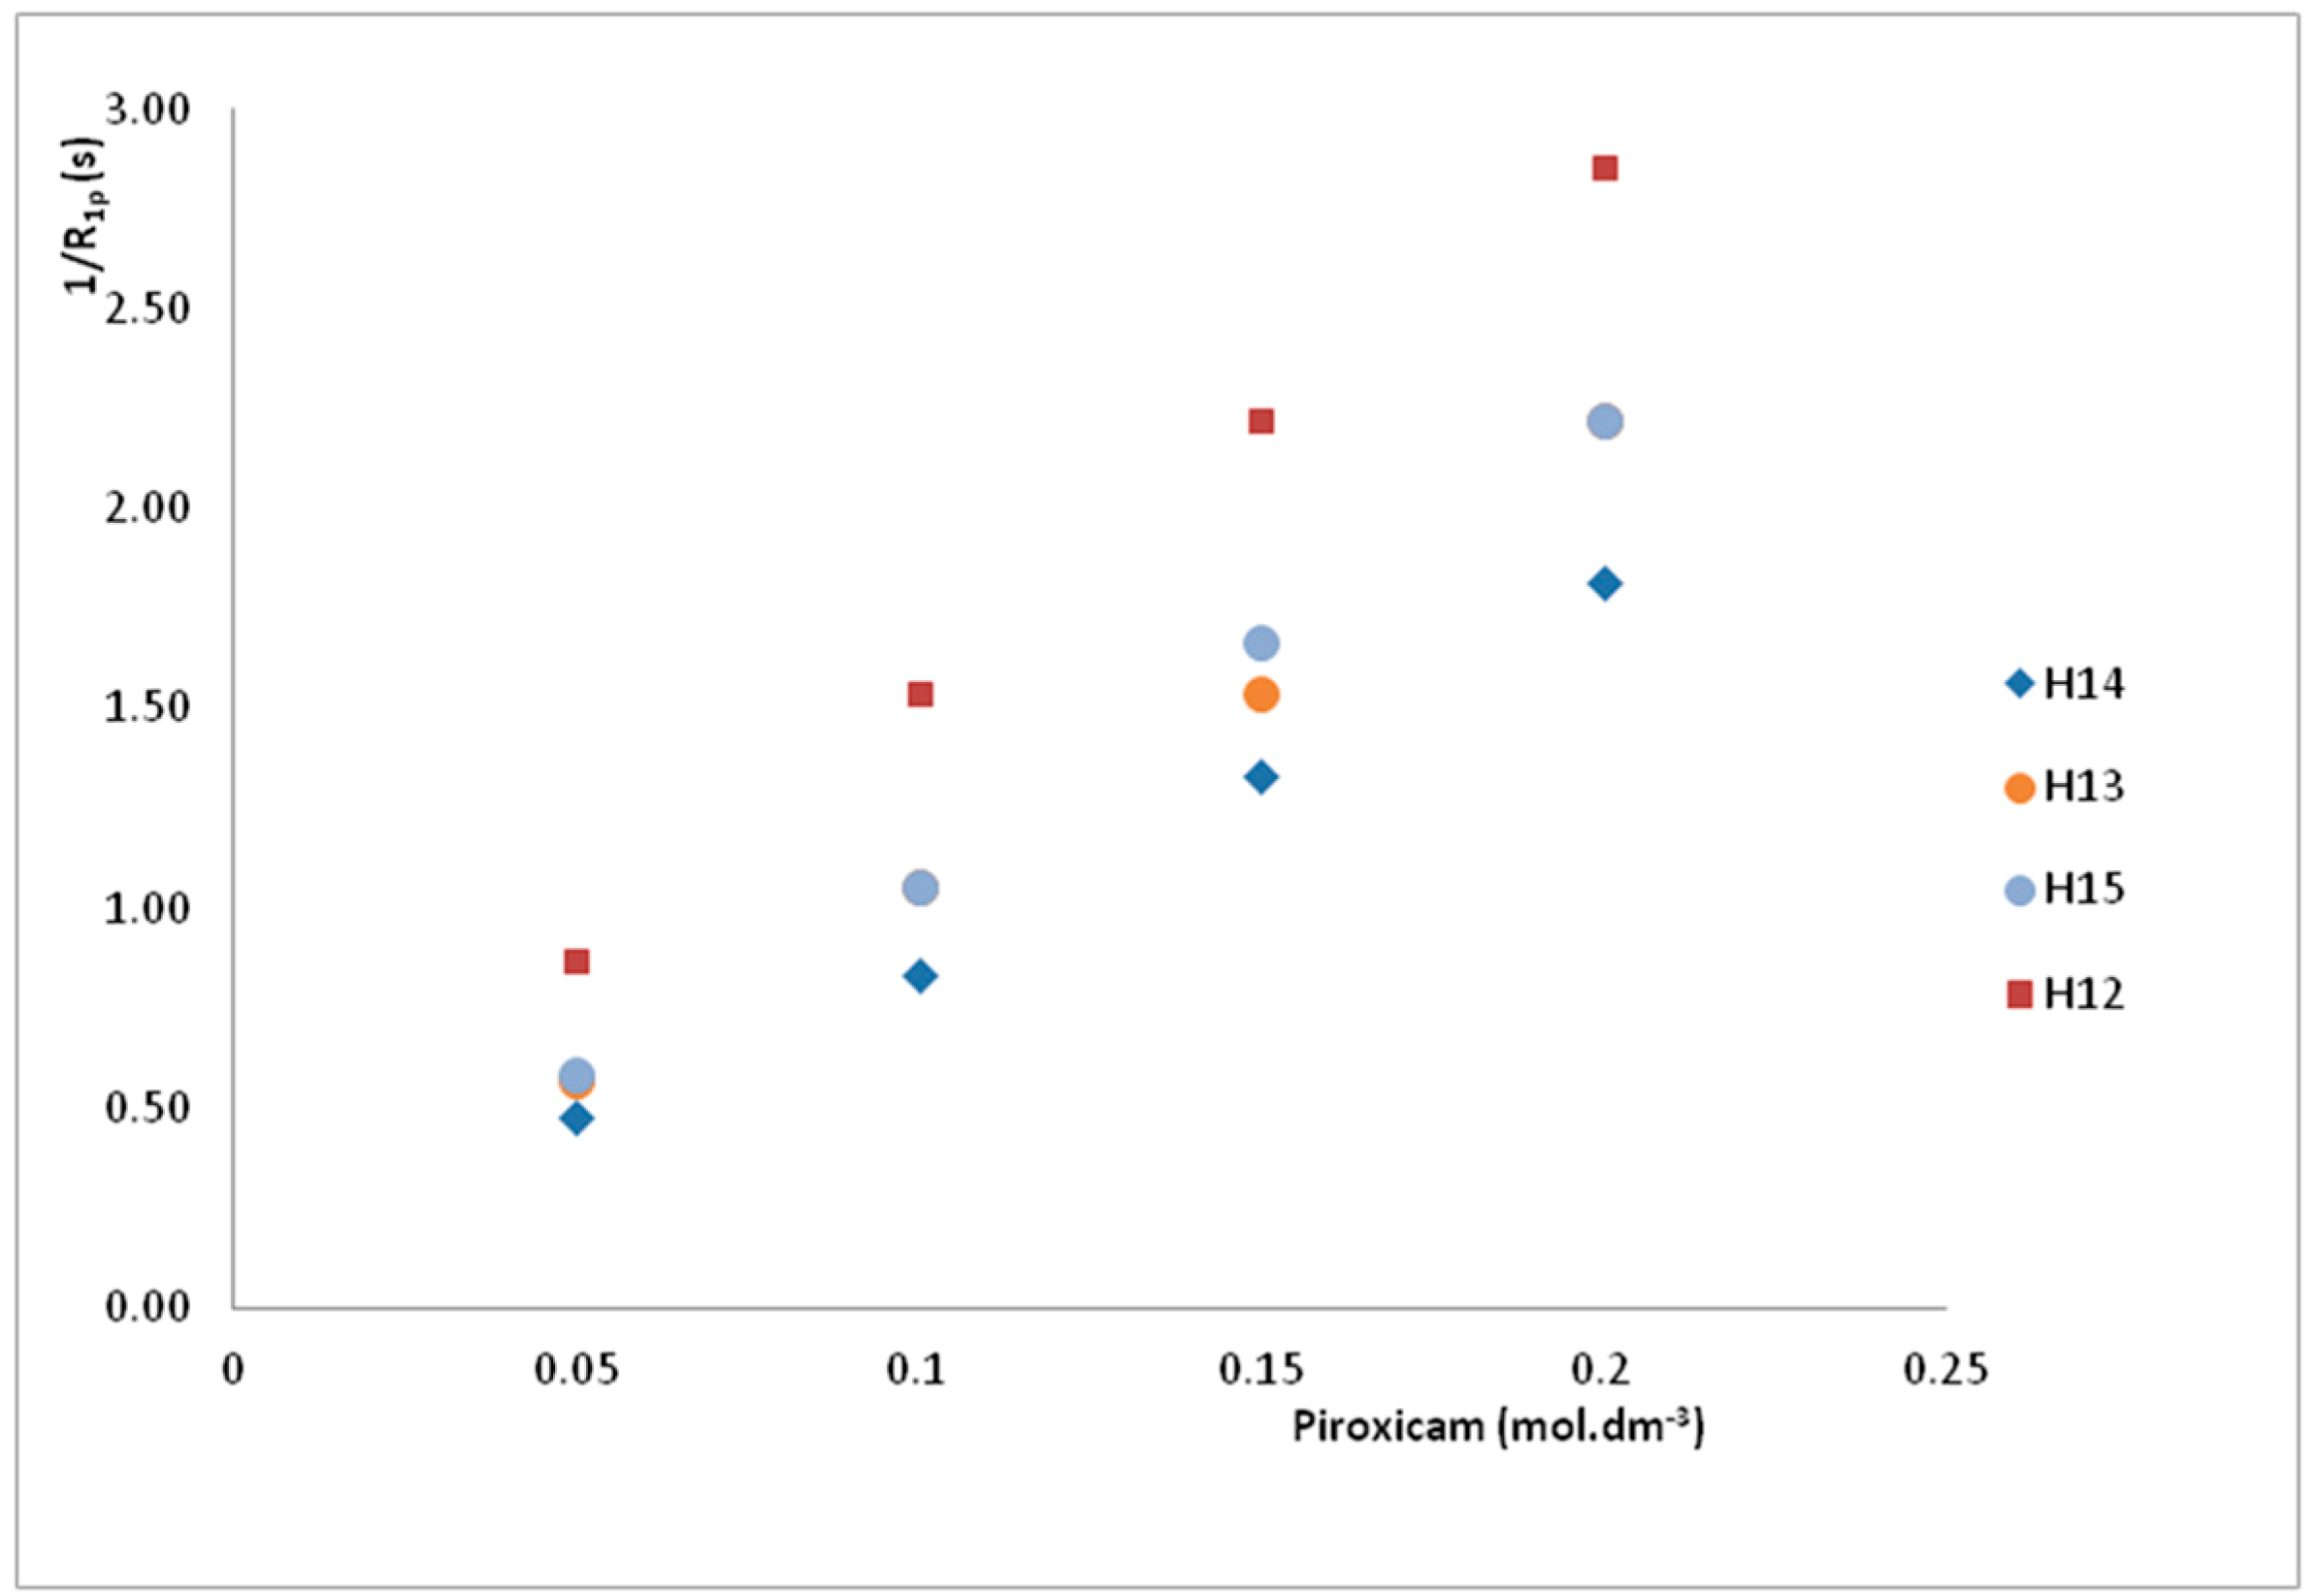
2.2. The case of Cu(II)-Piroxicam Complex

The proton spin-lattice relaxation rates of Piroxicam (Figure 1) in both the diamagnetic and paramagnetic systems are reported in Table 1. The paramagnetic system refers to the proton spin-lattice relaxation rate measured as a function of the copper(II) concentration, in the range of 2 × 10⁻⁵ to 7 × 10⁻⁴ mol L−1. The paramagnetic contribution to proton spin-lattice relaxation, (R1p = R1expR1f; Equation (1)), of Piroxicam proton nuclei are reported in Table 2.
The “Metal ion Recognition Index” Miri, for the different molecular moieties of Piroxicam was calculated from the linear regression analysis (Figure 2), which resulted in Miri values by 11,728, 8326, and 10,201 s−1 mol−1 L for the H14, H13 and the methyl H15 protons, respectively. These results confirm the validity of Equations (14) and (16) and allow for the quantification of the specific strength of the Cu(II)-Piroxicam complex.
We also explored the applicability of equations (19) and (20) to the Cu(II)-Piroxicam system. On the basis of previous studies on the Cu(II)-Piroxicam complex in solution [50,52,53] and on Cu(II)-Piroxicam crystal structure (Figure 3, [49]), we assumed the prevalence of the Cu(II)(Pix)2 complex in solution.
As the Piroxicam concentration is a much higher than that of the Copper ion, we consider a predominance of the Cu(II)(Pix)2 complex in the present experimental conditions. On the basis of these considerations, Equation (19) cannot be applied and Equation (20), is then modified to:
1 R 1 p = 1 K e q R 1 m [ P i x ] [ C u ( I I ) 0 ] + [ P i x ] R 1 m [ C u ( I I ) 0 ]
Equation (21) presents two terms, the first term can be neglected if the equilibrium constant of the complex, Keq, is higher than 1 × 10². However, a higher value of Keq for the complex was previously reported [52,53].
If we neglect the first term, Equation (21) is a linear equation where 1/R1p varies with Piroxicam concentration. Table 3 reports the paramagnetic contributions to proton spin-lattice relaxation, (R1p = R1expR1f; Equation (1)) of Piroxicam proton nuclei as a function of Piroxicam concentration (in the range of 0.25 to 5 × 10⁻² mol L−1), in the presence of Cu(II), 1 × 10⁻⁴ mol L−1 concentration.
These data can be used to determine R1m, the proton spin-lattice relaxation rate in the pure paramagnetic site. As expected from Equation (21), it is a linear dependence of 1/R1p on Piroxicam concentration (Figure 4).
The values of R1m, calculated from the slopes of the fitted lines for the H12, H13, H14, and H15 (Table 4) indicated that each proton experience a specific paramagnetic environment as a consequence of the different metal ion proton distances [54].
The calculated spin-lattice relaxation rates in the pure paramagnetic site (R1m), were then used to study the dynamical properties of the metal-ligand complex. The relaxation rate at the paramagnetic site was defined as [55,56,57]:
1 T 1 , M = 2 15 γ I 2 g 2 S ( S + 1 ) β 2 r 6 ( 3 τ c 1 + ω I 2 τ c 2 + 7 τ c 1 + ω S 2 τ c 2 ) + 2 3 S ( S + 1 ) ( A ) 2 ( τ e 1 + ω S 2 τ e 2 )
where the dipolar term originates from the electron-nucleus dipolar contribution, while the scalar one from the modulation of the scalar interaction between the electron spin S and the nuclear one I. In Equation (22), ωI and ωS are the Larmor frequencies of nucleus and electron, respectively (where ωI >> ωS), g is the Lande g factor, β is the Bohr magneton, r is the distance between the nucleus and the paramagnetic species, and (A/ħ) is the electron-nuclear hyperfine coupling constant. Values τc and τs are correlation times that modulate dipolar and scalar interactions, and are defined as:
τ c 1 = τ r 1 + τ s 1 + τ m 1
and
τ e 1 = τ s 1 + τ m 1
where τr is the rotational correlation time, τs the electron spin relaxation time, and τm the life time of the nucleus in the bound site.
In the case of paramagnetic systems containing Cu(II) ions in solution, Equation (22) is dominated essentially by the dipolar contribution [58,59,60]. This allows for the determination of the correlation time value τc, in fact from the crystalline structure of the [Cu(II)(Pix)2] complex [50], each Cu(II)…proton nuclei distance can be calculated. In this specific case, the distances between the paramagnetic ion Cu(II) and the nuclei H2 and H3 are 4.14, 4.58 Å, respectively. Introducing the metal-ligand distances and the R1m values in Equation (22), the correlation time (τc) modulating the dipolar contribution was calculated. In the present case, this value was determined ranging 3 × 10⁻¹⁰–5 × 10⁻¹⁰ s. These data are compatible to the value of the rotational correlation time of the complex. This important result confirms that for Cu(II) complexes in solution, the dipolar correlation time is dominated by the molecular tumbling rotation τr.

3. Materials and Methods

3.1. Materials

Piroxicam (4-hydroxy-2-methyl-1,1-dioxo-N-pyridinyl-2H-1,2-benzothiazine-3-carboxamide) and copper perchlorate hexahydrate Cu(ClO4)2·6H2O, were purchased from Sigma-Aldrich (Milan, Italy) and used without any further purification. The deuterated solvent, DMSO-d6, was 99.96 atom %D and was also from Sigma-Aldrich.

3.2. NMR Measurements

The solutions for the NMR experiments were obtained by dissolving the appropriate amounts of Piroxicam (0.1 mol L−1) and Cu(ClO4)2·6H2O in DMSO-d6. Paramagnetic purity of the Piroxicam solution was tested by analyzing the NMR proton spin-lattice relaxation rates of both the solvent and water signals.
1H-NMR spectra were obtained on a Bruker DRX 600 spectrometer, operating at 600.13 MHz. The proton spin–lattice relaxation rates (R1) were measured using the inversion-recovery (180–τ–90–t)n sequence, where t is the recovery delay after the inversion-recovery perturbation. The R1 values were calculated by computer fitting of the relaxation curves. The maximum experimental error in the relaxation rate measurements was ≤5%. All the spectra were processed using the Bruker Software TOPSPIN3.5. The temperature was held constant at 298 ± 1 K for all experiments; and the maximum experimental error on chemical shifts was ≤2%.

4. Conclusions

A new approach was developed to study the interaction processes between paramagnetic species and biological and/or synthetic ligands. A new parameter, the metal ion recognition index, Miri, was determined by plotting proton spin-lattice relaxation versus the concentration of the paramagnetic ion. The main advantage of this approach, with respect to the measurement of the experimental paramagnetic contribution to nuclear relaxation, is the possibility to define a new parameter, Miri. It is formally related to two important chemical parameters, the formation constant of the complex and the relaxation rate of the nuclear species in the pure paramagnetic site, R1m. The developed method provides a new way to their calculation. In the case of 1:1 complexes, both parameters can be calculated. For complexes with more ligands at the metal site, it is only possible to calculate the relaxation rate in the pure paramagnetic site. In the present investigation, combining this information with structural data, obtained from diffraction study of the crystal structure, the rotational correlation time of the complex was also calculated.
The Miri is also an easy-to-calculate index giving the opportunity to compare the interaction behavior between a selected metal and different ligands or different metals and a selected ligand.

Author Contributions

Conceptualization, C.B. and C.R.; data curation, A.D., A.P. and V.V.; formal analysis, G.T., A.P., V.V., and M.C.; funding acquisition, C.R.; investigation, C.B. and A.M.; methodology, A.D., G.T., and A.M.; validation, G.T. and G.L.; writing—original draft, A.D. and C.R.; Writing—review and editing, C.B., G.T., A.P., V.V., G.L., M.C., and A.M.

Funding

This research and the APC were funded by the Centre for Colloid and Surface Science (CSGI).

Acknowledgments

The authors thank the University of Siena for the instrumental and laboratory facilities and the Centre for Colloid and Surface Science (CSGI), for funding the research.

Conflicts of Interest

The authors declare no conflict of interest.

References

  1. Riccardi, M.L.; Genna, V.; De Vivo, M. Metal-ligand interaction in drug design. Nat. Rev. Chem. 2018, 2, 100–112. [Google Scholar] [CrossRef]
  2. Cook, S.A.; Borovik, A.S. Molecular designs for controlling the local environments around metal ions. Acc. Chem. Res. 2015, 48, 2407–2414. [Google Scholar] [CrossRef] [PubMed]
  3. Barone, C.R.; Cini, R.; de Pinto, S.; Di Masi, N.G.; Maresca, L.; Natile, G.; Tamasi, G. Coupling of cationic olefin complexes of platinum(II) with potential ambident nucleophiles. Inorg. Chim. Acta 2010, 363, 205–212. [Google Scholar] [CrossRef]
  4. Pontillo, N.; Ferraro, G.; Messori, L.; Tamasi, G.; Merlino, A. Ru-Based CO releasing molecules with azole ligands: Interaction with proteins and the CO release mechanism disclosed by X-ray crystallography. Dalton Trans. 2017, 46, 9621–9629. [Google Scholar] [CrossRef]
  5. Sun, L.-Z.; Zhang, D.; Chen, S.-J. Theory and modeling of RNA structure and interactions with metal ions and small molecules. Ann. Rev. Biophys. 2017, 46, 227–246. [Google Scholar] [CrossRef] [PubMed]
  6. Bush, A.I. Metal complexing agents as therapies for Alzheimer’s disease. Neurobiol. Aging 2002, 23, 1031–1038. [Google Scholar] [CrossRef]
  7. Tamasi, G.; Carpini, A.; Valensin, D.; Messori, L.; Pratesi, A.; Scaletti, F.; Jakupec, M.; Keppler, B.; Cini, R. {Ru(CO)x}-core complexes with selected azoles: Synthesis, X-ray structure, spectroscopy, DFT analysis and evaluation of cytotoxic activity against human cancer cells. Polyhedron 2014, 81, 227–237. [Google Scholar] [CrossRef]
  8. Tamasi, G.; Merlino, A.; Scaletti, F.; Heffeter, P.; Legin, A.A.; Jakupec, M.A.; Berger, W.; Messori, L.; Keppler, B.K.; Cini, R. {Ru(CO)x}-core complexes with benzimidazole ligands: Synthesis, X-ray structure and evaluation of anticancer activity in vivo. Dalton Trans. 2017, 46, 3025–3040. [Google Scholar] [CrossRef] [PubMed]
  9. Bruijnincx, P.C.A.; Sadler, P.J. New trends for metal complexes with anticancer activity. Curr. Opin. Chem. Biol. 2008, 12, 197–206. [Google Scholar] [CrossRef] [PubMed]
  10. Tamasi, G.; Bonechi, C.; Rossi, C.; Cini, R.; Magnani, A. Simulating the active sites of Copper trafficking proteins. Density Functional Structural and spectroscopy studies on Copper(I) complexes with thiols, carboxylato, amide and phenol ligands. J. Coord. Chem. 2016, 69, 404–424. [Google Scholar] [CrossRef]
  11. Tamasi, G.; Bernini, C.; Corbini, G.; Owens, N.; Messori, L.; Scaletti, F.; Massai, L.; Lo Giudice, P.; Cini, R. Synthesis, spectroscopic and DFT structural characterization of two novel Ruthenium(III) Oxicam complexes. In vivo evaluation of anti-inflammatory and gastric damaging activities. J. Inorg. Biochem. 2014, 134, 25–35. [Google Scholar] [CrossRef]
  12. Allardyce, C.S.; Dyson, P.J. Ruthenium in medicine: Current clinical uses and future prospects. Plat. Met. Rev. 2001, 45, 62–69. [Google Scholar]
  13. Tamasi, G.; Defazio, S.; Chiasserini, L.; Sega, A.; Cini, R. Ruthenium-thiobase complexes: Synthesis, spectroscopy, density functional studies for trans,cis,cis-[RuII(AsPh3)2(N,S-2-Thiopyrimidinato)2] and structural analysis of selected weak C–H⋯N and C–H⋯S interactions. Inorg. Chim. Acta 2009, 362, 1011–1021. [Google Scholar] [CrossRef]
  14. Zhang, C.X.; Lippard, S.J. New metal complexes as potential therapeutics. Curr. Opin. Chem. Biol. 2003, 7, 481–489. [Google Scholar] [CrossRef]
  15. Iniguez, E.; Sanchez, A.; Vasquez, M.A.; Martınez, A.; Olivas, J.; Sattler, A.; Sanchez-Delgado, R.A.; Maldonado, R.A. Metal-drug synergy: New ruthenium(II) complexes of ketoconazole are highly active against Leishmania major and Trypanosoma cruzi and nontoxic to human or murine normal cells. J. Biol. Inorg. Chem. 2013, 18, 779–790. [Google Scholar] [CrossRef] [PubMed]
  16. Adrees, M.; Ali, S.; Rizwan, M.; Zia-ur-Rehman, M.; Ibrahim, M.; Abbas, F.; Farid, M.; Qayyum, M.F.; Irshad, M.K. Mechanisms of silicon-mediated alleviation of heavy metal toxicity in plants: A review. Ecotoxicol. Environ. Saf. 2015, 119, 186–197. [Google Scholar] [CrossRef]
  17. Hernández, L.E.; Sobrino-Plata, J.; Montero-Palmero, M.B.; Carrasco-Gil, S.; Flores-Cáceres, M.L.; Ortega-Villasante, C.; Escobar, C. Contribution of glutathione to the control of cellular redox homeostasis under toxic metal and metalloid stress. J. Exp. Bot. 2015, 66, 2901–2911. [Google Scholar] [CrossRef] [Green Version]
  18. Fuertes, M.A.; Alonso, C.; Perez, J.M. Biochemical modulation of Cisplatin mechanisms of action: Enhancement of antitumor activity and circumvention of drug resistance. Chem. Rev. 2003, 103, 645–662. [Google Scholar] [CrossRef] [PubMed]
  19. Romero-Canelon, I.; Sadler, P.J. Next generation of metal anticancer complexes: Multitargeting via redox modulation. Inorg. Chem. 2013, 52, 12276–12291. [Google Scholar] [CrossRef] [PubMed]
  20. Graf, N.; Lippard, S.J. Redox activation of metal-based prodrugs as a strategy for drug delivery. Adv. Drug Del. Rev. 2012, 64, 993–1004. [Google Scholar] [CrossRef] [Green Version]
  21. Wu, M.X.; Yang, Y.W. Metal-Organic framework (MOF)-based drug/Cargo delivery and cancer therapy. Adv. Mater. 2017, 29, 1606134–1606153. [Google Scholar] [CrossRef] [PubMed]
  22. Tamasi, G.; Mangani, S.; Cini, R. Copper(I)-alkyl sulfide and -cysteine tri-nuclear clusters as models for metallo proteins: A structural density functional analysis. J. Biomol. Struct. Dyn. 2012, 30, 728–751. [Google Scholar] [CrossRef] [PubMed]
  23. Bonechi, C.; Donati, A.; Tamasi, G.; Leone, G.; Consumi, M.; Rossi, C.; Lamponi, S.; Magnani, A. Protective effect of quercetin and rutin encapsulated liposomes on induced oxidative stress. Biophys. Chem. 2018, 233, 55–63. [Google Scholar] [CrossRef]
  24. Leone, G.; Consumi, M.; Pepi, S.; Lamponi, S.; Bonechi, C.; Tamasi, G.; Donati, A.; Rossi, C.; Magnani, A. New formulations to enhance lovastatin release from Red Yeast Rice (RYR). J. Drug Deliv. Sci. Technol. 2016, 36, 110–119. [Google Scholar] [CrossRef]
  25. Moretti, E.; Mazzi, L.; Bonechi, C.; Salvatici, M.C.; Iacoponi, F.; Rossi, C.; Collodel, G. Effect of Quercetin-loaded liposomes on induced oxidative stress in human spermatozoa. Reprod. Toxicol. 2016, 60, 140–147. [Google Scholar] [CrossRef]
  26. Tardi, P.; Johnstone, S.; Webb, M.; Bally, M.; Abraham, S. Liposome Loading with Metal Ions. U.S. Patent 7,238,367 B2, 3 July 2007. [Google Scholar]
  27. Galvez-Llompart, M.; Zanni, R.; García-Domenech, R. Modeling natural anti-inflammatory compounds by molecular topology. Int. J. Mol. Sci. 2011, 12, 9481–9503. [Google Scholar] [CrossRef]
  28. Fylaktakidou, K.; Hadjipavlou-Litina, D.J.; Litinas, K.E.; Nicolaides, D.N. Natural and synthetic coumarin derivatives with anti-inflammatory/antioxidant activities. Curr. Pharm. Des. 2004, 10, 3813–3833. [Google Scholar] [CrossRef]
  29. Permender, R.; Hema, C.; Sushila, R.; Dharmender, R.; Vikash, K.; Kanchan, K. Mechanism of action of flavonoids as anti-inflammatory agents: A review. Inflamm. Allergy Drug Targets 2009, 8, 229–235. [Google Scholar]
  30. Bonechi, C.; Lamponi, S.; Donati, A.; Tamasi, G.; Consumi, M.; Leone, G.; Rossi, C.; Magnani, A. Effect of resveratrol on platelet aggregation by fibrinogen protection. Biophys. Chem. 2017, 222, 41–48. [Google Scholar] [CrossRef] [PubMed]
  31. Iwahara, J.; Schwieters, C.D.; Clore, G.M. Ensemble approach for NMR structure refinement against 1H paramagnetic relaxation enhancement data arising from a flexible paramagnetic group attached to a macromolecule. J. Am. Chem. Soc. 2004, 126, 5879–5896. [Google Scholar] [CrossRef]
  32. Kowalewski, J.; Nordenskiöld, L.; Benetis, N.; Westlund, P.-O. Theory of nuclear spin-relaxation in paramagnetic systems in solution. Prog. Nucl. Magn. Reson. Spectrosc. 1985, 17, 141–185. [Google Scholar] [CrossRef]
  33. Arnesano, F.; Banci, L.; Piccioli, M. NMR structures in paramagnetic metalloproteins. Quat. Rev. Biophys. 2005, 38, 167–219. [Google Scholar] [CrossRef] [PubMed]
  34. Gaggelli, E.; Rossi, C.; Tiezzi, E. Non covalent interactions and paramagnetic relaxation probe. Investigation of the correlation times. J. Phys. Chem. 1980, 84, 116–118. [Google Scholar] [CrossRef]
  35. Helm, L. Relaxivity in paramagnetic systems: Theory and mechanisms. Prog. Nucl. Magn. Reson. Spectrosc. 2006, 49, 45–64. [Google Scholar] [CrossRef]
  36. Niccolai, N.; Valensin, G.; Rossi, C.; Gibbons, W.A. The stereochemistry and dynamics of natural products and biopolymers from proton relaxation spectroscopy: Spin-label delineation of inner and outer protons of gramicidin S including hydrogen bonds. J. Am. Chem. Soc. 1982, 104, 1534–1537. [Google Scholar] [CrossRef]
  37. Bertini, I.; Pierattelli, R. Copper(II) proteins are amenable for NMR investigations. Pure Appl. Chem. 2004, 76, 321–333. [Google Scholar] [CrossRef]
  38. Clore, G.M.; Iwahara, J. Theory, practice and applications of paramagnetic relaxation enhancement for the characterization of transient low-population states of biological macromolecules and their complexes. Chem. Rev. 2009, 109, 4108–4139. [Google Scholar] [CrossRef]
  39. Sjodt, M.; Clubb, R.T. Nitroxide labeling of proteins and the determination of paramagnetic relaxation derived distance restraints for NMR studies. Bio-Protoc. 2017, 7, 1–17. [Google Scholar] [CrossRef]
  40. Clore, G.M. Practical aspects of paramagnetic relaxation enhancement in biological macromolecules. Method Enzymol. 2015, 564, 485–497. [Google Scholar]
  41. Otting, G. Protein NMR Using Paramagnetic Ions. Ann. Rev. Biophys. 2010, 39, 387–405. [Google Scholar] [CrossRef]
  42. D’Agostino, C.; Brauer, P.; Charoen-Rajapark, P.; Croucha, M.D.; Gladdena, L.F. Effect of paramagnetic species on T1, T2 and T1/T2 NMR relaxation times of liquids in porous CuSO4/Al2O3. RSC Adv. 2017, 7, 36163–36167. [Google Scholar] [CrossRef]
  43. Pilla, K.B.; Gaalswyk, K.; MacCallum, J.L. Molecular modelling of biomolecules by paramagnetic NMR and computational hybrid methods. Biochim. Biophys. Acta Proteins Proteom. 2017, 1865, 1654–1663. [Google Scholar] [CrossRef]
  44. Koehler, J.; Meiler, J. Expanding the utility of NMR restraints with paramagnetic compounds: Background and practical aspects. Prog. Nucl. Magn. Reson. Spectrosc. 2011, 59, 360–389. [Google Scholar] [CrossRef] [Green Version]
  45. Bertini, I.; Luchinat, C.; Parigi, G.; Pierattelli, R. Perspective in NMR metalloproteins. Dalton Trans. 2008, 3782–3790. [Google Scholar] [CrossRef]
  46. Huang, S.; Umemoto, R.; Tamura, Y.; Kofuku, Y.; Uyeda, T.Q.P.; Nishida, N.; Shimada, I. Utilization of paramagnetic relaxation enhancements for structural analysis of actin-binding proteins in complex with actin. Sci. Rep. 2016, 6, 33690. [Google Scholar] [CrossRef] [Green Version]
  47. Bonechi, C.; Martini, S.; Rossi, C. Interaction study of indigo carmine with albumin and dextran by NMR relaxation. J. Mater. Sci. 2011, 46, 2541–2547. [Google Scholar] [CrossRef]
  48. Goswami, S.; Sanyal, S.; Chakraborty, P.; Das, C.; Sarkar, M. Interaction of a common painkiller piroxicam and copper-piroxicam with chromatin causes structural alterations accompanied by modulation at the epigenomic/genomic level. Biochim. Biophys. Acta Gen. Subj. 2017, 1861, 2048–2059. [Google Scholar] [CrossRef] [PubMed]
  49. Cini, R.; Giorgi, G.; Cinquantini, A.; Rossi, C.; Sabat, M. Complexes of the antiinflammatory drug piroxicam. Inorg. Chem. 1990, 29, 5197–5200. [Google Scholar] [CrossRef]
  50. Tamasi, G.; Serinelli, F.; Consumi, M.; Magnani, A.; Casolaro, M.; Cini, R. Release studies from smart hydrogels as carriers for piroxicam and copper(II)-oxicam complexes as anti-inflammatory and anti-cancer drugs. X-ray structures of new copper(II)-piroxicam and -isoxicam complex molecules. J. Inorg. Biochem. 2008, 102, 1862–1873. [Google Scholar] [CrossRef]
  51. Hadadzadeh, H.; Salimi, M.; Weil, M.; Ahangari, R. The piroxicam complex of copper(II), trans-[Cu(Pir)2(THF)2], and its interaction with DNA. J. Mol. Struct. 2012, 1022, 172–180. [Google Scholar] [CrossRef]
  52. Ledesma-Olvera, L.G.; Agacino-Valdés, E.; Gómez-Balderas, R. Stability constants of Cu(II)-piroxicam complexes in solution: A DFT study. Theor. Chem. Acc. 2015, 135, 241–252. [Google Scholar] [CrossRef]
  53. Gehad, G.M.; El Gamel Nadia, E.A. Preparation and spectroscopic characterization of metal complexes of piroxicam. Vibr. Spectr. 2004, 36, 97–104. [Google Scholar] [CrossRef]
  54. Mildvan, A.S.; Cohn, M. Aspects of enzyme mechanisms studied by nuclear spin relaxation induced by paramagnetic probes. Adv. Enzymol. 1970, 33, 1–70. [Google Scholar] [PubMed]
  55. Solomon, I. Relaxation processes in a system of two spins. Phys. Rev. 1955, 99, 559–566. [Google Scholar] [CrossRef]
  56. Bloembergen, N. Proton relaxation times in paramagnetic solutions. Effects of electron spin relaxation. J. Chem. Phys. 1961, 34, 842–850. [Google Scholar] [CrossRef]
  57. Dwek, R.A. Nuclear Magnetic Resonance in Biochemistry; Clarendon Press: Oxford, UK, 1973. [Google Scholar]
  58. Esperson, W.G.; Hutton, W.C.; Chou, S.T.; Martin, R.B. Cautions concerning uses of Copper(II) selective broadening in nuclear magnetic resonance spectroscopy for determination of ligand binding sites. J. Am. Chem. Soc. 1974, 96, 8111–8112. [Google Scholar] [CrossRef]
  59. Fazakerley, G.V.; Jackson, G.E.; Phillips, M.A.; van Niekerk, L.C. A quantitative investigation of the interaction of Cu(II) and Mn(II) with some purine bases, nucleosides and nucleotides by NMR. Inorg. Chim. Acta 1979, 35, 151–160. [Google Scholar] [CrossRef]
  60. Banci, L.; Bertini, I.; Luchinat, C. Nuclear and Electron Relaxation: The Magnetic Nucleus-Unpaired Electron Coupling in Solution; VCH: New York, NY, USA, 1991. [Google Scholar]
Sample Availability: Samples of the compounds are not available from the authors.
Figure 1. Structure and atom numbering of Piroxicam.
Molecules 24 01050 g001
Figure 2. Paramagnetic contributions (R1p) to the proton relaxation rates for the H13, H14, and H15 of 0.1 mol L−1 Piroxicam solution versus Cu(II) molar concentration.
Molecules 24 01050 g002
Figure 3. X-ray structure of [CuII(Pix)2] complex [49].
Molecules 24 01050 g003
Figure 4. 1/R1p to the proton relaxation rates for the H13, H14, H12, and H15 versus the Piroxicam concentration.
Molecules 24 01050 g004
Table 1. Non-selective proton relaxation rate R1f (s−1) of Piroxicam solution (0.1 mol L−1) versus Cu(II) concentration. Maximum experimental error, ≤5%.
Protonδ (ppm)[Cu] (mol L−1)
02 × 10−54 × 10−57 × 10−52 × 10−44 × 10−47 × 10−4
H148.420.400.600.851.202.705.058.65
H2/H58.060.400.450.500.600.801.251.85
H127.990.450.550.650.801.552.654.45
H11/H37.890.500.550.560.700.951.402.27
H47.860.550.600.650.850.951.251.85
H137.280.450.550.751.002.153.656.35
H152.871.101.251.401.803.105.208.25
Table 2. Paramagnetic proton relaxation rate contribution R1p (s−1) of Piroxicam solution (0.1 mol L−1) versus Cu(II) concentration. Maximum experimental error, ≤5%.
Protonδ (ppm)[Cu] (mol L−1)
2 × 10−54 × 10−57 × 10−52 × 10−44 × 10−47 × 10−4
H148.420.200.450.802.304.658.25
H2/H58.060.050.100.200.400.851.45
H127.990.100.200.351.102.204.00
H11/H37.890.050.100.200.450.901.60
H47.860.050.100.300.400.701.30
H137.280.100.300.551.703.205.90
H152.870.150.300.702.004.107.15
Table 3. Paramagnetic proton relaxation rate R1p (s−1) of Piroxicam solutions at several concentrations in the presence of Cu(II) (1 × 10⁻⁴ mol L−1). Maximum experimental error, ≤5%.
Protonδ (ppm)[Cu] (mol L−1)
0.250.200.150.105 × 10−5
H148.420.460.550.751.202.10
H2/H58.060.120.150.200.350.45
H127.990.300.350.450.651.15
H11/H37.890.100.120.170.250.45
H47.860.120.150.200.300.60
H137.280.370.450.650.951.75
H152.870.380.450.600.951.70
Table 4. Calculated R1m values from linear regression analysis of the data reported in Figure 2, for H14, H12, H13, and H15 protons of Piroxicam.
Protonδ (ppm)R1m (s−1)
H148.421129 ± 55
H127.99730 ± 36
H137.28943 ± 46
H152.87917 ± 44

