
Composition and Rheological Properties of Polysaccharide Extracted from Tamarind (Tamarindus indica L.) Seed
by
 and
and
Huimin Shao
1,†, 
Hui Zhang
1,†,
Yanjun Tian
2,
Zibo Song
3,
Phoency F. H. Lai
1 and
Lianzhong Ai
1,* 1
Shanghai Engineering Research Center of Food Microbiology, School of Medical Instruments and Food Engineering, University of Shanghai for Science and Technology, Shanghai 200093, China
2
Shandong Food Ferment Industry Research & Design Institute, Jinan 250013, China
3
Yunnan Maodouli Group Food Co., Ltd., Yuxi 653100, China
*
Author to whom correspondence should be addressed.
†
These authors contributed equally to this work and should be considered as co-first authors.
Molecules 2019, 24(7), 1218; https://doi.org/10.3390/molecules24071218
Submission received: 4 March 2019
/
Revised: 25 March 2019
/
Accepted: 25 March 2019
/
Published: 28 March 2019
(This article belongs to the Special Issue Recent Advances in Studies of Food and Beverages)
Abstract
:A polysaccharide was extracted in high yield from tamarind (Tamarindus indica L.) seed (TSP) by acidic hot water extraction and ethanol precipitation. It was composed of 86.2% neutral polysaccharide, 5.4% uronic acid and 1.3% protein. The molecular weight of TSP was estimated to be about 1735 kDa, with glucose, xylose, and galactose in a molar ratio of 2.9:1.8:1.0 as the major monosaccharides. The steady shear and viscoelastic properties of TSP aqueous solutions were investigated by dynamic rheometry. Results revealed that TSP aqueous solution at a concentration above 0.5% (w/v) exhibited non-Newtonian shear-thinning behavior. Dynamic oscillatory analysis revealed that 10% (w/v) TSP showed as a “weak gel” structure. Apparent viscosities and viscoelastic parameters of TSP solutions decreased drastically in an alkaline solution of pH > 10, but slightly influenced by acidic solution, high temperature and the presence of salt ions and sucrose. These results indicated that TSP possessed excellent pH-resistance and thermo-stability, which might be suitable for applications in acidic beverages and high-temperature processed foodstuffs.
1. Introduction
Tamarind (Tamarindus indica L.) is an evergreen large tree of the genus Tamarindu of the familiy Caesalpinioideae, native to Southeast Asia, India and Equatorial Africa, which are subtropical and tropical regions [1]. Tamarind seed polysaccharide (TSP), known as tamarind gum, is a neutral xyloglucan (XG) extracted from tamarind seed kernels. It is composed of a β-(1,4)-d-glucan backbone with α-(1,6)-d-xylose branches that are partially substituted with β-(1,2)-d-galactose [2,3]. Several studies have investigated the anti-cancer activity of XG as an antitumor factor [4,5], indicating that TSP is potentially a source of bioactive polysaccharide. In addition, the mucoadhesive properties of TSP were also studied for application as a mucoadhesive polymer [6].
TSP can form viscous solutions when dissolved in water, like many plant polysaccharide gums. It has been used as a food thickener because of its excellent physical properties, such as condensation, thickening, emulsification, viscosity, and gelling abilities [7,8]. Being an ideal natural food additive, it can be used in jams, soft candies, jellies and ice-creams to improve the viscosity or gelling properties of products [9].
Some investigations about the rheological properties of XG have been reported. An aqueous solution of XG showed shear-thinning behavior, a characteristic of non-Newtonian fluids, and influenced by a number of parameters including molecular weight and substituents along β-(1,4)-d-glucan backbone [10]. XG shows a gel-like behavior indicated by non-destructive oscillatory measurements, suggesting potential use as a gelling additive and vehicle in medical applications [11]. When part of the galactose substitutents is removed from the XG, it can form a hydrogel that is thermally reversible in dilute aqueous solutions [12]. Addition of XG into gellan gum can reduce the effective concentration of gellan needed for gelation, i.e., a gel network is formed at a gellan concentration much lower than the gelation threshold of gellan alone [13]. Mixtures of starch and XG yield high viscosities and the degree of pseudoplasticity increased with the XG content [14].
The current study aimed to systematically investigate the rheological change and stability of TSP solutions with respect to food processing factors. The factors studied were set over a wide range of levels, for example, TSP concentrations (0.5–10%), pH (1–13), temperature (5–85 °C), salt ions (Na+, K+, Ca2+) and sucrose (10–30%). The chemical components of the studied TSP were also characterized because it was isolated from tamarind seeds collected from Yunnan, China and has not yet been reported before.
2. Results and Discussion
2.1. Chemical Composition and Molecular Weight Analysis of TSP
The extraction yield of TSP was determined to be 54.6% (w/w), higher than that reported by Nayak et al. [15]. The yield difference might be due to the extraction method, especially the extraction temperature, and the breed or physiological stage of the tamarind seeds used. Approximately 86.2% of neutral sugar, 5.4% of uronic acid, 1.3% of protein, 6.1% of moisture and 0.3% of ashes were observed in the TSP sample studied, suggesting that the TSP was mainly a neutral polysaccharide with a few impurities. These results are similar to those reported previously [16].
The mean Mw and distribution of TSP were determined by HPSEC. As shown in Figure 1a, the molecular weight of XG was widely distributed and monodisperse, giving a mean estimated TSP Mw of about 1735 kDa. This result is different from the XGs with multiple fractions of 25, 80, 150, 590 and 1200 kDa obtained by Lima et al. [17]. The difference may be related to the different extraction methods used or the diversity of biological origin. Likely, the molecular weights of tamarind xyloglucan polymers could be associated with the self-association capacity of cells and have an effect on the structural function of primary cell walls. Monosaccharide composition analyses of standard (Figure S1) and sample (Figure 1b) revealed that TSP was a heteropolysaccharide composed of glucose, xylose and galactose in a molar ratio of 2.9:1.8:1.0. This ratio was similar to a previous report that showed a molar ratio of 3:2:1 [18].
2.2. FT-IR Spectroscopy
Figure 2 shows the FT-IR spectrum of TSP, which presented peaks typical of the glycosidic structure of xyloglucans. The strong absorption peak at 3411 cm−1 represents the hydroxyl (O-H) stretching vibration of polysaccharides and water involved in hydrogen bonding [19]. The absorption peak at 2897 cm−1 corresponds to the methylene group (C-H) stretching vibration peak characteristic of polysaccharides [20]. The absorption peaks at 1647 cm−1 and 1374 cm−1 refer to the presence of carbonyl or carboxylic acid groups (C=O) [21,22]. The absorption peak at 1042 cm-1 implies that TSP is pyran-glycosylated [23]. In the anomeric region (950–700 cm−1), the polysaccharide exhibited an obvious characteristic absorption at 897 cm−1, which was assigned to d-galactopyranose [24]. The absorption peak at 944 cm−1 could represent d-glucopyranose.
2.3. Flow Behaviors of TSP
The apparent viscosity of TSP solutions at different concentrations is shown in Figure 3. The results indicated that the apparent viscosity of TSP solutions increased with the increase of concentration, which was consistent with a previous report [25]. The apparent viscosity of TSP solutions showed a Newtonian plateau at low shear rates, and became shear thinning at high shear rates and more concentrated concentrations. At low shear rates, the stretching macromolecules of TSP would intertwine to form aggregates, resulting in increased flow resistance and high viscosity. At high shear rates, the shear thinning behavior of the system was related to the orientation of polysaccharide macromolecules along the streamline of the flow [26], as they gradually align themselves in the shear flow direction to reduce the resistance [27]. The polysaccharide aggregates formed at high concentrations may partially break at a high shear rate and strengthen the shear thinning behavior to a certain extent.
According to the flow curve, the flow properties of TSP solutions could be further described with the Williamson model [28] as follows:
where η represents the apparent viscosity (Pa·s); η0 is the zero shear viscosity (Pa·s); the is shear rate (s−1); λw represents the relaxation time (s); n is the shear-thinning index, where n < 1 indicates a shear-thinning behavior of polymers [29].
The fitted parameters of the Williamson model for TSP solutions are shown in Table 1. The model predictions could explain well the variations in the viscosity data (correlation coefficient R2 = 0.9164–0.9999). The solution behavior transformed from Newtonian to shear thinning at a critical shear rate (), which is the reciprocal of relaxation time ( = 1/λw). The values of TSP solutions at the concentrations of 1.5%, 2%, and 4% were derived as 323, 132, and 21 s−1, respectively. The decrease of value with increasing concentration could be attributed to a dynamically entangled network structure in the solutions, limiting the movement of polymer chains under concentrated conditions [29]. The shear-thinning index (n) increased with increasing concentration from 0.659 to 0.772, which means the enhancement of shear thinning behavior and typical pseudoplastic fluid property of the solution system. The zero-shear viscosity η0 increased with the increase of concentration, indicating the establishment of a greater number of links between the biopolymer molecules, which depended on the molar mass and inter-chain interactions [30].
These results were consistent with most of the studies on rheological behaviors of polysaccharides such as xanthan gum [31,32] and -carrageenan [33]. These results indicated that TSP has potential applications in the processing of liquid products, since pseudoplastic fluids are favored for chewing, swallowing, as well as liquid filling. In addition, the time dependency is connected to the thixotropy concept at a constant shear rate. The measured shear stress or viscosity of a thixotropic material will decrease with time and finally stabilize to a constant value, which could be characterized by considering a ramp-up and ramp-down of shear imposed in a rotational rheometer [34]. Since the upward and downward curves overlapped quite well (Figure 3), it is speculated that the rate of structure breakdown is similar to that of its reconstruction [35]. Therefore, the time dependency could be neglected and ramps are suitable to describe rheological behavior of TSP solution.
2.4. Viscoelastic Behaviors of TSP
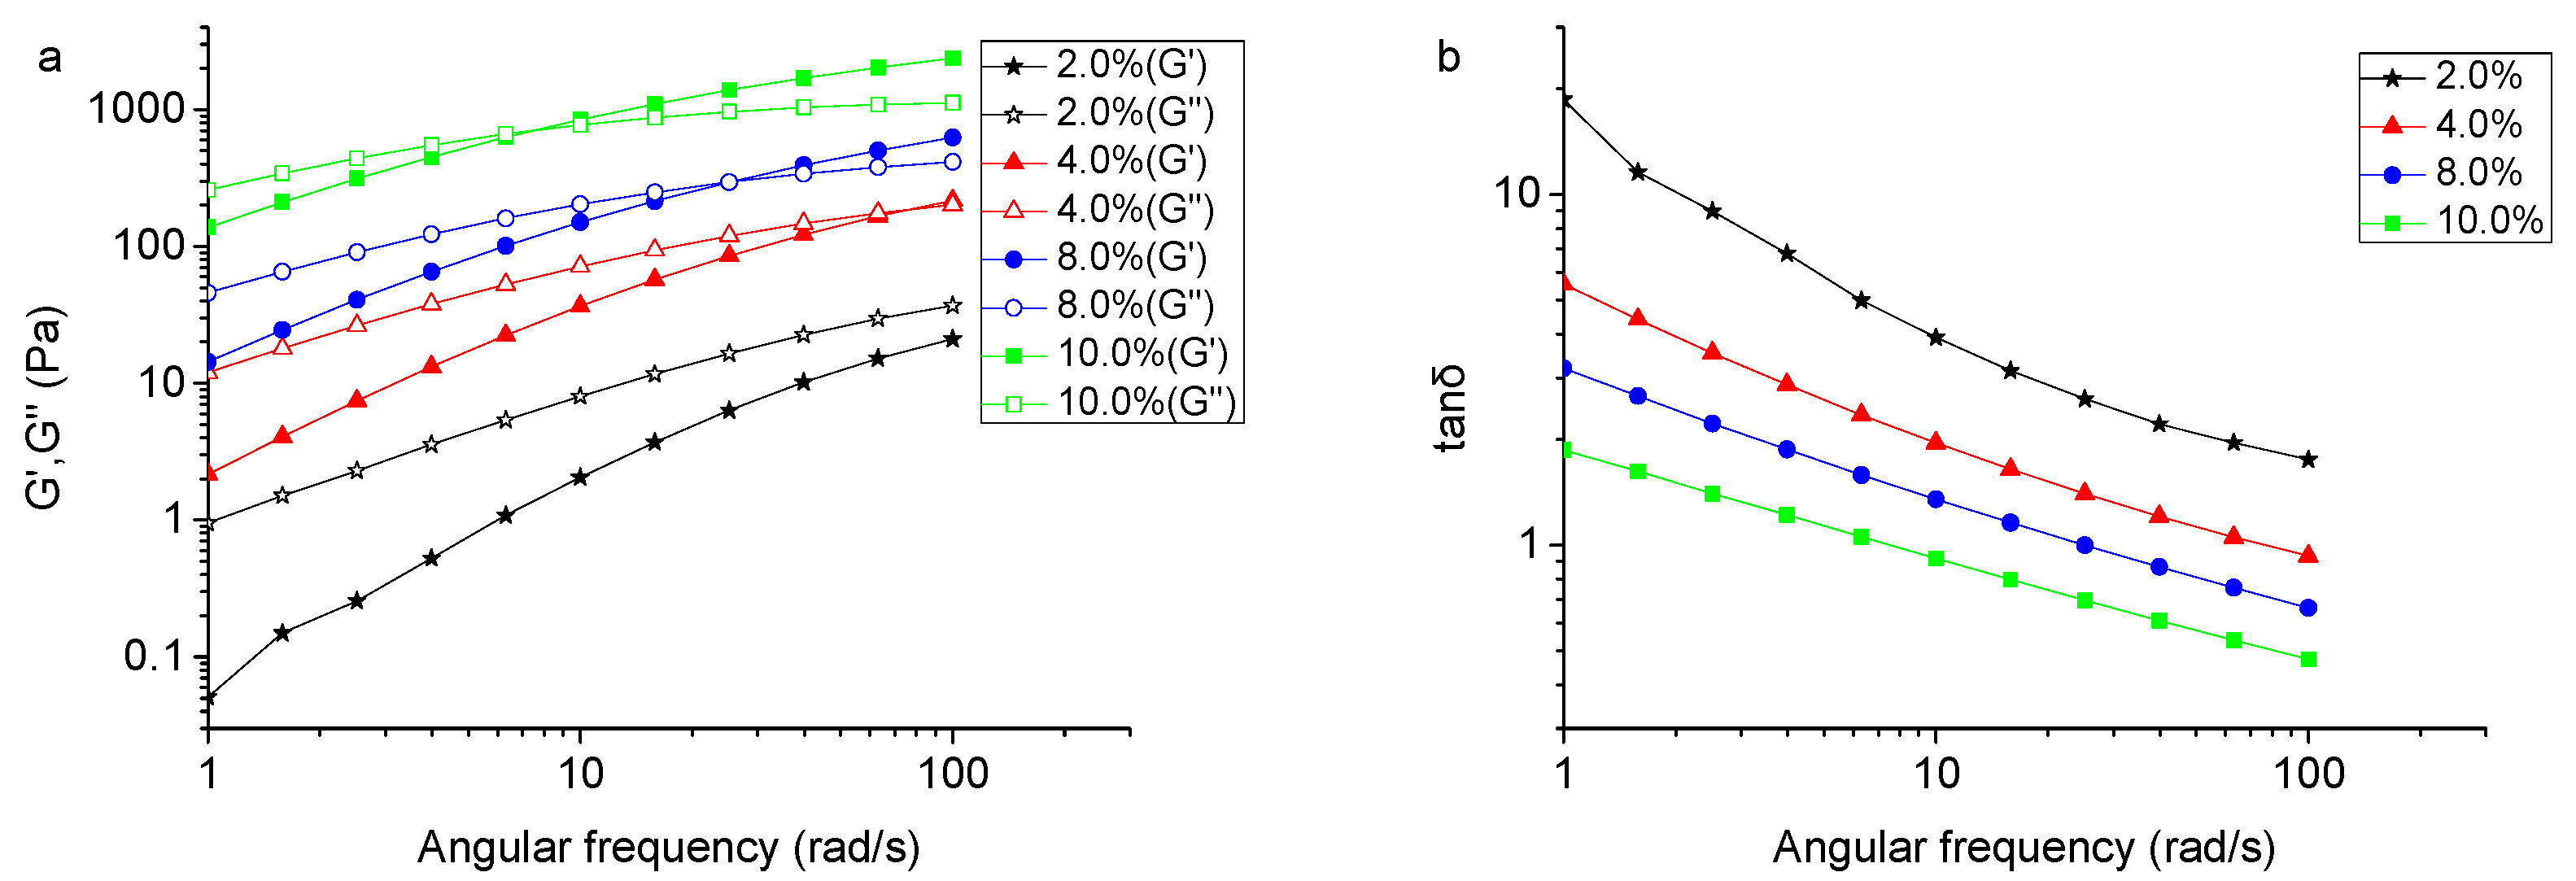
Polysaccharide solutions and gels are usually characterized by the storage modulus G′ and the loss modulus G″ to evaluate their viscoelastic properties. In general, if G′ < G″, the solution has prevalently viscous properties, which are observed to be more ‘‘liquid-like”. When G′ > G″, the system will exhibit prevalent elastic properties [11,36,37,38]. Figure 4 presents the viscoelastic behaviors of TSP solutions at different concentrations at a strain of 2%, which is chosen by the linear viscoelastic region checked in Figure S2. As shown in Figure 4a, the loss modulus G″ and storage modulus G′ of TSP solution increased with increasing frequency. For 2% (w/v) TSP solution, the G′ was lower than the G″ in the tested frequency range, indicating a fluidic behavior. When the concentration increasing to 4%, 8%, and 10% (w/v), the G′ and G″ increased and crossed at a frequency of 80, 25 and 7 rad/s, respectively. This indicates that the TSP solution transformed from viscous behavior to a more elastic behavior with increasing concentration [39]. The TSP solutions of all concentrations presented the entanglement behavior of typical uncharged random coil polysaccharides [40].
The mechanical loss of the TSP solution during oscillation measurements can be reflected by loss tangent (tan δ = G″/G′), which is a measure of the energy lost compared to energy stored in a cyclic deformation [41]. When tan δ = 1, the same degree of viscous and elastic components can be expected for the systems with typically weak gel properties [37]. As shown in Figure 4b, the system revealed liquid-like properties indicated by an increased tan δ with decreasing TSP concentration. When the concentration increased up to 4%, tan δ reduced to less than 1 in high frequency region, suggesting that the TSP solution formed a weak gel.
2.5. Effect of pH on the Rheological Property of TSP
The apparent viscosities of TSP solutions at different pH values ranging from 1 to 13 are presented in Figure 5a. The results showed that the apparent viscosity of TSP was almost unchanged at pH 1–10, but decreased significantly at pH 13. It could be speculated that, in extreme alkaline solutions, the negative repulsion in the solution may destroy the intramolecular and intermolecular interactions of TSP, causing the apparent viscosity to decrease. It was perceivable that TSP solutions were stable in acidic and weakly alkaline environments. This is in contrast to Alpizar-Reyes’s [27] research, in which the apparent viscosity of TSP decreased with the decreasing pH. The decreasing viscosity may be due to an increase in charge density [42], which promotes a contraction of the TSP molecules. As reported, the apparent viscosity of xanthan is greatly influenced under acidic conditions, and was much lower at pH 3 than that at pH 5. It may be due to the increase in stability of the helical conformation of xanthan, decreasing the hydrodynamic volume size [43]. The viscosity of xanthan solutions exhibits a slight change in an alkaline environment [44]. The pH is an important gelation factor for pectin, which is an anionic polysaccharide. Lowering the pH value protonates carboxylic groups, reducing electrostatic repulsions along and between pectin chains [45]. Figure 5b shows the dynamic rheological properties of TSP (2% w/v) in different pH solutions. It shows that the G″ was higher than G′ over the entire frequency range and at different pH values. No intersection between the G′ and G″ curves implies that the pH change destroyed the weak gel structure of TSP, giving a viscous system.
2.6. Effect of Temperature on the Rheological Properties of TSP
The apparent viscosity changes of 2% (w/v) TSP solution with temperature are shown in Figure 6a. It is evident that the apparent viscosity of the TSP solution decreased gently with increasing temperature (5–85 °C) at three different shear rates. The apparent viscosity of TSP at a shear rate of 2 s−1 decreased from 3.01 to 0.13 Pa.s as the temperature increased from 5 to 85 °C. It could be speculated that TSP adopts a partial self-associated conformation in water due to hydrogen bonding and polymer entanglements at low temperatures. As the temperature increased, a transition progressively took place, from a partially ordered random broken helix conformation to a disordered random coil conformation [46]. As a result, the liquid-like properties of TSP solutions increased with increasing temperature, which was consistent with a previous report [27]. This is similar to the result reported for xanthan gum, of which the viscosity decreases rapidly from 785 to 0.746 Pa.s as the temperature increases from 20 to 80 °C [47]. Furthermore, during the heating-cooling process, the two apparent viscosity curves coincided well, indicating the good thermal resilience of TSP. This may be explained by the electrostatic interactions among polysaccharide chains and the stability of its hydrogen bonds [48].
The effects of temperature on storage modulus G′ and loss modulus G″ of TSP are shown in Figure 6b, where G′ and G″ declined with the increase in temperature (from 5 to 45 °C). At 5 °C, the curves of G′ and G″ crossed over at a frequency of 100 rad/s, while G″ values were higher than G′ in the tested frequency range at 25 °C and 45 °C. These results indicate that a TSP solution of 2% (w/v) tended to present a gel-like behavior at low temperature (5 °C), and a liquid-like one at high temperature (45 °C).
The apparent activation energy (Ea) for viscous flow was applied to investigate the temperature dependence of TSP solutions. Ea can describe the influence of absolute temperature on several chemical and physical processes according to the Arrhenius’ law (Equation (2)) [49]. The equation is as follows:
where η is the apparent viscosity (Pa.s); η0 is a pre-factor (Pa.s); R is the ideal gas constant (8.314 J·mol−1·K−1); T is absolute temperature (K); and Ea is the activation energy (kJ/mol) for viscous flow [50].
In this model, by plotting of lnη against the inverse of temperature (1/T), a straight line could be obtained to calculate the apparent activation energy of 2.0% (w/v) TSP solution as shown in Figure 6c. Table 2 lists the activation energies for viscous flow of 2.0% (w/v) TSP solution, which were 32.208, 24.435, 19.388 kJ/mol at the shear rates of 2, 60, or 200 s−1, respectively. It is indicated that the temperature dependence of the apparent viscosity of TSP solutions was gradually lessened with the increase in shear rate.
2.7. Effect of Salts and Sucrose on the Rheological Property of TSP
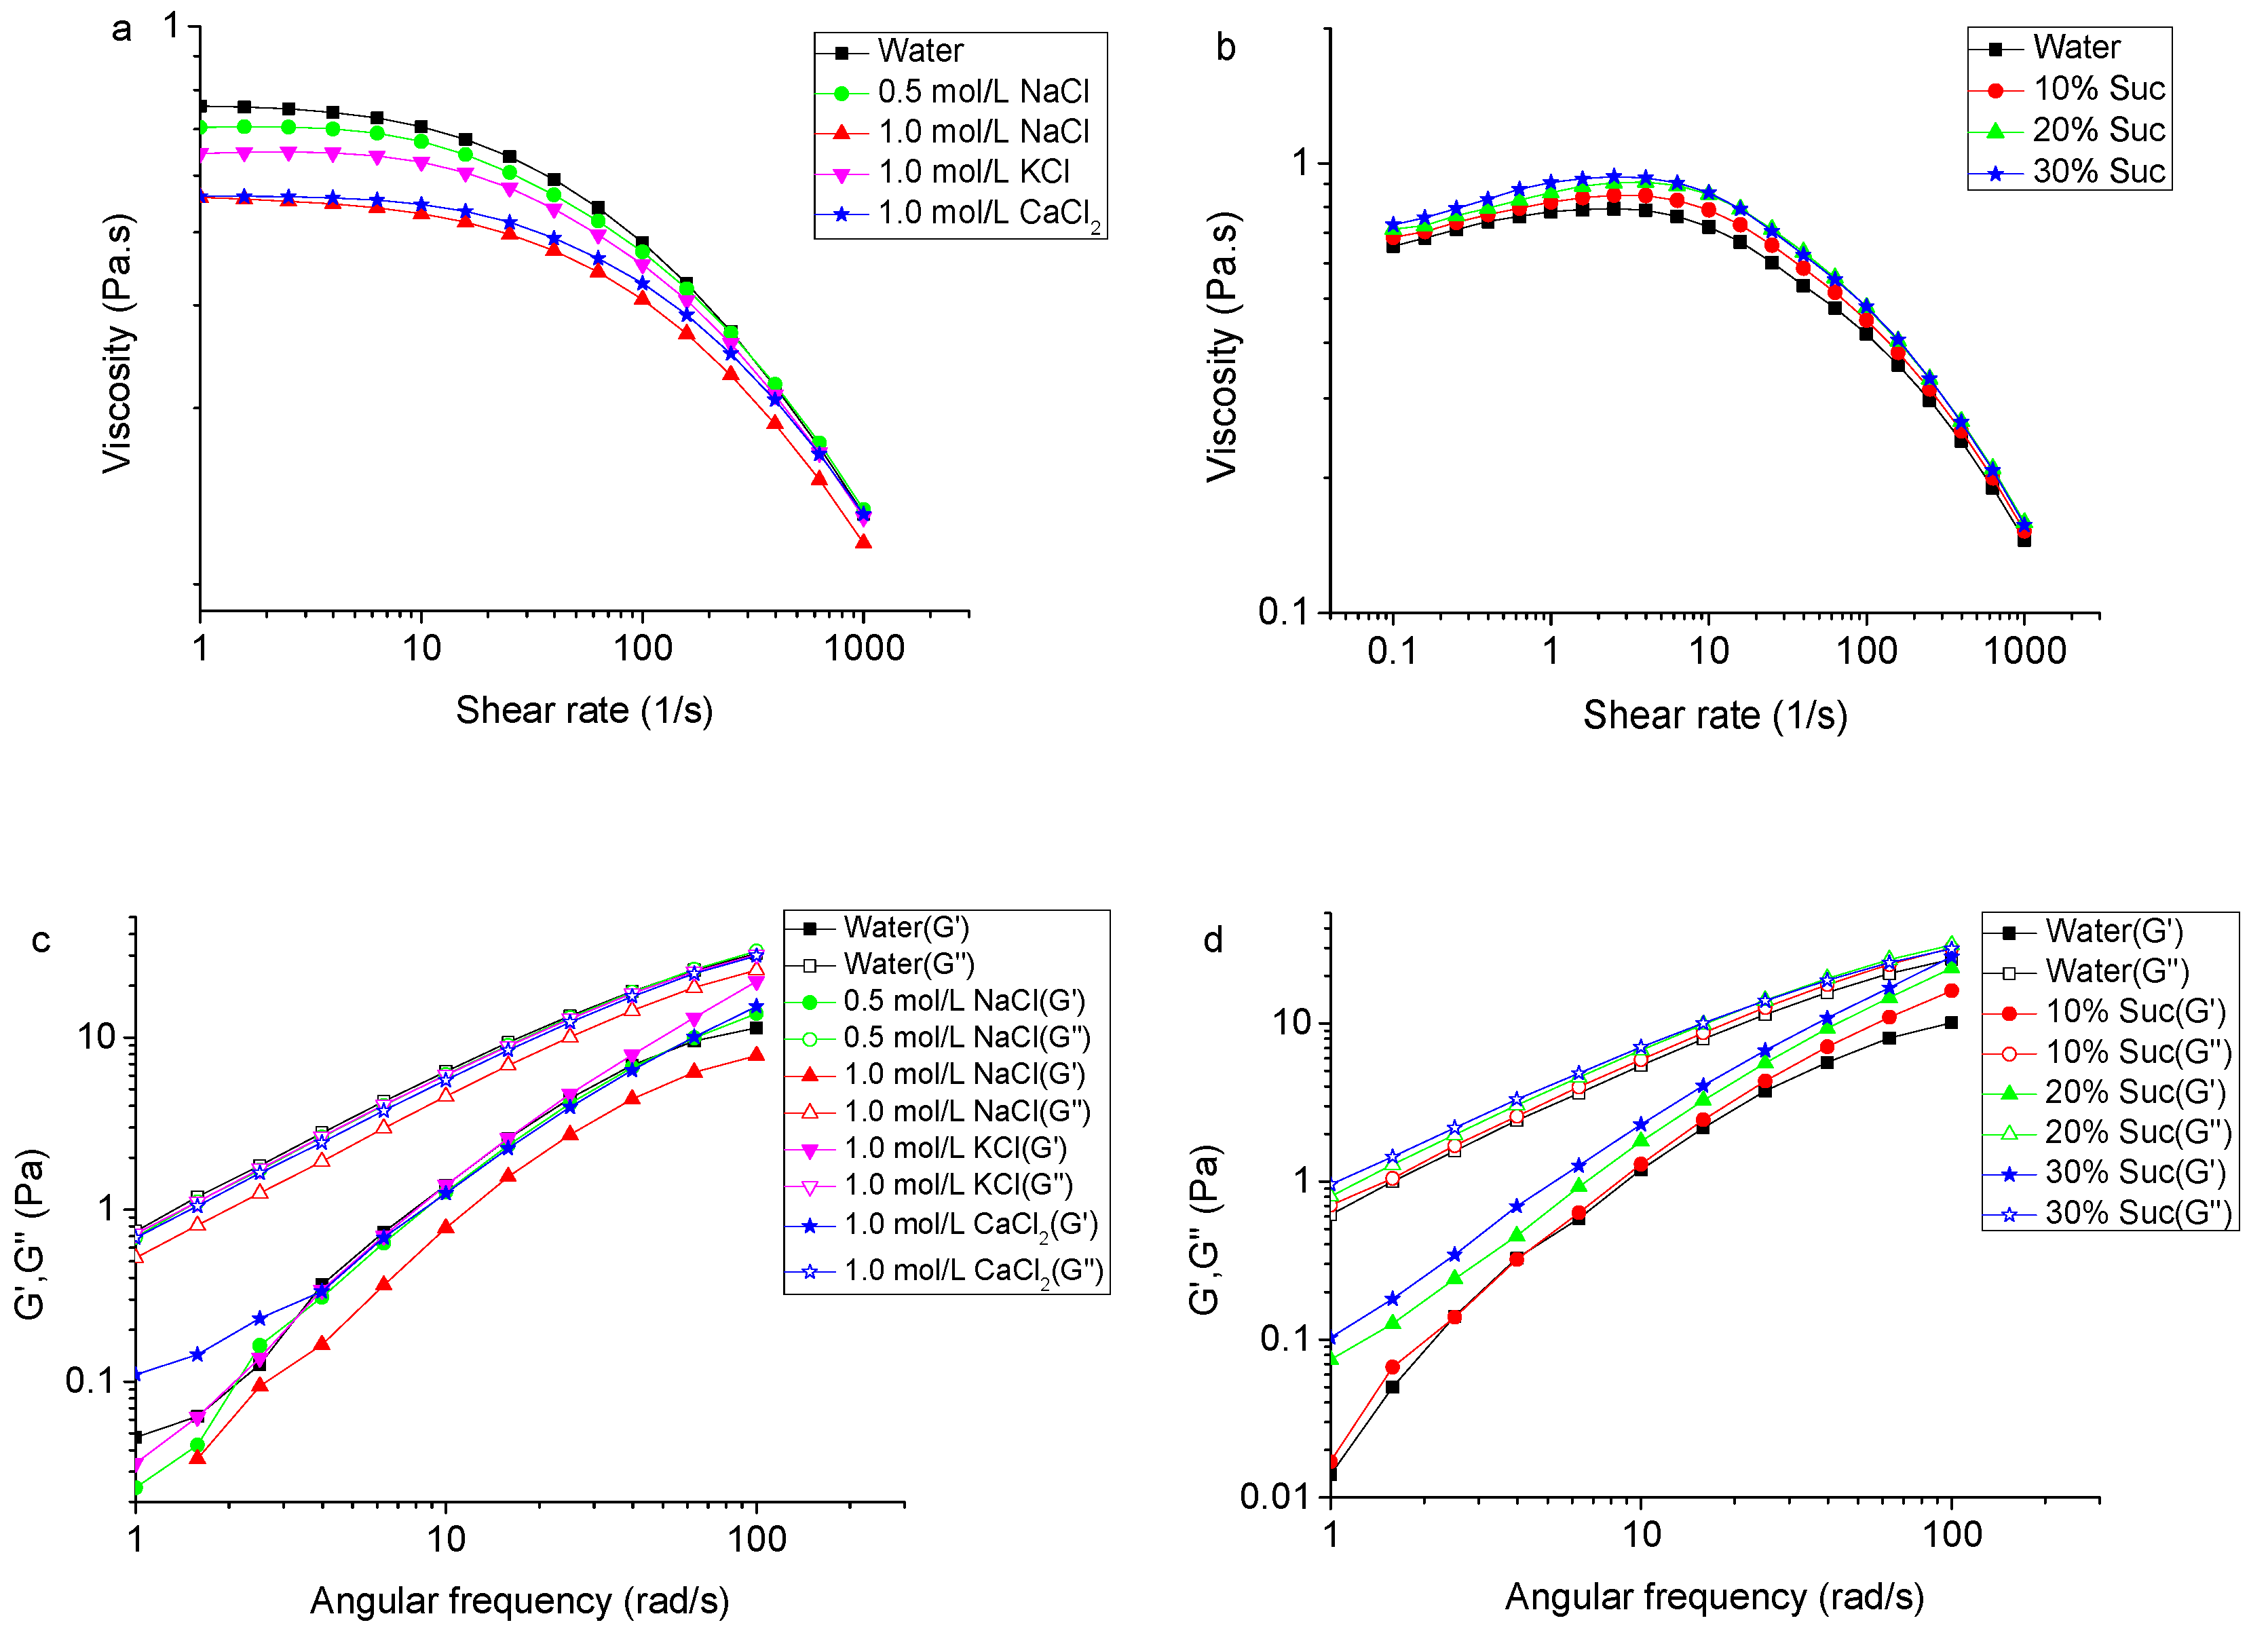
The effects of Na+, K+, Ca2+ ions, and sucrose on the rheological properties of TSP are shown in Figure 7. The results reveal that the presence of these salt ions decreased the apparent viscosity to an extent depending on the ion type (Figure 7a). However, sucrose did so inversely and slightly (Figure 7b). TSP solutions maintained their shear thinning behavior in the presence of salt ions or sucrose. As shown in Figure 7c, different ions had little effects on the viscoelasticity of the 2% TSP solution. When TSP was dissolved in 1.0 mol/L NaCl solution, the G′ and G″ decreased to an extent greater than the other ionic solutions. Figure 7d shows the effect of sucrose concentrations on the viscoelastic moduli of 2% TSP solution. The G″ was higher than G′ over the entire frequency range in sucrose concentrations, implying that the solution was viscous (liquid-like) rather than elastic (gel-like). The decrease of apparent viscosity of TSP by the addition of Na+ might be due to the charge screening of electrostatic repulsions of the trisaccharide side-chain, which led to a more compact conformation and a reduction in the hydrodynamic size of the molecule [43]. The apparent viscosity of xanthan also decreased in the presence of Na+ [43]. However, K+ can enhance the apparent viscosities of xanthan gum and gellan solutions, since the association of charged helical structures was facilitated in different ways [38,51]. The effects of sucrose on polysaccharides may be due to the fact that sucrose reduced the free water of the system, enhancing the interactions between the polysaccharide chains, and therefore contributing to the viscosity of the solution system [43,52]. An apparent viscosity increase with increasing sucrose concentration is also observed for highly methoxylated (HM) pectin [53] and xanthan gum [52].
3. Materials and Methods
3.1. Materials
Tamarind seeds were collected from Yunnan, China. Monosaccharide standards (l-rhamnose, l-fucose, d-glucose, d-xylose, d-galactose, d-mannose, d-arabinose, d-glucuronic acid, and d-galacturonic acid) were purchased from Sigma-Aldrich Co. (St. Louis, MO, USA). Ethanol, phenol, citric acid, boric acid, acetonitrile, NaNO3, trifluoroacetic acid TFA, HCl, H2SO4, NaOH, KBr, NaCl, KCl, CaCl2 and sucrose were purchased from Yuanye Bio-Technology Co. (Shanghai, China). All reagents used were of analytical grade unless otherwise specified.
3.2. Extraction of TSP
Peeled tamarind seeds were firstly milled into 80-mesh flour, and then treated with 80% ethanol (1:10 w/v) at 25 °C for 6 h. The residue was collected by centrifugation (8000× g, 20 min) and then dried. A portion (10.0 g) of the treated sample was extracted with citric acid solution (solid-liquid ratio of 1:40, pH 3.5) with constant stirring at 80 °C for 20 min. After centrifugeation (8000× g, 20 min), the supernatant was collected and precipitated with ethanol at the ratio of 1:1 (v/v), and kept at 4 °C for two hours. The precipitate was then vacuum dried to a constant weight. The yield of TSP was determined by the following equation:
3.3. Chemical Components Analyses
Total carbohydrate content was determined by the phenol-sulfuric acid method [54] using glucose, xylose, and galactose in a molar ratio of 3:2:1 as the standard. Uronic acid content was measured by the m-hydroxybiphenyl method using d-galacturonic acid as the standard [55]. Total protein content was tested by the Kjeldahl method with a protein conversion factor of 6.25. Moisture and ash content were determined according to the AACC 44-15A and AACC 08-01 method [56], respectively.
3.4. Determination of Molecular Weight
Molecular weight (Mw) of TSP was determined by high performance size exclusion chromatography (HPSEC) employing Ultrahydrogel™ 500 and Ultrahydrogel™ 2000 columns (Φ 7.8 mm × 300 mm, Waters, Milford, MA, USA). The TSP sample (2 mg/mL) was prepared with 0.1 mol/L NaNO3 and filtered through a 0.45 μm microporous membrane. The mobile phase was 0.1 mol/L NaNO3. The elution was carried out at a flow rate of 0.6 mL/min and column temperature of 35 °C. Dextrans of known Mw (Mw 5,250; 13,050; 36,800; 64,650; 135,350; 300,600 and 2,000,000 Da) were used for calibration.
3.5. Determination of Monosaccharide Compositions
The monosaccharide composition of TSP was determined on a HPLC system coupled with a UV detector (Waters) via pre-column derivatization with 1-phenyl-3-methyl-5-pyrazolone (PMP) according to Strydom’s study [57] with several modifications. Reference monosaccharides, including rhamnose, arabinose, galactose, glucose, mannose, xylose, fructose, glucuronic acid and galacturonic acid were used to identification and quantification of samples. Samples were firstly hydrolyzed by 4 M trifluoroacetic acid (TFA) at 110 °C for 2 h. The hydrolysates were derivatized with PMP in an alkaline environment at 70 °C for 100 min. The derivatives were then neutralized with hydrochloric acid and dried under a stream of nitrogen. Chloroform and water were added to extract the PMP derivatives. This was repeated three times. The chloroform extracts were combined and filtered through a 0.45 μm membrane. A C18 column (Φ4.6 mm × 250 mm, XBbridge™) was used to separate the derivatives. The mobile phase was the mixture of acetonitrile and 0.1 mol/ L phosphate buffer (pH 6.7) with the volume ratio of 17:83 at a flow rate of 0.8 mL/min.
3.6. FT-IR Spectroscopy
The samples were analyzed using FT-IR (Vertex 70, Bruker, Karlsruhe, Germany) with a spectral range of 400–4000 cm−1 and resolution of 16 cm−1. The transmission of the samples was measured in 7 mm diameter KBr pellets.
3.7. Rheological Behavior of TSP
TSP samples were dissolved in distilled water at a series of concentrations of 0.5%, 1.0%, 1.5%, 2.0%, 4.0%, 8.0%, and 10.0% (w/v) (pH 6.87 ± 0.02). The effects of salt ions (0.5 M NaCl, 1.0 M NaCl, 1.0 M KCl, 1.0 M CaCl2) and sucrose (10%, 20%, 30% w/v) on the rheological parameters of TSP were conducted at a concentration of 2.0% (w/v) TSP. The samples at 2.0% (w/v) were also studied using different pH buffer solution (pH 1, 4, 7, 10, and 13). All the samples were prepared by stirring for 1 h at 80 °C and then resting for 12 h before analyses.
Rheological characterization was carried out on a Discovery HR-3 rheometer (TA Instruments) with a stainless flat plate geometry (diameter = 40 mm). The measuring gap was set as 1000 μm. The temperature was controlled by a circulating water device, which was coupled to the Peltier system (a temperature control system). During the temperature variation experiments, the system was covered with a thermal insulation cover to prevent water evaporation. Before all rheological measurements, samples were loaded onto the plate of the rheometer and allowed to reach equilibrium (±0.5 °C) for 5 min. Viscosity curves were obtained by applying an increasing shear rate (1–1000 s−1) and a decreasing shear rate (1000–1 s−1) at 25 °C. Viscoelastic behaviors of samples were evaluated with respect to angular frequency (0.1–100 rad/s) at a strain of 2% at 25 °C. For the thermostability study, temperature sweeps were performed by heating from 5 to 85 °C, and subsequent cooling from 85 to 5 °C at 5 °C/min and at a constant shear rate (2 s−1, 60 s−1, 200 s−1).
3.8. Statistical Analysis
The TRIOS software (Version 3.3.0.4055), which plugged with several fitting models (such as Carreau, Carreau-Yasuda, Williamson and Cross), was employed for the rheological data. ORIGIN 8.6 software was employed to process the rheological results. All experiments were done in triplicate. The differences between data were analyzed by Tukey’s tests and considered different at a significant level of p < 0.05.
4. Conclusions
This study investigated the chemical components and rheological properties of the polysaccharide from tamarind seed collected from Yunnan, China. The main monosaccharides of TSP with a Mw of 1735 kDa were glucose, xylose and galactose at a molar ratio of 2.9:1.8:1.0. TSP presented pseudoplastic behavior in water solution. The pH-resistance of TSP solution viscosity was excellent in the range of pH 1–10. The apparent viscosity of the TSP solution decreased with increasing temperature and ion concentration, but increased with sucrose concentration. Temperature, pH, salt ions, as well as the sucrose concentration were identified to slightly affect the rheological properties of TSP. With the aim of investigating the application of TSP in acidic beverages, high temperature processed foodstuffs, high-salt and high-sugar foods as thickener and stabilizer, further studies will focus on the interaction of TSP with food components.
Supplementary Materials
The following Supplementary Materials are available online: Figure S1: The elution curve of PMP derivatives of mixed monosaccharide standards hydrolysate by HPLC. Figure S2: Strain dependency of shear modulus G′(storage) and G″(loss) of TSP at different concentrations at 25 °C.
Author Contributions
H.S. and H.Z. designed the experiments; H.S., H.Z., Y.T. and Z.S. performed the experiments; H.S. and H.Z. wrote the manuscript; P.F.H.L. polished the manuscript; L.A. supervised the study and all experiments. All authors provided many valuable discussions on the content of the manuscript and approved the submission.
Funding
This work was supported by the National Natural Science Foundation of China (No. 31771956 and No. 31601428), and Key Research & Development Project of Shandong Province (No. 2018YYSP003).
Conflicts of Interest
The authors declare no conflict of interest.
References
- Cardoso Lima Reis, P.M.; Dariva, C.; Barroso Vieira, G.Â.; Hense, H. Extraction and evaluation of antioxidant potential of the extracts obtained from tamarind seeds (Tamarindus indica), sweet variety. J. Food Eng. 2016, 173, 116–123. [Google Scholar] [CrossRef]
- Miyazaki, S.; Suisha, F.; Kawasaki, N.; Shirakawa, M.; Yamatoya, K.; Attwood, D. Thermally reversible xyloglucan gels as vehicles for rectal drug delivery. J. Control. Release 1998, 56, 75–83. [Google Scholar] [CrossRef]
- Kozioł, A.; Cybulska, J.; Pieczywek, P.M.; Zdunek, A. Evaluation of structure and assembly of xyloglucan from tamarind seed (Tamarindus indica L.) with atomic force microscopy. Food Biophys. 2015, 10, 396–402. [Google Scholar] [CrossRef] [PubMed]
- Cao, Y.; Ikeda, I. Antioxidant activity and antitumor activity (in vitro) of xyloglucan selenious ester and sulfated xyloglucan. Int. J. Biol. Macromol. 2009, 45, 231–235. [Google Scholar] [CrossRef]
- Kato, Y.; Uchida, J.; Ito, S.; Mitsuishi, Y. Structural analysis of the oligosaccharide units of xyloglucan and their effects on growth of COLO 201 human tumor cells. Int. Congr. Ser. 2001, 1223, 161–164. [Google Scholar] [CrossRef]
- Kaur, H.; Yadav, S.; Ahuja, M.; Dilbaghi, N. Synthesis, characterization and evaluation of thiolated tamarind seed polysaccharide as a mucoadhesive polymer. Carbohydr. Polym. 2012, 90, 1543–1549. [Google Scholar] [CrossRef]
- Shirakawa, M.; Yamatoya, K.; Nishinari, K. Tailoring of xyloglucan properties using an enzyme. Food Hydrocoll. 1998, 12, 25–28. [Google Scholar] [CrossRef]
- Simi, C.K.; Abraham, T.E. Physico chemical properties of aminated tamarind xyloglucan. Colloids Surf. B 2010, 81, 513–520. [Google Scholar] [CrossRef]
- Ibrahim, N.A.; Abo-Shosha, M.H.; Allam, E.A.; El-Zairy, E.M. New thickening agents based on tamarind seed gum and karaya gum polysaccharides. Carbohydr. Polym. 2010, 81, 402–408. [Google Scholar] [CrossRef]
- Sims, I.M.; Gane, A.M.; Dunstan, D.; Allan, G.C.; Boger, D.V.; Melton, L.D.; Bacic, A. Rheological properties of xyloglucans from different plant species. Carbohydr. Polym. 1998, 37, 61–69. [Google Scholar] [CrossRef]
- Busato, A.P.; Reicher, F.; Domingues, R.; Silveira, J.L.M. Rheological properties of thermally xyloglucan gel from the seeds of Hymenaea courbaril. Mater. Sci. Eng. C 2009, 29, 410–414. [Google Scholar] [CrossRef]
- Yamanaka, S.; Yuguchi, Y.; Urakawa, H.; Kajiwara, K.; Shirakawa, M.; Yamatoya, K. Gelation of tamarind seed polysaccharide xyloglucan in the presence of ethanol. Food Hydrocoll. 2000, 14, 125–128. [Google Scholar] [CrossRef]
- Ikeda, S.; Nitta, Y.; Kim, B.S.; Temsiripong, T.; Pongsawatmanit, R.; Nishinari, K. Single-phase mixed gels of xyloglucan and gellan. Food Hydrocoll. 2004, 18, 669–675. [Google Scholar] [CrossRef]
- Yoshimura, M.; Takaya, T.; Nishinari, K. Effects of xyloglucan on the gelatinization and retrogradation of corn starch as studied by rheology and differential scanning calorimetry. Food Hydrocoll. 1999, 13, 101–111. [Google Scholar] [CrossRef]
- Nayak, A.K.; Pal, D.; Santra, K. Screening of polysaccharides from tamarind, fenugreek and jackfruit seeds as pharmaceutical excipients. Int. J. Biol. Macromol. 2015, 79, 756–760. [Google Scholar] [CrossRef] [PubMed]
- Freitas, R.A.; Martin, S.; Santos, G.L.; Valenga, F.; Buckeridge, M.S.; Reicher, F.; Sierakowski, M.R. Physico-chemical properties of seed xyloglucans from different sources. Carbohydr. Polym. 2005, 60, 507–514. [Google Scholar] [CrossRef]
- Lima, D.U.; Loh, W.; Buckeridge, M.S. Xyloglucan-cellulose interaction depends on the sidechains and molecular weight of xyloglucan. Plant Physiol. Biochem. 2004, 42, 389–394. [Google Scholar] [CrossRef]
- Khanna, M. Standardization of tamarind seed polyose for pharmaceutical use. Ind. Drugs 1987, 24, 268–274. [Google Scholar]
- Albuquerque, P.B.S.; Barros, W.; Santos, G.R.C.; Correia, M.T.S.; Mourao, P.A.S.; Teixeira, J.A.; Carneiro-da-Cunha, M.G. Characterization and rheological study of the galactomannan extracted from seeds of Cassia grandis. Carbohydr. Polym. 2014, 104, 127–134. [Google Scholar] [CrossRef]
- Yang, W.; Wang, Y.; Li, X.; Yu, P. Purification and structural characterization of Chinese yam polysaccharide and its activities. Carbohydr. Polym. 2015, 117, 1021–1027. [Google Scholar] [CrossRef]
- Shu, G.; Jiang, S.; Mu, J.; Yu, H.; Duan, H.; Deng, X. Antitumor immunostimulatory activity of polysaccharides from Panax japonicus C. A. Mey: Roles of their effects on CD4 + T cells and tumor associated macrophages. Int. J. Biol. Macromol. 2018, 111, 430–439. [Google Scholar] [CrossRef]
- Andrade, L.A.; Nunes, C.A.; Pereira, J. Relationship between the chemical components of taro rhizome mucilage and its emulsifying property. Food Chem. 2015, 178, 331–338. [Google Scholar] [CrossRef]
- Kong, L.; Yu, L.; Feng, T.; Yin, X.; Liu, T.; Dong, L. Physicochemical characterization of the polysaccharide from Bletilla striata: Effect of drying method. Carbohydr. Polym. 2015, 125, 1–8. [Google Scholar] [CrossRef]
- Figueiro, S.D.; Goes, J.C.; Moreira, R.A.; Sombra, A.S.B. On the physico-chemical and dielectric properties of glutaraldehyde crosslinked galactomannan–collagen films. Carbohydr. Polym. 2004, 56, 313–320. [Google Scholar] [CrossRef]
- Khounvilay, K.; Sittikijyothin, W. Rheological behaviour of tamarind seed gum in aqueous solutions. Food Hydrocoll. 2012, 26, 334–338. [Google Scholar] [CrossRef]
- Chagas, B.S.; Machado, D.L.P.; Haag, R.B.; Souza, C.R.D.; Lucas, E.F. Evaluation of hydrophobically associated polyacrylamide-containing aqueous fluids and their potential use in petroleum recovery. J. Appl. Polym. Sci. 2004, 91, 7. [Google Scholar] [CrossRef]
- Alpizar-Reyes, E.; Roman-Guerrero, A.; Gallardo-Rivera, R.; Varela-Guerrero, V.; Cruz-Olivares, J.; Perez-Alonso, C. Rheological properties of tamarind (Tamarindus indica L.) seed mucilage obtained by spray-drying as a novel source of hydrocolloid. Int. J. Biol. Macromol. 2018, 107, 817–824. [Google Scholar] [CrossRef] [PubMed]
- Williamson, R.V. The flow of pseudoplastic materials. Ind. Eng. Chem. 1929, 21, 1108–1111. [Google Scholar] [CrossRef]
- Zhang, H.; Zhang, N.; Xiong, Z.; Wang, G.; Xia, Y.; Lai, P.; Ai, L. Structural characterization and rheological properties of beta-D-glucan from hull-less barley (Hordeum vulgare L. var. nudum Hook. f.). Phytochemistry 2018, 155, 155–163. [Google Scholar] [CrossRef] [PubMed]
- Martín-Alfonso, J.E.; Cuadri, A.A.; Berta, M.; Stading, M. Relation between concentration and shear-extensional rheology properties of xanthan and guar gum solutions. Carbohydr. Polym. 2018, 181, 63–70. [Google Scholar] [CrossRef]
- Martínez-Padilla, L.P.; García-Rivera, J.L.; Romero-Arreola, V.; Casas-Alencáster, N.B. Effects of xanthan gum rheology on the foaming properties of whey protein concentrate. J. Food Eng. 2015, 156, 22–30. [Google Scholar] [CrossRef]
- Papagiannopoulos, A.; Sotiropoulos, K.; Pispas, S. Particle tracking microrheology of the power-law viscoelasticity of xanthan solutions. Food Hydrocoll. 2016, 61, 201–210. [Google Scholar] [CrossRef]
- Elfak, A.M.; Pass, G.; Phillips, G.O. The effect of shear rate on the viscosity of solutions of sodium carboxymethylcellulose and k-carrageenan. J. Sci. Food Agric. 2010, 30, 724–730. [Google Scholar] [CrossRef]
- Yoon, C.; Heister, S.D.; Campanella, O.H. Modeling gelled fluid flow with thixotropy and rheological hysteresis effects. Fuel 2014, 128, 467–475. [Google Scholar] [CrossRef]
- Liu, G.; Liu, Y.; Wang, Z.; Lei, Y.; Chen, Z.; Deng, L. The effects of temperature, organic matter and time-dependency on rheological properties of dry anaerobic digested swine manure. Waste Manag. 2015, 38, 449–454. [Google Scholar] [CrossRef] [PubMed]
- Karimi, N.; Mohammadifar, M.A. Role of water soluble and water swellable fractions of gum tragacanth on stability and characteristic of model oil in water emulsion. Food Hydrocoll. 2014, 37, 124–133. [Google Scholar] [CrossRef]
- Ma, F.; Zhang, Y.; Liu, N.; Zhang, J.; Tan, G.; Kannan, B.; Liu, X.; Bell, A.E. Rheological properties of polysaccharides from Dioscorea opposita Thunb. Food Chem. 2017, 227, 64–72. [Google Scholar] [CrossRef] [PubMed]
- Choppe, E.; Puaud, F.; Nicolai, T.; Benyahia, L. Rheology of xanthan solutions as a function of temperature, concentration and ionic strength. Carbohydr. Polym. 2010, 82, 1228–1235. [Google Scholar] [CrossRef]
- Eren, N.M.; Santos, P.H.S.; Campanella, O. Mechanically modified xanthan gum: Rheology and polydispersity aspects. Carbohydr. Polym. 2015, 134, 475–484. [Google Scholar] [CrossRef]
- Ross-Murphy, S.B.; Shatwell, K.P.; Sutherland, I.W.; Dea, I.C.M. Influence of acyl substituents on the interaction of xanthans with plant polysaccharides. Food Hydrocoll. 1996, 10, 117–122. [Google Scholar] [CrossRef]
- Pongsawatmanit, R.; Temsiripong, T.; Ikeda, S.; Nishinari, K. Influence of tamarind seed xyloglucan on rheological properties and thermal stability of tapioca starch. J. Food Eng. 2006, 77, 41–50. [Google Scholar] [CrossRef]
- Chen, R.H.; Chen, W.Y. Rheological properties of the water-soluble mucilage of a green laver, monostroma nitidium. J. Appl. Phycol. 2001, 13, 481–488. [Google Scholar] [CrossRef]
- Bak, J.H.; Yoo, B. Intrinsic viscosity of binary gum mixtures with xanthan gum and guar gum: Effect of NaCl, sucrose, and pH. Int. J. Biol. Macromol. 2018, 111, 77–81. [Google Scholar] [CrossRef]
- Oh, M.H.; So, J.H.; Yang, S.M. Rheological Evidence for the Silica-Mediated Gelation of Xanthan Gum. J. Colloid Interface Sci. 1999, 216, 320–328. [Google Scholar] [CrossRef] [PubMed]
- Thakur, B.R.; Singh, R.K.; Handa, A.K.; Rao, M.A. Chemistry and uses of pectin—A review. Crit. Rev. Food Sci. Nutr. 1997, 37, 47–73. [Google Scholar] [CrossRef] [PubMed]
- Ross-Murphy, S.B. Structure-property relationships in food biopolymer gels and solutions. J. Rheol. 1998, 39, 1451–1463. [Google Scholar] [CrossRef]
- Reinoso, D.; Martin-Alfonso, M.J.; Luckham, P.F.; Martinez-Boza, F.J. Rheological characterisation of xanthan gum in brine solutions at high temperature. Carbohydr. Polym. 2019, 203, 103–109. [Google Scholar] [CrossRef]
- Guo, Q.; Wang, Q.; Cui, S.W.; Kang, J.; Hu, X.; Xing, X.; Yada, R.Y. Conformational properties of high molecular weight heteropolysaccharide isolated from seeds of Artemisia sphaerocephala Krasch. Food Hydrocoll. 2013, 32, 155–161. [Google Scholar] [CrossRef]
- Mehdizadeh, H.; Najafi Kani, E. Rheology and apparent activation energy of alkali activated phosphorous slag. Constr. Build. Mater. 2018, 171, 197–204. [Google Scholar] [CrossRef]
- Timmons, J.; Falzone, G.; Balonis, M.; Bauchy, M.; Sant, G. Anomalous variations in the viscous activation energy of suspensions induced by fractal structuring. J. Colloid Interface Sci. 2018, 530, 603–609. [Google Scholar] [CrossRef]
- Xu, L.; Dong, M.; Gong, H.; Sun, M.; Li, Y. Effects of inorganic cations on the rheology of aqueous welan, xanthan, gellan solutions and their mixtures. Carbohydr. Polym. 2015, 121, 147–154. [Google Scholar] [CrossRef] [PubMed]
- Saggin, R.; Coupland, J.N. Rheology of xanthan/sucrose mixtures at ultrasonic frequencies. J. Food Eng. 2004, 65, 49–53. [Google Scholar] [CrossRef]
- Morris, E.R.; Powell, D.A.; Gidley, M.J.; Rees, D.A. Conformations and interactions of pectins: I. Polymorphism between gel and solid states of calcium polygalacturonate. J. Mol. Biol. 1982, 155, 507–516. [Google Scholar] [CrossRef]
- Dubois, M.; Gilles, K.A.; Hamilton, J.K.; Rebers, P.A.; Smith, F. Colorimetric method for determination of sugars and related substances. Anal. Chem. 1956, 28, 350–356. [Google Scholar] [CrossRef]
- Blumenkrantz, N.; Asboe-Hansen, G. New method for quantitative determination of uronic acids. Anal. Biochem. 1973, 54, 484–489. [Google Scholar] [CrossRef]
- AACC. AACC Approved Method of the AACC, 10th ed.; Association of Cereal Chemists: St. Paul, MN, USA, 2000. [Google Scholar]
- Strydom, D.J. Chromatographic separation of 1-phenyl-3-methyl-5-pyrazolone-derivatized neutral, acidic and basic aldoses. J. Chromatogr. A 1994, 678, 17–23. [Google Scholar] [CrossRef]
Sample Availability: Samples of the compounds are available from the authors. |
Figure 1.
(a) The elution curve of TSP solution at 2 mg/mL by HPSEC; (b) The elution curve of PMP derivatives of TSP hydrolysate by HPLC.
Figure 1.
(a) The elution curve of TSP solution at 2 mg/mL by HPSEC; (b) The elution curve of PMP derivatives of TSP hydrolysate by HPLC.
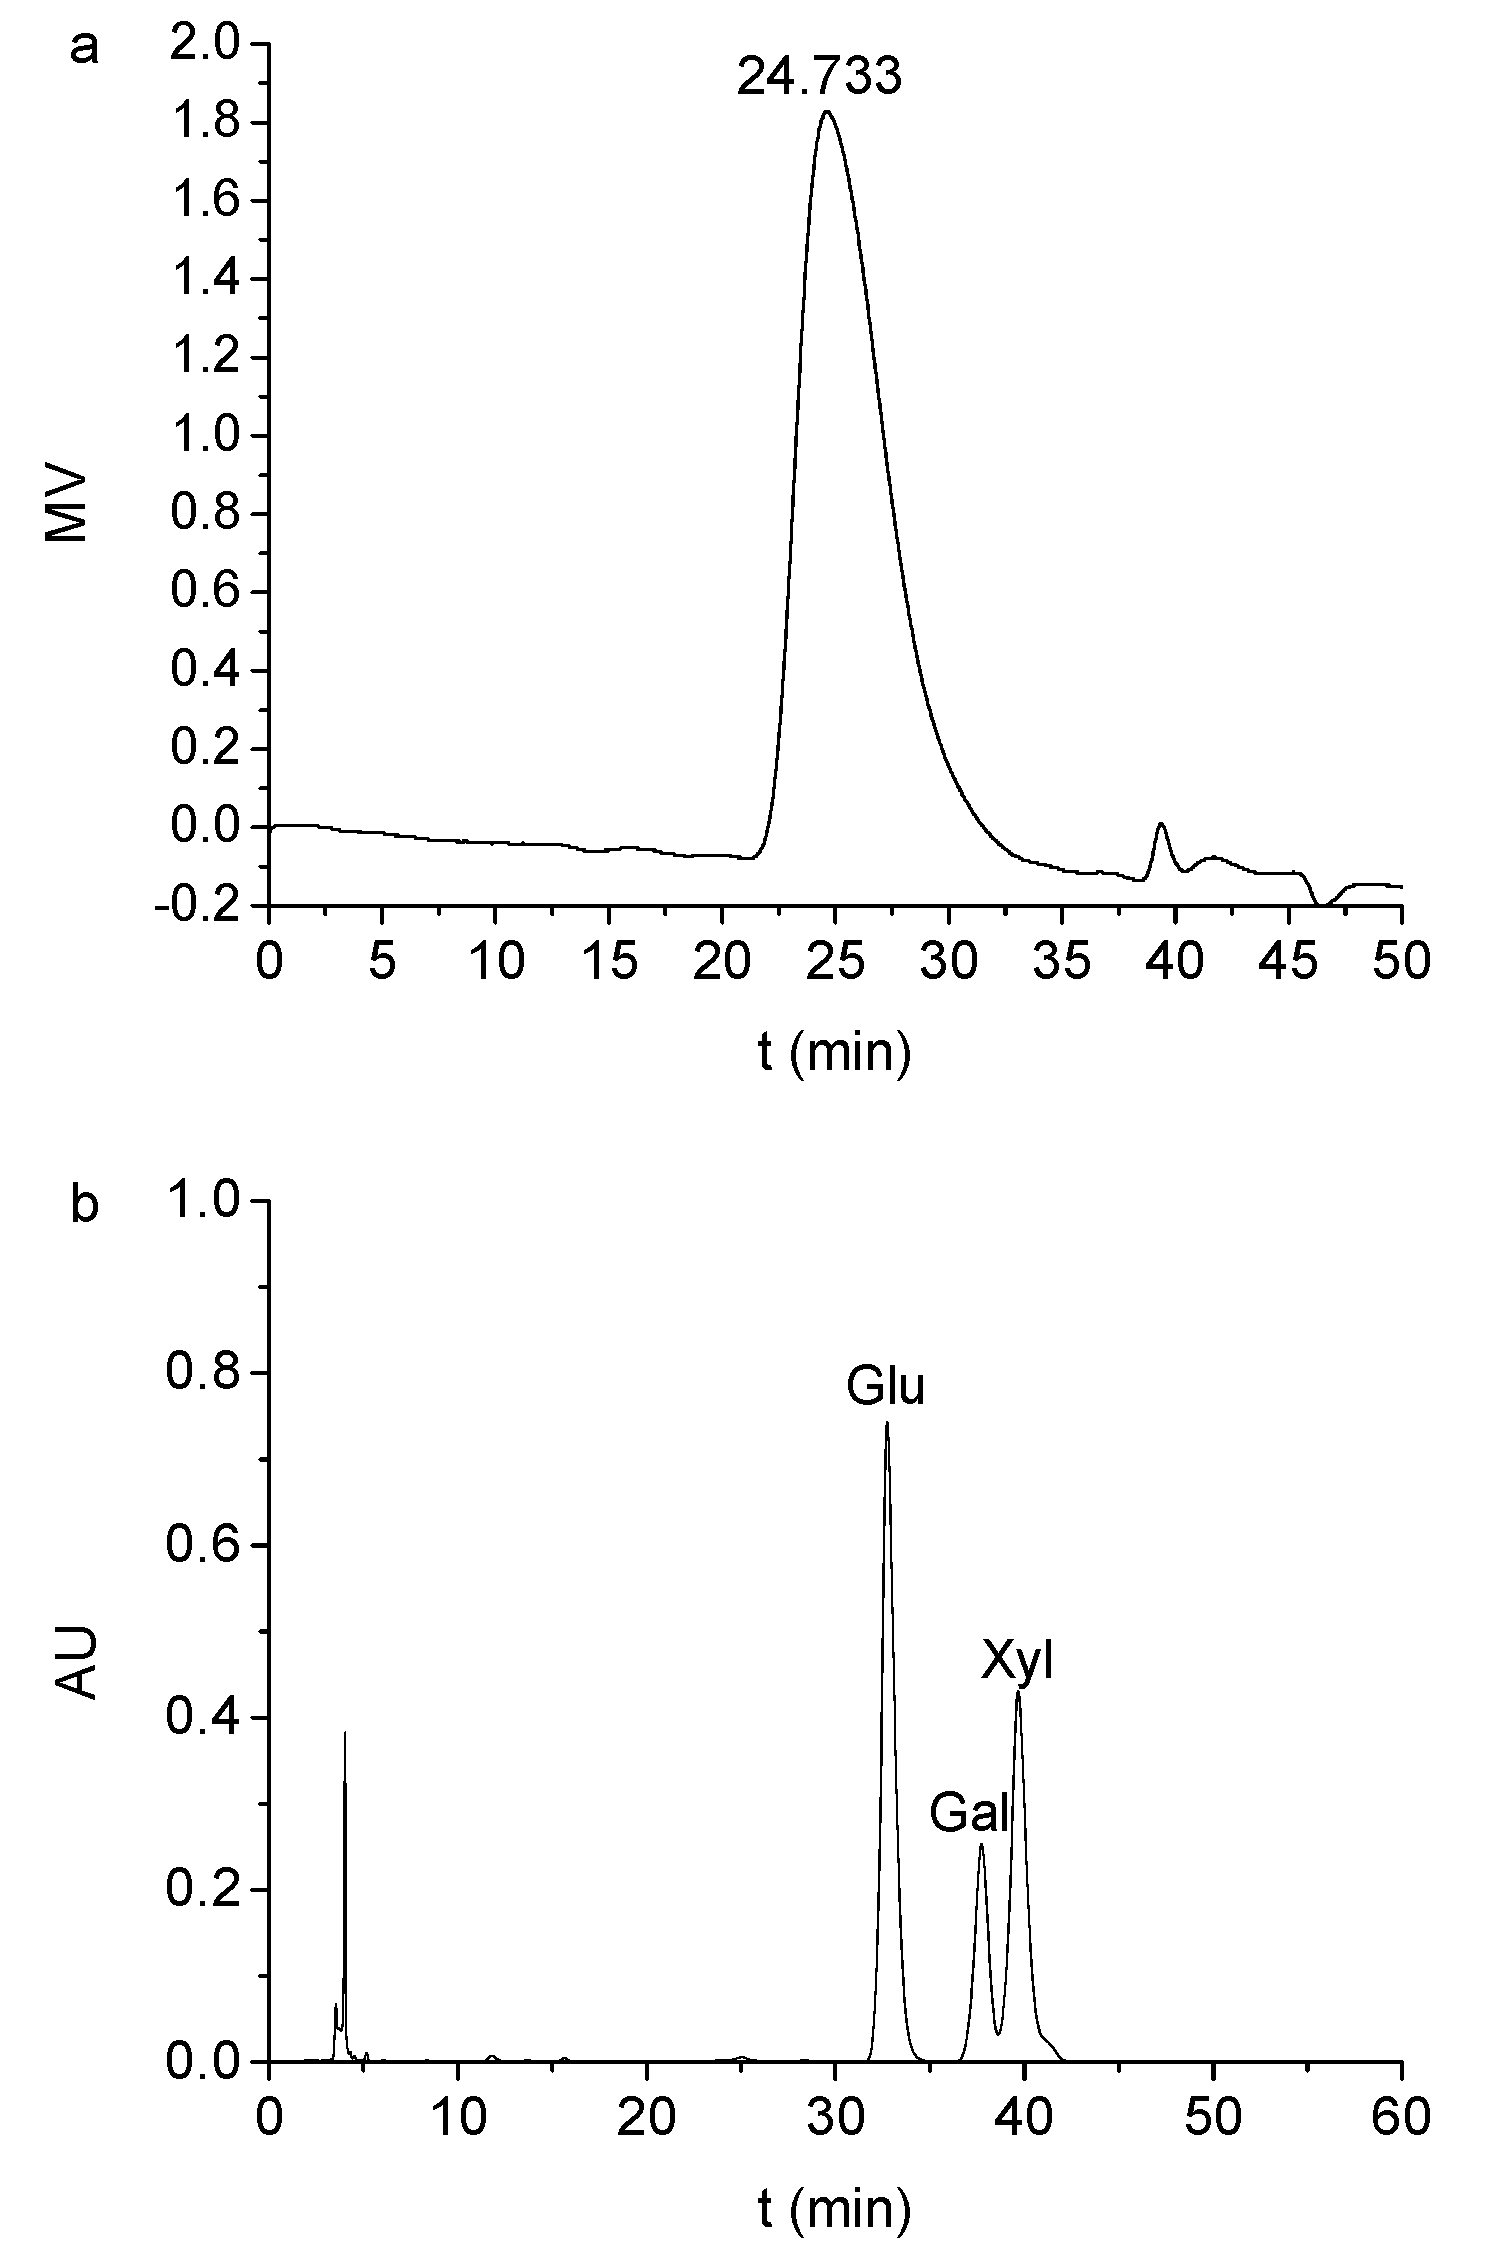
Figure 2.
FT-IR spectrum of TSP.
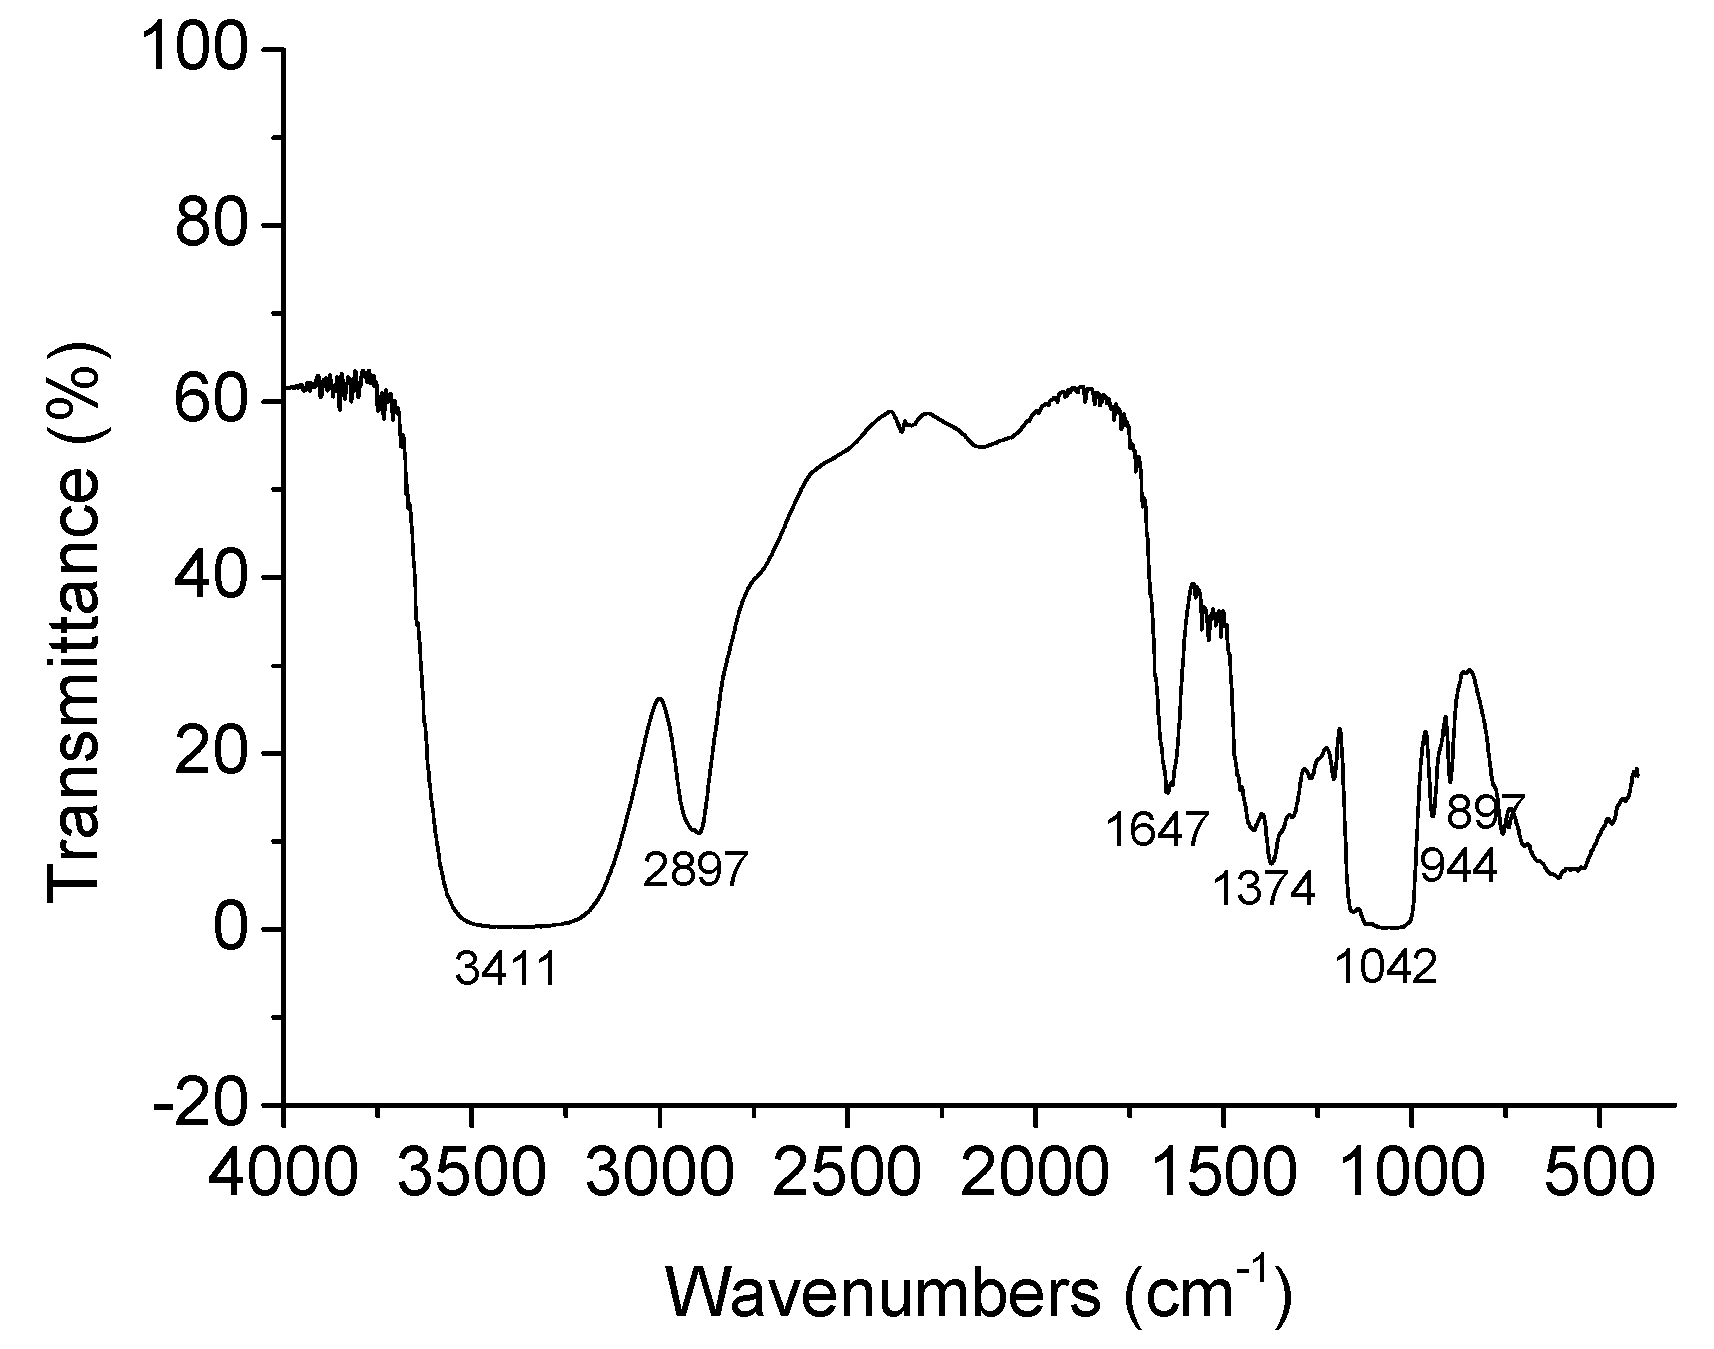
Figure 3.
Apparent viscosity changes of TSP at different concentrations (w/v) at 25 °C with shear rates ranging from 1 to 1000 s−1 (solid symbol) and from 1000 to 1 s−1 (hollow symbol).
Figure 3.
Apparent viscosity changes of TSP at different concentrations (w/v) at 25 °C with shear rates ranging from 1 to 1000 s−1 (solid symbol) and from 1000 to 1 s−1 (hollow symbol).

Figure 4.
(a) Angular frequency dependencies of shear modulus G′(storage) and G″(loss) of TSP at different concentrations at 25 °C; (b) Angular frequency dependency of tan δ of TSP at different concentrations at 25 °C.
Figure 4.
(a) Angular frequency dependencies of shear modulus G′(storage) and G″(loss) of TSP at different concentrations at 25 °C; (b) Angular frequency dependency of tan δ of TSP at different concentrations at 25 °C.
Figure 5.
(a) Effect of pH on the apparent viscosity of TSP at the concentration of 2% (w/v) at 25 °C; (b) Effect of pH on dynamic modulus of TSP at the concentration of 2% (w/v) at 25 °C.
Figure 5.
(a) Effect of pH on the apparent viscosity of TSP at the concentration of 2% (w/v) at 25 °C; (b) Effect of pH on dynamic modulus of TSP at the concentration of 2% (w/v) at 25 °C.

Figure 6.
(a) Effects of temperature on the apparent viscosity of TSP (2%, w/v) at different shear rates; (b) Effects of temperature on dynamic modulus of TSP (2%, w/v) at 2 s−1; (c) Arrhenius plots for apparent viscosities of TSP solution (2%, w/v) at different shear rates.
Figure 6.
(a) Effects of temperature on the apparent viscosity of TSP (2%, w/v) at different shear rates; (b) Effects of temperature on dynamic modulus of TSP (2%, w/v) at 2 s−1; (c) Arrhenius plots for apparent viscosities of TSP solution (2%, w/v) at different shear rates.

Figure 7.
(a) Effect of Na+, K+, Ca2+ on the apparent viscosity of TSP (2%, w/v) at 25 °C; (b) Effect of sucrose on the apparent viscosity of TSP (2%, w/v) at 25 °C; (c) Effect of Na+, K+, Ca2+ on dynamic modulus of TSP (2%, w/v) at 25 °C; (d) Effect of sucrose on dynamic modulus of TSP (2%, w/v) at 25 °C.

Table 1.
Fitting parameters of Williamson model for TSP solutions at a series of concentrations.
| Concentration (%, w/v) | η0 (Pa·s) | λw (s) | n | R2 |
|---|---|---|---|---|
| 0.5 | 0.009 | 0.00003 | 0.659 | 0.9686 |
| 1.0 | 0.057 | 0.0007 | 0.699 | 0.9164 |
| 1.5 | 0.251 | 0.003 | 0.741 | 0.9999 |
| 2.0 | 0.953 | 0.008 | 0.753 | 0.9997 |
| 4.0 | 13.843 | 0.047 | 0.772 | 0.9999 |
Table 2.
Fitting parameters of Arrhenius equation for 2% (w/v) TSP solutions.
| (s−1) | lnη0 (Pa.s) | Ea (kJ/mol) | R2 |
|---|---|---|---|
| 2 | −12.778 | 32.208 | 0.9987 |
| 60 | −10.106 | 24.435 | 0.9903 |
| 200 | −8.435 | 19.388 | 0.9814 |
© 2019 by the authors. Licensee MDPI, Basel, Switzerland. This article is an open access article distributed under the terms and conditions of the Creative Commons Attribution (CC BY) license (http://creativecommons.org/licenses/by/4.0/).
Share and Cite
MDPI and ACS Style
Shao, H.; Zhang, H.; Tian, Y.; Song, Z.; Lai, P.F.H.; Ai, L. Composition and Rheological Properties of Polysaccharide Extracted from Tamarind (Tamarindus indica L.) Seed. Molecules 2019, 24, 1218. https://doi.org/10.3390/molecules24071218
AMA Style
Shao H, Zhang H, Tian Y, Song Z, Lai PFH, Ai L. Composition and Rheological Properties of Polysaccharide Extracted from Tamarind (Tamarindus indica L.) Seed. Molecules. 2019; 24(7):1218. https://doi.org/10.3390/molecules24071218
Chicago/Turabian StyleShao, Huimin, Hui Zhang, Yanjun Tian, Zibo Song, Phoency F. H. Lai, and Lianzhong Ai. 2019. "Composition and Rheological Properties of Polysaccharide Extracted from Tamarind (Tamarindus indica L.) Seed" Molecules 24, no. 7: 1218. https://doi.org/10.3390/molecules24071218