
Determination of Ascorbic Acid, Total Ascorbic Acid, and Dehydroascorbic Acid in Bee Pollen Using Hydrophilic Interaction Liquid Chromatography-Ultraviolet Detection


Abstract
:1. Introduction
2. Results and Discussion
3. Materials and Methods
3.1. Chemicals
3.2. Sample Preparation
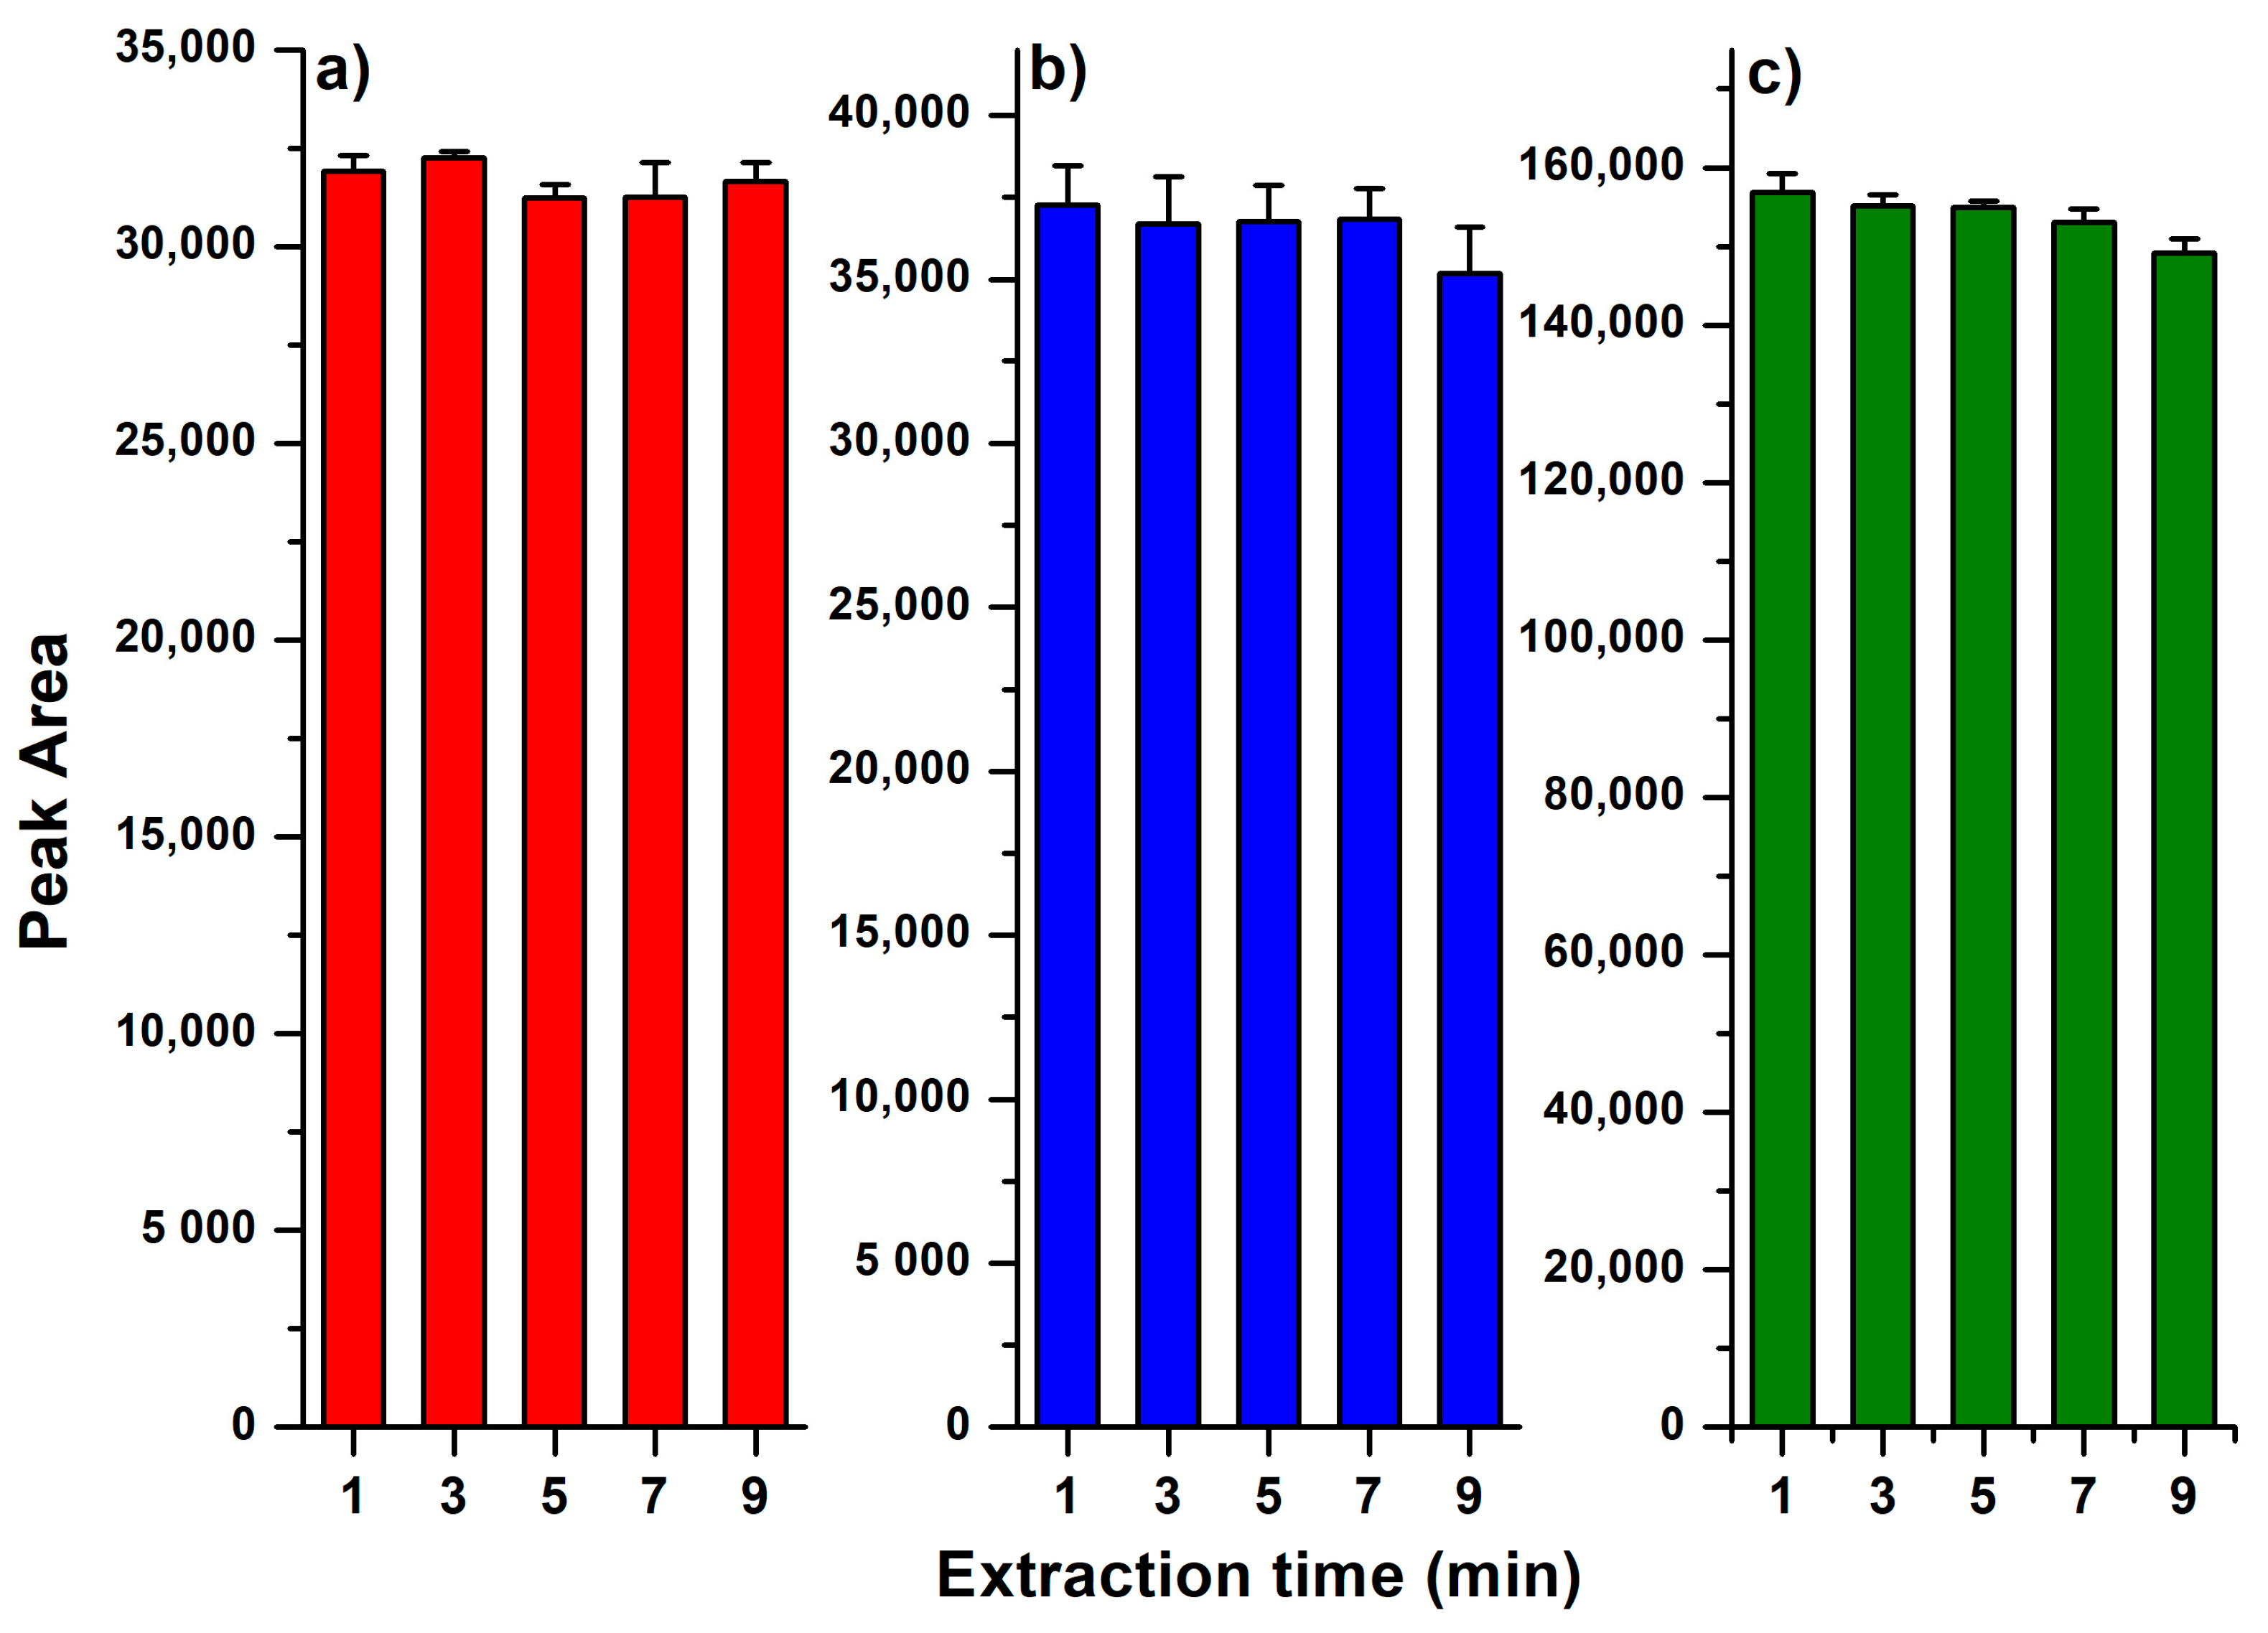
3.3. Effect of Ultrasonic Extraction Time
3.4. Effect of TCEP Concentration on the Recovery of DHA
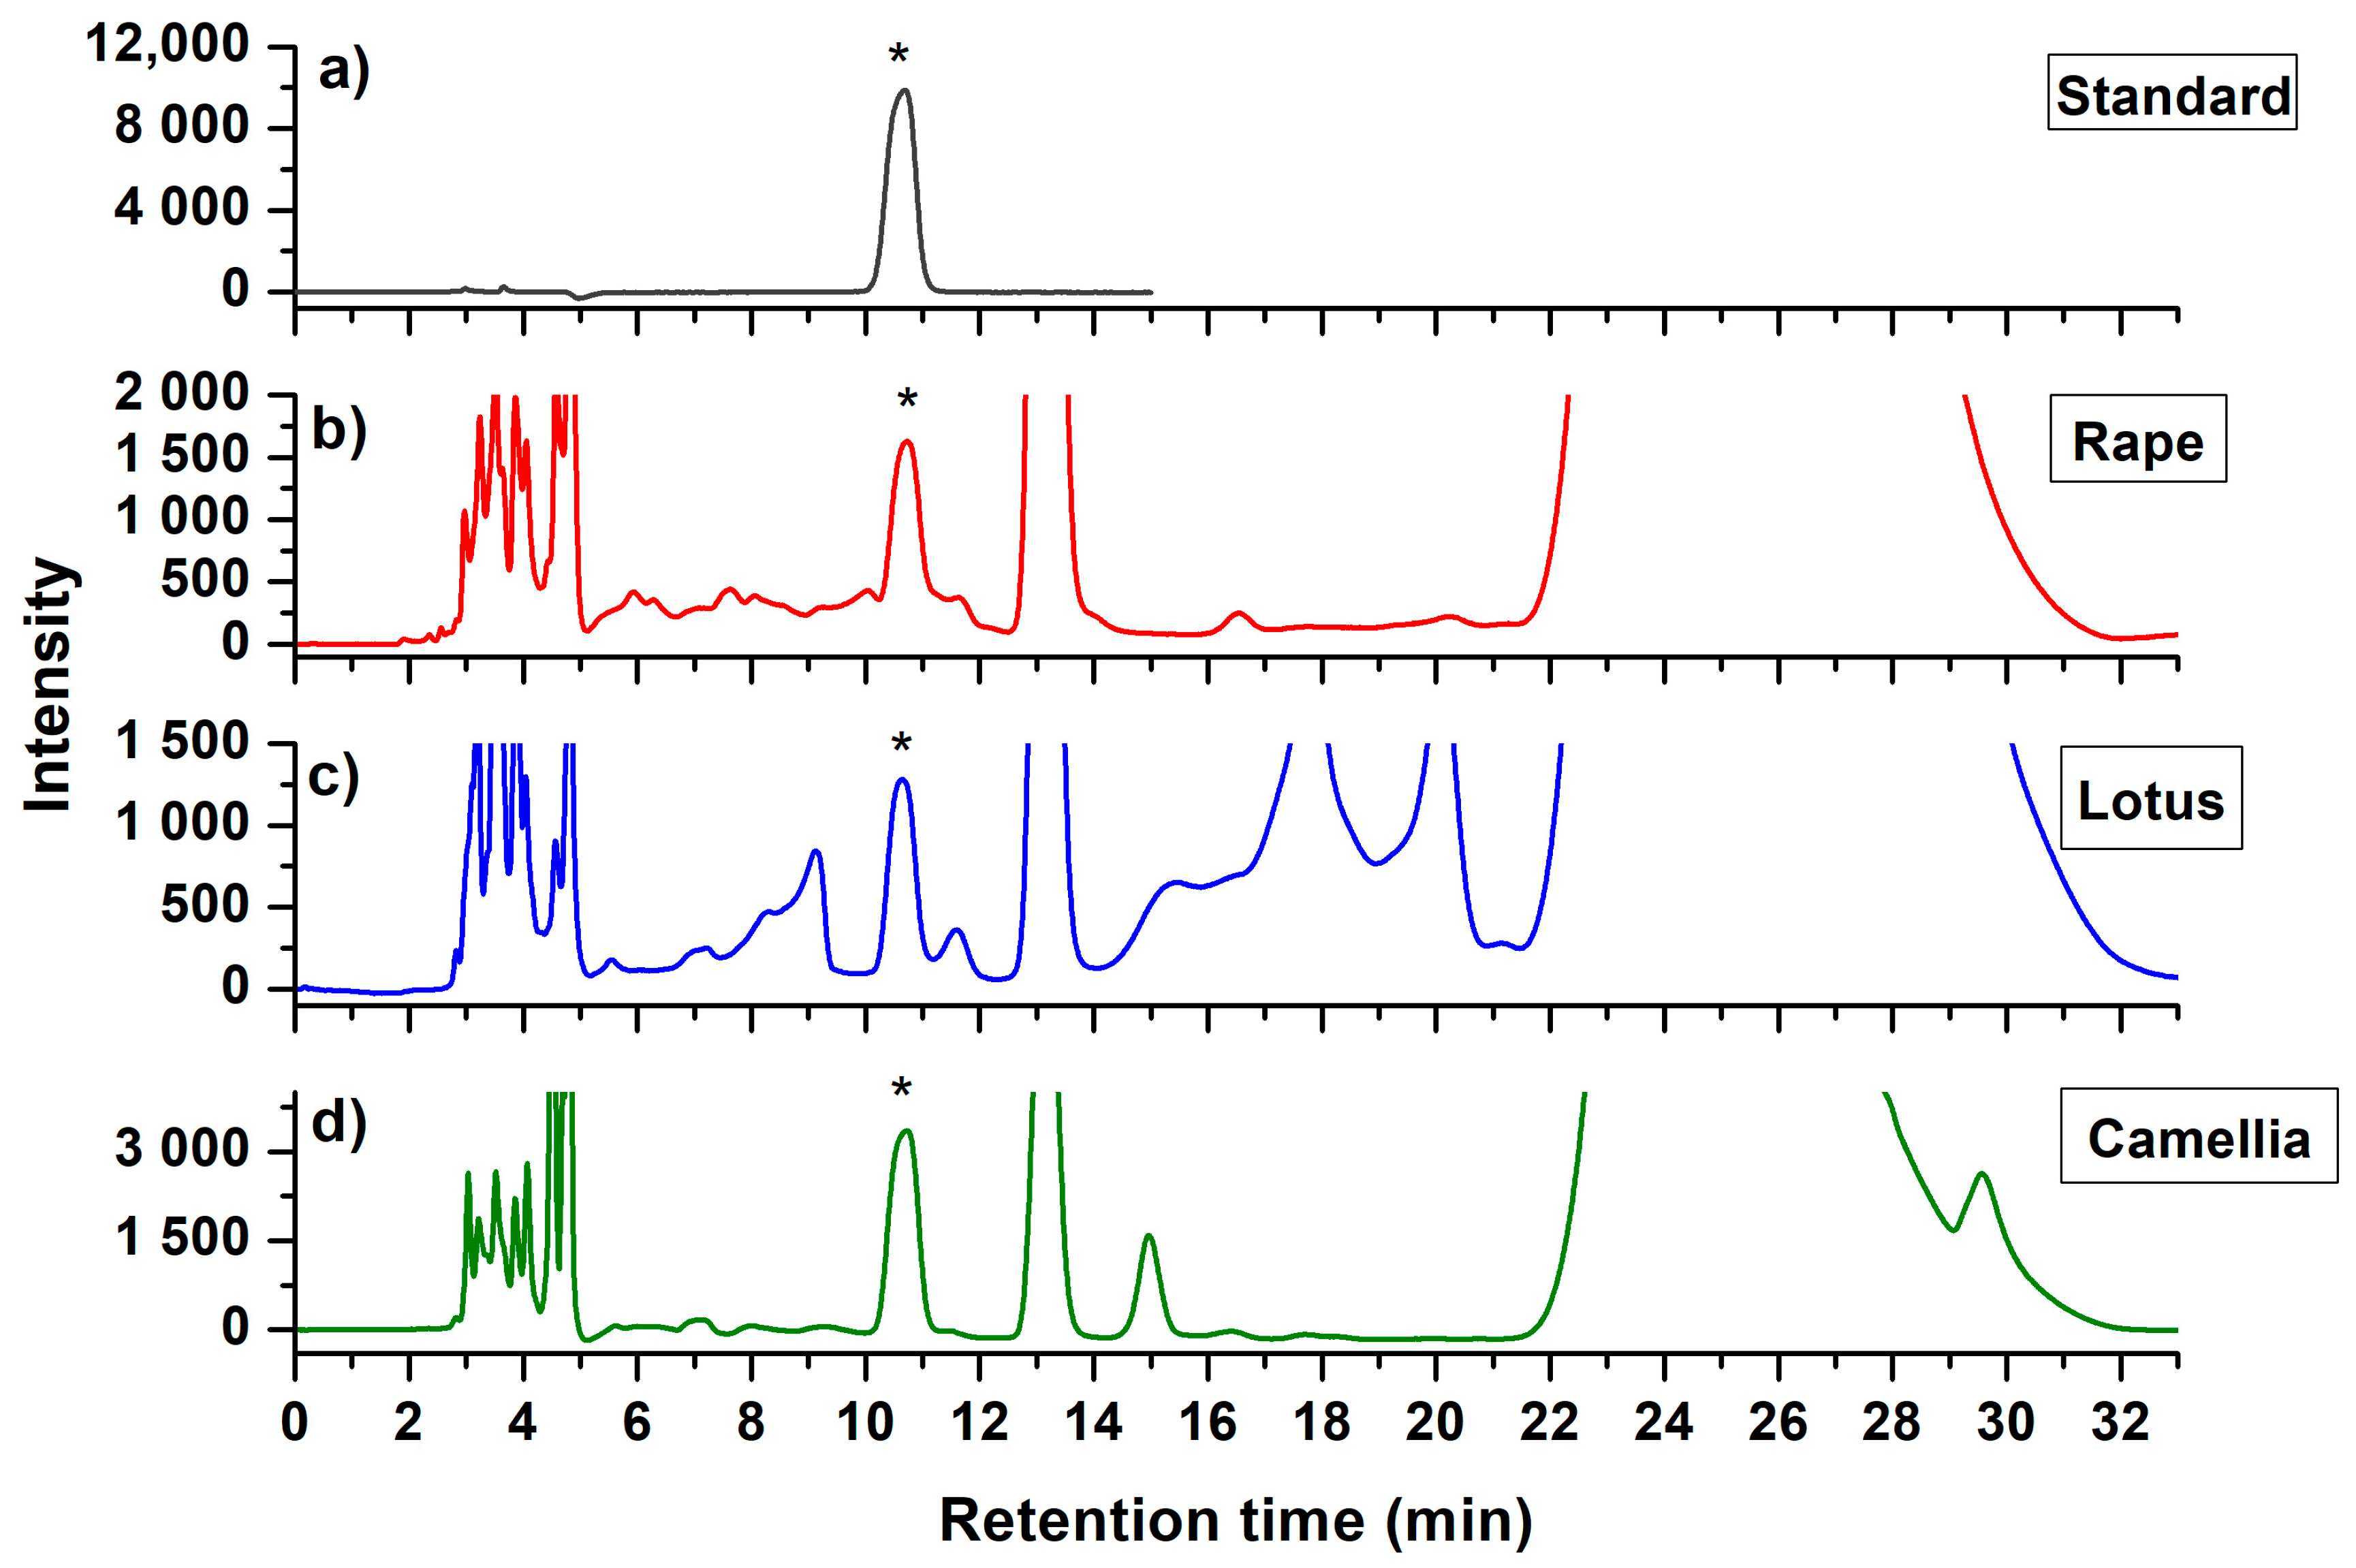
3.5. Liquid Chromatography
3.6. Method Validation
4. Conclusions
Author Contributions
Funding
Acknowledgments
Conflicts of Interest
References
- Campos, M.G.R.; Bogdanov, S.; Almeida-Muradian, L.B.; Szczesna, T.; Mancebo, Y.; Frigerio, C.; Ferreira, F. Pollen composition and standardisation of analytical methods. J. Apicult. Res. 2008, 47, 156–163. [Google Scholar] [CrossRef]
- Ares, A.M.; Valverde, S.; Bernal, J.L.; Nozal, M.J.; Bernal, J. Extraction and determination of bioactive compounds from bee pollen. J. Pharm. Biomed. Anal. 2018, 147, 110–124. [Google Scholar] [CrossRef]
- Thakur, M.; Nanda, V. Composition and functionality of bee pollen: A review. Trends Food Sci. Technol. 2020, 98, 82–106. [Google Scholar] [CrossRef]
- Kroyer, G.; Hegedus, N. Evaluation of bioactive properties of pollen extracts as functional dietary food supplement. Innov. Food Sci. Emerg. Technol. 2001, 2, 171–174. [Google Scholar] [CrossRef]
- Denisow, B.; Denisow-Pietrzyk, M. Biological and therapeutic properties of bee pollen: A review. J. Sci. Food Agric. 2016, 96, 4303–4309. [Google Scholar] [CrossRef]
- Padayatty, S.J.; Katz, A.; Wang, Y.; Eck, P.; Kwon, O.; Lee, J.H.; Chen, S.; Corpe, C.; Dutta, A.; Dutta, S.K.; et al. Vitamin C as an antioxidant: Evaluation of its role in disease prevention. J. Am. Coll. Nutr. 2003, 22, 18–35. [Google Scholar] [CrossRef]
- Arrigoni, O.; De Tullio, M.C. Ascorbic acid: Much more than just an antioxidant. Biochim. Biophys. Acta 2002, 1569, 1–9. [Google Scholar] [CrossRef]
- Deutsch, J.C. Dehydroascorbic acid. J. Chromatogr. A 2000, 881, 299–307. [Google Scholar] [CrossRef]
- Asami, D.K.; Hong, Y.J.; Barrett, D.M.; Mitchell, A.E. Comparison of the total phenolic and ascorbic acid content of freeze-dried and air-dried marionberry, strawberry, and corn grown using conventional, organic, and sustainable agricultural practices. J. Agric. Food Chem. 2003, 51, 1237–1241. [Google Scholar] [CrossRef]
- Phillips, K.M.; Tarragó-Trani, M.T.; Gebhardt, S.E.; Exler, J.; Patterson, K.Y.; Haytowitz, D.B.; Pehrsson, P.R.; Holden, J.M. Stability of vitamin C in frozen raw fruit and vegetable homogenates. J. Food Compos. Anal. 2010, 23, 253–259. [Google Scholar] [CrossRef]
- Serpen, A.; Gökmen, V. Reversible degradation kinetics of ascorbic acid under reducing and oxidizing conditions. Food Chem. 2007, 104, 721–725. [Google Scholar] [CrossRef]
- Domínguez-Valhondo, D.; Gil, D.B.; Hernández, M.T.; González-Gómez, D. Influence of the commercial processing and floral origin on bioactive and nutritional properties of honeybee-collected pollen. Int. J. Food Sci. Technol. 2011, 46, 2204–2211. [Google Scholar] [CrossRef]
- Odriozola-Serrano, I.; Hernández-Jover, T.; Martín-Belloso, O. Comparative evaluation of UV-HPLC methods and reducing agents to determine vitamin C in fruits. Food Chem. 2007, 105, 1151–1158. [Google Scholar] [CrossRef]
- Brause, A.R.; Woollard, D.C.; Indyk, H.E. Determination of total vitamin C in fruit juices and related products by liquid chromatography: Interlaboratory study. J. AOAC Int. 2003, 86, 367–374. [Google Scholar] [CrossRef] [Green Version]
- Fontannaz, P.; Kilinc, T.; Heudi, O. HPLC-UV determination of total vitamin C in a wide range of fortified food products. Food Chem. 2006, 94, 626–631. [Google Scholar] [CrossRef]
- Lykkesfeldt, J. Determination of ascorbic acid and dehydroascorbic acid in biological samples by high-performance liquid chromatography using subtraction methods: Reliable reduction with tris [2-carboxyethyl]phosphine hydrochloride. Anal. Biochem. 2000, 282, 89–93. [Google Scholar] [CrossRef]
- Tarrago-Trani, M.T.; Phillips, K.M.; Cotty, M. Matrix-specific method validation for quantitative analysis of vitamin C in diverse foods. J. Food Compos. Anal. 2012, 26, 12–25. [Google Scholar] [CrossRef]
- Laggner, H.; Besau, V.; Goldenberg, H. Preferential uptake and accumulation of oxidized vitamin C by THP-1monocytic cells. Eur. J. Biochem. 1999, 262, 659–665. [Google Scholar] [CrossRef]
- Nováková, L.; Solich, P.; Solichová, D. HPLC methods for simultaneous determination of ascorbic and dehydroascorbic acids. Trends Anal. Chem. 2008, 27, 942–958. [Google Scholar] [CrossRef]
- Wolfender, J. HPLC in natural product analysis: The detection issue. Planta Med. 2009, 75, 719–734. [Google Scholar] [CrossRef] [Green Version]
- Burini, G. Development of a quantitative method for the analysis of total l-ascorbic acid in foods by high-performance liquid chromatography. J. Chromatogr. A 2007, 1154, 97–102. [Google Scholar] [CrossRef]
- Oliveira, K.C.L.S.; Moriya, M.; Azedo, R.A.B.; de Almeida-Muradian, L.B.; Teixeira, E.W.; Alves, M.L.T.M.F.; Moreti, A.C.d.C.C. Relationship between botanical origin and antioxidants vitamins of bee-collected pollen. Quim. Nova 2009, 32, 1099–1102. [Google Scholar] [CrossRef]
- Melo, I.L.P.d.; Almeida-Muradian, L.B.d. Stability of antioxidants vitamins in bee pollen samples. Quim. Nova 2010, 33, 514–518. [Google Scholar] [CrossRef]
- Arya, S.P.; Mahajan, M.; Jain, P. Photometric methods for the determination of Vitamin C. Anal. Sci. 1998, 14, 889–895. [Google Scholar] [CrossRef] [Green Version]
- Kim, S.R.; Abdel-Ghany, M.; Stitt, K.R. Influence of extraction on l-ascorbic acid recovery from selected foods and beverages. J. Food Quality 1987, 10, 1–7. [Google Scholar] [CrossRef]
- Barros, A.I.R.N.A.; Silva, A.P.; Gonçalves, B.; Nunes, F.M. A fast, simple, and reliable hydrophilic interaction liquid chromatography method for the determination of ascorbic and isoascorbic acids. Anal. Bioanal. Chem. 2010, 396, 1863–1875. [Google Scholar] [CrossRef]
- ICH Q2(R1). Validation of Analytical Procedures: Text and Methodology. 2005. Available online: https://database.ich.org/sites/default/files/Q2%28R1%29%20Guideline.pdf (accessed on 26 November 2020).
- Taverniers, I.; De Loose, M.; Van Bockstaele, E. Trends in quality in the analytical laboratory. II. Analytical method validation and quality assurance. Trends Anal. Chem. 2004, 23, 535–552. [Google Scholar] [CrossRef]
- Wechtersbach, L.; Cigic, B. Reduction of dehydroascorbic acid at low pH. J. Biochem. Biophys. Methods 2007, 70, 767–772. [Google Scholar] [CrossRef]
Sample Availability: Not available. |


| Bee Pollen | AA, µg/g (Mean ± SD, n = 6) | Fortified AA Contents, µg/g | Intra-Day Recovery and Precision | Inter-Day Recovery and Precision | ||||||
|---|---|---|---|---|---|---|---|---|---|---|
| Day 1 | Day 2 | Day 3 | ||||||||
| Mean ± SD (%, n = 6) | RSD (%, n = 6) | Mean ± SD (%, n = 6) | RSD (%, n = 6) | Mean ± SD (%, n = 6) | RSD (%, n = 6) | Mean ± SD (%, n = 18) | RSD (%, n = 18) | |||
| Rape (Brassica campestris) | 46.55 ± 0.66 | 20 | 90.38 ± 2.21 | 2.44 | 90.21 ± 3.80 | 4.21 | 94.82 ± 4.63 | 4.88 | 91.80 ± 3.55 | 3.87 |
| 40 | 92.43 ± 2.63 | 2.84 | 94.14 ± 2.11 | 2.25 | 90.07 ± 2.82 | 3.13 | 92.21 ± 2.52 | 2.73 | ||
| Lotus (Nelumbo nucifera) | 71.05 ± 0.97 | 35 | 104.91 ± 2.86 | 2.73 | 96.98 ± 4.69 | 4.84 | 101.53 ± 3.20 | 3.15 | 101.14 ± 3.58 | 3.54 |
| 70 | 98.75 ± 1.52 | 1.54 | 98.35 ± 1.97 | 2.00 | 97.47 ± 1.96 | 2.01 | 98.19 ± 1.82 | 1.85 | ||
| Camellia (Camellia japonica) | 311.22 ± 5.70 | 160 | 95.41 ± 4.28 | 4.49 | 90.45 ± 2.03 | 2.25 | 90.75 ± 2.30 | 2.53 | 92.20 ± 2.87 | 3.11 |
| 320 | 90.71 ± 1.53 | 1.69 | 95.06 ± 2.21 | 2.32 | 92.32 ± 2.14 | 2.31 | 92.70 ± 1.96 | 2.11 | ||
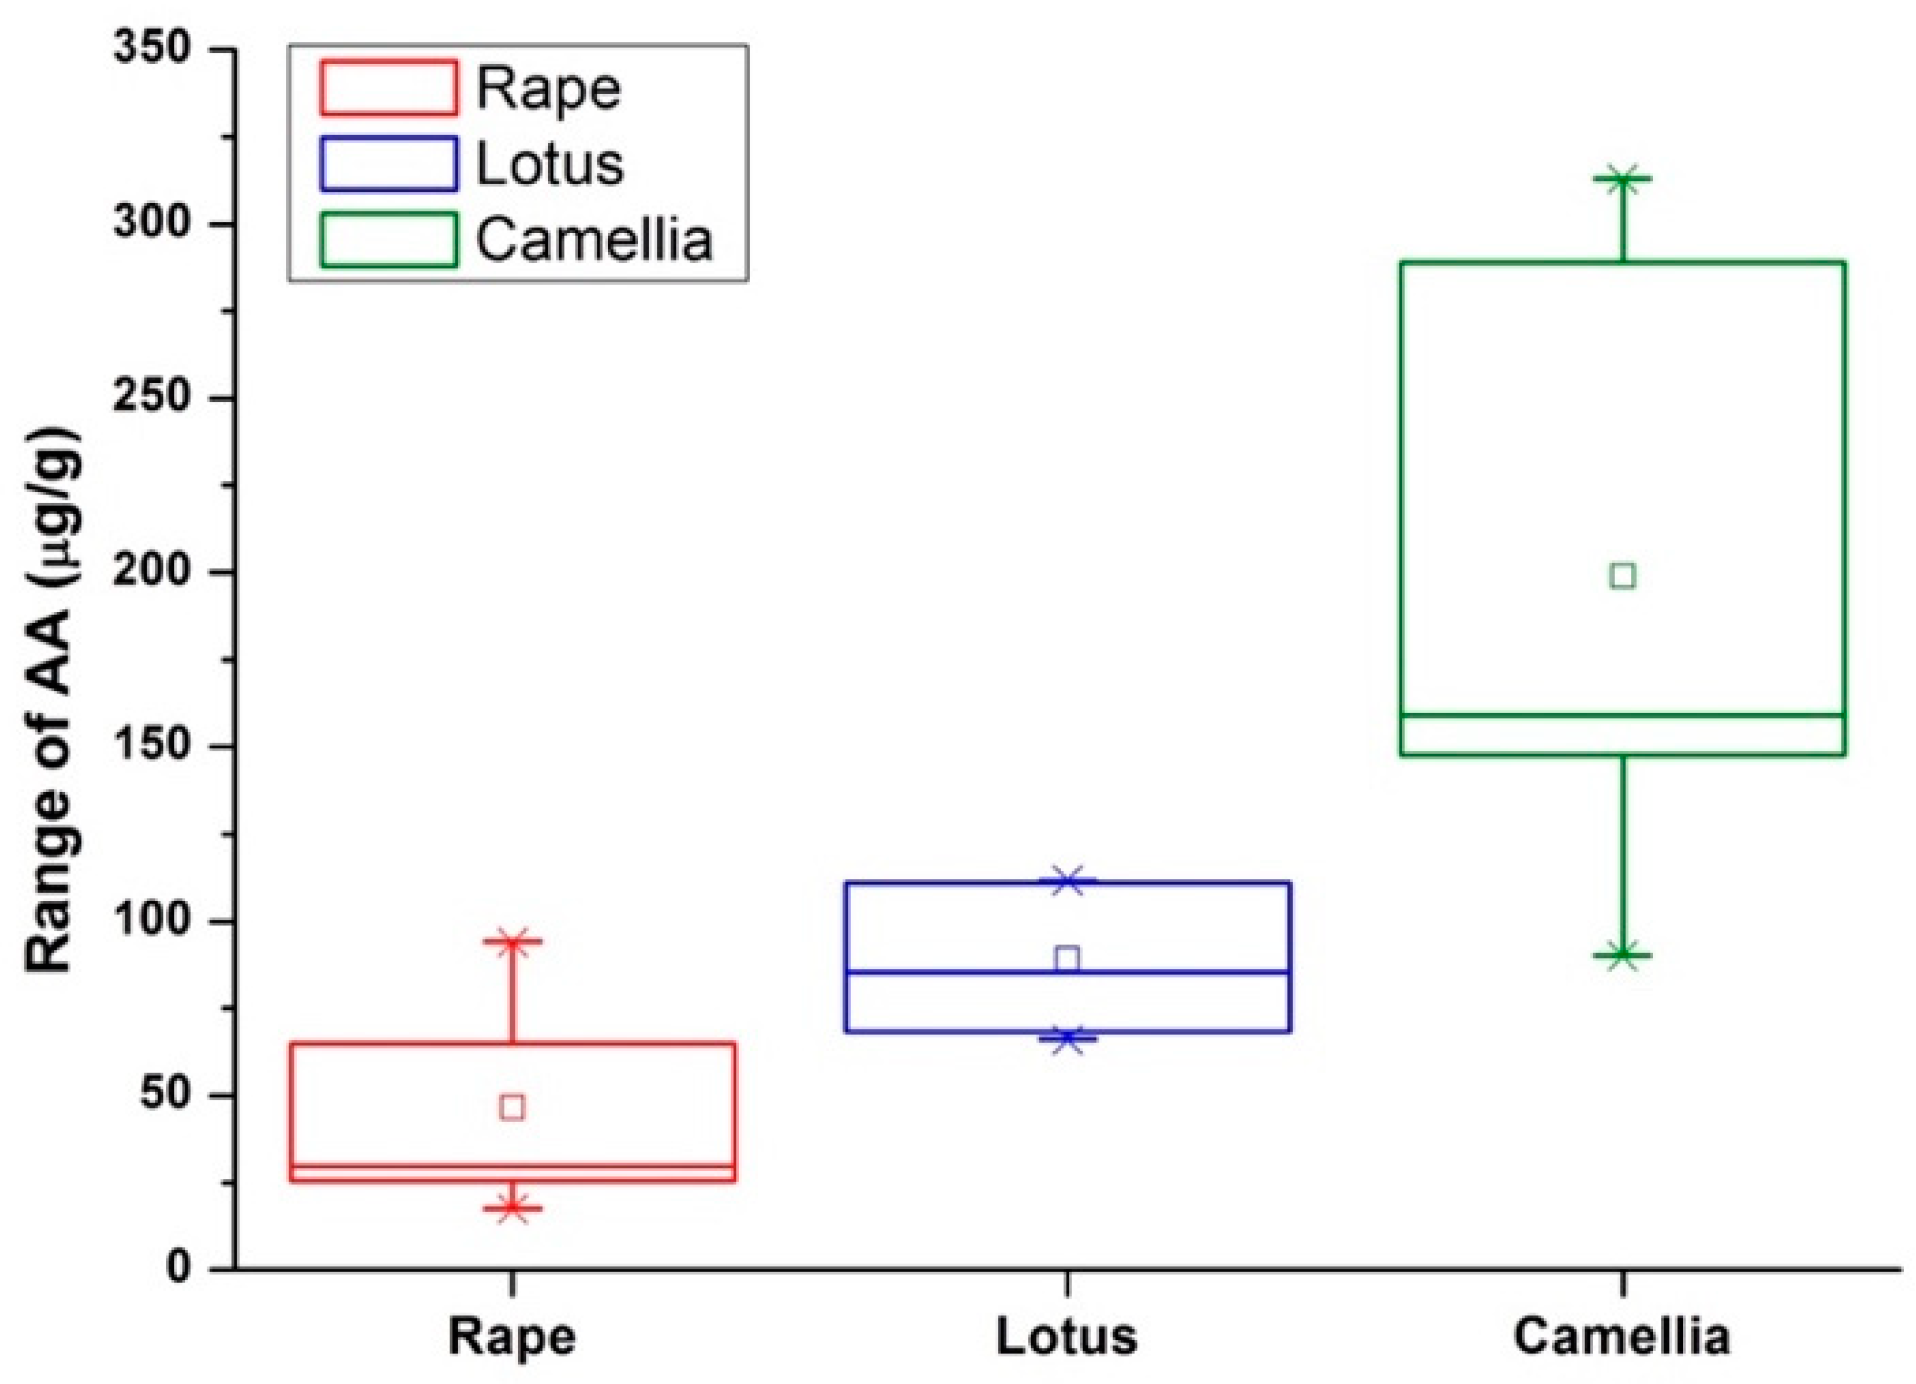
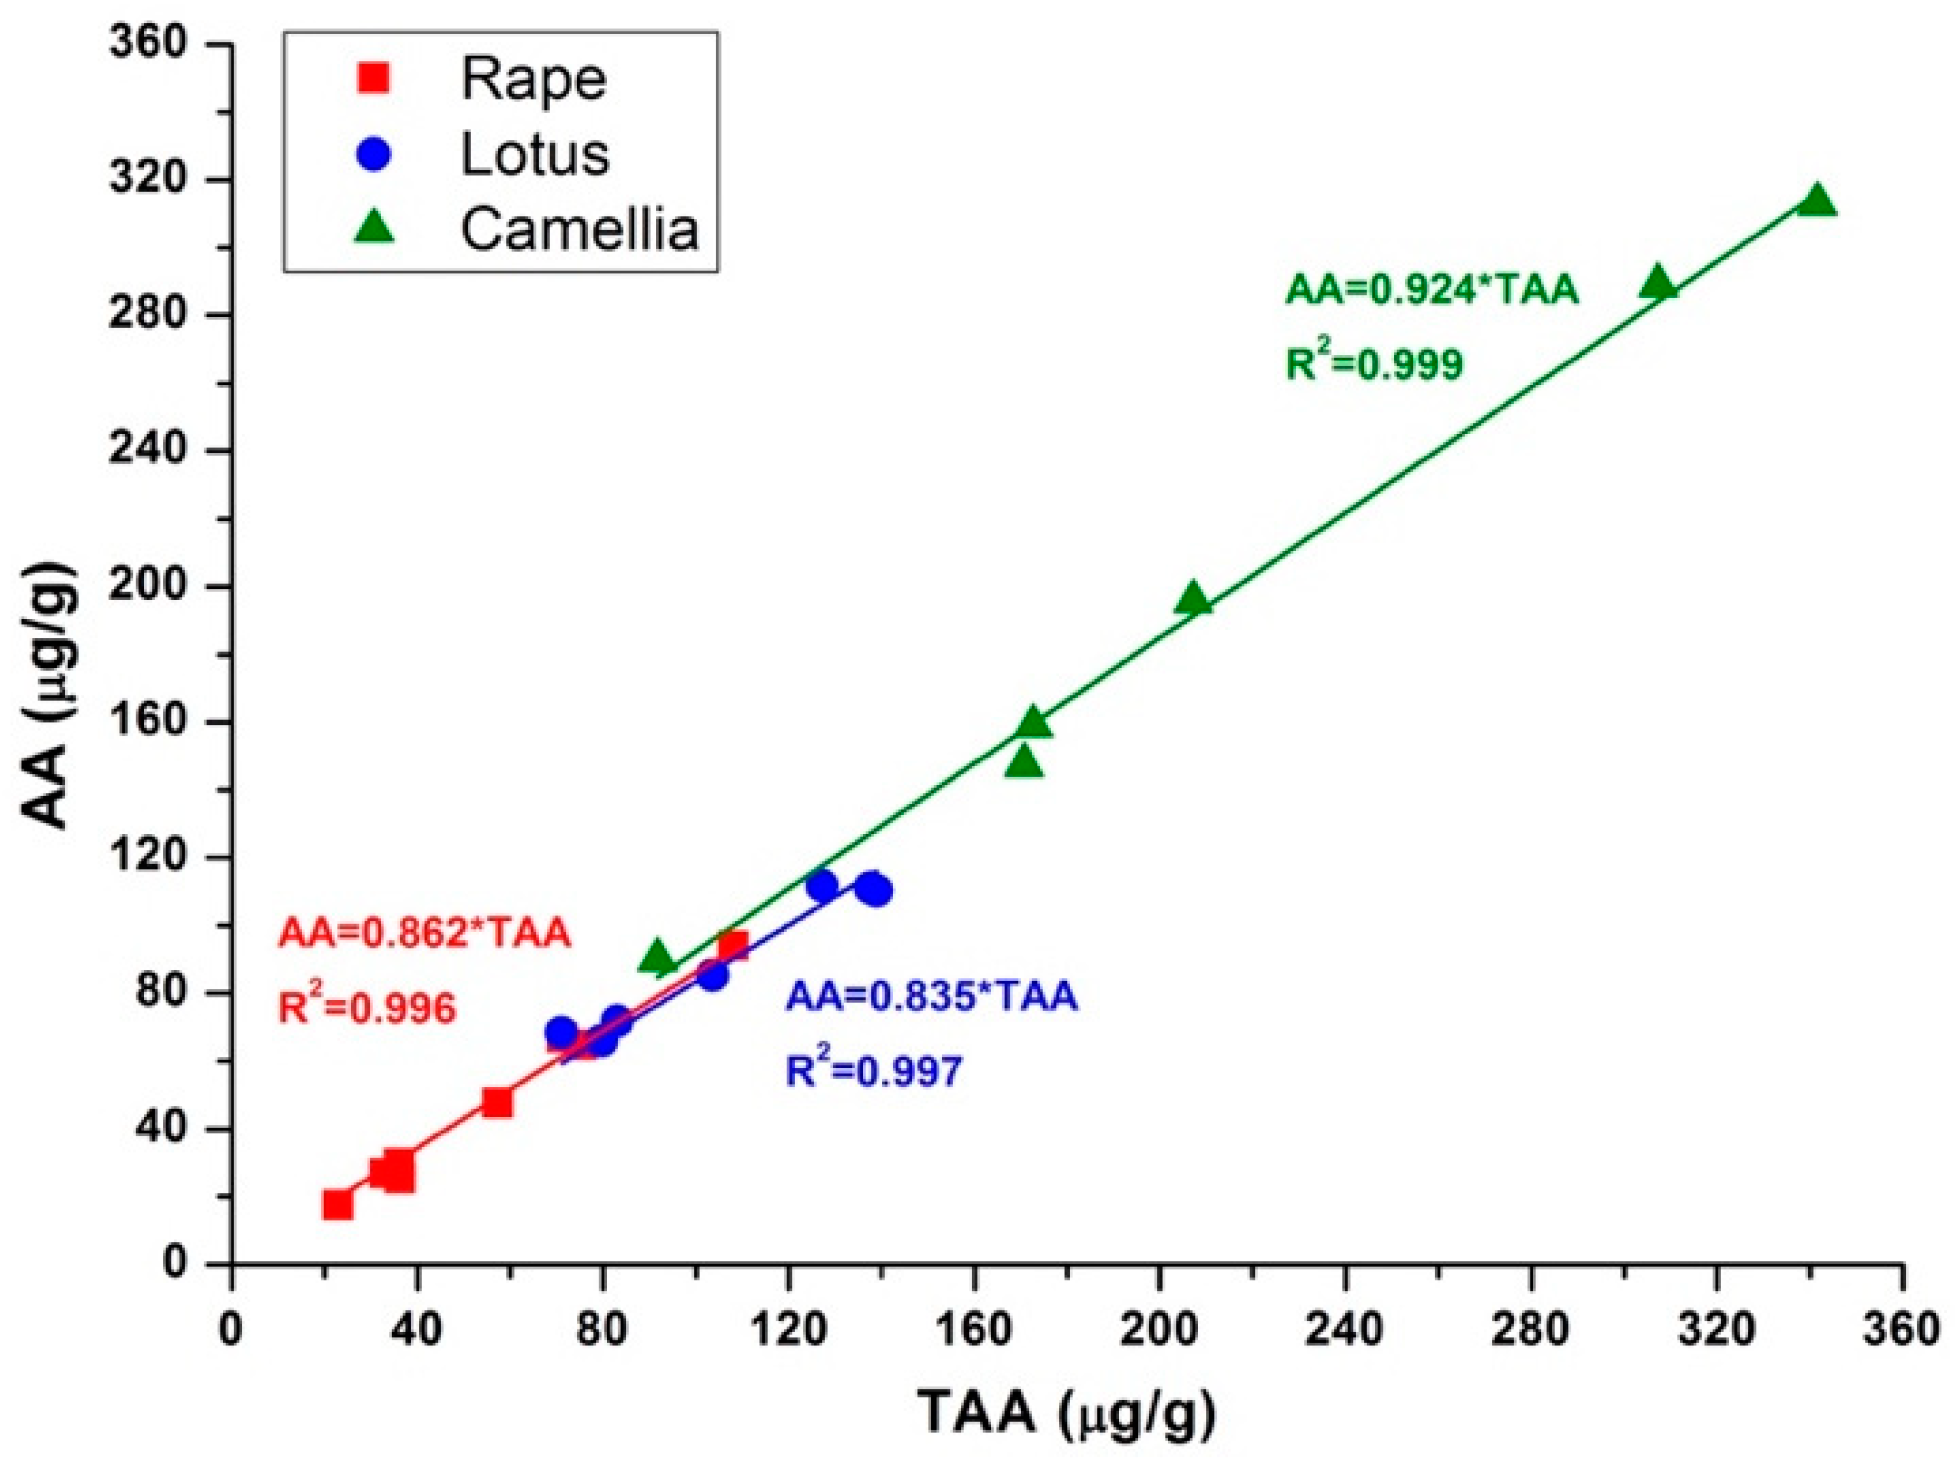
| Bee Pollen | Sample ID | AA, µg/g (Mean ± SD, n = 3) | TAA, µg/g (Mean ± SD, n = 3) | DHA, µg/g |
|---|---|---|---|---|
| Rape (Brassica campestris) | 1 | 64.77 ± 0.35 | 75.53 ± 3.43 | 10.76 |
| 2 | 94.01 ± 0.58 | 108.10 ± 0.69 | 14.09 | |
| 3 | 26.90 ± 0.84 | 32.99 ± 0.49 | 6.09 | |
| 4 | 17.54 ± 0.66 | 22.98 ± 0.57 | 5.44 | |
| 5 | 47.59 ± 0.70 | 57.41 ± 1.65 | 9.82 | |
| 6 | 66.99 ± 0.70 | 71.15 ± 1.24 | 4.16 | |
| 7 | 25.55 ± 0.32 | 36.21 ± 0.38 | 10.66 | |
| 8 | 29.75 ± 1.26 | 36.11 ± 1.76 | 6.36 | |
| Lotus (Nelumbo nucifera) | 1 | 71.69 ± 0.67 | 83.13 ± 1.50 | 11.44 |
| 2 | 85.31 ± 3.03 | 103.61 ± 0.46 | 18.30 | |
| 3 | 110.29 ± 1.51 | 138.90 ± 2.53 | 28.61 | |
| 4 | 111.02 ± 1.12 | 137.65 ± 1.22 | 26.63 | |
| 5 | 68.37 ± 2.75 | 71.08 ± 1.18 | 2.71 | |
| 6 | 111.66 ± 0.54 | 127.26 ± 1.52 | 15.6 | |
| 7 | 66.01 ± 0.49 | 79.67 ± 0.42 | 13.66 | |
| Camellia (Camellia japonica) | 1 | 289.05 ± 7.30 | 307.32 ± 7.85 | 18.27 |
| 2 | 195.77 ± 3.10 | 207.15 ± 2.12 | 11.38 | |
| 3 | 147.53 ± 0.88 | 170.69 ± 1.74 | 23.16 | |
| 4 | 90.04 ± 2.89 | 91.83 ± 0.54 | 1.79 | |
| 5 | 158.95 ± 3.29 | 172.71 ± 1.20 | 13.76 | |
| 6 | 313.02 ± 3.56 | 341.65 ± 0.71 | 28.63 |
Publisher’s Note: MDPI stays neutral with regard to jurisdictional claims in published maps and institutional affiliations. |
© 2020 by the authors. Licensee MDPI, Basel, Switzerland. This article is an open access article distributed under the terms and conditions of the Creative Commons Attribution (CC BY) license (http://creativecommons.org/licenses/by/4.0/).
Share and Cite
Zhu, M.; Tang, J.; Tu, X.; Chen, W. Determination of Ascorbic Acid, Total Ascorbic Acid, and Dehydroascorbic Acid in Bee Pollen Using Hydrophilic Interaction Liquid Chromatography-Ultraviolet Detection. Molecules 2020, 25, 5696. https://doi.org/10.3390/molecules25235696
Zhu M, Tang J, Tu X, Chen W. Determination of Ascorbic Acid, Total Ascorbic Acid, and Dehydroascorbic Acid in Bee Pollen Using Hydrophilic Interaction Liquid Chromatography-Ultraviolet Detection. Molecules. 2020; 25(23):5696. https://doi.org/10.3390/molecules25235696
Chicago/Turabian StyleZhu, Meifei, Jian Tang, Xijuan Tu, and Wenbin Chen. 2020. "Determination of Ascorbic Acid, Total Ascorbic Acid, and Dehydroascorbic Acid in Bee Pollen Using Hydrophilic Interaction Liquid Chromatography-Ultraviolet Detection" Molecules 25, no. 23: 5696. https://doi.org/10.3390/molecules25235696