
Definitive Screening Design and Artificial Neural Network for Modeling a Rapid Biodegradation of Date Palm Fronds by a New Trichoderma sp. PWN6 into Citric Acid


Abstract
:1. Introduction
2. Results
2.1. The Biodegradability of DPF by Trichoderma spp.
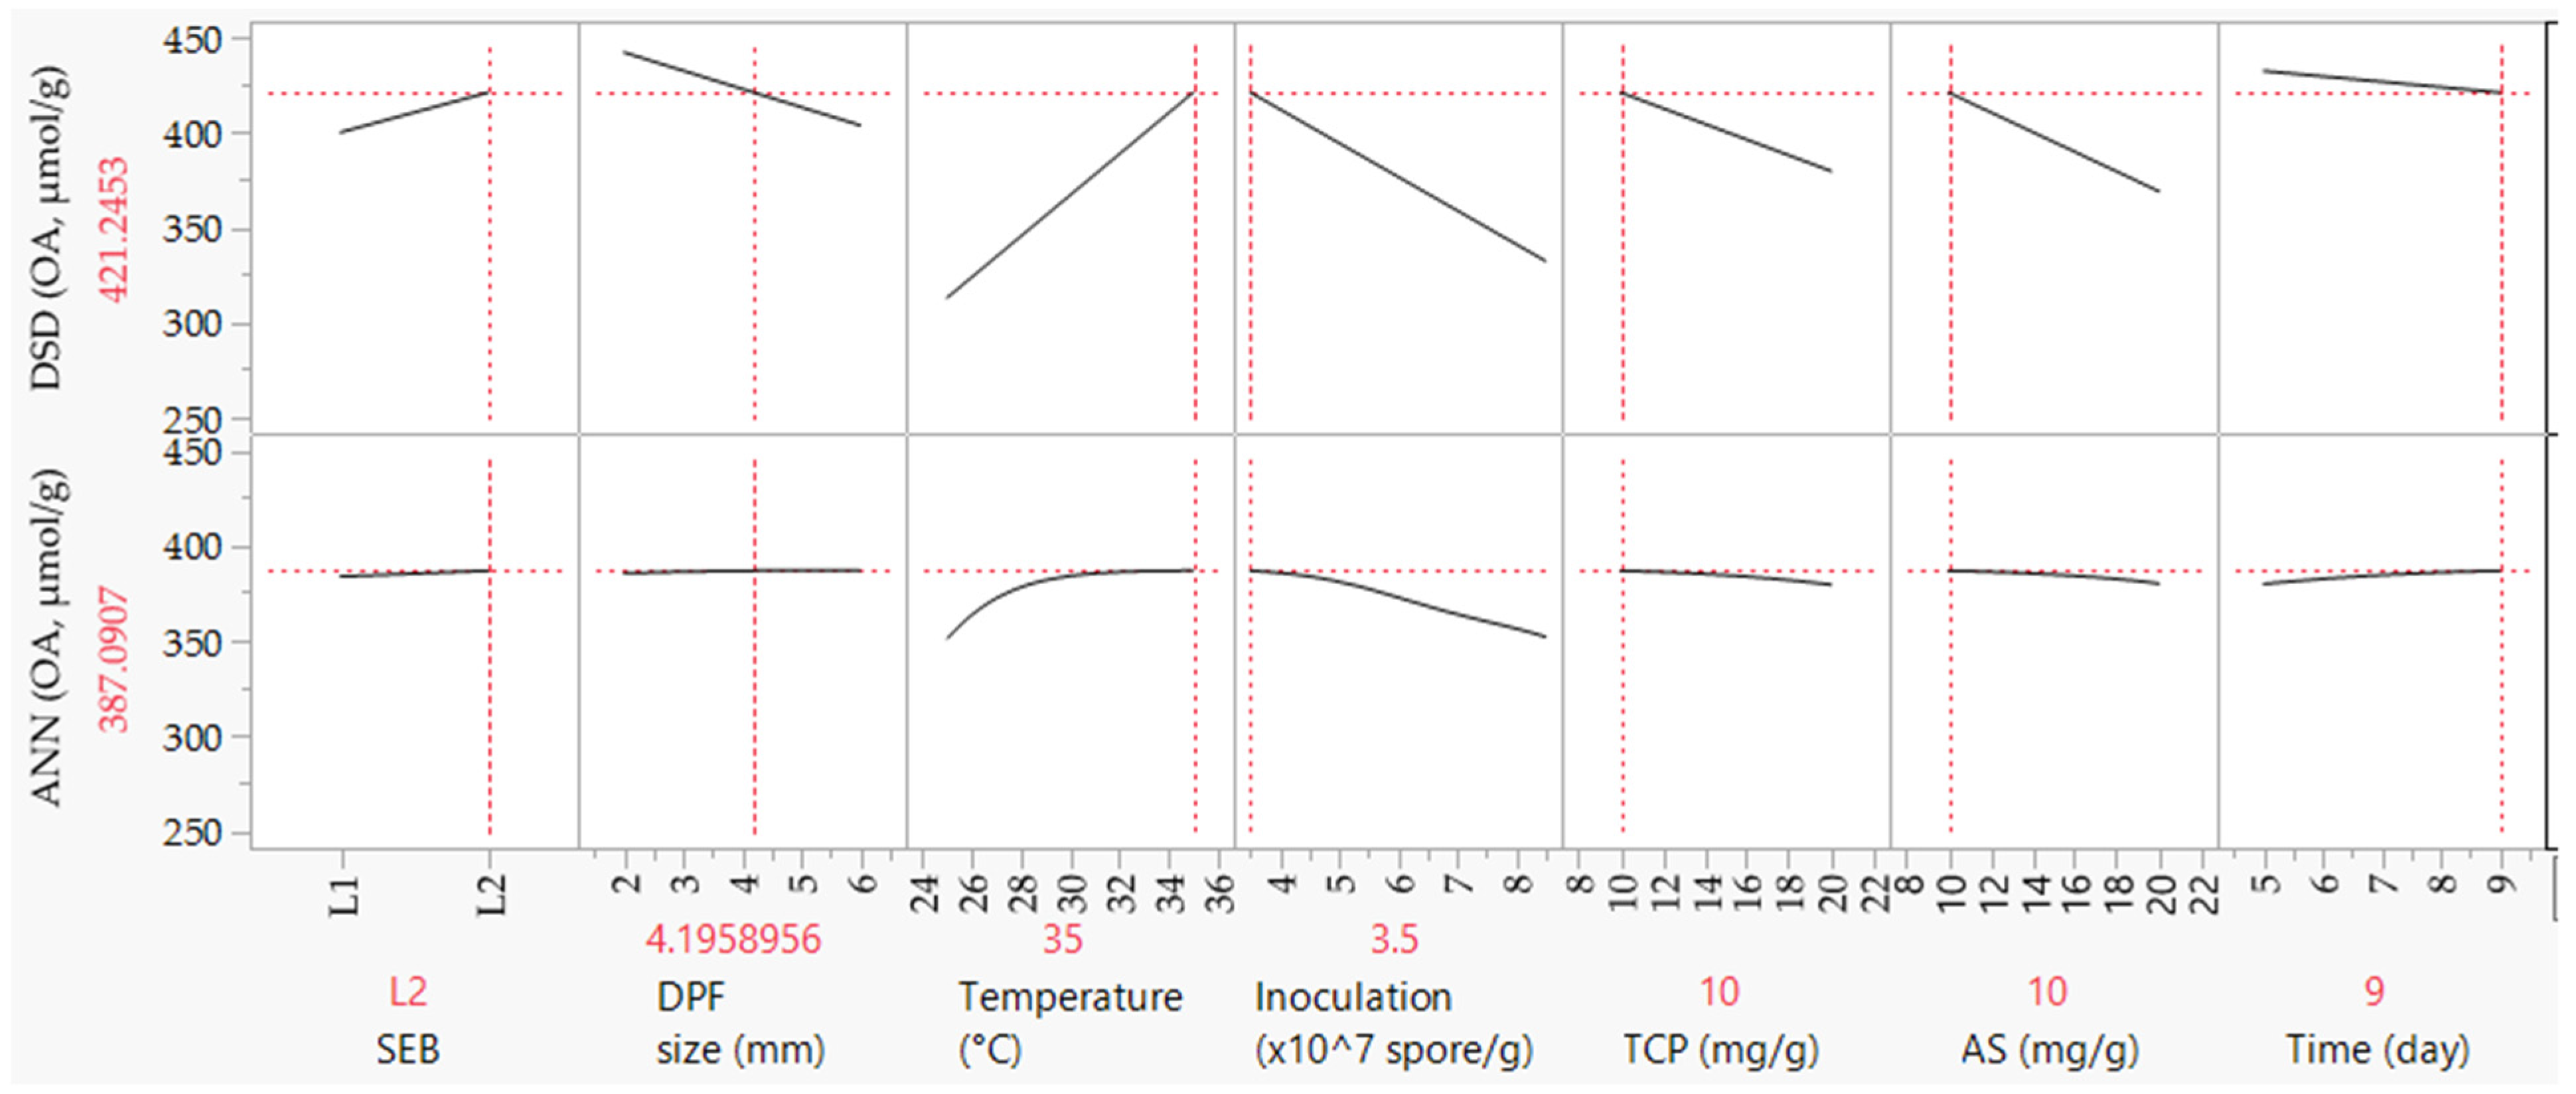
2.2. Screening and Optimizing the Fermentation Criteria Using DSD
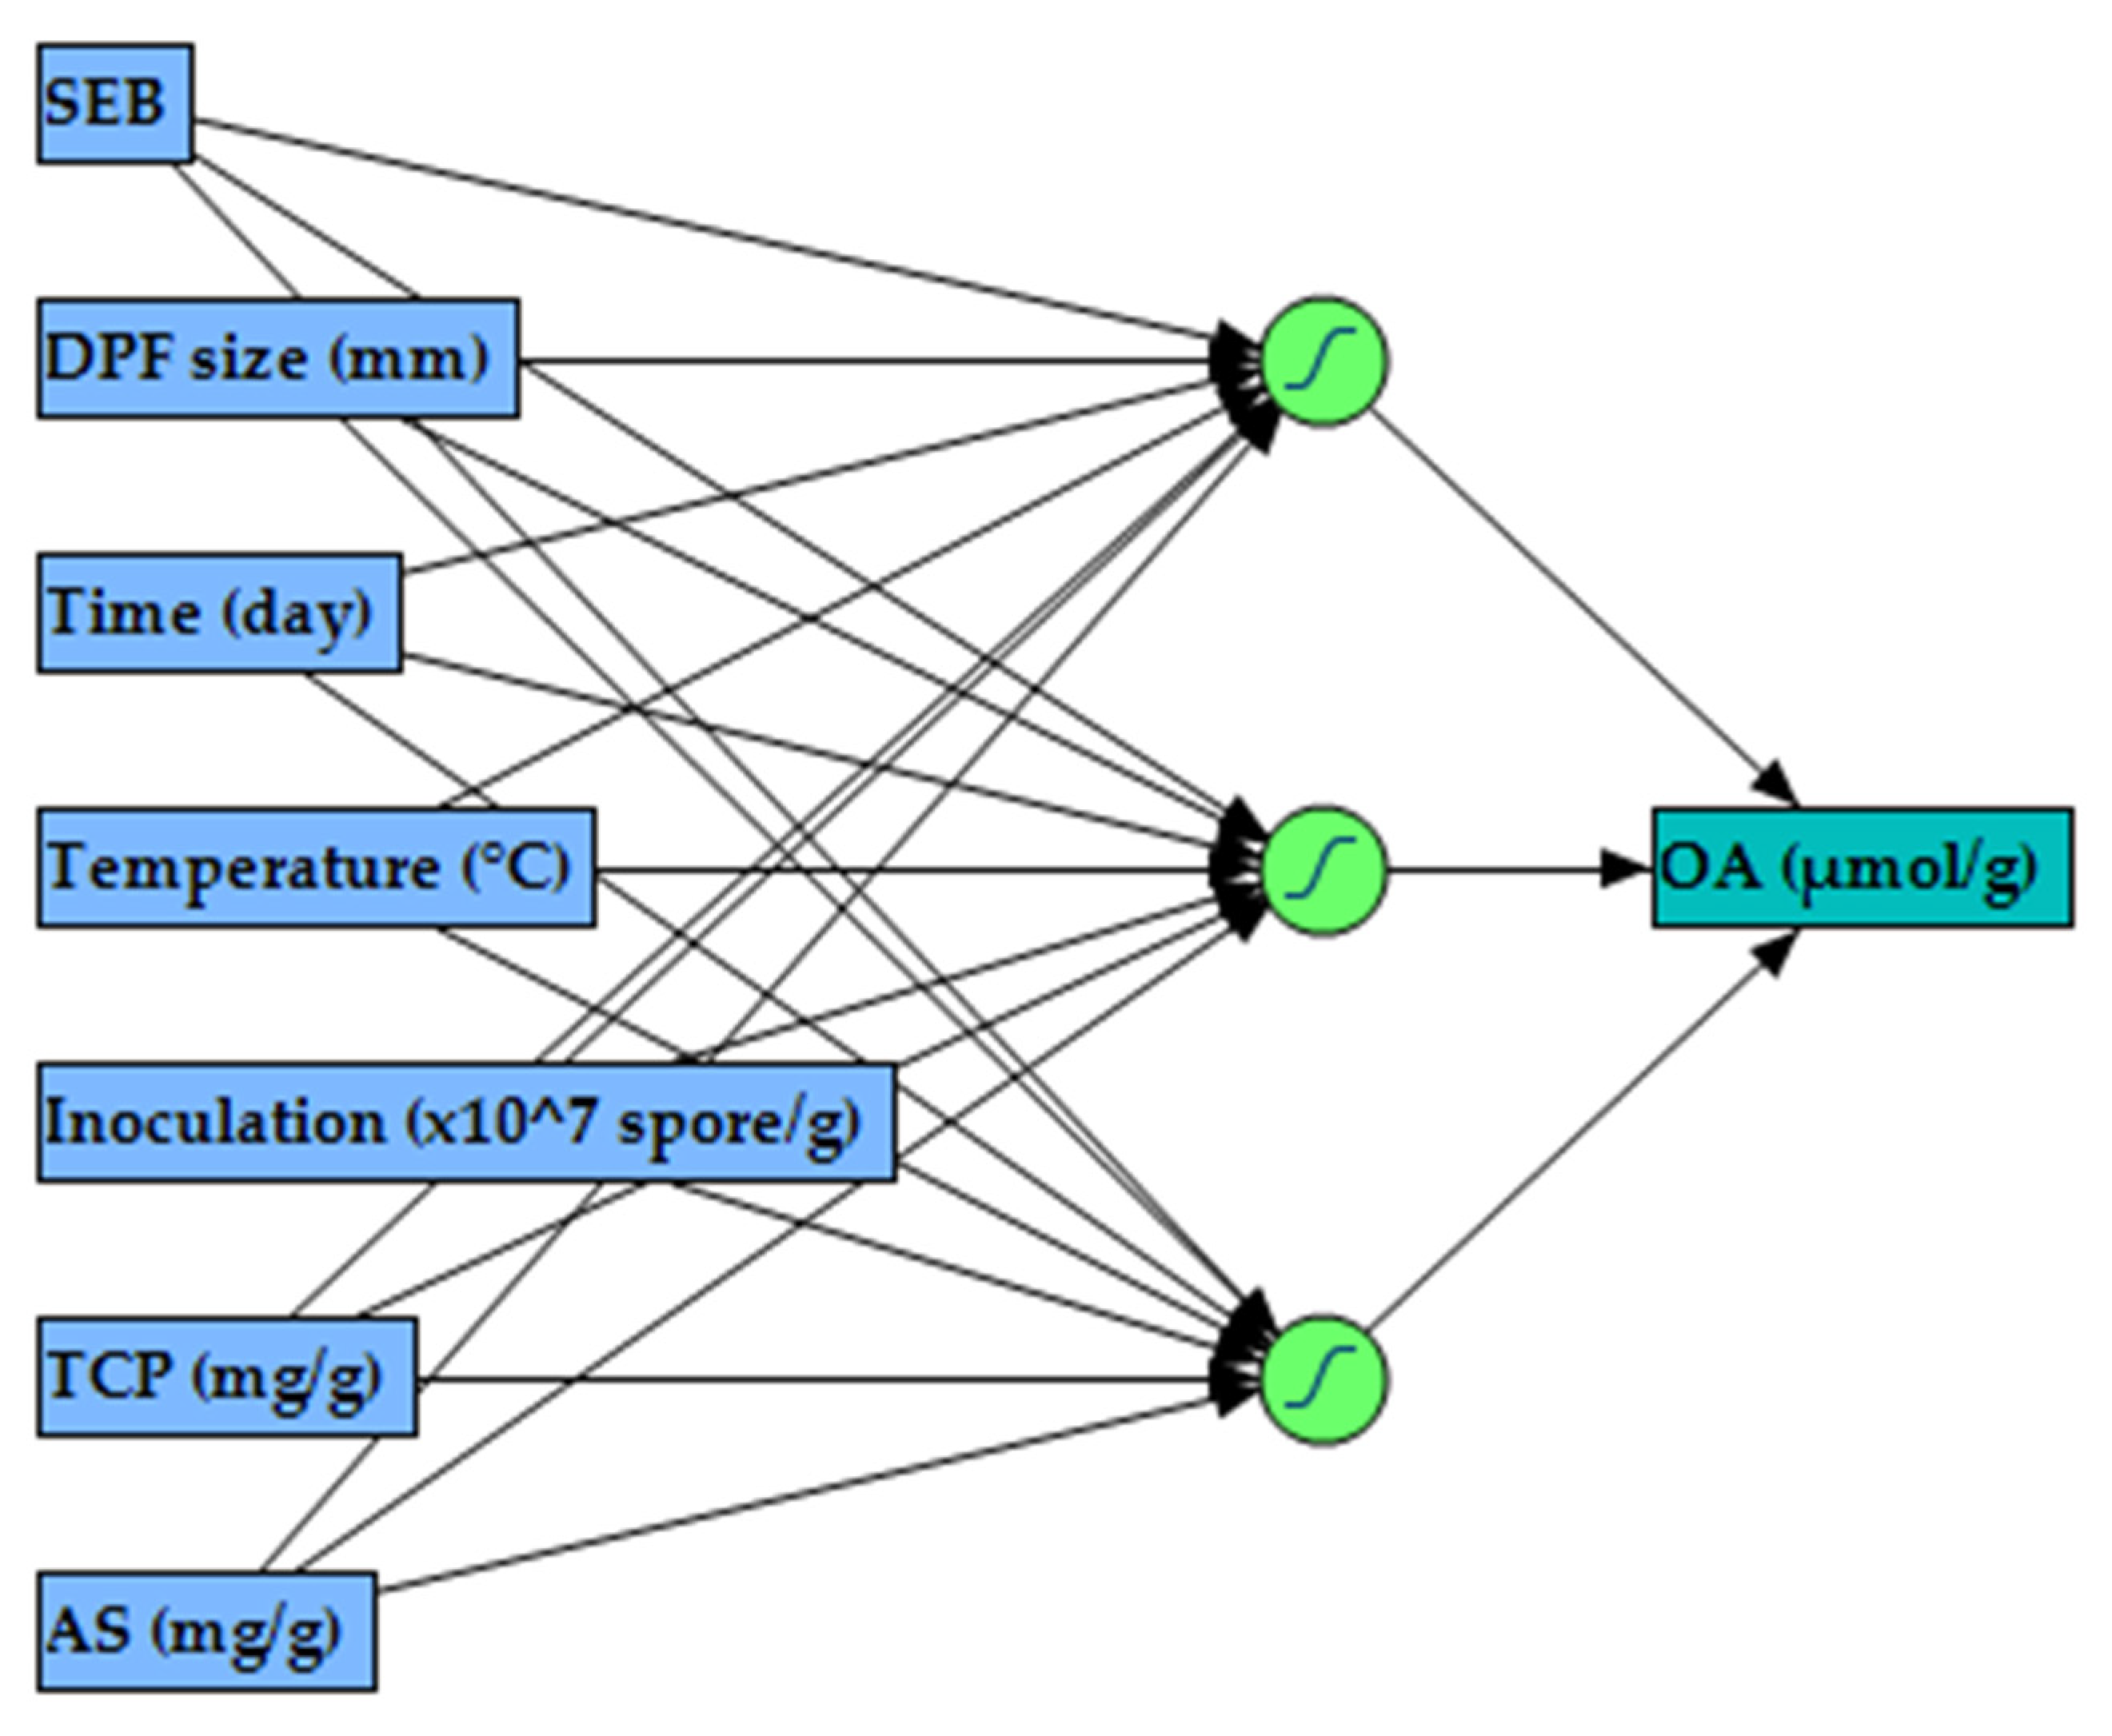
2.3. Modeling OA Biosynthesis Using ANN
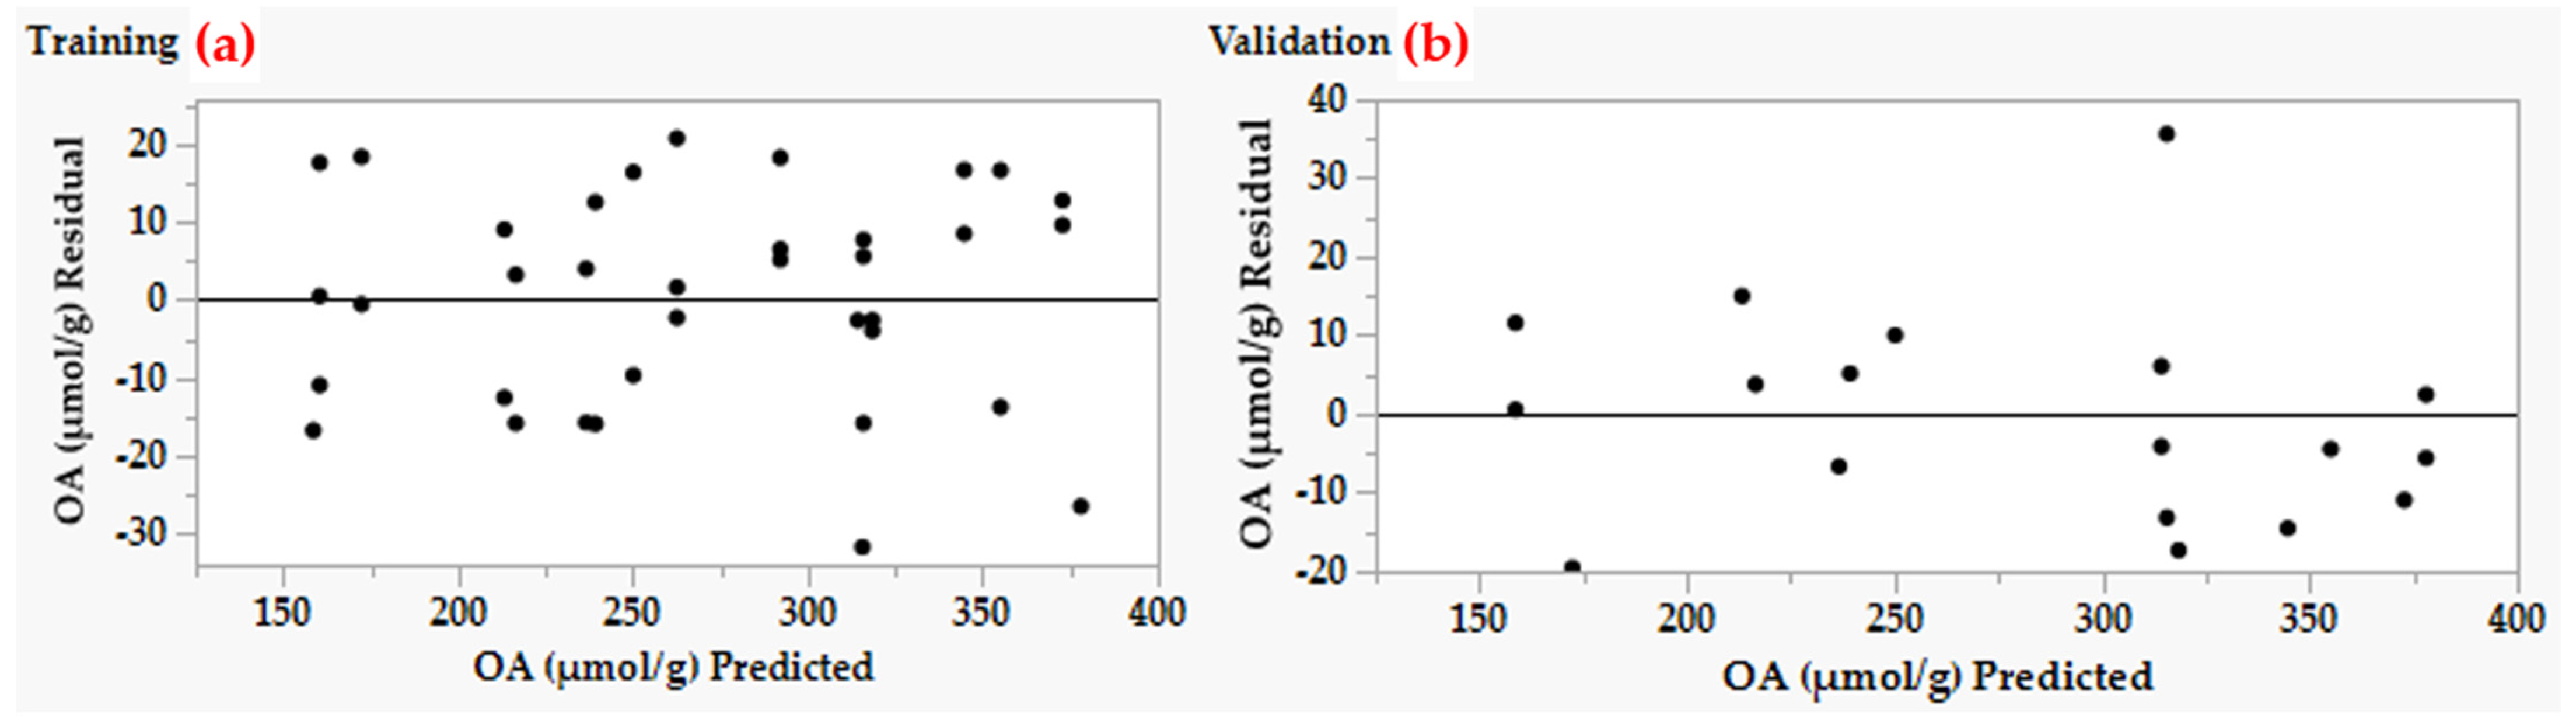
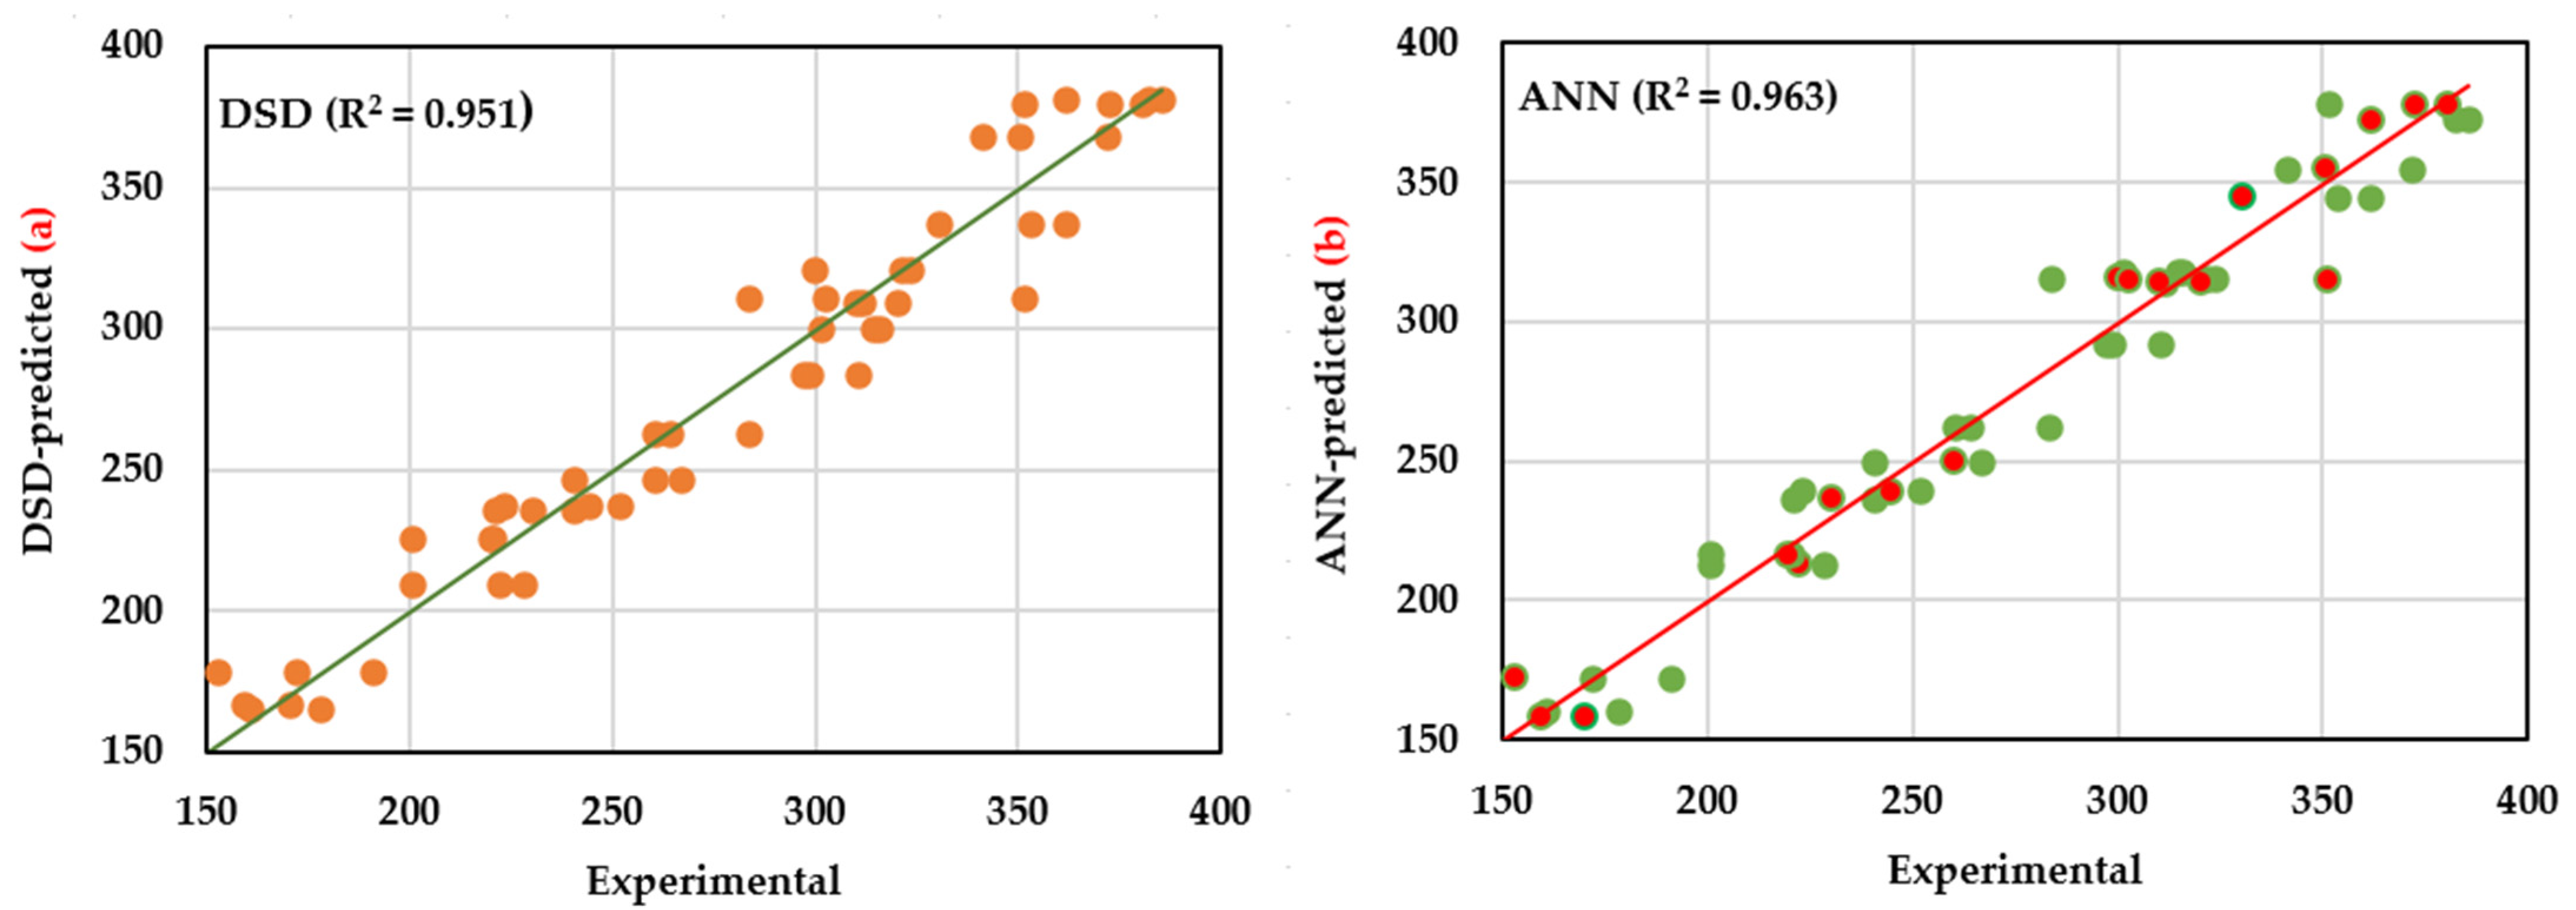
2.4. Fitness Comparison of DSD and ANN Models
2.5. Experimental Validation of Both Models
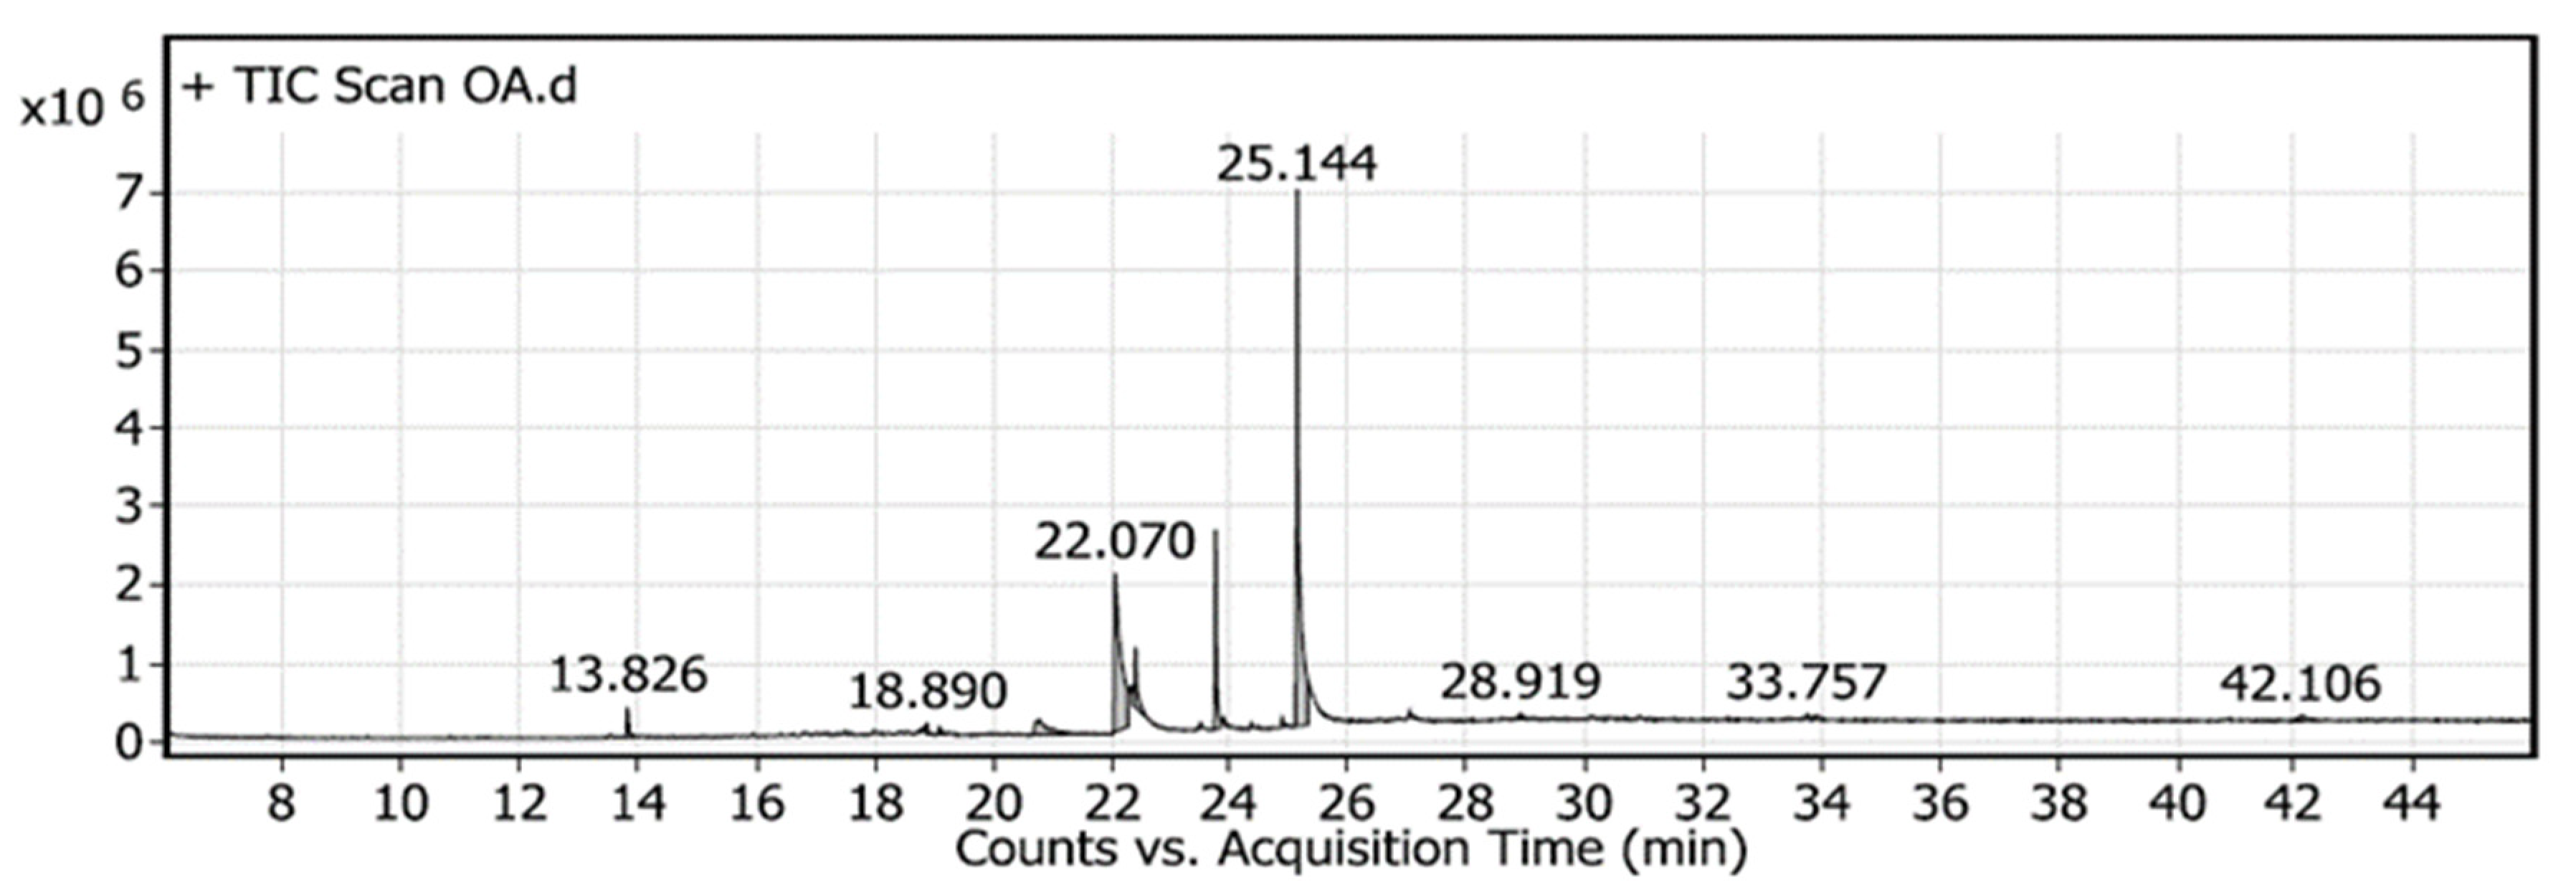
2.6. Specification of Components Using Gas Chromatography-Mass Spectrometry (GC-MS)
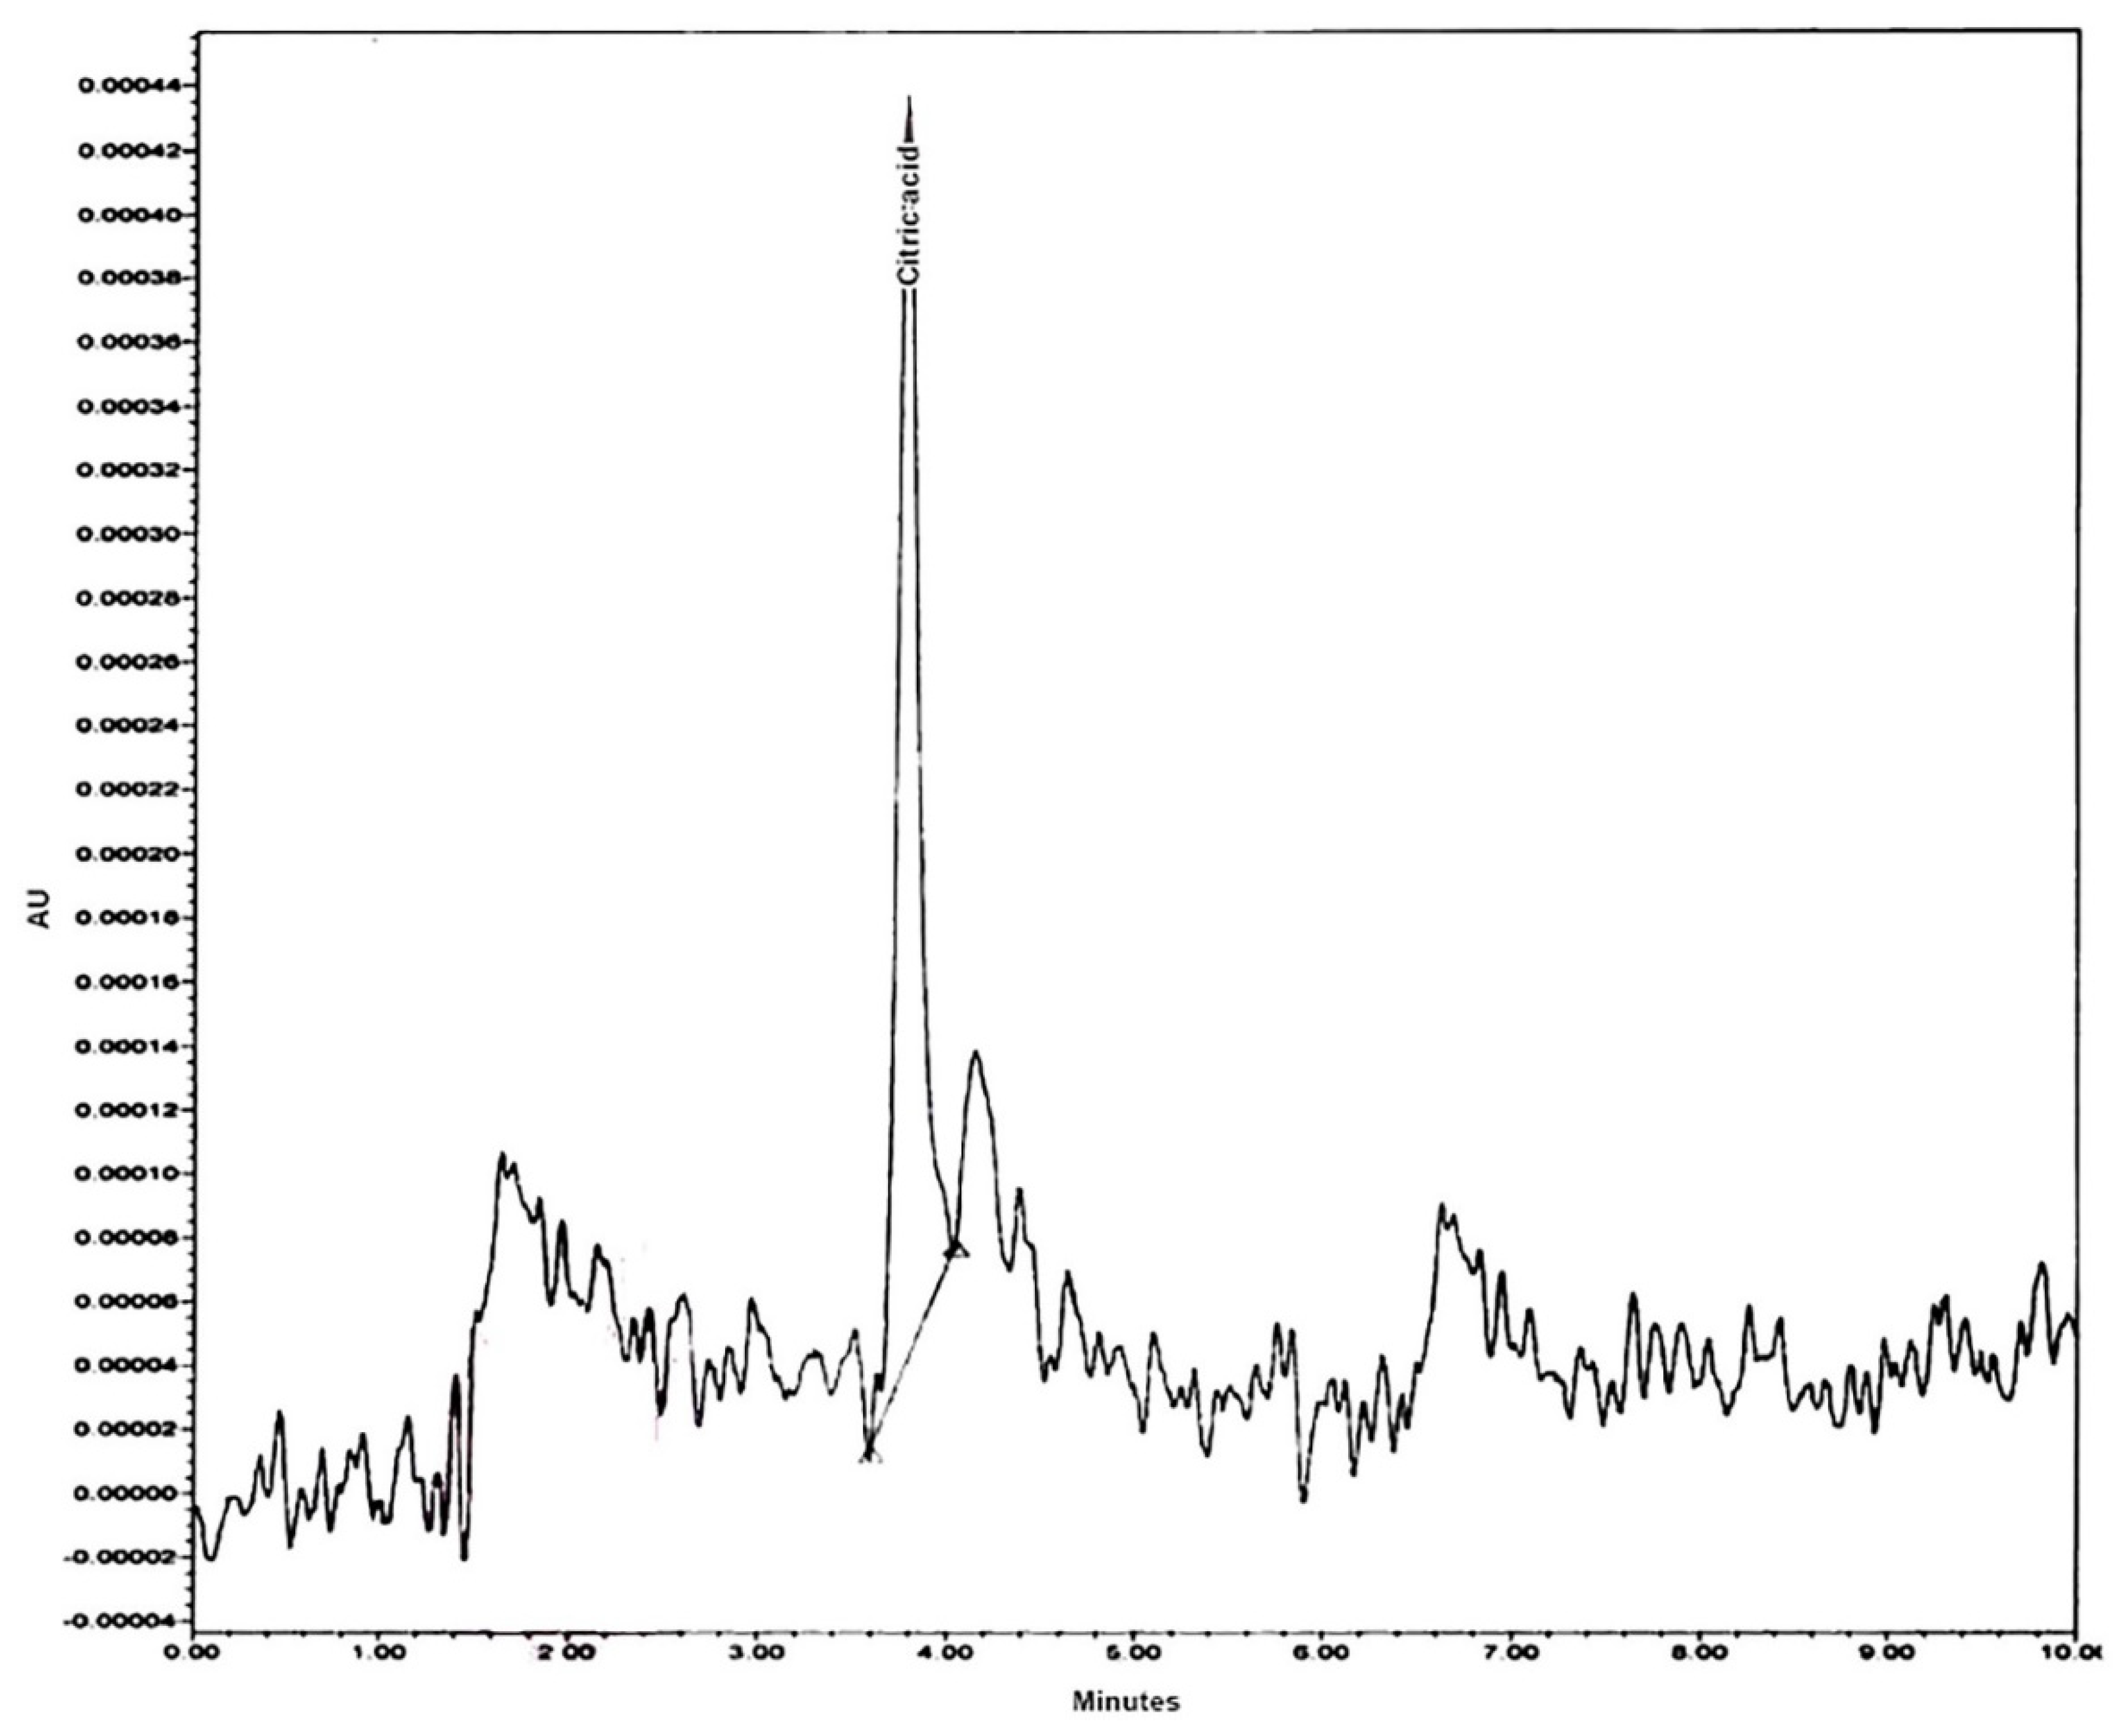
2.7. Ultra Performance Liquid Chromatography (UPLC) Analysis
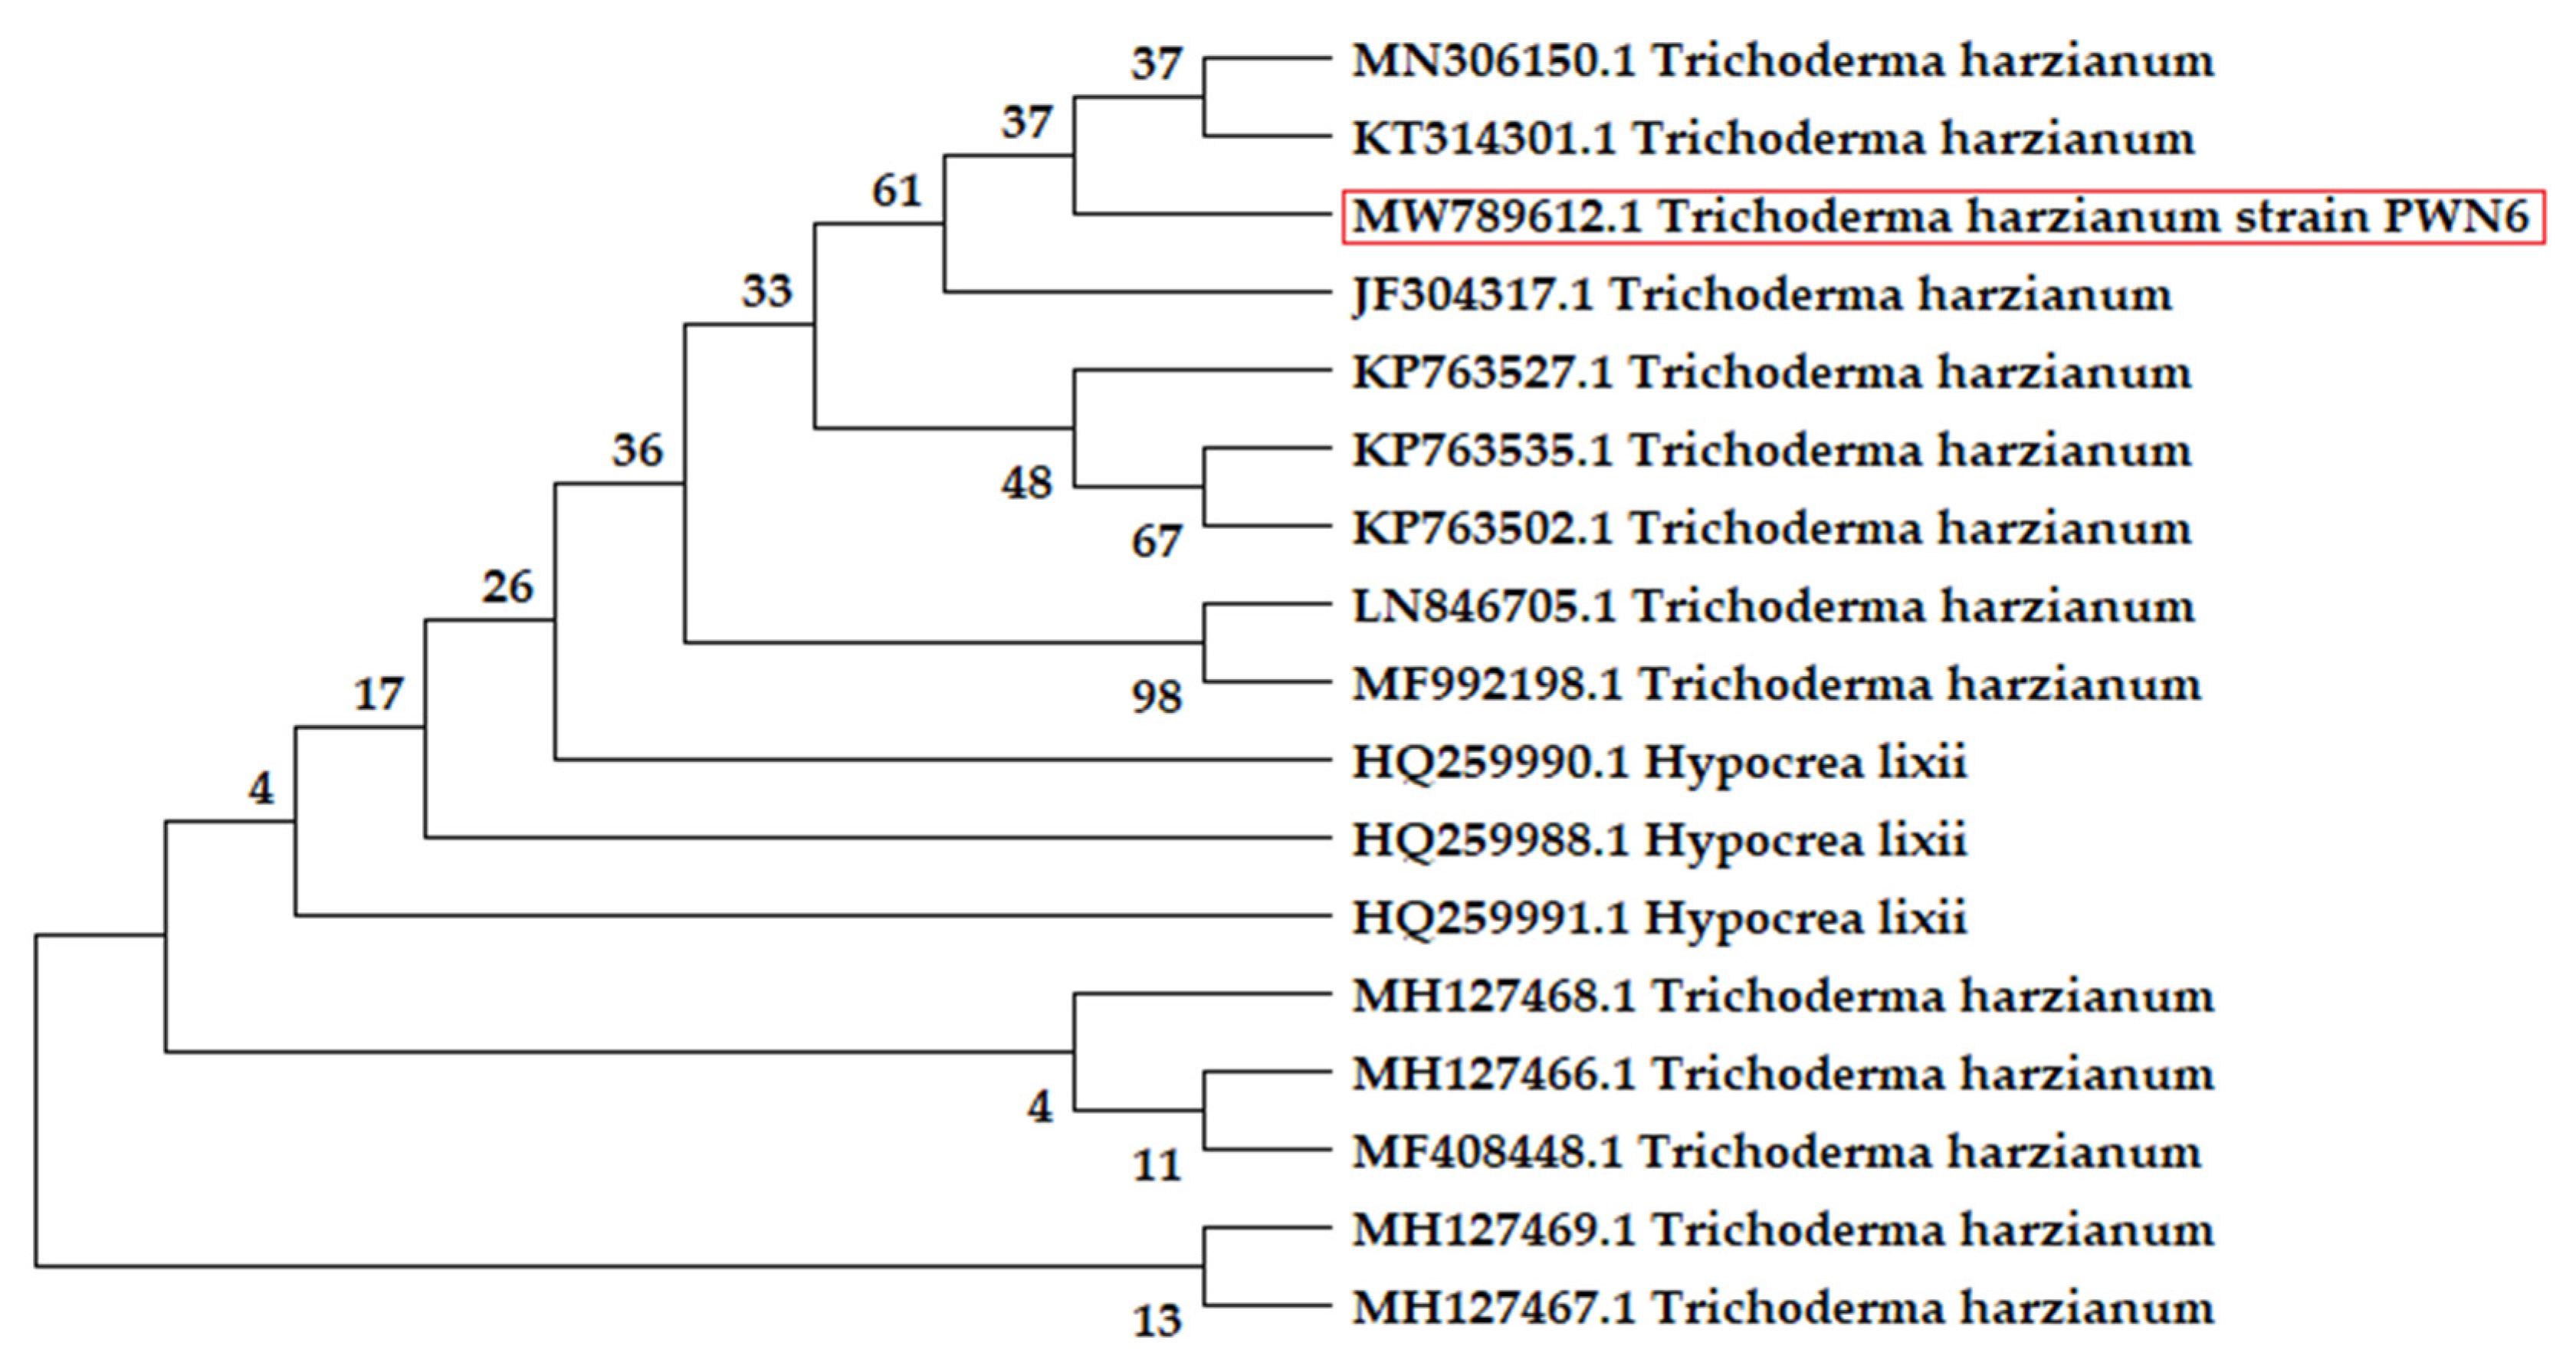
2.8. Identification of the Fungal Strain
3. Discussion
4. Materials and Methods
4.1. Trichoderma Species
4.2. SEB
4.3. Fermentation Medium
4.4. Fermentation Procedure
4.5. Modeling of OA Biosynthesis
4.5.1. Constructing the DSD
4.5.2. ANN for Modeling OA Biosynthesis
4.6. Biochemical Analysis
4.6.1. Colorimetrical Determinations
4.6.2. GC-MS Analysis
4.6.3. UPLC-PDA Analysis and Quantification of CA
4.7. Identification of Fungal Strain
4.8. Trial Design and Statistical Examination
5. Conclusions
Author Contributions
Funding
Institutional Review Board Statement
Informed Consent Statement
Conflicts of Interest
Sample Availability
References
- El-Naggar, N.E.-A.; Abdelwahed, N.A.; Saber, W.I.; Mohamed, A.A. Bioprocessing of some agro-industrial residues for endoglucanase production by the new subsp.; Streptomyces albogriseolus subsp. cellulolyticus strain NEAE-J. Braz. J. Microbiol. 2014, 45, 743–756. [Google Scholar] [CrossRef] [PubMed] [Green Version]
- Akasha, I.; Campbell, L.; Lonchamp, J.; Euston, S.R. The major proteins of the seed of the fruit of the date palm (Phoenix dactylifera L.): Characterisation and emulsifying properties. Food Chem. 2016, 197, 799–806. [Google Scholar] [CrossRef]
- Al-Kaabi, K.; Al-Khanbashi, A.; Hammami, A. Date palm fibers as polymeric matrix reinforcement: DPF/polyester composite properties. Polym. Compos. 2005, 26, 604–613. [Google Scholar] [CrossRef]
- Chandrasekaran, M.; Bahkali, A.H. Valorization of date palm (Phoenix dactylifera) fruit processing by-products and wastes using bioprocess technology—Review. Saudi J. Biol. Sci. 2013, 20, 105–120. [Google Scholar] [CrossRef] [PubMed] [Green Version]
- Agoudjil, B.; Benchabane, A.; Boudenne, A.; Ibos, L.; Fois, M. Renewable materials to reduce building heat loss: Characterization of date palm wood. Energy Build. 2011, 43, 491–497. [Google Scholar] [CrossRef]
- Hassan, M.; Bras, J.; Hassan, E.; Silard, C.; Mauret, E. Enzyme-assisted isolation of microfibrillated cellulose from date palm fruit stalks. Ind. Crop. Prod. 2014, 55, 102–108. [Google Scholar] [CrossRef]
- Rodrigues, C.; Vandenberghe, L.; Sturm, W.; Dergint, D.E.A.; Spier, M.R.; de Carvalho, J.; Soccol, C.R. Effect of forced aeration on citric acid production by Aspergillus sp. mutants in SSF. World J. Microbiol. Biotechnol. 2013, 29, 2317–2324. [Google Scholar] [CrossRef] [PubMed]
- Saber, W.I.; El-Naggar, N.E.-A.; El-Hersh, M.S.; El-Khateeb, A. An Innovative Synergism Between Aspergillus oryzae and Azotobacter chroococcum for Bioconversion of Cellulosic Biomass into Organic Acids under Restricted Nutritional Conditions Using Multi-Response Surface Optimization. Biotechnology 2015, 14, 47–57. [Google Scholar] [CrossRef] [Green Version]
- Al-Askar, A.A.; Saber, W.I.; Ghoneem, K.M.; Hafez, E.E.; Ibrahim, A.A. Crude Citric Acid of Trichoderma asperellum: Tomato Growth Promotor and Suppressor of Fusarium oxysporum f. sp. lycopersici. Plants 2021, 10, 222. [Google Scholar] [CrossRef]
- Mattey, M. The production of organic acids. Crit. Rev. Biotechnol. 1992, 12, 87–132. [Google Scholar] [CrossRef] [PubMed]
- Saber, W.; El-Naggar, N.E.-A.; Abdal-Aziz, S.A. Bioconversion of Lignocellulosic Wastes into Organic Acids by Cellulolytic Rock Phosphate-Solubilizing Fungal Isolates Grown under Solid-State Fermentation Conditions. Res. J. Microbiol. 2010, 5, 1–20. [Google Scholar] [CrossRef] [Green Version]
- Al-Askar, A.A.; Saber, W.I.A.; Ghoneem, K.M.; Rashad, Y.M. Oxalic acid as the main molecule produced by Trichoderma asperellum MG323528 fermented on corn stover based medium. Biotechnology 2018, 17, 95–103. [Google Scholar]
- Kapilan, R. Solid state fermentation for microbial products: A review. Arch. Appl. Sci. Res. 2015, 7, 21–25. [Google Scholar]
- Parekh, S.; Vinci, V.A.; Strobel, R.J. Improvement of microbial strains and fermentation processes. Appl. Microbiol. Biotechnol. 2000, 54, 287–301. [Google Scholar] [CrossRef] [PubMed]
- Naser, S.; Saber, W.; El-Metwally, M.; Moustafa, M.; El-Kott, A.; Saber, W. Fungal assembly of L-asparaginase using solid-state fermentation: A review. Biocell 2020, 44, 147–155. [Google Scholar] [CrossRef]
- Lin, C.-Y. Construction and selection of the optimal balanced blocked definitive screening design. Metrika 2014, 78, 373–383. [Google Scholar] [CrossRef]
- Tai, M.; Ly, A.; Leung, I.; Nayar, G. Efficient high-throughput biological process characterization: Definitive screening design with the Ambr250 bioreactor system. Biotechnol. Prog. 2015, 31, 1388–1395. [Google Scholar] [CrossRef] [Green Version]
- Jones, B.; Nachtsheim, C.J. A Class of Three-Level Designs for Definitive Screening in the Presence of Second-Order Effects. J. Qual. Technol. 2011, 43, 1–15. [Google Scholar] [CrossRef]
- Shanmugaprakash, M.; Venkatachalam, S.; Rajendran, K.; Pugazhendhi, A. Biosorptive removal of Zn(II) ions by Pongamia oil cake (Pongamia pinnata) in batch and fixed-bed column studies using response surface methodology and artificial neural network. J. Environ. Manag. 2018, 227, 216–228. [Google Scholar] [CrossRef]
- Saber, W.I.A.; El-Naggar, N.E.-A.; El-Hersh, M.S.; El-Khateeb, A.Y.; Elsayed, A.; Eldadamony, N.M.; Ghoniem, A.A. Rotatable central composite design versus artificial neural network for modeling biosorption of Cr6+ by the immobilized Pseudomonas alcaliphila NEWG-2. Sci. Rep. 2021, 11, 1717. [Google Scholar] [CrossRef]
- Talib, N.S.R.; Halmi, M.I.E.; Gani, S.S.A.; Zaidan, U.H.; Shukor, M.Y.A. Artificial Neural Networks (ANNs) and Response Surface Methodology (RSM) Approach for Modelling the Optimization of Chromium (VI) Reduction by Newly Isolated Acinetobacter radioresistens Strain NS-MIE from Agricultural Soil. BioMed Res. Int. 2019, 2019, 5785387. [Google Scholar] [CrossRef] [Green Version]
- Zanoelo, F.; Polizeli, M.D.L.; Terenzi, H.F.; Jorge, J.A. Purification and biochemical properties of a thermostable xylose-tolerant β-D-xylosidase from Scytalidium thermophilum. J. Ind. Microbiol. Biotechnol. 2004, 31, 170–176. [Google Scholar] [CrossRef]
- Karp, S.G.; Woiciechowski, A.; Soccol, V.T.; Soccol, C.R. Pretreatment strategies for delignification of sugarcane bagasse: A review. Braz. Arch. Biol. Technol. 2013, 56, 679–689. [Google Scholar] [CrossRef]
- Badhan, A.; Chadha, B.; Kaur, J.; Saini, H.; Bhat, M. Production of multiple xylanolytic and cellulolytic enzymes by thermophilic fungus Myceliophthora sp. IMI 387099. Bioresour. Technol. 2007, 98, 504–510. [Google Scholar] [CrossRef] [PubMed]
- Al-Askar, A.A.; Ezzat, A.S.; Ghoneem, K.M.; Saber, W.I.A. Trichoderma harzianum WKY5 and its gibberellic acid control of Rhizoctonia solani, improve sprouting, growth and productivity of potato. Egypt. J. Biol. Pest Control. 2016, 26, 504–510. [Google Scholar]
- Alkahtani, M.D.F.; Fouda, A.; Attia, K.A.; Al-Otaibi, F.; Eid, A.M.; Ewais, E.E.-D.; Hijri, M.; St-Arnaud, M.; Hassan, S.E.-D.; Khan, N.; et al. Isolation and Characterization of Plant Growth Promoting Endophytic Bacteria from Desert Plants and Their Application as Bioinoculants for Sustainable Agriculture. Agronomy 2020, 10, 1325. [Google Scholar] [CrossRef]
- Maran, J.P.; Sivakumar, V.; Thirugnanasambandham, K.; Sridhar, R. Artificial neural network and response surface methodology modeling in mass transfer parameters predictions during osmotic dehydration of Carica papaya L. Alex. Eng. J. 2013, 52, 507–516. [Google Scholar] [CrossRef] [Green Version]
- Shafi, J.; Sun, Z.; Ji, M.; Gu, Z.; Ahmad, W. ANN and RSM based modelling for optimization of cell dry mass of Bacillus sp. strain B67 and its antifungal activity against Botrytis cinerea. Biotechnol. Biotechnol. Equip. 2017, 32, 58–68. [Google Scholar] [CrossRef] [Green Version]
- Bingöl, D.; Hercan, M.; Elevli, S.; Kılıç, E. Comparison of the results of response surface methodology and artificial neural network for the biosorption of lead using black cumin. Bioresour. Technol. 2012, 112, 111–115. [Google Scholar] [CrossRef]
- Saber, W.I.A.; El-Naggar, N.E.-A. Optimization of Fermentation Conditions for the Biosynthesis of Inulinase by the New Source; Aspergillus tamarii and Hydrolysis of Some Inulin Containing Agro-Wastes. Biotechnology 2009, 8, 425–433. [Google Scholar] [CrossRef]
- Ekeleme, I.K.; Makut, M.D.; Adoga, M.P.; Tsaku, P.A.; Nkene, I.H.; Oti, V.B. Production of Citric Acid by Trichoderma viride Isolated from Soil in Keffi, Nigeria Using Glucose Enhanced Substrates. S. Asian J. Res. Microbiol. 2018, 1–6. [Google Scholar] [CrossRef]
- Inglis, P.W.; Tigano, M.S. Identification and taxonomy of some entomopathogenic Paecilomyces spp. (Ascomycota) isolates using rDNA-ITS Sequences. Genet. Mol. Biol. 2006, 29, 132–136. [Google Scholar] [CrossRef] [Green Version]
- Badotti, F.; De Oliveira, F.S.; Garcia, C.F.; Vaz, A.B.M.; Fonseca, P.L.C.; Nahum, L.A.; Oliveira, G.; Góes-Neto, A. Effectiveness of ITS and sub-regions as DNA barcode markers for the identification of Basidiomycota (Fungi). BMC Microbiol. 2017, 17, 42. [Google Scholar] [CrossRef] [PubMed] [Green Version]
- Raja, H.A.; Miller, A.N.; Pearce, C.J.; Oberlies, N.H. Fungal Identification Using Molecular Tools: A Primer for the Natural Products Research Community. J. Nat. Prod. 2017, 80, 756–770. [Google Scholar] [CrossRef]
- Schoch, C.L.; Seifert, K.A.; Huhndorf, S.; Robert, V.; Spouge, J.L.; Levesque, C.A.; Chen, W.; Bolchacova, E.; Voigt, K.; Crous, P.W.; et al. Nuclear ribosomal internal transcribed spacer (ITS) region as a universal DNA barcode marker for Fungi. Proc. Natl. Acad. Sci. USA 2012, 109, 6241–6246. [Google Scholar] [CrossRef] [Green Version]
- Bailey, M.J.; Biely, P.; Poutanen, K. Interlaboratory testing of methods for assay of xylanase activity. J. Biotechnol. 1992, 23, 257–270. [Google Scholar] [CrossRef]
- Miller, G.L. Use of dinitrosalicylic acid reagent for determination of reducing sugar. Anal. Chem. 1959, 31, 426–428. [Google Scholar] [CrossRef]
- Jackson, M.L. Soil Chemical Analysis: Advanced Course; UW-Madison Libraries Parallel Press: Madison, WI, USA, 2005. [Google Scholar]
- Montgomery, H.A.C.; Dymock, J.F.; Thom, N.S. The rapid colorimetric determination of organic acids and their salts in sewage-sludge liquor. Analyst 1962, 87, 949–955. [Google Scholar] [CrossRef]
- Domsch, K.H.; Gams, W.; Anderson, T.H. Compendium of Soil Fungi; Academic Press: New York, NY, USA, 1980. [Google Scholar]
- Bissett, J. A revision of the genus Trichoderma. II. Infrageneric classification. Can. J. Bot. 1991, 69, 2357–2372. [Google Scholar] [CrossRef]
- Kubicek, C.P.; Harman, G.E. Trichoderma and Gliocladium. Volume 1: Basic Biology, Taxonomy and Genetics; Taylor and Francis Ltd.: London, UK, 1998. [Google Scholar]


| Isolate | Glucose (µmol/g) | U (µmol/g/min) | OA (µmol/g) | Filtrate pH | Soluble P (mg/g) | |||
|---|---|---|---|---|---|---|---|---|
| FPase | CMCase | β-Glucosidase | Xylanase | |||||
| Trichoderma sp. MNW1 | 2463.0 ± 25.3 | 87.26 ± 7.7 | 0.16 ± 0.02 | 367.80 ± 17.6 | 38.44 ± 7,8 | 170.20 ± 13.4 | 5.22 ± 0.3 | 6.41 ± 0.8 |
| Trichoderma sp. MNW5 | 2284.6 ± 15.7 | 88.33 ± 6.8 | 0.16 ± 0.01 | 411.61 ± 17.2 | 39.37 ± 8.3 | 170.78 ± 8.8 | 5.49 ± 0.4 | 5.67 + 0.7 |
| Trichoderma sp. PWN2 | 2752.7 ± 33.8 | 40.51 ± 12.1 | 0.00 | 130.76 ± 28.4 | 29.31 ± 3.8 | 0.00 | 5.94 ± 0.4 | 2.01 ± 0.3 |
| Trichoderma sp. PWN3 | 2117.5 ± 39.1 | 85.94 ± 4.9 | 0.05 ± 0.01 | 290.50 ± 13.5 | 50.07 ± 6.6 | 28.40 ± 3.3 | 5.43 ± 0.2 | 4.36 ± 0.8 |
| Trichoderma sp. PWN4 | 2485.3 ± 27.4 | 32.25 ± 5.2 | 0.00 | 231.06 ± 9.3 | 50.25 ± 5.2 | 3.32 ± o.9 | 5.78 ± 0.1 | 3.28 ± 0.5 |
| Trichoderma sp. PWN6 | 1783.1 ± 13.5 | 93.03 ± 5.6 | 0.18 ± 0.03 | 425.72 ± 19.7 | 51.53 ± 4.5 | 195.41 ± 9.7 | 5.13 ± 0.2 | 7.63 ± 0.9 |
| Simple correlation coefficient | ||||||||
| FPase | −0.715 NS | |||||||
| CMCase | −0.615 NS | 0.875 ** | ||||||
| β-glucosidase | −0.747 NS | 0.865 ** | 0.946 ** | |||||
| Xylanase | −0.752 NS | 0.240 NS | 0.133 NS | 0.411 NS | ||||
| OA (µmol/g) | −0.566 NS | 0.807 NS | 0.992 ** | 0.922 ** | 0.097 NS | |||
| Filtrate pH | 0.777 NS | −0.893 ** | −0.867 ** | −0.887 ** | −0.453 NS | −0.834 ** | ||
| Soluble P (mg/g) | −0.769 NS | 0.852 ** | 0.945 ** | 0.955 ** | 0.406 NS | 0.935 ** | −0.959 ** | |
| Glucose (µmol/g) | FPase | CMCase | β-glucosidase | Xylanase | OA (µmol/g) | Filtrate pH | Soluble P (mg/g) | |
| Run | SEB | DPF Size (mm) | Time (Day) | Temperature (°C) | Inoculation (×107 spore/g) | TCP (mg/g) | AS (mg/g) | OA (µmol/g) | ||||
|---|---|---|---|---|---|---|---|---|---|---|---|---|
| Actual | DSD | ANN | ||||||||||
| Fitted | Residual | Fitted | Residual | |||||||||
| 1 | L1 (−1) | 6 (+1) | 9 (+1) | 35 (+1) | 8 (+1) | 20 (+1) | 20 (+1) | 222.33 | 209.77 | 12.56 | 213.22 | 9.11 |
| 2 * | L2 (+1) | 2 (−1) | 5 (−1) | 25 (−1) | 4 (−1) | 10 (−1) | 10 (−1) | 330.21 | 336.87 | −6.66 | 344.69 | −14.48 |
| 3 | L2 (+1) | 4 (0) | 9 (+1) | 25 (−1) | 8 (+1) | 10 (−1) | 10 (−1) | 240.65 | 235.52 | 5.13 | 236.61 | 4.04 |
| 4 | L1 (−1) | 4 (0) | 5 (−1) | 35 (+1) | 4 (−1) | 20 (+1) | 20 (+1) | 283.76 | 311.12 | −27.36 | 315.60 | −31.84 |
| 5 * | L2 (+1) | 2 (−1) | 7 (0) | 25 (−1) | 8 (+1) | 20 (+1) | 20 (+1) | 170.28 | 166.87 | 3.41 | 158.65 | 11.63 |
| 6 * | L1 (−1) | 6 (+1) | 7 (0) | 35 (+1) | 4 (−1) | 10 (−1) | 10 (−1) | 372.49 | 379.77 | −7.28 | 378.04 | −5.55 |
| 7 * | L2 (+1) | 6 (+1) | 9 (+1) | 30 (0) | 4 (−1) | 20 (+1) | 10 (−1) | 301.11 | 299.76 | 1.35 | 318.41 | −17.30 |
| 8 | L1 (−1) | 2 (−1) | 5 (−1) | 30 (0) | 8 (+1) | 10 (−1) | 20 (+1) | 240.41 | 246.88 | −6.47 | 250.11 | −9.70 |
| 9 | L2 (+1) | 2 (−1) | 5 (−1) | 35 (+1) | 6 (0) | 20 (+1) | 10 (−1) | 341.26 | 367.89 | −26.63 | 355.06 | −13.80 |
| 10 * | L1 (−1) | 6 (+1) | 9 (+1) | 25 (−1) | 6 (0) | 10 (−1) | 20 (+1) | 152.84 | 178.74 | −25.90 | 172.37 | −19.53 |
| 11 | L2 (+1) | 6 (+1) | 5 (−1) | 25 (−1) | 4 (−1) | 15 (0) | 20 (+1) | 200.61 | 225.77 | −25.16 | 216.49 | −15.88 |
| 12 | L1 (−1) | 2 (−1) | 9 (+1) | 35 (+1) | 8 (+1) | 15 (0) | 10 (−1) | 300.00 | 320.87 | −20.87 | 315.87 | −15.87 |
| 13 | L2 (+1) | 6 (+1) | 5 (−1) | 35 (+1) | 8 (+1) | 10 (−1) | 15 (0) | 311.64 | 309.50 | 2.14 | 314.25 | −2.61 |
| 14 | L1 (−1) | 2 (−1) | 9 (+1) | 25 (−1) | 4 (−1) | 20 (+1) | 15 (0) | 223.27 | 237.14 | −13.87 | 239.23 | −15.96 |
| 15 | L2 (+1) | 2 (−1) | 9 (+1) | 35 (+1) | 4 (−1) | 10 (−1) | 20 (+1) | 385.64 | 381.36 | 4.28 | 372.78 | 12.86 |
| 16 | L1 (−1) | 6 (+1) | 5 (−1) | 25 (−1) | 8 (+1) | 20 (+1) | 10 (−1) | 149.46 | 165.27 | −15.81 | 160.43 | −10.97 |
| 17 | L1 (−1) | 4 (0) | 7 (0) | 30 (0) | 6 (0) | 15 (0) | 15 (0) | 260.29 | 262.83 | −2.53 | 262.56 | −2.27 |
| 18 | L2 (+1) | 4 (0) | 7 (0) | 30 (0) | 6 (0) | 15 (0) | 15 (0) | 297.28 | 283.81 | 13.47 | 292.09 | 5.19 |
| 19 * | L1 (−1) | 6 (+1) | 9 (+1) | 35 (+1) | 8 (+1) | 20 (+1) | 20 (+1) | 228.27 | 209.77 | 18.50 | 213.22 | 15.05 |
| 20 | L2 (+1) | 2 (−1) | 5 (−1) | 25 (−1) | 4 (−1) | 10 (−1) | 10 (−1) | 353.26 | 336.87 | 16.39 | 344.69 | 8.57 |
| 21 | L2 (+1) | 4 (0) | 9 (+1) | 25 (−1) | 8 (+1) | 10 (−1) | 10 (−1) | 220.81 | 235.52 | −14.71 | 236.61 | −15.80 |
| 22 * | L1 (−1) | 4 (0) | 5 (−1) | 35 (+1) | 4 (−1) | 20 (+1) | 20 (+1) | 351.24 | 311.12 | 40.12 | 315.60 | 35.64 |
| 23 | L2 (+1) | 2 (−1) | 7 (0) | 25 (−1) | 8 (+1) | 20 (+1) | 20 (+1) | 141.85 | 166.87 | −25.02 | 158.65 | −16.80 |
| 24 | L1 (−1) | 6 (+1) | 7 (0) | 35 (+1) | 4 (−1) | 10 (−1) | 10 (−1) | 351.46 | 379.77 | −28.31 | 378.04 | −26.58 |
| 25 | L2 (+1) | 6 (+1) | 9 (+1) | 30 (0) | 4 (−1) | 20 (+1) | 10 (−1) | 314.47 | 299.76 | 14.71 | 318.41 | −3.94 |
| 26 | L1 (−1) | 2 (−1) | 5 (−1) | 30 (0) | 8 (+1) | 10 (−1) | 20 (+1) | 266.61 | 246.88 | 19.73 | 250.11 | 16.50 |
| 27 | L2 (+1) | 2 (−1) | 5 (−1) | 35 (+1) | 6 (0) | 20 (+1) | 10 (−1) | 371.80 | 367.89 | 3.91 | 355.06 | 16.74 |
| 28 | L1 (−1) | 6 (+1) | 9 (+1) | 25 (−1) | 6 (0) | 10 (−1) | 20 (+1) | 190.84 | 178.74 | 12.10 | 172.37 | 18.47 |
| 29 * | L2 (+1) | 6 (+1) | 5 (−1) | 25 (−1) | 4 (−1) | 15 (0) | 20 (+1) | 220.29 | 225.77 | −5.48 | 216.49 | 3.80 |
| 30 | L1 (−1) | 2 (−1) | 9 (+1) | 35 (+1) | 8 (+1) | 15 (0) | 10 (−1) | 321.53 | 320.87 | 0.66 | 315.87 | 5.66 |
| 31 * | L2 (+1) | 6 (+1) | 5 (−1) | 35 (+1) | 8 (+1) | 10 (−1) | 15 (0) | 320.37 | 309.50 | 10.87 | 314.25 | 6.12 |
| 32 * | L1 (−1) | 2 (−1) | 9 (+1) | 25 (−1) | 4 (−1) | 20 (+1) | 15 (0) | 244.42 | 237.14 | 7.28 | 239.23 | 5.19 |
| 33 * | L2 (+1) | 2 (−1) | 9 (+1) | 35 (+1) | 4 (−1) | 10 (−1) | 20 (+1) | 361.88 | 381.36 | −19.48 | 372.78 | −10.90 |
| 34 | L1 (−1) | 6 (+1) | 5 (−1) | 25 (−1) | 8 (+1) | 20 (+1) | 10 (−1) | 178.14 | 165.27 | 12.87 | 160.43 | 17.71 |
| 35 | L1 (−1) | 4 (0) | 7 (0) | 30 (0) | 6 (0) | 15 (0) | 15 (0) | 264.21 | 262.83 | 1.38 | 262.56 | 1.65 |
| 36 | L2 (+1) | 4 (0) | 7 (0) | 30 (0) | 6 (0) | 15 (0) | 15 (0) | 298.65 | 283.81 | 14.84 | 292.09 | 6.56 |
| 37 | L1 (−1) | 6 (+1) | 9 (+1) | 35 (+1) | 8 (+1) | 20 (+1) | 20 (+1) | 200.64 | 209.77 | −9.13 | 213.22 | −12.58 |
| 38 | L2 (+1) | 2 (−1) | 5 (−1) | 25 (−1) | 4 (−1) | 10 (−1) | 10 (−1) | 361.47 | 336.87 | 24.60 | 344.69 | 16.78 |
| 39 * | L2 (+1) | 4 (0) | 9 (+1) | 25 (−1) | 8 (+1) | 10 (−1) | 10 (−1) | 229.98 | 235.52 | −5.54 | 236.61 | −6.63 |
| 40 * | L1 (−1) | 4 (0) | 5 (−1) | 35 (+1) | 4 (−1) | 20 (+1) | 20 (+1) | 302.46 | 311.12 | −8.66 | 315.60 | −13.14 |
| 41 * | L2 (+1) | 2 (−1) | 7 (0) | 25 (−1) | 8 (+1) | 20 (+1) | 20 (+1) | 159.23 | 166.87 | −7.64 | 158.65 | 0.58 |
| 42 * | L1 (−1) | 6 (+1) | 7 (0) | 35 (+1) | 4 (−1) | 10 (−1) | 10 (−1) | 380.54 | 379.77 | 0.77 | 378.04 | 2.50 |
| 43 | L2 (+1) | 6 (+1) | 9 (+1) | 30 (0) | 4 (−1) | 20 (+1) | 10 (−1) | 315.82 | 299.76 | 16.06 | 318.41 | −2.59 |
| 44 * | L1 (−1) | 2 (−1) | 5 (−1) | 30 (0) | 8 (+1) | 10 (−1) | 20 (+1) | 260.18 | 246.88 | 13.30 | 250.11 | 10.07 |
| 45 * | L2 (+1) | 2 (−1) | 5 (−1) | 35 (+1) | 6 (0) | 20 (+1) | 10 (−1) | 350.66 | 367.89 | −17.23 | 355.06 | −4.40 |
| 46 | L1 (−1) | 6 (+1) | 9 (+1) | 25 (−1) | 6 (0) | 10 (−1) | 20 (+1) | 171.83 | 178.74 | −6.91 | 172.37 | −0.54 |
| 47 | L2 (+1) | 6 (+1) | 5 (−1) | 25 (−1) | 4 (−1) | 15 (0) | 20 (+1) | 219.77 | 225.77 | −6.00 | 216.49 | 3.28 |
| 48 | L1 (−1) | 2 (−1) | 9 (+1) | 35 (+1) | 8 (+1) | 15 (0) | 10 (−1) | 323.66 | 320.87 | 2.79 | 315.87 | 7.79 |
| 49 * | L2 (+1) | 6 (+1) | 5 (−1) | 35 (+1) | 8 (+1) | 10 (−1) | 15 (0) | 310.17 | 309.50 | 0.67 | 314.25 | −4.08 |
| 50 | L1 (−1) | 2 (−1) | 9 (+1) | 25 (−1) | 4 (−1) | 20 (+1) | 15 (0) | 251.86 | 237.14 | 14.72 | 239.23 | 12.63 |
| 51 | L2 (+1) | 2 (−1) | 9 (+1) | 35 (+1) | 4 (−1) | 10 (−1) | 20 (+1) | 382.46 | 381.36 | 1.10 | 372.78 | 9.68 |
| 52 | L1 (−1) | 6 (+1) | 5 (−1) | 25 (−1) | 8 (+1) | 20 (+1) | 10 (−1) | 160.95 | 165.27 | −4.32 | 160.43 | 0.52 |
| 53 | L1 (−1) | 4 (0) | 7 (0) | 30 (0) | 6 (0) | 15 (0) | 15 (0) | 283.44 | 262.83 | 20.61 | 262.56 | 20.88 |
| 54 | L2 (+1) | 4 (0) | 7 (0) | 30 (0) | 6 (0) | 15 (0) | 15 (0) | 310.46 | 283.81 | 26.65 | 292.09 | 18.37 |
| Source | Regression Coefficient | Freedom Degree | Contribution, % | Sum of Square | Mean Square | F-Value | p-Value |
|---|---|---|---|---|---|---|---|
| Model | 273.32 | 7 | 95.13 | 250772 | 35,825 | 128.38 | <0.001 * |
| Linear | 7 | 95.13 | 250,772 | 35,825 | 128.38 | <0.001 * | |
| SEB | 10.49 | 1 | 5.50 | 5379 | 5379 | 19.28 | <0.001 * |
| DPF size | −19.17 | 1 | 5.44 | 15,161 | 15,161 | 54.33 | <0.001 * |
| Time | −5.65 | 1 | 0.42 | 1319 | 1319 | 4.73 | 0.035 * |
| Temperature | 53.93 | 1 | 47.93 | 120,063 | 120,063 | 430.24 | <0.001 * |
| Inoculation | −35.44 | 1 | 18.81 | 51,835 | 51,835 | 185.75 | <0.001 * |
| TCP | −20.7 | 1 | 6.42 | 17,691 | 17,691 | 63.39 | <0.001 * |
| AS | −26.03 | 1 | 10.61 | 27,972 | 27,972 | 100.24 | <0.001 * |
| Error | 46 | 4.87 | 12,837 | 279 | |||
| Lack-of-fit | 10 | 1.68 | 4429 | 443 | 1.90 | 0.078 NS | |
| Pure error | 36 | 3.19 | 8408 | 234 | |||
| Total | 53 | 100 | 766,638 | ||||
| The goodness-of-fit statistics of the model | |||||||
| Standard deviation | 16.7051 | ||||||
| Coefficient of determination (R2) | 0.951 | ||||||
| Adjusted-R2 | 0.944 | ||||||
| Predicted-R2 | 0.933 | ||||||
| Predicted residual error sum of squares | 17,654.7 | ||||||
| Training Statistics | ||||
|---|---|---|---|---|
| Model | R2 | RMSE | MAD | Number of Used Runs |
| DSD | 0.947 | 15.71 | 13.16 | 36 |
| ANN | 0.960 | 13.58 | 11.41 | 36 |
| Validation Statistics | ||||
| DSD | 0.958 | 14.82 | 11.12 | 18 |
| ANN | 0.967 | 13.15 | 10.37 | 18 |
| Overall Model Comparison | ||||
| Statistics | DSD | ANN | Number of Used Runs | |
| R2 | 0.951 | 0.963 | 54 | |
| RMSE | 15.42 | 13.44 | 54 | |
| MAD | 12.48 | 11.06 | 54 | |
| SSE | 12836.7 | 9749.5 | 54 | |
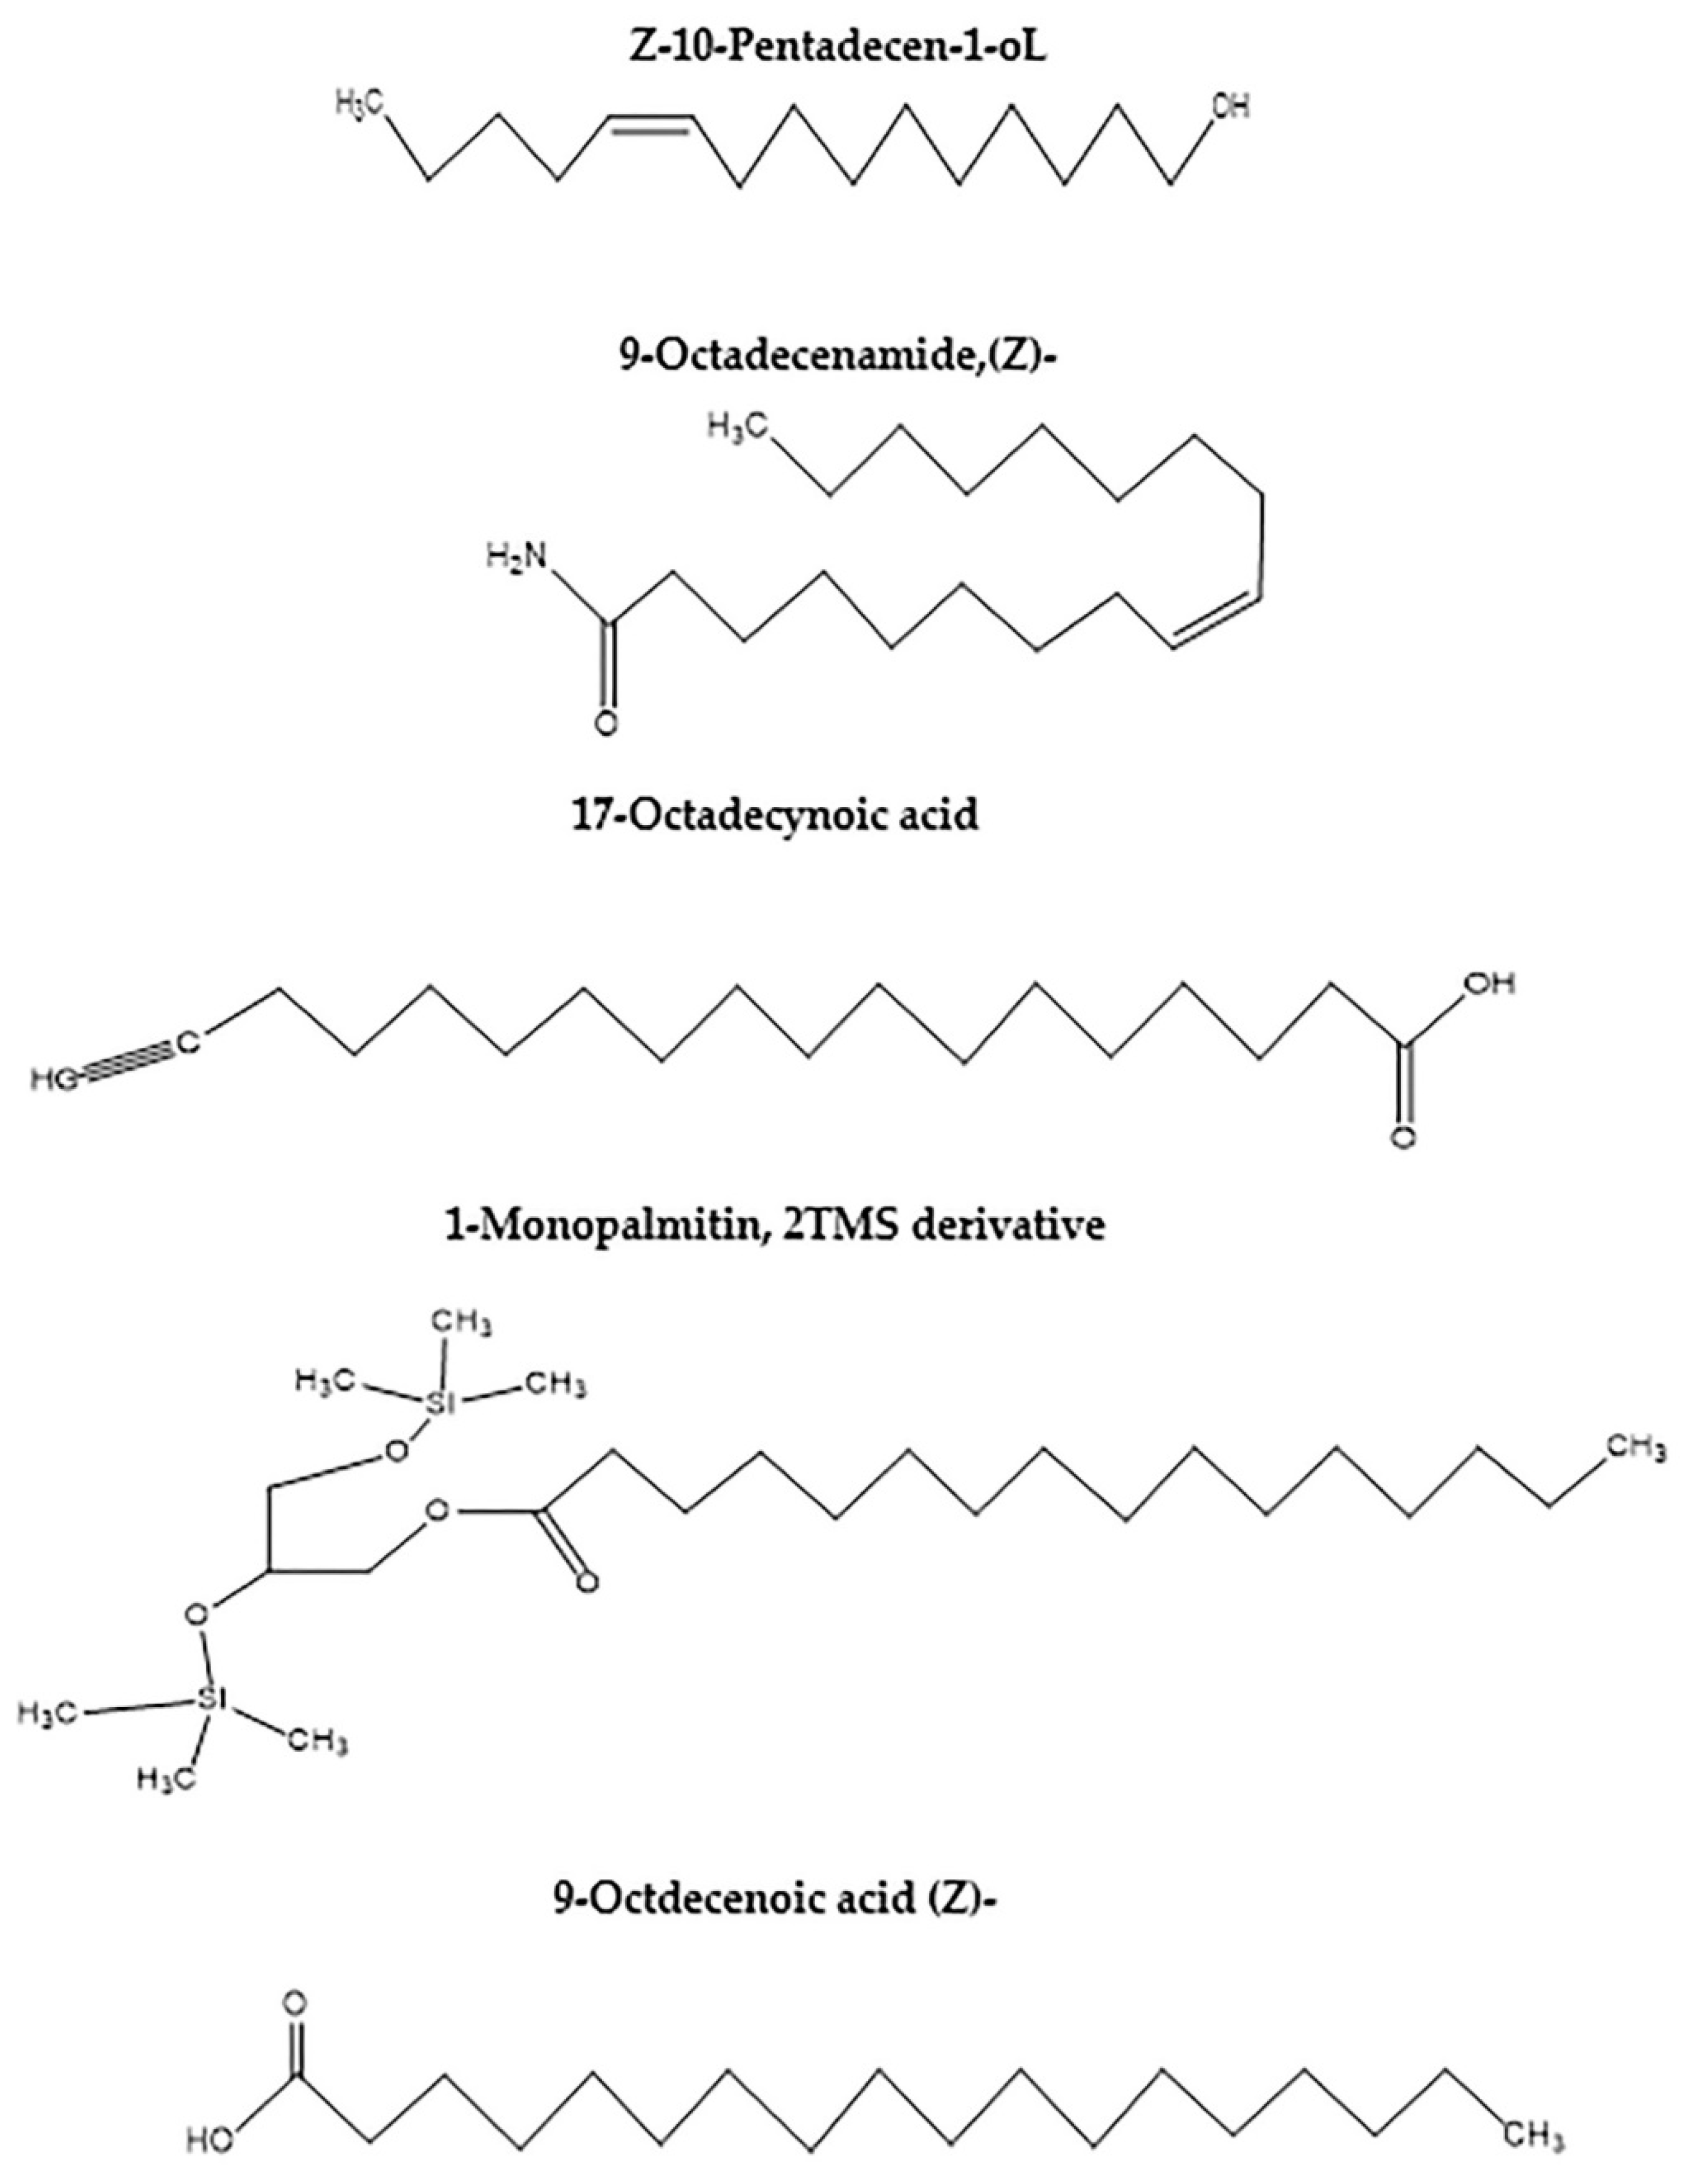
| Peak | RT | Name | Formula | Area | Area Sum % |
|---|---|---|---|---|---|
| 1 | 13.826 | Butylated Hydroxytoluene | C15H24O | 920,577.74 | 1.8 |
| 2 | 18.89 | 10-Pentadecen-1-ol, (Z), TMS derivative | C18H38OSi | 265,128.93 | 0.52 |
| 3 | 19.093 | 9-Dodecyn-1-ol, TMS derivative | C15H30OSi | 286,143.94 | 0.56 |
| 4 | 20.759 | Z-10-Pentadecen-1-ol | C15H30O | 3,106,296.7 | 6.06 |
| 5 | 22.07 | 9-Octadecenamide, (Z) | C18H35NO | 14,953,644 | 29.18 |
| 6 | 22.409 | 17-Octadecynoic acid | C18H32O2 | 2,387,210 | 4.66 |
| 7 | 23.765 | 1-Monopalmitin, 2TMS derivative | C25H54O4Si2 | 4,850,255.3 | 9.46 |
| 8 | 25.144 | 9-Octadecenoic acid (Z) | C18H34O2 | 22,763,917 | 44.42 |
| 9 | 28.919 | Androstane-11,17-dione, 3-[(trimethylsilyl)oxy], 17-[O-(phenylmethyl)oxime], (3. alpha.,5. alpha.) | C29H43NO3Si | 334,647.18 | 0.65 |
| 10 | 33.757 | Cyclobarbital | C12H16N2O3 | 321,345.1 | 0.63 |
| 11 | 33.908 | 1,4-Bis(trimethylsilyl)benzene | C12H22Si2 | 340,266.45 | 0.66 |
| 12 | 42.106 | Glycine, N-[(3α,5β)-24-oxo-3-[(trimethylsilyl)oxy]cholan-24-yl], methyl ester | C30H53NO4Si | 719,139.75 | 1.4 |
Publisher’s Note: MDPI stays neutral with regard to jurisdictional claims in published maps and institutional affiliations. |
© 2021 by the authors. Licensee MDPI, Basel, Switzerland. This article is an open access article distributed under the terms and conditions of the Creative Commons Attribution (CC BY) license (https://creativecommons.org/licenses/by/4.0/).
Share and Cite
Elsayed, M.S.; Eldadamony, N.M.; Alrdahe, S.S.T.; Saber, W.I.A. Definitive Screening Design and Artificial Neural Network for Modeling a Rapid Biodegradation of Date Palm Fronds by a New Trichoderma sp. PWN6 into Citric Acid. Molecules 2021, 26, 5048. https://doi.org/10.3390/molecules26165048
Elsayed MS, Eldadamony NM, Alrdahe SST, Saber WIA. Definitive Screening Design and Artificial Neural Network for Modeling a Rapid Biodegradation of Date Palm Fronds by a New Trichoderma sp. PWN6 into Citric Acid. Molecules. 2021; 26(16):5048. https://doi.org/10.3390/molecules26165048
Chicago/Turabian StyleElsayed, Maha S., Noha M. Eldadamony, Salma S. T. Alrdahe, and WesamEldin I. A. Saber. 2021. "Definitive Screening Design and Artificial Neural Network for Modeling a Rapid Biodegradation of Date Palm Fronds by a New Trichoderma sp. PWN6 into Citric Acid" Molecules 26, no. 16: 5048. https://doi.org/10.3390/molecules26165048