
QSAR Assessing the Efficiency of Antioxidants in the Termination of Radical-Chain Oxidation Processes of Organic Compounds


Abstract
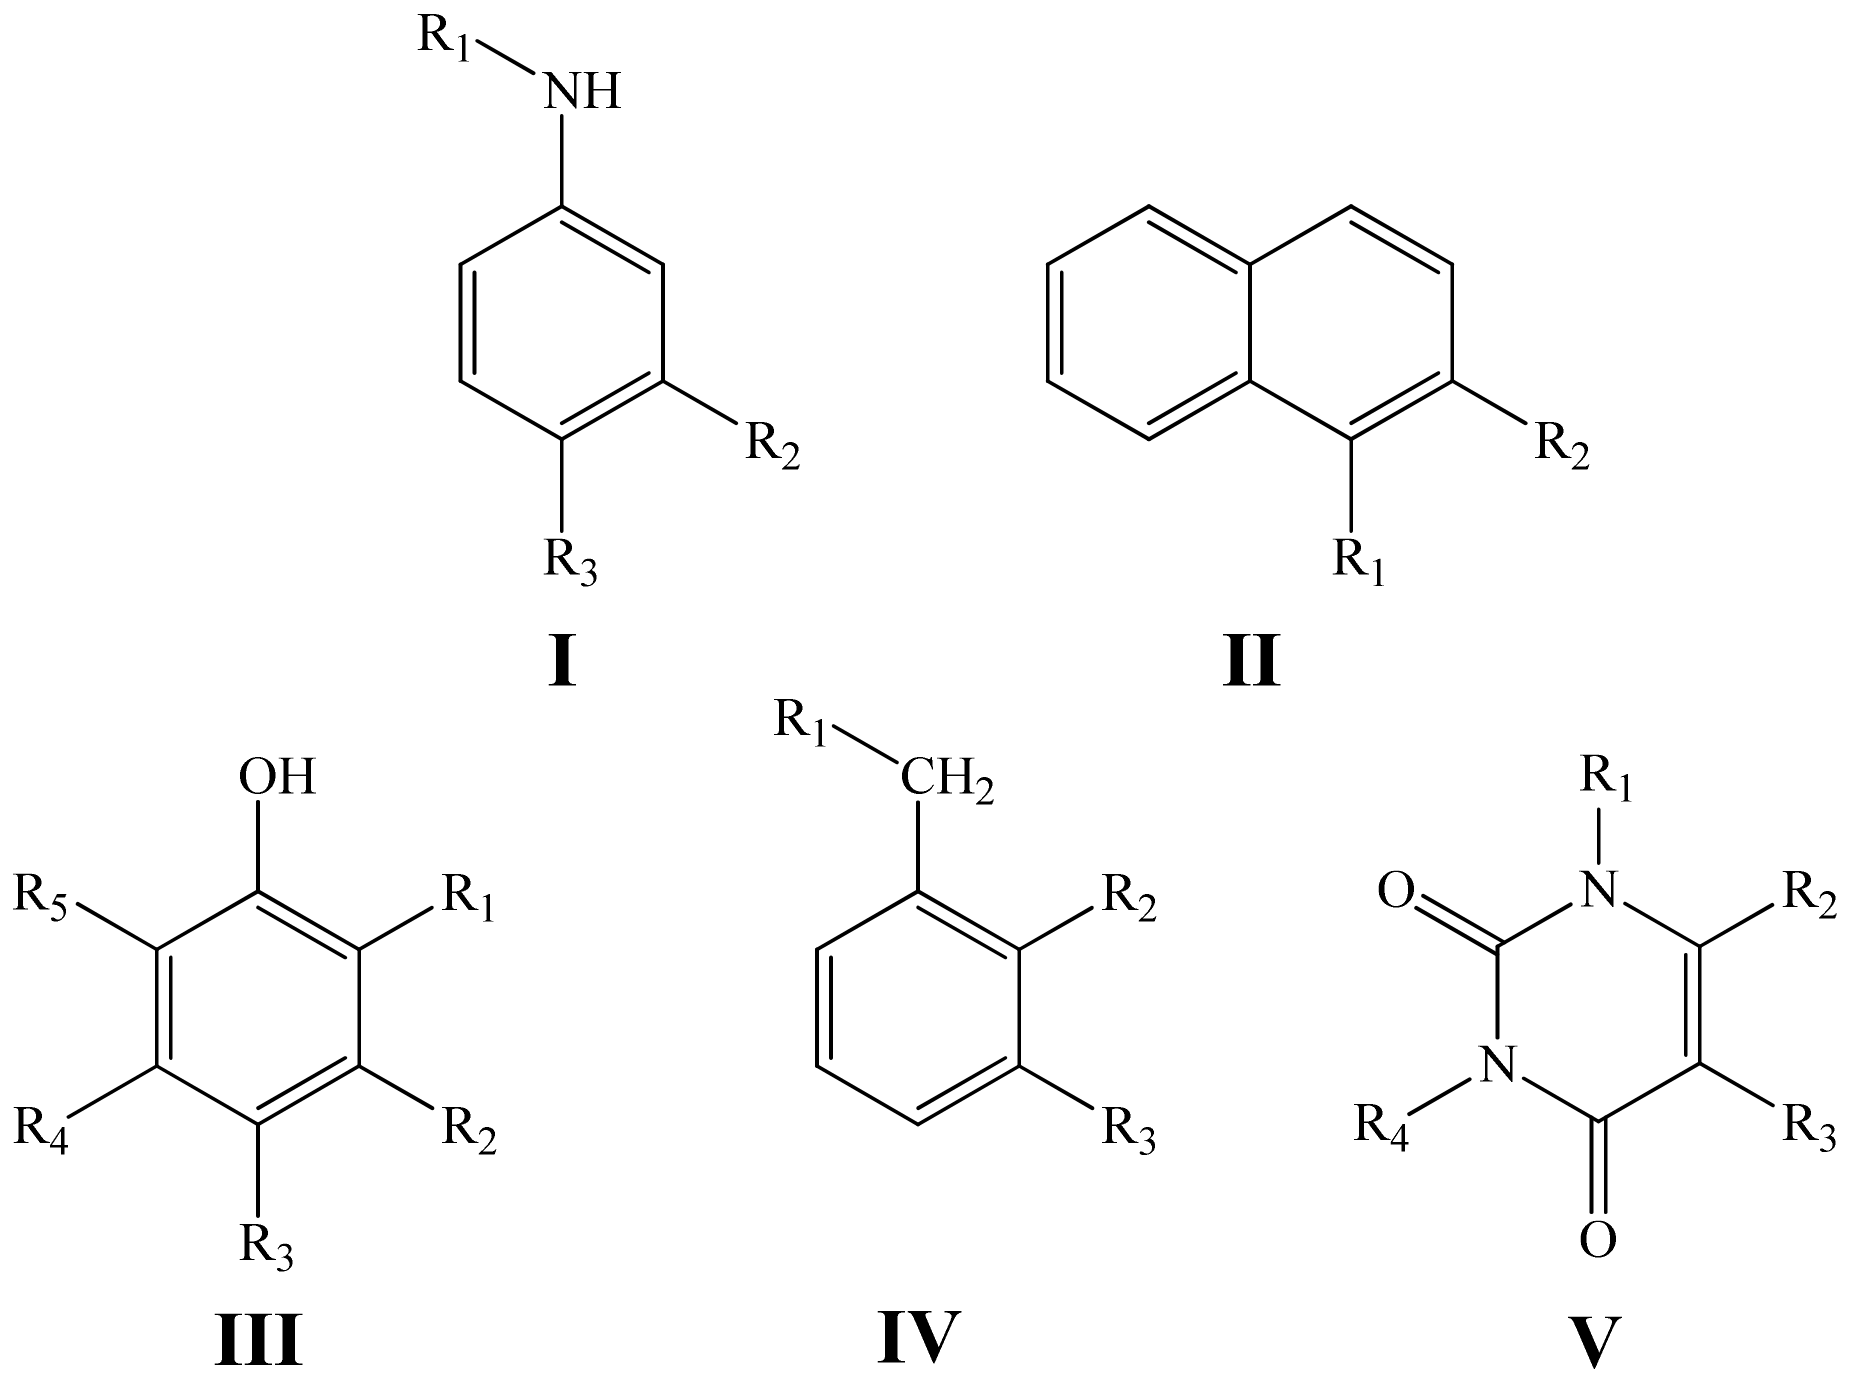
:1. Introduction
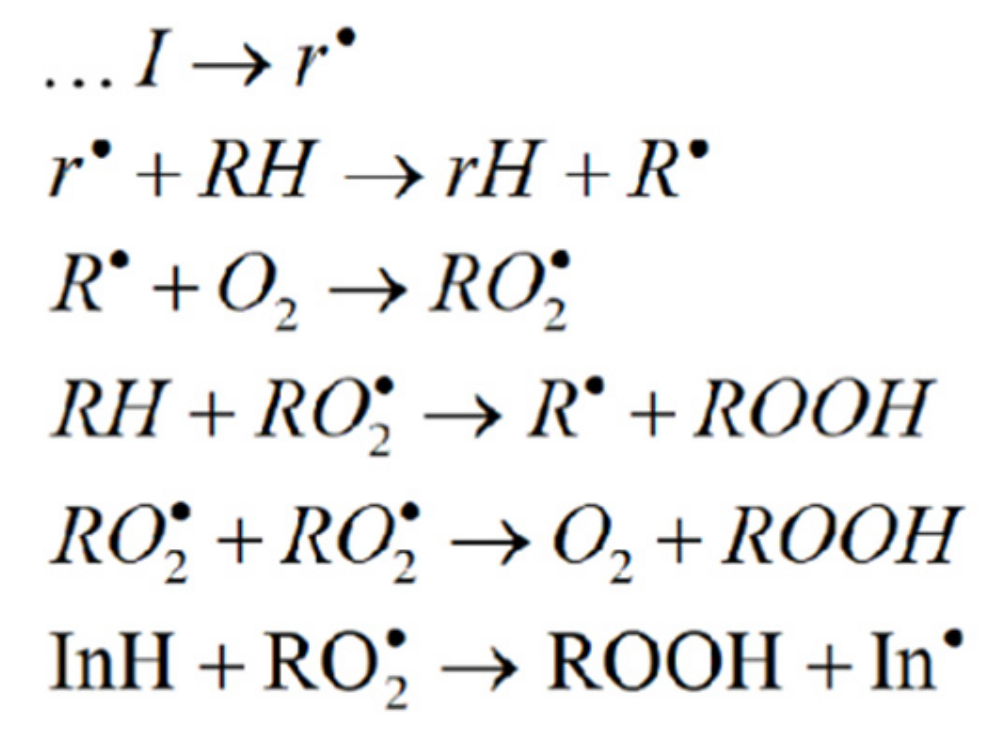
- Termination of the chains by the reaction of the inhibitor with peroxyl radicals;
- Termination of the chains by the reaction of the inhibitor with alkyl radicals;
- Termination with the compounds inducing the non-radical decomposition of the organic hydroperoxide (only if the latter is the main auto-initiator).
2. Computational Details
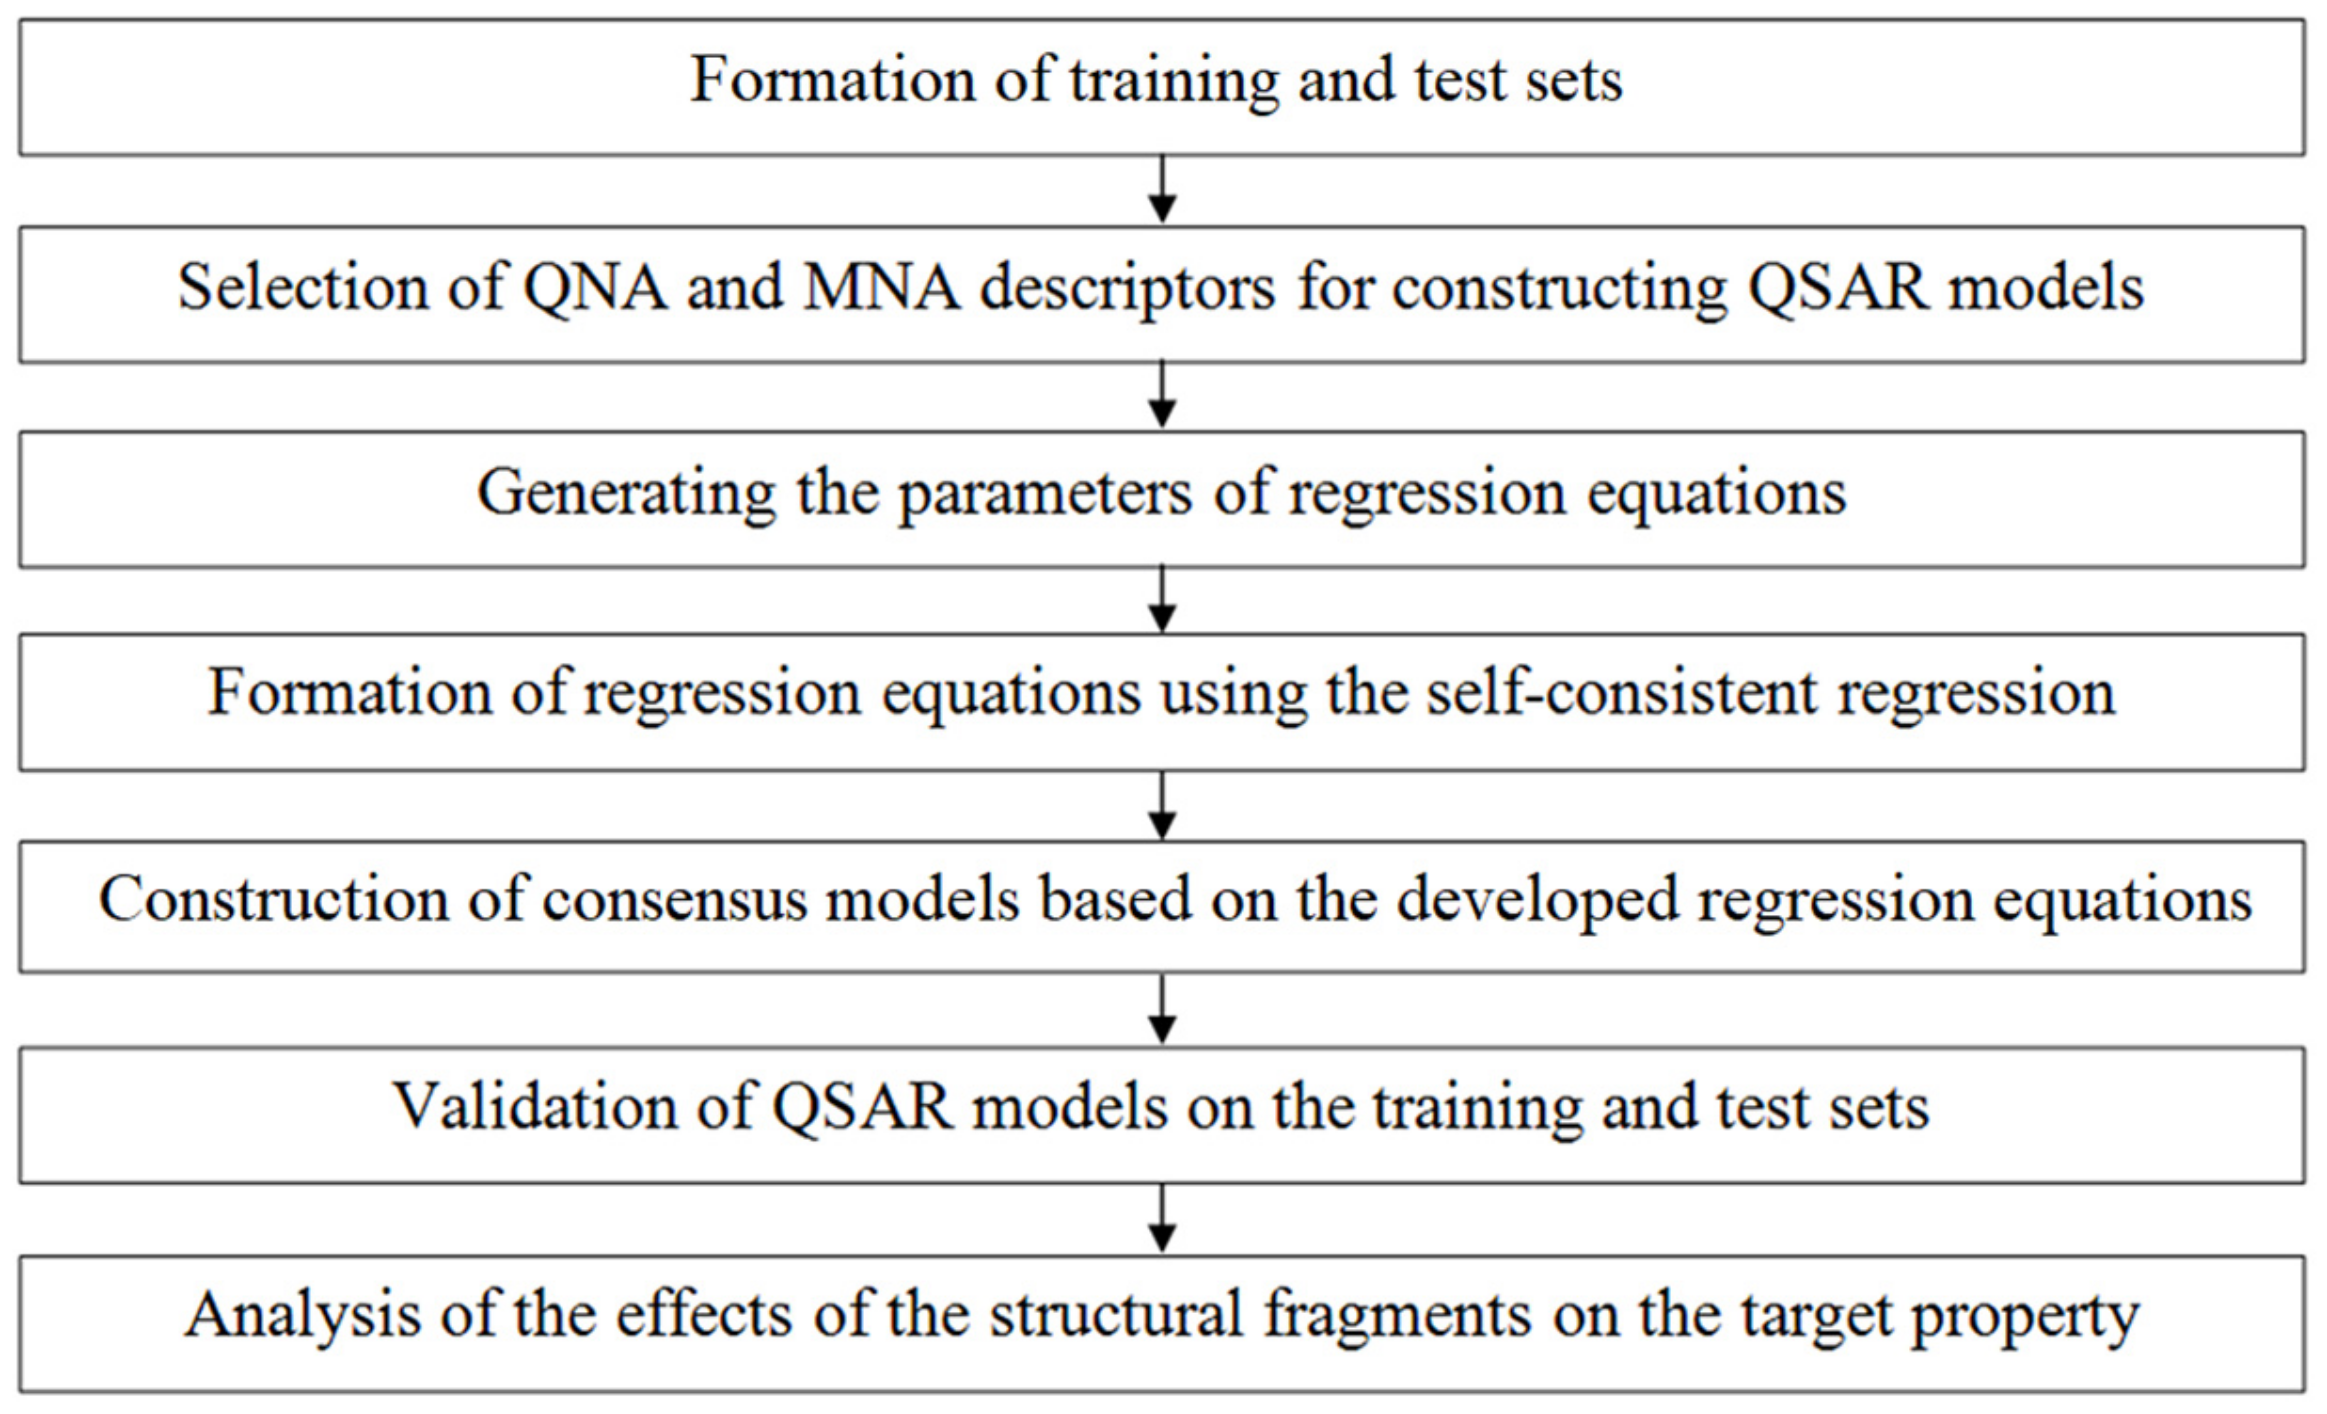
2.1. Computational Methodology
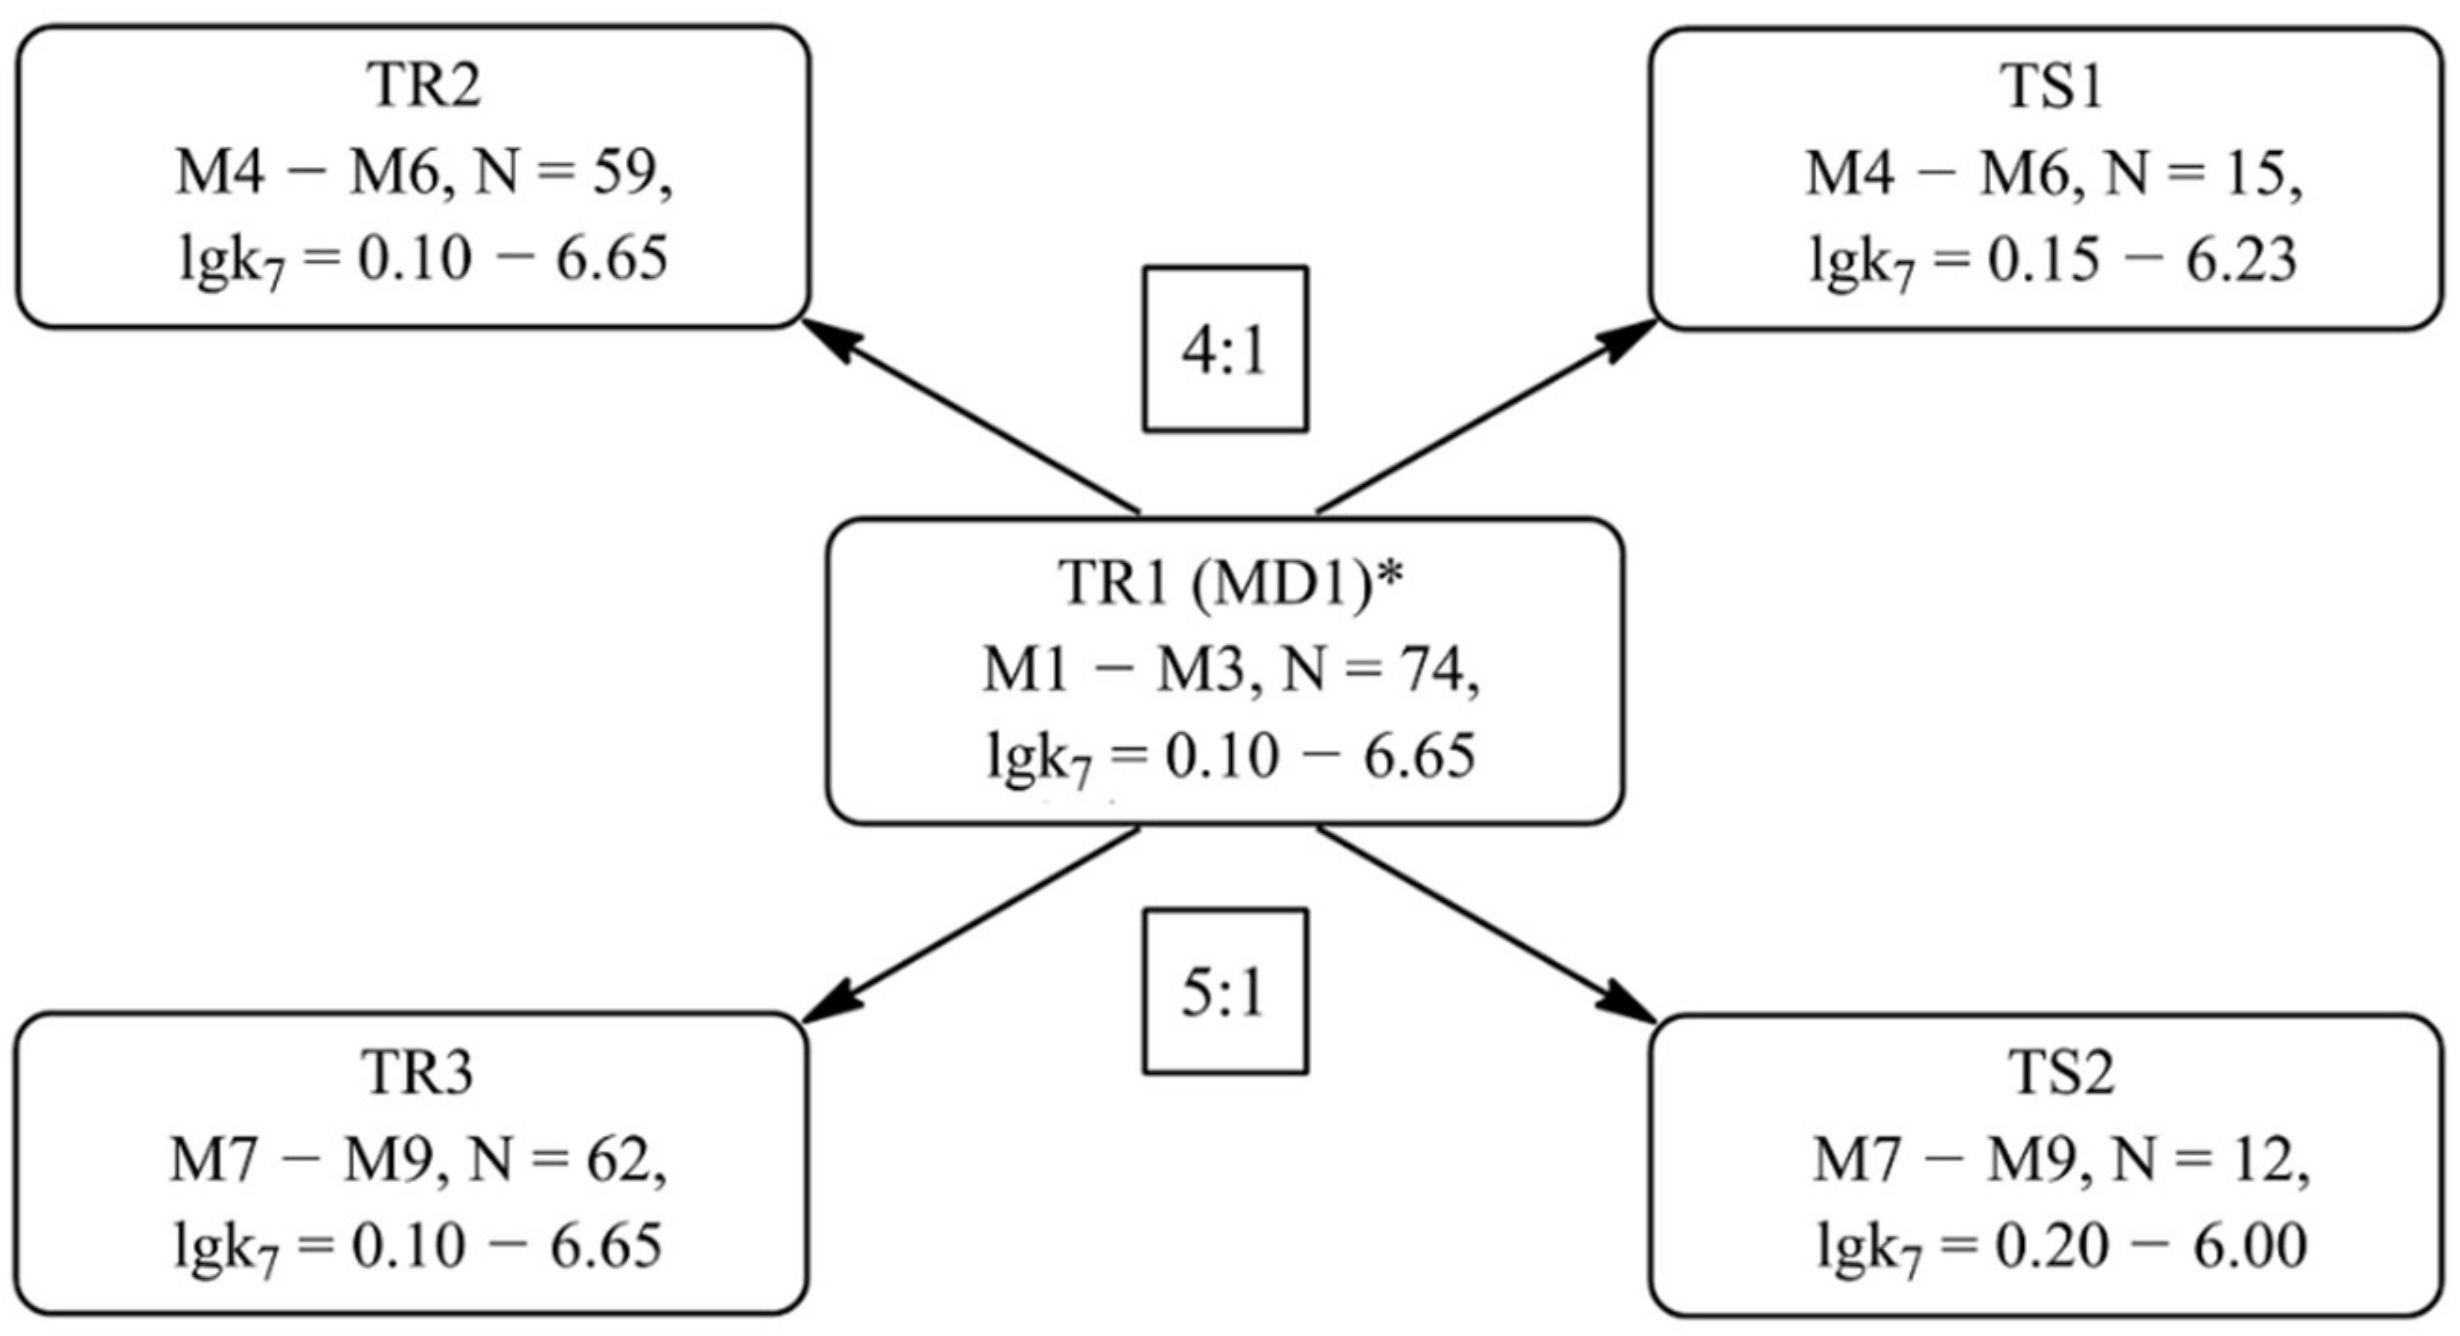
Formation of Training and Test Sets
2.2. QSAR Model Development
- zero-level MNA descriptor for each atom is the mark A of the atom itself;
- any next-level MNA descriptor for the atom is the substructure notation A (D1D2…Di…), where Di is the previous-level MNA descriptor for i–th immediate neighbor of the atom A.
- (1)
- Selecting descriptors using the SCR method. This is a regularized method of the least squares. Independent parameters a are calculated in this method according to the Equation (4) [43]:where a is the regression coefficient, n is the number of objects, yi is the response value of the i-th object, m is the number of independent variables, xik is the value of the k-th independent variable of the i-th object, ak is the k-th value of the regression coefficients, and vk is the k-th value of the regularization parameters. Equation (4) has the following solution:where XT is the transposed regression matrix X, and V is the diagonal matrix of the regularization parameters. The regression coefficients obtained from the SCR reflect the contribution of each particular descriptor (variable) to the final equation. The higher the absolute value of the coefficient, the greater its contribution. Thus, the regression coefficients obtained after the SCR can be used to weight the descriptors (variables) depending on their importance.
- (2)
- Calculating the radial basis functions using the weighted coefficient of SCR as a criterion of similarity. The RBF-SCR method can be expressed as [39]:where a is taken from Equation (4).The weights w are calculated as:
- (3)
- Calculating the weighting coefficients RBF by the least squares.
2.3. Assessment of the Descriptive and Predictive Ability of QSAR Models
3. Results and Discussion
- (1)
- determination coefficients R2, R20, R2′0, Q2F1, Q2F2 and CCC criterion are close to each other and tend to unity;
- (2)
- R2m > 0.5 if ΔR2m < 0.2;
- (3)
- MAE value does not exceed 10% of the Δlgk7 interval of the compounds from TRi;
- (4)
- the sum MAE + 3·S.D. does not exceed 20% of the Δlgk7 interval of the compounds from TRi.
- (1)
- determination coefficients R2, R20, R2′0, Q2F1, Q2F2 and CCC criterion do not exceed the threshold value equal to 0.6;
- (2)
- R2m ≤ 0.5 if ΔR2m ≤ 0.2;
- (3)
- MAE value is higher than 15% of the Δlgk7 interval of the compounds from TRi;
- (4)
- the sum MAE + 3·S.D. is larger than 25% of the Δlgk7 interval of the compounds from TRi.
4. Conclusions
Supplementary Materials
Author Contributions
Funding
Data Availability Statement
Conflicts of Interest
References
- Kirschweng, B.; Tátraaljai, D.; Földes, E.; Pukanszky, B. Natural antioxidants as stabilizers for polymers. J. Polym. Degrad. Stab. 2017, 145, 25–40. [Google Scholar] [CrossRef] [Green Version]
- Aguilar, G.; Mazzamaro, G.; Rasberger, M. Oxidative Degradation and Stabilisation of Mineral Oil-Based Lubricants. In Chemistry and Technology of Lubricants, 3rd ed.; Mortier, R.M., Fox, M., Orszulik, S.T., Eds.; Springer: Dordrecht, The Netherlands, 2010; pp. 107–152. [Google Scholar] [CrossRef] [Green Version]
- Rasberger, M. Oxidative degradation and stabilisation of mineral oil based lubricants. In Chemistry and Technology of Lubricants; Mortier, R.M., Orszulik, S.T., Eds.; Springer: Dordrecht, The Netherlands, 1997; pp. 98–143. [Google Scholar] [CrossRef]
- Hamblin, P. Oxidative stabilisation of synthetic fluids and vegetable oils. J. Synth. Lubr. 1999, 16, 157–181. [Google Scholar] [CrossRef]
- Denisov, E.T.; Denisova, T.G. The reactivity of natural phenols. Russ. Chem. Rev. 2009, 78, 1147–1173. [Google Scholar] [CrossRef]
- Akers, M.J. Drug stabilization against oxidative degradation. J. Chem. Educ. 1985, 62, 325–327. [Google Scholar] [CrossRef]
- Celestino, M.T.; Magalhães, U.D.O.; Fraga, A.G.M.; Carmo, F.A.D.; Lione, V.; Castro, H.C.; Sousa, V.P.d.; Rodrigues, C.R.; Cabral, L.M. Rational use of antioxidants in solid oral pharmaceutical preparations. J. Pharm. Sci. 2012, 48, 405–415. [Google Scholar] [CrossRef] [Green Version]
- Chakrabarti, P.K.; Harindran, J.; Saraf, P.G.; Wamburkar, M.N.; Naik, S.R. Role of new Antioxidants in the Stabilization of Ophthalmic and ear Dosage form Preparation of Hamycin. J. Drug Dev. Ind. Pharm. 1993, 19, 2595–2609. [Google Scholar] [CrossRef]
- Russo, G.L.; Tedesco, I.; Spagnuolo, C.; Russo, M. Antioxidant polyphenols in cancer treatment: Friend, foe or foil? Semin. Cancer Biol. 2017, 46, 1–13. [Google Scholar] [CrossRef]
- Servili, M.; Sordini, B.; Esposto, S.; Urbani, S.; Veneziani, G.; Di Maio, I.; Selvaggini, R.; Taticchi, A. Biological Activities of Phenolic Compounds of Extra Virgin Olive Oil. J. Antiox. 2014, 3, 1–23. [Google Scholar] [CrossRef] [Green Version]
- Fuchs-Tarlovsky, V. Role of antioxidants in cancer therapy. J. Nutr. 2013, 29, 15–21. [Google Scholar] [CrossRef]
- White, P.; Oliveira, R.; Oliveira, A.; Serafini, M.; Araújo, A.; Gelain, D.; Moreira, J.; Almeida, J.; Quintans, J.; Quintans-Junior, L.; et al. Antioxidant Activity and Mechanisms of Action of Natural Compounds Isolated from Lichens: A Systematic Review. J. Mol. 2014, 19, 14496–14527. [Google Scholar] [CrossRef]
- Kahl, R.; Hildebrandt, A.G. Methodology for studying antioxidant activity and mechanisms of action of antioxidants. J. Food Chem. Toxic. 1986, 24, 1007–1014. [Google Scholar] [CrossRef]
- Denisov, E.T.; Afanas’ev, I.B. (Eds.) Oxidation and Antioxidants in Organic Chemstry and Biology. In Chemisrty/Organic Chemistry; CRC Press: Boca Raton, FL, USA, 2005; p. 992. [Google Scholar]
- Alam, M.N.; Bristi, N.J.; Rafiquzzaman, M. Review on in vivo and in vitro methods evaluation of antioxidant activity. Saudi Pharm. J. 2013, 21, 143–152. [Google Scholar] [CrossRef] [PubMed] [Green Version]
- Anthony, K.; Saleh, M. Free Radical Scavenging and Antioxidant Activities of Silymarin Components. J. Antiox. 2013, 2, 398–407. [Google Scholar] [CrossRef] [PubMed] [Green Version]
- Nimse, S.B.; Pal, D. Free radicals, natural antioxidants, and their reaction mechanisms. J. RSC Adv. 2015, 5, 27986–28006. [Google Scholar] [CrossRef] [Green Version]
- Apak, R.; Özyürek, M.; Guclu, K.; Capanoglu, E. Antioxidant Activity/Capacity Measurement. 1. Classification, Physicochemical Principles, Mechanisms, and Electron Transfer (ET)-Based Assays. J. Agric. Food. Chem. 2016, 64, 997–1027. [Google Scholar] [CrossRef] [PubMed]
- Pisoschi, A.M.; Negulescu, G.P. Methods for Total Antioxidant Activity Determination. Biochem. Anal. Biochem. 2015, 1, 1–10. [Google Scholar] [CrossRef] [Green Version]
- Prior, R.L.; Wu, X.; Schaich, K. Standardized Methods for the Determination of Antioxidant Capacity and Phenolics in Foods and Dietary Supplements. J. Agric. Food. Chem. 2005, 53, 4290–4302. [Google Scholar] [CrossRef]
- Khajehnasiri, F.; Mortazavi, S.B.; Allameh, A.; Akhondzadeh, S.; Hashemi, H. Total antioxidant capacity and malondialdehyde in depressive rotational shift workers. J Environ. Public. Health. 2013, 2013, 150693. [Google Scholar] [CrossRef] [Green Version]
- Aliahmat, N.S.; Noor, M.R.; Yusof, W.J.; Makpol, S.; Ngah, W.Z.; Yusof, Y.A. Antioxidant enzyme activity and malondialdehyde levels can be modulated by Piper betle, tocotrienol rich fraction and Chlorella vulgaris in aging C57BL/6 mice. J. Clin. 2012, 67, 1447–1454. [Google Scholar] [CrossRef]
- Heim, K.E.; Tagliaferro, A.R.; Bobilya, D.J. Flavonoid antioxidants: Chemistry, metabolism and structure-activity relationships. J. Nutr. Biochem. 2002, 13, 572–584. [Google Scholar] [CrossRef]
- Cao, G.; Sofic, E.; Prior, R.L. Antioxidant and prooxidant behavior of flavonoids: Structure-activity relationships. J. Free Radic. Biol. Med. 1997, 22, 749–760. [Google Scholar] [CrossRef]
- Dugas, A.J.; Castañeda-Acosta, J.; Bonin, G.C.; Price, K.L.; Fischer, N.H.; Winston, G.W. Evaluation of the Total Peroxyl Radical-Scavenging Capacity of Flavonoids: Structure−Activity Relationships. J. Nat. Prod. 2000, 63, 327–331. [Google Scholar] [CrossRef] [PubMed]
- Kumar, S.; Pandey, A.K. Chemistry and Biological Activities of Flavonoids: An Overview. Sci. World J. 2013, 162750. [Google Scholar] [CrossRef] [PubMed] [Green Version]
- Denisov, E.T.; Denisova, T.G. (Eds.) Handbook of Antioxidants: Bond Dissociation Energies, Rate Constants, Activation Energies, and Enthalpies of Reactions. In Chemisrty/Thermodynamics; CRC Press: Boca Raton, FL, USA, 1999; p. 312. [Google Scholar]
- Al-Sehemi, A.G.; Irfan, A. Effect of donor and acceptor groups on radical scavenging activity of phenol by density functional theory. Arab. J. Chem. 2017, 10, 1703–1710. [Google Scholar] [CrossRef] [Green Version]
- Kajiyama, T.; Ohkatsu, Y. Effect of para-substituents of phenolic antioxidants. J. Polym. Degrad. Stab. 2001, 71, 445–452. [Google Scholar] [CrossRef]
- Cheng, Z.; Ren, J.; Li, Y.; Chang, W.; Chen, Z. Phenolic antioxidants: Electrochemical behavior and the mechanistic elements underlying their anodic oxidation reaction. Redox Rep. 2002, 7, 395–402. [Google Scholar] [CrossRef]
- Vedernikova, I.; Tollenaere, J.P.; Haemers, A. Quantum mechanical evaluation of the anodic oxidation of phenolic compounds. JPOC 1999, 12, 144–150. [Google Scholar] [CrossRef]
- Anouar, E. A Quantum Chemical and Statistical Study of Phenolic Schiff Bases with Antioxidant Activity against DPPH Free Radical. J. Antiox. 2014, 3, 309–322. [Google Scholar] [CrossRef] [Green Version]
- Lakkadi, A.; Vuppala, S.; Tigulla, P. Novel in vitro antioxidant estimation of phenolic compounds and molecular modeling studies. Int. Res. J. Pharm. 2013, 2, 148–152. [Google Scholar] [CrossRef]
- Hoelz, L.V.B.; Horta, B.A.C.; Araújo, J.Q.; Albuquerque, M.G.; Alencastro, R.B.d.; da Silva, J.F.M. Quantitative structure-activity relationships of antioxidant phenolic compounds. J. Chem. Pharm. Res. 2010, 2, 291–306. [Google Scholar]
- Khairullina, V.R.; Gerchikov, A.J.; Lagunin, A.A.; Zarudii, F.S. QSAR Modelling of Thymidylate Synthase Inhibitors in a Series of Quinazoline Derivatives. Pharm. Chem. J. 2018, 51, 884–888. [Google Scholar] [CrossRef]
- Khairullina, V.R.; Gimadieva, A.R.; Gerchikov, A.Y.; Mustafin, A.G.; Zaarudii, F.S. Quantitative structure–activity relationship of the thymidylate synthase inhibitors of Mus musculus in the series of quinazolin-4-one and quinazolin-4-imine derivatives. J. Mol. Graph. Modell. 2018, 85, 198–211. [Google Scholar] [CrossRef] [PubMed]
- Zakharov, A.V.; Lagunin, A.A.; Filimonov, D.A.; Poroikov, V.V. Quantitative prediction of antitarget interaction profiles for chemical compounds. J. Chem. Res. Toxicol. 2012, 25, 2378–2385. [Google Scholar] [CrossRef] [PubMed] [Green Version]
- Taipov, I.A.; Khayrullina, V.R.; Khoma, V.K.; Gerchikov, A.J.; Zarudiy, F.S.; Bege, K. Virtual screening in the row of effective inhibitor of catalytic activity-A4-hydrolase. J. Vestn. Bashkir. Univ. 2012, 17, 886–891. [Google Scholar]
- Zakharov, A.V.; Peach, M.L.; Sitzmann, M.; Nicklaus, M.C. A New Approach to Radial basis function approximation and Its application to QSAR. J. Chem. Inf. Model. 2014, 54, 713–719. [Google Scholar] [CrossRef] [PubMed]
- Lagunin, A.A.; Geronikaki, A.; Eleftheriou, P.; Pogodin, P.V. Rational Use of Heterogeneous Data in Quantitative Structure-Activity Relationship (QSAR) Modeling of Cyclooxygenase/Lipoxygenase Inhibitors. J. Chem. Inf. Model. 2019, 59, 713–730. [Google Scholar] [CrossRef] [PubMed]
- Lagunin, A.A.; Romanova, M.A.; Zadorozhny, A.D.; Kurilenko, N.S.; Shilov, B.V.; Pogodin, P.V.; Ivanov, S.M.; Filimonov, D.A.; Poroikov, V.V. Comparison of Quantitative and Qualitative (Q)SAR Models Created for the Prediction of Ki and IC50 Values of Antitarget Ingibitors. J. Front. Pharmacol. 2018, 9, 1136. [Google Scholar] [CrossRef]
- Khayrullina, V.R.; Gerchikov, A.Y.; Lagunin, A.A.; Zarudii, F.S. Quantitative Analysis of Structure−Activity Relationships of Tetrahydro-2H-isoindole Cyclooxygenase-2 Inhibitors. J. Biokhimiya 2015, 80, 74–86. [Google Scholar] [CrossRef]
- Khairullina, V.R.; Akbasheva, Y.Z.; Gimadieva, A.R.; Mustafin, A.G. Analysis of the relationship «structure-activity» in theseries of certain 5-ethyluridine derivatives with pronounced anti-herpetic activity. J. Vestnik Bashk. Univ. 2017, 22, 960–965. [Google Scholar]
- Martynova, Y.Z.; Khairullina, V.R.; Nasretdinova, R.N.; Garifullina, G.G.; Mitsukova, D.S.; Gerchikov, A.Y.; Mustafin, A.G. Determination of the chain termination rate constants of the radical chain oxidation of organic compounds on antioxidant molecules by the QSPR method. J. Russ. Chem. Bull. 2019, 69, 1679–1691. [Google Scholar] [CrossRef]
- Filimonov, D.A.; Zakharov, A.V.; Lagunin, A.A.; Poroikov, V.V. QNA based “Star Track” QSAR approach. SAR QSAR Environ. J. Resolut. 2009, 20, 679–709. [Google Scholar] [CrossRef] [PubMed]
- Lagunin, A.; Zakharov, A.; Filimonov, D.; Poroikov, V. QSAR Modelling of Rat Acute Toxicity on the Basis of PASS Prediction. J. Mol. Inf. 2011, 30, 241–250. [Google Scholar] [CrossRef]
- Roy, K.; Mitra, I.; Kar, S.; Ojha, P.K.; Das, R.N.; Kabir, H. Comparative Studies on Some Metrics for External Validation of QSPR Models. J. Chem. Inf. Model. 2012, 52, 396–408. [Google Scholar] [CrossRef] [PubMed]
- Denisov, E.T. Konstanty Skorosti Gomoliticheskih Zhidkofaznyh Reakcij; Nauka: Moscow, Russia, 1971; p. 711. [Google Scholar]
- Emanuehl, N.M.; Denisov, E.T.; Majzus, Z.K. Liquid-Phase Oxidation of Hidrocarbons; Plenum Press: New York, NY, USA, 1967; p. 350. [Google Scholar]
- Chihara, H.; Nakamura, N.; Hellwege, K.H.; Hellwege, A.M. Numerical Data and Functional Relationships in Science and Technology: New Series. In Landolt-Boernstein; Chihara, H., Nakamura, N., Hellwege, K.H., Hellwege, A.M., Eds.; Springer: Berlin, Germany, 1993; Volume 13, pp. 1984–1985. [Google Scholar]
- MarvinSketch. Available online: https://chemaxon.com/download/marvin-suite (accessed on 14 December 2020).
- DiscoveryStudioVisualiser. Available online: https://www.3ds.com (accessed on 14 December 2020).
- Dearden, J.C.; Cronin, M.T.D.; Kaiser, K.L.E. How not to develop a quantitative structure-activity or structure-property relationship (QSAR/QSPR). J. SAR QSAR Environ. Res. 2009, 20, 241–266. [Google Scholar] [CrossRef] [PubMed]
- Alov, P.; Tsakovska, I.; Pajeva, I. Computational Studies of Free Radical-Scavenging Properties of Phenolic Compounds. Curr. Top. Med. Chem. 2015, 15, 85–104. [Google Scholar] [CrossRef] [PubMed] [Green Version]
- Gramatica, P.; Sangion, A. A Historical Excursus on the Statistical Validation Parameters for QSAR Models: A Clarification Concerning Metrics and Terminology. J. Chem. Inform. Model. 2016, 56, 1127–1131. [Google Scholar] [CrossRef]
- Consonni, V.; Ballabio, D.; Todeschini, R. Evaluation of model predictive ability by external validation techniques. J. Chemom. 2010, 24, 194–201. [Google Scholar] [CrossRef]
- Chirico, N.; Gramatica, P. Real External Predictivity of QSAR Models: How to Evaluate It? Comparisonof Different Validation Criteria and Proposal of Using the Concordance Correlation Coefficient. J. Chem. Inform. Model. 2011, 51, 2320–2335. [Google Scholar] [CrossRef]
- Roy, P.P.; Paul, S.; Mitra, I.; Roy, K. On Two Novel Parameters for Validation of Predictive QSAR Models. Molecules 2009, 14, 1660–1701. [Google Scholar] [CrossRef]
- Roy, K.; Das, R.N.; Ambure, P.; Aher, R.B. Be aware of error measures. Further studies on validation of predictive QSAR models. J. Chemom. Intell. Lab. Syst. 2016, 152, 18–33. [Google Scholar] [CrossRef]
- Xternal Validation Plus. Available online: https://sites.google.com/site/dtclabxvplus (accessed on 14 December 2020).
- Roginskij, V.A. Fenol’nye antioksidanty: Reaktsionnaya sposobnost’ i effektivnost’ In Institut Himicheskoj Fiziki AN SSSR; Nauka: Moscow, Russia, 1988; p. 246. [Google Scholar]
- Roginsky, V.; Lissi, E.A. Review of methods to determine chainbreaking antioxidant activity in food. J. Food Chem. 2005, 92, 235–254. [Google Scholar] [CrossRef]
- Khairullina, V.R.; Gerchikov, A.Y.; Urazaeva, Y.R.; Savchenko, R.G.; Odinokov, V.N. Antioxidant Properties of Conjugates of 20-Hydroxyecdysone Derivatives with a Polysubstituted Chromanylaldehyde. J. Kinet. Catal. 2010, 51, 502–506. [Google Scholar] [CrossRef]
- Khairullina, V.R.; Gerchikov, A.Y.; Safarova, A.B.; Khalitova, R.R.; Spivak, A.Y.; Shakurova, E.R.; Odinokov, V.N. Antioxidant Properties of Conjugates of Triterpenic Acids with Amido Derivatives of Trolox. J. Kinet. Catal. 2011, 52, 186–191. [Google Scholar] [CrossRef]
- Khayrullina, V.R.; Gerchikov, A.J.; Ilina, E.A.; Drevko, J.B.; Isaeva, A.Y.; Drevko, B.I. Antioxidant properties of some 7,8-benzo-5,6-dihydro(4H)selenochromene derivaties. J. Kinet. Catal. 2013, 54, 14–17. [Google Scholar] [CrossRef]
- Koltsov, N.I.; Ushmarin, N.F.; Petrov, A.E.; Petrov, N.P.; Petrov, N.N.; Verhunov, S.M. Research of influence of technological additives on properties of rubbers on the basis of BNR new generation. Part 3. Novantox 8 PFDA. J. Butlerov Commun. 2010, 21, 22–28. [Google Scholar]
- Martynova, Y.Z.; Khairullina, V.R.; Gimadieva, A.R.; Mustafin, A.G. QSAR-Modeling of desoxyuridine triphosphatase inhibitors in a series of some derivatives of uracil. J. Biomed. Chem. 2019, 65, 103–113. [Google Scholar] [CrossRef] [Green Version]
- Martynova, Y.Z.; Khairullina, V.R.; Biglova, Y.N.; Mustafin, A.G. Quantitative structure-property relationship modeling of the C60 fullerene derivatives as electron acceptors of polymer solar cells: Elucidating the functional groups critical for device performance. J. Mol. Graph. Model. 2019, 88, 49–61. [Google Scholar] [CrossRef]


| Value | Designation of TRi | Code of the Set | ||
|---|---|---|---|---|
| TR1 | TR2 | TR3 | ||
| Number of compounds | N | 74 | 59 | 62 |
| Mean value of lgk7 | 3.3750 | |||
| Spread of lgk7 | Δlgk7 | 6.5500 | ||
| Distribution of the observed response values of training sets TRi around training mean (in %) | (%) | 20.2703 | 20.0000 | 16.6667 |
| (%) | 50.0000 | 46.6667 | 50.0000 | |
| (%) | 72.9730 | 73.3333 | 75.0000 | |
| (%) | 83.7838 | 80.0000 | 83.3333 | |
| 0.10 × Δlgk7 | 0.6550 | |||
| 0.15 × Δlgk7 | 0.9825 | |||
| 0.20 × Δlgk7 | 1.3100 | |||
| 0.25 × Δlgk7 | 1.6375 | |||
| Value | Designation of TSi | Code of the Set | |
|---|---|---|---|
| TS1 | TS2 | ||
| Number of compounds | N | 15 | 12 |
| Mean value of lgk7 | 4.1727 | 4.0821 | |
| Spread of lgk7 | Δlgk7 | 6.0800 | 5.8000 |
| Distribution of the observed response values of test sets TSi around test mean (in %) | (%) | 53.3333 | 50.0000 |
| (%) | 73.3333 | 75.0000 | |
| (%) | 86.6667 | 83.3333 | |
| (%) | 86.6667 | 91.6667 | |
| Distribution of the observed response values of test sets TSi around train mean (in %) | (%) | 20.0000 | 16.6667 |
| (%) | 46.6667 | 50.0000 | |
| (%) | 73.3333 | 75.0000 | |
| (%) | 80.0000 | 83.3333 | |
| Training Set | Model | N | NPM | V | ||||
|---|---|---|---|---|---|---|---|---|
| QSAR Models Based on the QNA Descriptors | ||||||||
| TR1 | M1 | 74 | 20 | 0.999 | 10.457 | 0.525 | 0.843 | 22 |
| TR2 | M4 | 59 | 20 | 0.999 | 7.676 | 0.587 | 0.799 | 18 |
| TR3 | M7 | 62 | 20 | 0.999 | 6.059 | 0.544 | 0.829 | 24 |
| QSAR Models Based on the MNA Descriptors | ||||||||
| TR1 | M2 | 74 | 20 | 0.999 | 18.207 | 0.478 | 0.867 | 18 |
| TR2 | M5 | 59 | 20 | 0.998 | 11.554 | 0.556 | 0.819 | 15 |
| TR3 | M8 | 62 | 20 | 0.999 | 9.864 | 0.567 | 0.810 | 17 |
| QSAR Models Based on Both QNA and MNA Descriptors | ||||||||
| TR1 | M3 | 74 | 100 | 0.999 | 10.744 | 0.490 | 0.872 | 22 |
| TR2 | M6 | 59 | 100 | 0.999 | 7.768 | 0.559 | 0.830 | 18 |
| TR3 | M9 | 62 | 100 | 0.999 | 7.011 | 0.535 | 0.845 | 21 |
| Comments | Prediction Parameters | QSAR Model Used for Predicting lgk7 | ||||||||
|---|---|---|---|---|---|---|---|---|---|---|
| TR1 | TR2 | TR3 | ||||||||
| M1 | M2 | M3 | M4 | M5 | M6 | M7 | M8 | M9 | ||
| Classical Metrics (100% data) | R2 | 0.9894 | 0.9922 | 0.9923 | 0.9878 | 0.9897 | 0.9899 | 0.9888 | 0.9902 | 0.9893 |
| R20 | 0.9887 | 0.9906 | 0.9894 | 0.9869 | 0.9888 | 0.9876 | 0.9876 | 0.9890 | 0.9871 | |
| R2′0 | 0.9878 | 0.9899 | 0.9881 | 0.9860 | 0.9881 | 0.9863 | 0.9866 | 0.9882 | 0.9856 | |
| 0.9538 | 0.9568 | 0.9387 | 0.9520 | 0.9550 | 0.9369 | 0.9493 | 0.9514 | 0.9357 | ||
| ΔR2m | 0.0120 | 0.0101 | 0.0115 | 0.0128 | 0.0109 | 0.0123 | 0.0122 | 0.0108 | 0.0129 | |
| CCC | 0.9947 | 0.996 | 0.9952 | 0.9929 | 0.9942 | 0.9934 | 0.9932 | 0.9942 | 0.9930 | |
| Classical Metrics (after removing 5% data with high residuals) | R2 | 0.9917 | 0.9939 | 0.9936 | 0.9899 | 0.9921 | 0.9918 | 0.9922 | 0.9936 | 0.9928 |
| R20 | 0.9911 | 0.9932 | 0.9918 | 0.9893 | 0.9914 | 0.9900 | 0.9917 | 0.9931 | 0.9913 | |
| R2′0 | 0.9571 | 0.9589 | 0.9420 | 0.9553 | 0.9571 | 0.9402 | 0.9628 | 0.9648 | 0.9467 | |
| 0.9624 | 0.9632 | 0.9470 | 0.9606 | 0.9614 | 0.9452 | 0.9670 | 0.9683 | 0.9511 | ||
| ΔR2m | 0.0094 | 0.0074 | 0.0089 | 0.0104 | 0.0084 | 0.0099 | 0.0080 | 0.0067 | 0.0085 | |
| CCC | 0.9962 | 0.9973 | 0.9965 | 0.9944 | 0.9955 | 0.9947 | 0.9956 | 0.9962 | 0.9954 | |
| Mean absolute error and standard deviation for test set (100% data) | RMSE | 0.1341 | 0.1195 | 0.1277 | 0.1518 | 0.1372 | 0.1454 | 0.1466 | 0.1364 | 0.1486 |
| MAE | 0.1014 | 0.0894 | 0.0997 | 0.1132 | 0.1012 | 0.1115 | 0.1060 | 0.0976 | 0.1103 | |
| S.D. | 0.0920 | 0.0834 | 0.0841 | 0.1020 | 0.0934 | 0.0941 | 0.1021 | 0.0960 | 0.1004 | |
| MAE+3·S.D. | 0.3774 | 0.3396 | 0.3520 | 0.4192 | 0.3814 | 0.3938 | 0.4123 | 0.3856 | 0.4115 | |
| Mean absolute error and standard deviation for test set (after removing 5% data with high residuals) | RMSE | 0.1284 | 0.1192 | 0.1247 | 0.1326 | 0.1234 | 0.1289 | 0.1180 | 0.1095 | 0.1203 |
| MAE | 0.0982 | 0.0889 | 0.099 | 0.1003 | 0.0910 | 0.1003 | 0.0887 | 0.0812 | 0.0936 | |
| S.D. | 0.0853 | 0.0821 | 0.0795 | 0.0874 | 0.0842 | 0.0816 | 0.0785 | 0.0741 | 0.0762 | |
| MAE+3·S.D. | 0.3541 | 0.3352 | 0.3375 | 0.3627 | 0.3436 | 0.3453 | 0.3241 | 0.3036 | 0.3222 | |
| Distribution of prediction errors (in %) | ωN in range 0.10 × Δlgk7 (TR) | 0.000 a | 0.000 a | 0.000 a | 0.000 b | 0.000 b | 0.000 b | 0.000 c | 0.000 c | 0.000 c |
| ωN in range 0.15 × Δlgk7 (TR) | 0.000 a | 0.000 a | 0.000 a | 0.000 b | 0.000 b | 0.000 b | 0.000 c | 0.000 c | 0.000 c | |
| ωN in range 0.20 × Δlgk7 (TR) | 0.000 a | 0.000 a | 0.000 a | 0.000 b | 0.000 b | 0.000 b | 0.000 c | 0.000 c | 0.000 c | |
| ωN in range 0.25 × Δlgk7 (TR) | 0.000 a | 0.000 a | 0.000 a | 0.000 b | 0.000 b | 0.000 b | 0.000 c | 0.000 c | 0.000 c | |
| Prediction quality | - | Good | ||||||||
| Systematic error presence | - | Absent | ||||||||
| Comments | Prediction Parameters | QSAR Model Used for Predicting lgk7 | |||||
|---|---|---|---|---|---|---|---|
| TS1 | TS2 | ||||||
| M4 | M5 | M6 | M7 | M8 | M9 | ||
| Classical Metrics (100% data) | R2 | 0.9469 | 0.9461 | 0.9388 | 0.8639 | 0.8797 | 0.8876 |
| R20 | 0.9360 | 0.9423 | 0.9260 | 0.8638 | 0.8769 | 0.8737 | |
| R2′0 | 0.9164 | 0.9312 | 0.9005 | 0.8413 | 0.8454 | 0.8184 | |
| Q2F1 | 0.9531 | 0.9579 | 0.9454 | 0.8931 | 0.9031 | 0.9006 | |
| Q2F2 | 0.9357 | 0.9423 | 0.9251 | 0.8638 | 0.8766 | 0.8734 | |
| 0.8152 | 0.8592 | 0.7941 | 0.7951 | 0.7754 | 0.7188 | ||
| ΔR2m | 0.0663 | 0.0570 | 0.0771 | 0.1208 | 0.1155 | 0.1285 | |
| CCC | 0.9634 | 0.9686 | 0.9566 | 0.9263 | 0.9306 | 0.9254 | |
| Classical Metrics (after removing 5% data with high residuals) | R2 | 0.9710 | 0.9715 | 0.9659 | 0.8846 | 0.9106 | 0.9046 |
| R20 | 0.9643 | 0.9700 | 0.9575 | 0.8840 | 0.9100 | 0.8963 | |
| R2′0 | 0.8550 | 0.9051 | 0.8334 | 0.8045 | 0.8043 | 0.7186 | |
| Q2F1 | 0.9731 | 0.9784 | 0.9670 | 0.8959 | 0.9197 | 0.9038 | |
| Q2F2 | 0.9610 | 0.9687 | 0.9521 | 0.8778 | 0.9057 | 0.8870 | |
| 0.8739 | 0.9202 | 0.8562 | 0.8342 | 0.8455 | 0.7694 | ||
| ΔR2m | 0.0364 | 0.0292 | 0.0437 | 0.0607 | 0.0835 | 0.1035 | |
| CCC | 0.9783 | 0.9834 | 0.9729 | 0.9382 | 0.9505 | 0.9374 | |
| Mean absolute error and standard deviation for test set (100% data) | RMSE | 0.3318 | 0.3145 | 0.3581 | 0.4984 | 0.4744 | 0.4805 |
| MAE | 0.2664 | 0.2417 | 0.2843 | 0.4167 | 0.3748 | 0.4150 | |
| S.D. | 0.2048 | 0.2083 | 0.2254 | 0.2856 | 0.3038 | 0.2529 | |
| MAE + 3·S.D. | 0.8808 | 0.8666 | 0.9605 | 1.2735 | 1.2862 | 1.1737 | |
| Mean absolute error and standard deviation for test set (after removing 5% data with high residuals) | RMSE | 0.2598 | 0.2326 | 0.2878 | 0.4457 | 0.3914 | 0.4285 |
| MAE | 0.2254 | 0.1981 | 0.2422 | 0.3735 | 0.3172 | 0.3740 | |
| S.D. | 0.1342 | 0.1266 | 0.1613 | 0.2550 | 0.2404 | 0.2194 | |
| MAE + 3·S.D. | 0.6279 | 0.5778 | 0.7261 | 1.1385 | 1.0385 | 1.0322 | |
| Distribution of prediction errors (in %) | ωN in range 0.10 × Δlgk7 (TR) | 6.6667 a | 6.6667 a | 6.6667 a | 25.000 b | 25.000 b | 16.667 b |
| ωN in range 0.15 × Δlgk7 (TR) | 0.0000 a | 0.0000 a | 0.0000 a | 0.0000 b | 8.3333 b | 0.0000 b | |
| ωN in range 0.20 × Δlgk7 (TR) | 0.0000 a | 0.0000 a | 0.0000 a | 0.0000 b | 0.0000 b | 0.0000 b | |
| ωN in range 0.25 × Δlgk7 (TR) | 0.0000 a | 0.0000 a | 0.0000 a | 0.0000 b | 0.0000 b | 0.0000 b | |
| Prediction quality | - | Good | |||||
| Systematic error presence | - | Absent | |||||
| Model | Applicability (AD) | Predicted Value lgk7pred | Predicted value k7pred·10−5 (L·mol−1·s−1) |
|---|---|---|---|
| M3 | in AD | 5.3258 | 2.12 |
| M6 | in AD | 5.3252 | 2.12 |
| M9 | in AD | 5.5896 | 3.88 |
| [8-PPDA]·104 (M) | V0·106 (mol·L−1·s−1) |
|---|---|
| 0.000 | 4.700 |
| 0.200 | 2.480 |
| 0.403 | 0.801 |
| 0.805 | 0.481 |
| 1.610 | 0.191 |
Publisher’s Note: MDPI stays neutral with regard to jurisdictional claims in published maps and institutional affiliations. |
© 2021 by the authors. Licensee MDPI, Basel, Switzerland. This article is an open access article distributed under the terms and conditions of the Creative Commons Attribution (CC BY) license (http://creativecommons.org/licenses/by/4.0/).
Share and Cite
Khairullina, V.; Safarova, I.; Sharipova, G.; Martynova, Y.; Gerchikov, A. QSAR Assessing the Efficiency of Antioxidants in the Termination of Radical-Chain Oxidation Processes of Organic Compounds. Molecules 2021, 26, 421. https://doi.org/10.3390/molecules26020421
Khairullina V, Safarova I, Sharipova G, Martynova Y, Gerchikov A. QSAR Assessing the Efficiency of Antioxidants in the Termination of Radical-Chain Oxidation Processes of Organic Compounds. Molecules. 2021; 26(2):421. https://doi.org/10.3390/molecules26020421
Chicago/Turabian StyleKhairullina, Veronika, Irina Safarova, Gulnaz Sharipova, Yuliya Martynova, and Anatoly Gerchikov. 2021. "QSAR Assessing the Efficiency of Antioxidants in the Termination of Radical-Chain Oxidation Processes of Organic Compounds" Molecules 26, no. 2: 421. https://doi.org/10.3390/molecules26020421