Article

Targeted and Untargeted Metabolomic Analyses Reveal Organ Specificity of Specialized Metabolites in the Model Grass Brachypodium distachyon

by
Anna Piasecka
1,2,*,
Aneta Sawikowska
1,3,
Nicolas Jedrzejczak-Rey
1,
Mariola Piślewska-Bednarek
1 and
Paweł Bednarek
1,*
1
Institute of Bioorganic Chemistry, Polish Academy of Sciences, Noskowskiego 12/14, 61-704 Poznań, Poland
2
Institute of Plant Genetics, Polish Academy of Sciences, Strzeszyńska 34, 60-479 Poznań, Poland
3
Department of Mathematical and Statistical Methods, Poznań University of Life Sciences, Wojska Polskiego 28, 60-637 Poznań, Poland
*
Authors to whom correspondence should be addressed.
Molecules 2022, 27(18), 5956; https://doi.org/10.3390/molecules27185956
Submission received: 5 August 2022 / Revised: 2 September 2022 / Accepted: 3 September 2022 / Published: 13 September 2022

Abstract

:
Brachypodium distachyon, because of its fully sequenced genome, is frequently used as a model grass species. However, its metabolome, which constitutes an indispensable element of complex biological systems, remains poorly characterized. In this study, we conducted comprehensive, liquid chromatography-mass spectrometry (LC-MS)-based metabolomic examination of roots, leaves and spikes of Brachypodium Bd21 and Bd3-1 lines. Our pathway enrichment analysis emphasised the accumulation of specialized metabolites representing the flavonoid biosynthetic pathway in parallel with processes related to nucleotide, sugar and amino acid metabolism. Similarities in metabolite profiles between both lines were relatively high in roots and leaves while spikes showed higher metabolic variance within both accessions. In roots, differences between Bd21 and Bd3-1 lines were manifested primarily in diterpenoid metabolism, while differences within spikes and leaves concerned nucleotide metabolism and nitrogen management. Additionally, sulphate-containing metabolites differentiated Bd21 and Bd3-1 lines in spikes. Structural analysis based on MS fragmentation spectra enabled identification of 93 specialized metabolites. Among them phenylpropanoids and flavonoids derivatives were mainly determined. As compared with closely related barley and wheat species, metabolic profile of Brachypodium is characterized with presence of threonate derivatives of hydroxycinnamic acids.

Graphical Abstract

1. Introduction

Purple false brome (Brachypodium distachyon (L.) P. Beauv.; hereafter Brachypodium) is closely related to wheat and barley, making it potentially useful for functional genomics of these crops. Its main advantage as a model plant is the smallest genome found in the Poaceae family comprising five chromosomes spanning over 272 Mbp, in which about 25,000 protein-coding sequences are predicted [1]. In addition, Brachypodium is self-fertile and has a rapid life cycle of 8–10 weeks, depending on the environmental growth conditions [2]. A breakthrough point in Brachypodium research was the genome sequencing of accession Bd21 [3], which contributed to several genetic and genomic resources including Phytozome [4] and Gramene [5] and gave rise to initiatives like BrachyPan (Brachypodium pan-genome) [6]. Consequently, Brachypodium became an object of intense research in many fields serving in understanding interaction of grasses with viruses [7], bacteria [8], fungi [9] and invertebrates [10] as well as their responses to abiotic stresses [11].
Studies in Brachypodium included also metabolomic analyses that have been performed in different biological and physiological contexts. During these studies widely targeted metabolomic analysis has been used to compare the metabolomes of seeds and leaves of Bd21 and Bd3-1 accessions [12] and analysis of respective recombinant inbreed lines enabled identification of quantitative trait loci linked with variation of selected metabolites present in seeds [13]. It has also been shown that metabolomic data correlates with phenotypic variability within different Brachypodium species [14]. Correlation of metabolomic with proteomic or transcriptomic data enabled the comprehensive description of Brachypodium reaction to fungal infection [15] and drought [16,17]. Results of metabolomic analysis of Brachypodium in correlation with data on biomass production during drought served in building models for phenotype prediction [18]. Finally, differences in metabolomic response to drought between accessions inhibiting different ecological niches have been described [19]. However, despite these individual reports, the Brachypodium metabolome remains virtually unknown. This particularly concerns specialized metabolites, which in plants are involved in responses to environmental cues, including biotic and abiotic stressors. These compounds may play a role in signalling pathways, regulation of many bioprocesses, or directly deterring antibiotic agents [20]. Concerning these multifarious functions, studies of specialized metabolites are important for investigating the interactions of plants with the environment. Plants collectively produce a large and diverse array of these compounds [21]. Some groups of specialized metabolites have a very restricted distribution, i.e., they are often only found in taxonomically related genera or species. On the other hand, some classes of specialized metabolites, for example phenylpropanoids and flavonoids are conserved among plants. However, even in such cases particular end products of these pathways can be also limited to narrow sets of plant species [22]. Due to this high diversity of plant’s specialized metabolites and their limited occurrence, only a small portion of these compounds is known and covered in available metabolomics databases, which in turn significantly hampers analysis of plant metabolomes.
In this study, we used mass spectrometry (MS) techniques to shed more light on specialized metabolism of Brachypodium accessions Bd21 and Bd3-1. Both these lines originate from Iraq but reveal some differences in their morphology and development [23,24]. Particularly, Bd21 and Bd3-1 strongly differ in their root morphology and changes in root growth in response to low nitrogen and phosphorus supplies [25]. As indicated by earlier studies these two lines clearly differ in their resistance towards viruses [26,27] and fungi [28,29,30,31]. Bd3-1 was more resistant to Barley stripe mosaic virus as well as to Rhizoctonia solani and Puccinia emaculata fungi, while Bd21 appeared to be more resistant to Ramularia collo-cygni. Both lines have also different drought tolerance; Bd3-1 is better adopted than Bd21 to cope with this abiotic stress [17,32]. Unlike the earlier metabolomic studies in leaves and seeds of these accessions [12,13], we emphasised compound identification and extended the metabolite analysis to spikes and roots. Particularly this latter underground organ has been shown to significantly differ in specialized metabolite composition from the aerial parts in other plant species [33,34]. This could be also of particular interest regarding the differences between Bd21 and Bd3-1 root morphology [25], which suggests differences between the root metabolite profiles of these lines. Our unbiased metabolic approaches combined with pathway enrichment analysis revealed metabolic pathways that significantly differentiate analysed organs and accessions. In addition, detailed inspection of mass spectra obtained during MS/MS and MSn analyses of Brachypodium extracts combined with database and literature searches enabled preliminary identification of 93 specialized metabolites, mainly phenylpropanoids, produced by this model grass plant.

2. Results and Discussion

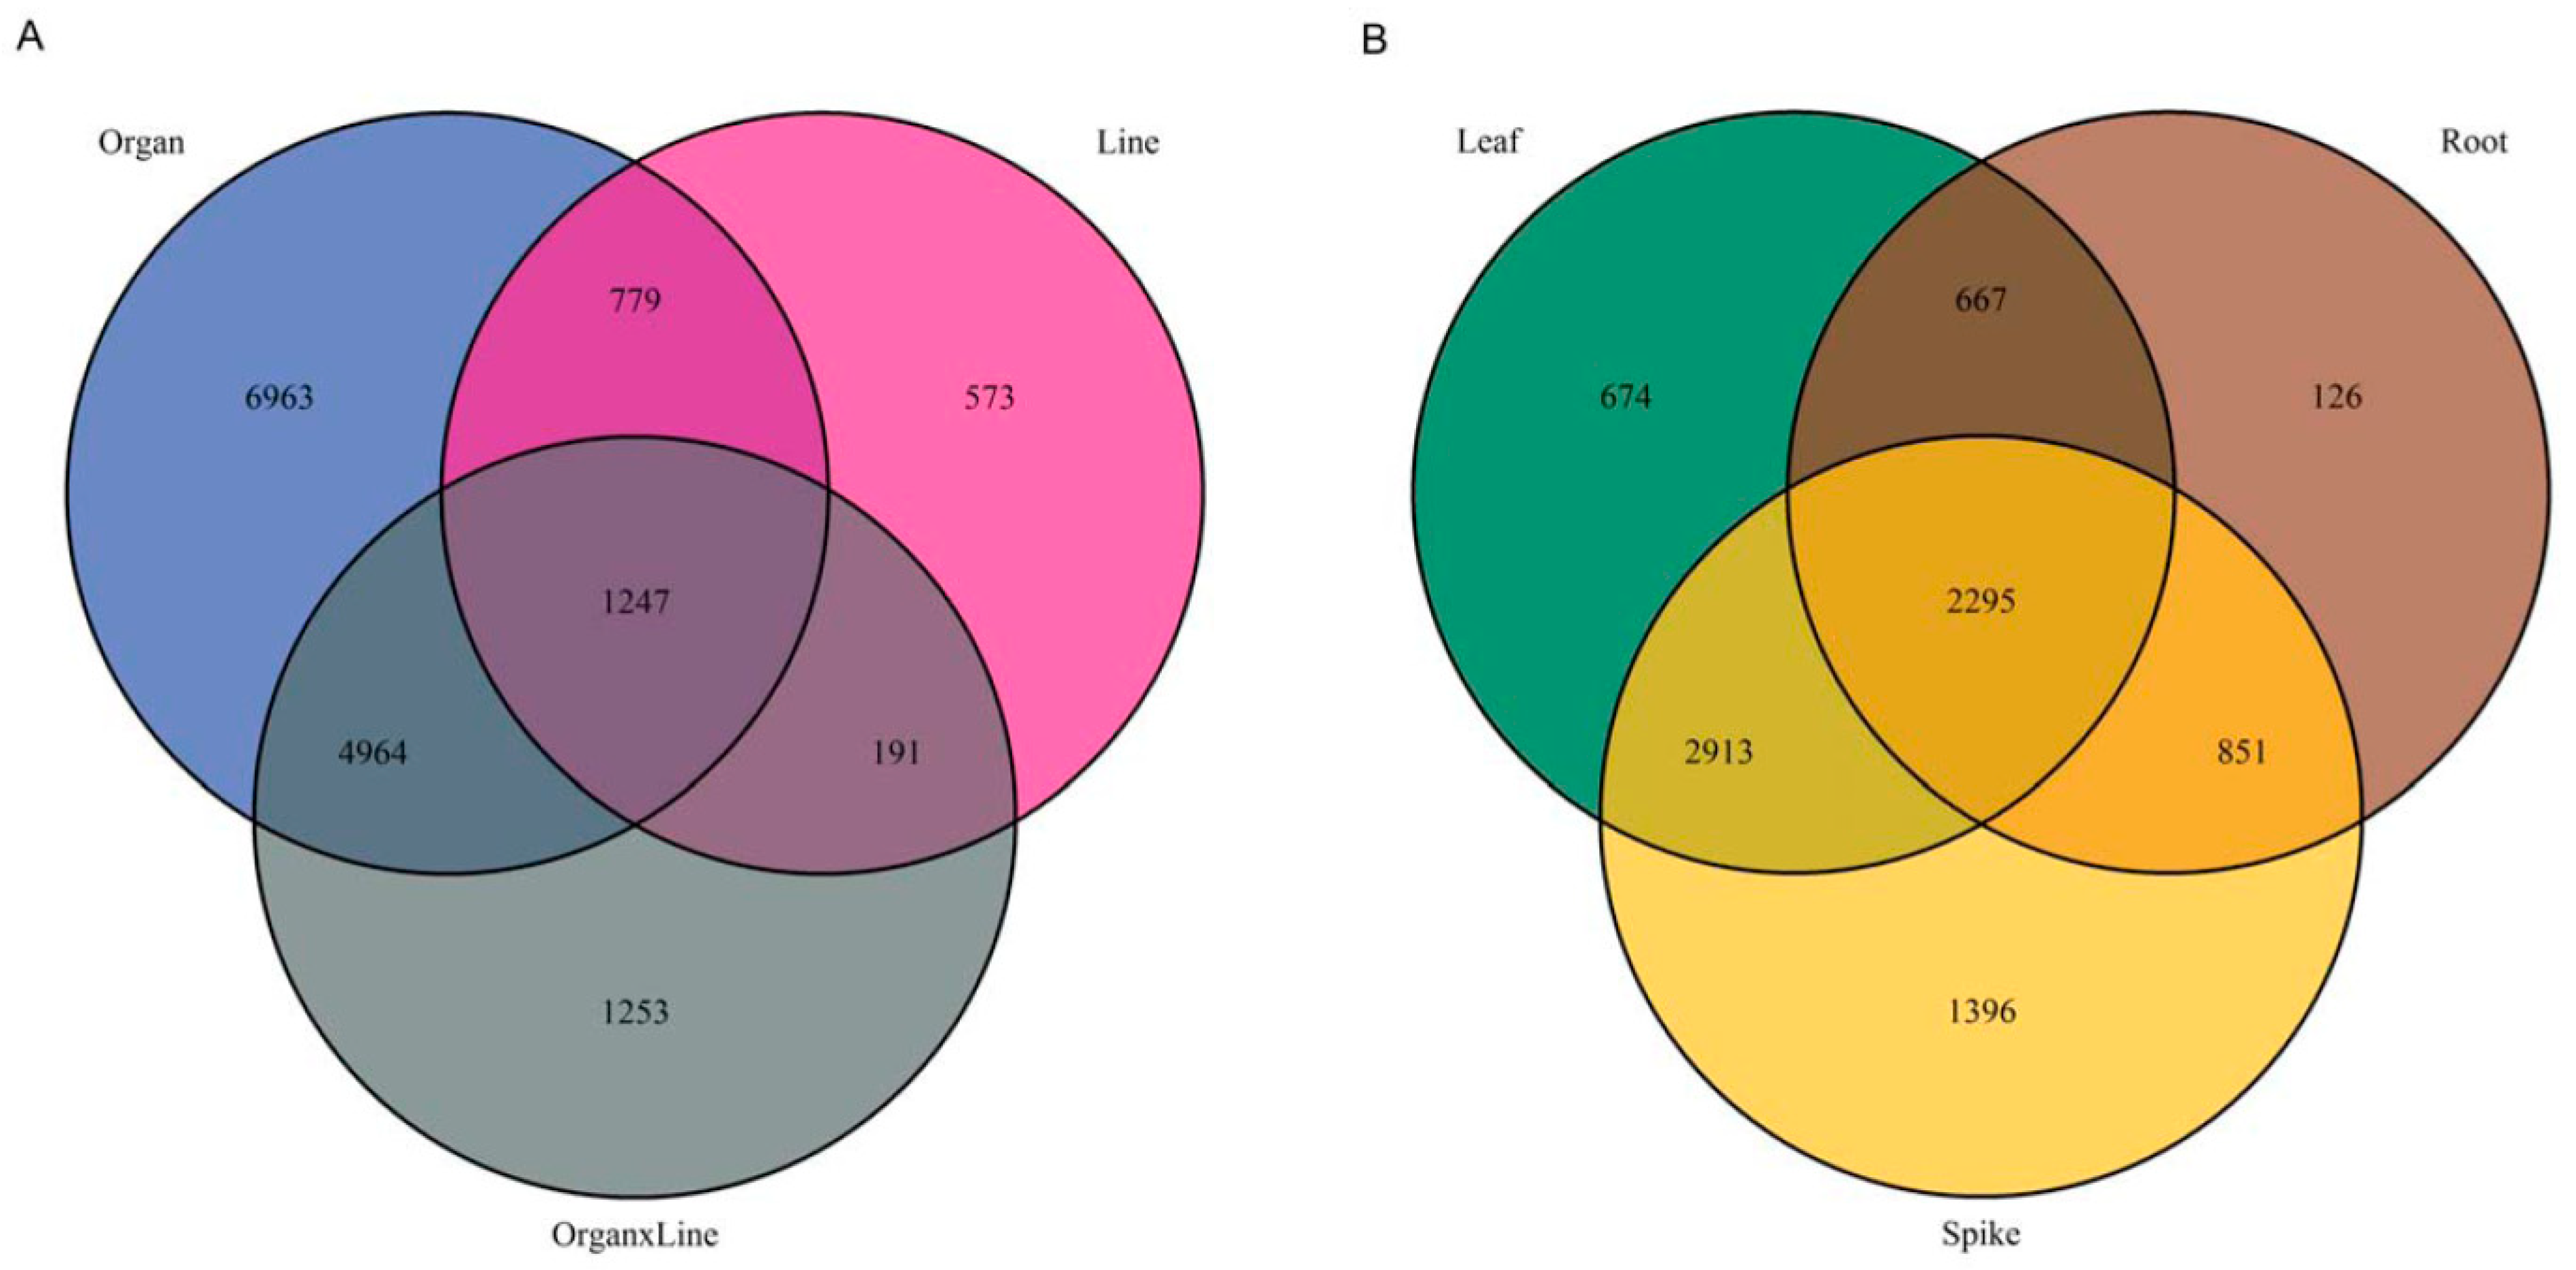
2.1. Comparison of Metabolomics Profiles in Analyzed Brachypodium Organs and Lines

Metabolic diversity within the studied Brachypodium lines and organs was represented in our LC/MS data sets by 22,307 individual signals detected in 48 analysed samples (three organs, two lines, two experiments and four biological replicates). To have a better insight into the global metabolite profile in analysed organs of both Brachypodium lines we performed principal component analysis (PCA) with all m/z signals detected during analyses performed with high resolution MS system in positive and negative ionization mode. The obtained PC3 plot revealed clear metabolic discrimination among tested organs and relative similarity between both lines (Figure 1). The highest consistency of metabolic profiles was observed within roots of both lines whereas the biggest interline differences were visible for spikes.
To corroborate our observations from the PCA plot, we used univariate two-way ANOVA analysis for each signal to classify signals into three following groups: (i) signals differentiating organs (O: comparison of the mean values of signal intensities from roots, spikes and leaves), (ii) signals differentiating lines (L: comparison of the mean values of signal intensities from Bd21 and Bd3-1) and (iii) signals revealing significant interaction between organ and line factors (L×O: comparison of the mean values of signal intensities from Bd21 roots, spikes and leaves, and Bd3-1 roots, spikes and leaves) (Figure 2A). As already indicated by the PCA plot (Figure 1), there was a relatively low number of signals discriminating lines whereas the majority of signals were organ specific. Nevertheless, the PCA plot was created on the basis of all detected signals while only fraction of them was filtered for O effect after ANOVA. This indicated a high impact of the differentiating signals on the entire metabolomic profiles in Brachypodium plants. Overall, these results are convergent with previous unbiased metabolom analyses conducted on the leaves and seeds of the Bd21 and Bd3-1 lines, which also revealed a stronger impact on organs than the genotype on metabolome [12].
Differences in the metabolite set might contribute to the phenotypic differences between both studied lines, which have proven variation in many phenotypic traits [12,23,25], resistance to particular pathogens [26,27,28,29] or drought adaptation [17,32]. To obtain a better insight into the metabolic differences between Bd21 and Bd3-1 lines we selected signals corresponding to differentially accumulating metabolites (DAMs). We defined DAMs as signals significantly distinguishing both accessions (p-value < 0.01 for factors L or L × O) and differing at least two times (fold change; FC > 2) in their abundance in any of the tested organs of Bd3-1 and Bd21 accessions (Figure 2B). Out of all signals, 2295 met these conditions for each organ suggesting a prevalent role for widely occurring elements in line differentiation. As suggested by the PCA plot, the proportion of DAMs indicated the lowest differences between Brachypodium lines in the roots and highest in the spikes. We selected 30 DAMs with the highest diversification among the studied groups to annotate respective m/z values and compare in detail differences in their abundances between particular lines and organs (Figure 3). Despite good genetic characterization of Brachypodium, the metabolic pathways of this species are fragmentary in all dedicated metabolic platforms. Therefore, annotation of m/z values was performed with a database created with Oryza sativa subsp. japonica (japonica rice), described at the metabolome level model plant from Poaceae family [35].
Among the annotated compounds putative derivatives of hydroxycinnamic acids (feruloylhydroxycitric acid, caffeoylpyruvylhexose, isomers of caffeoylthreonic acid and cinnamic acid ethyl ester) were highly represented (Figure 3). These included conjugates of hydroxycitrate with hydroxycinnamic acids known from Zea mays as compounds with high variation in accumulation profile in different inbred lines [36]. The signal corresponding to feruloylhydroxycitric acid had the highest abundance in Bd3-1 roots compared with the Bd21 roots. The relatively high level of caffeoylthreonic acid isomers in all organs of the Bd21 line, as compared with Bd3-1, is noteworthy. The same trend of high abundance in Bd21 line was observed for hydroxybenzoic acid derivatives (N-salicyloylaspartic acid and N-pyruvoyl-methoxy-hydroxyanthranilic acid).
Putative derivatives of the flavone apigenin (isovitexin pentose-deoxyhexoside, pentahydroxy-dimethoxyflavone hexoside and apigenin hydroxy-methylglutaryl-hexoside) together with proanthocyanidin B and cyanidin acylated glycoside were representatives of differentiating flavonoids. Interestingly, cyanidin 3-O-glucoside (chrysantemin) has been already reported as differentially accumulating metabolite in Brachypodium spikes [13]. These correlative findings suggest that biosynthesis of cyanidin glycosides clearly discriminate both Brachypodium lines. Despite the common biosynthetic origin, differences in abundance of particular flavonoids and hydroxycinnamic acids were not correlated. However, it should be noted that most of the distinctive compounds were complex structures that were relatively distant from the common precursors in the metabolic pathway. This in turn indicated that the activities of the enzymes responsible for particular modifications of the core structures, including hydroxylation, acylation, methylation and glycosylation, were responsible for the observed differences in phenylpropanoid metabolism among compared organs and lines.
We found signals corresponding to monounsaturated fatty acids (palmitoleic acid, myristoleic acid) with the highest diversification between Bd21 and Bd3-1 lines in leaves. Among annotated phosphate-containing compounds, purine derivatives (deoxyguanosine 5’-monophosphate (dGMP) and adenosine monophosphate) were highly accumulating in spikes of Bd21 in comparison to Bd3-1. Phosphoglycerolipids (PA(20:0/17:1), PS(20:1/0:0), PS(18:1/0:0) and PG(18:0/0:0)) have variable accumulation patterns in all organs and lines, therefore, differences in phosphate management between both lines could be suggested. Finally, sulphur-containing metabolite from the 2-oxocarboxylic acid pathway (methylthio-pentylmalic acid) was also annotated as one of the most differentiated metabolites. Its dominating abundance in Bd3-1 was especially visible in roots.
Figure 3. Abundances of peaks representing selected MS signals highly differentiated Brachypodium lines in particular organs. Colour scale presents log2 from respective peak heights. Tentative signal annotations based on O. sativa metabolic database from Kyoto Encyclopedia of Genes and Genomes (KEGG) [35,37]. l—leaves; r—roots; s—spikes.
Molecules 27 05956 g003

2.2. Pathway Enrichment Analysis

2.2.1. Most Represented Metabolic Pathways

For further global settling of Brachypodium metabolome into the biological context, functional analysis of obtained result on the basis of MetaboAnalyst was implemented. Firstly, pathway-level enrichment has been performed with all m/z signals detected in positive and negative ionization modes for overall picture of metabolites in Brachypodium plants (Table 1). The same as for metabolite annotation, our analysis was performed on O. sativa database [35]. Direct tentative annotation of m/z values obtained during our analysis to rice metabolites enabled further calculation of pathway-level enrichment.
Our analysis performed with all signals indicated significant enrichment of flavonoid-related pathways (Table 1). Forty signals have been matched to metabolites from flavonoids biosynthesis (47 metabolites in total). This was accompanied by signals matching 12 metabolites (all from the same pathway) from flavone and flavonol biosynthesis. This indicated a significant contribution of a specialized metabolism to the overall profile of Brachypodium metabolites.
The remaining identified pathways represented primary metabolic processes, mainly nucleotide, sugar and amino acid metabolism. Twenty-five metabolites from the galactose metabolism matched with signals from our analysis, including galactinol and raffinose, which were previously described as involved cold and drought stress response in Brachypodium [38]. Significant annotation of pentose and glucuronate interconversions was mainly related to metabolites from modules of pectin degradation and glucuronate pathway. Key components of plant metabolism from the pentose phosphate pathway as source of substrates for synthesis of purine nucleotides, followed by purine metabolism, were highly matched. In the second mentioned pathway, annotation focused on modules of inosine monophosphate biosynthesis, adenine ribonucleotide biosynthesis and purine degradation. Pyridoxal and pyridoxine, as well as their phosphorylated derivatives from vitamin B6 metabolism, were also significantly enriched. Antioxidant and defence related metabolites from amino sugar and nucleotide sugar metabolism and ascorbate and aldarate metabolism, including phosphorus containing structures (D-Glucosamine phosphate and their derivatives and UDP-glycosides) were significantly annotated.
Amino acid metabolism branched-chain amino acids, valine, leucine and isoleucine biosynthesis were matched. Related to them 2-Oxocarboxylic acid metabolism was also highly scored in both statistical significance and pathway impact. Compounds annotated to this pathway focused on a branch of the 2-Oxocarboxylic acid chain extension by tricarboxylic acid module, which in Brassicaceae species leads to glucosinolate biosynthesis [39]. However, in Poaceae, glucosinolates are absent, therefore, signals annotated to sulphide compounds such as 2-(5’-methylthio)pentylmalic acid and isomer 3-(5’-methylthio)pentylmalic acid), 2-(6’-methylthio)hexylmalic acid and isomer 3-(6’-methylthio)hexylmalic acid from this branch can be components of different pathways. Interestingly, elements of “2-Oxocarboxylic acid” were previously reported in grasses as factor involved in the response to salinity and drought stress [40,41]. Further inspection of LC-MS and MS/MS spectra showed the presence of such S-containing compounds in Brachypodium plants not previously identified, which confirms the validity of enrichment analysis in plant metabolite profiling (Supplementary Figure S1). Another amino acid related pathway, tyrosine metabolism, was selected based on the annotation of tyrosine and 3,4-dihydroxyphenylalanine, which, in grasses, plays a key role in lignin biosynthesis (Maeda, 2016).

2.2.2. Metabolic Pathways Distinguishing Bd21 and Bd3-1 Lines

In order to identify metabolic pathways discriminating on both analysed lines in particular organs, pathway enrichment analysis was only performed for signals representing DAMs selected based on the above-described ANOVA analysis (p-value ≤ 0.01 for factor L or O × L; FC > 2) (Figure 2B, Table 2). Housekeeping and general metabolism-related biological pathways (galactose metabolism, pentose phosphate pathway, valine, leucine and isoleucine biosynthesis) highly varied among the six compared groups. Moreover, specialized metabolism of flavonoid biosynthesis, was related to flavone and flavonol biosynthesis and 2-Oxocarboxylic acid metabolism were commonly differentiated these groups.
Metabolic differences between the roots of Bd21 and Bd3-1 are manifested primarily by “Diterpenoid biosynthesis”. In monocots, diterpenoids are known from large structural diversity and species-specificity. In Brachypodium, no specialized diterpenoids have been identified, however, a few Brachypodium genes are homologous to rice genes related to momilactone phytoalexin production [42]. In our analysis, the main differentiating module of diterpenoid biosynthesis was gibberellin production, which is the key factor in root elongation in monocots [43]. The differences in gibberellin levels in the roots of both Brachypodium lines could be related to observed differences in root morphology of both tested lines [25]. In this context it was also of interest that tetrahydrofolate from differentiating one carbon pool by folate pathway has been reported as key regulators of root development [44].
The caffeine metabolism pathway including purine alkaloids was also significantly different among the roots of both Brachypodium lines. Matched intermediates of this pathway included xantosine, 7-methyluric acid and their derivatives. However, caffeine itself has been not reported in grasses while at least some of the matched metabolites can be linked with purine salvage or degradation [45].
Histidine and vitamin B6 metabolism had a shared effect in leaves and spikes. Besides protein synthesis, histidine is tightly connected to nucleotide metabolism and the pentose phosphate pathway. Within this pathway the most differentiated was a branch of histidine biosynthesis from 1-(5-Phospho-d-ribosyl)-ATP via L-histidine to Imidazole-4-acetate. Vitamin B6 metabolism was mainly matched by metabolites from pyridoxal-P biosynthesis branch (pyridoxine, pyridoxine 5-phosphate, pyridoxamine, pyridoxamine 5-phosphate, pyridoxal 5-phosphate, glyceraldehyde 3-phosphate and 4-phosphooxy-threonine, 2-oxo-3-hydroxy-4-phosphobutanoate), which led to further pentose phosphate pathways. This agreed with a previous study showing compounds of vitamin B6 metabolism and their catabolites differently accumulating between Bd21 and Bd3-1 seeds [13].
A pathway that specifically differed between spikes of both Brachypodium lines was the cysteine and methionine metabolism indicating possible differences in sulphate assimilation. S-Adenosyl-L-methionine, a key metabolite from this pathway, is a donor of methyl group in numerous transmethylation reaction influencing physical and chemical properties of lignin polymers, as well as hydroxycinnamic acids synthesis in Brachypodium plants [46].

2.3. Metabolite Identification with LC-MS Systems

In the next step of our study, we tried to identify a subset of detected metabolites based on their spectra obtained during the HPLC-ESI-MSn and UPLC-HR-MS/MS analyses. MSn spectra are helpful in the identification of complex metabolites, for example flavonoids glycoconjugates, where they can enable the determination of the place and character of the glycosidic bond. In addition, the order of detachment of individual fragments from complex structures with a simultaneous observation of the intensities of particular product ions enables the differentiation of isomeric and isobaric structures, unlike MS/MS, which, in many cases hampers, isomers differentiation. However, accurate measurement of m/z values obtained during HR MS/MS analysis allowed confirmation of tentative structures predicted by the MSn analysis. Overall, this analysis enabled us to identify 93 metabolites at levels 1–3 according to the Metabolomic Standards Initiative [47] (Table 3). This manual metabolite identification enabled us to describe the structures specific to Brachypodium, which are absent in metabolomic databases and, therefore, cannot be annotated with automated bioinformatics approaches.

2.3.1. Hydroxycinnamoyl-Quinic Acids

MS signals corresponding to phenolic and hydroxycinnamic acids and their derivatives were detected in all studied organs at high abundances. p-coumaric, caffeic and ferulic acids have been identified in Brachypodium in conjugation with (methyl)quinic acids, sugar acids, or polyamines; while caffeic and ferulic acids (Table 3; compounds 21, 38) have been additionally observed as free molecules that have been identified by comparison to their standards.
Different isomers of hydroxycinnamoyl-quinic acids (HQA) were reported and can be found in metabolite databases, but proper annotation of these isomeric structures should be supported by fragmentation schemes in MS/MS or MSn spectra. In our analysis, HQAs (8, 26, 29, 43 and 48) were identified according to Clifford et al. [43] and Piasecka et al. [54]. The main product ion from deprotonated molecules of compounds 29, 43 and 48 at m/z = 173 Da corresponded to quinic acid, which is distinctive for 4HQA isomers (Figure 4A). On the other hand, 5HQAs are characterized by the main product ion representing the respective hydroxycinnamic acid molecule [56] as we found for 26 where product ion at m/z = 193 Da corresponded to ferulic acid (Figure 4B). Deprotonated ions of compounds 8 had the same exact m/z value as compounds 26 and 43 (367.10425 Da) with the same chemical formula C17H20O9 calculated from exact mass. The UV spectra of 8 with a maximum of absorption at 305 nm (Table S2) and fragmentation with product ions at m/z = 161, 135 and 119 Da suggested caffeic acid derivative.
Overall, we observed three different hydroxycinnamic acids conjugated with quinic acid as 4HQA isomers (29, 43 and 48), while only ferulic acid conjugate has been detected as 5HQA isomer (26). However, the dominant presence of 4HQAs might result from the isomerization of 5HQAs that could occur either in vivo or in the extract solution [63]. Widely occurring grass 3HQA isomers [56] have been not detected in our study.

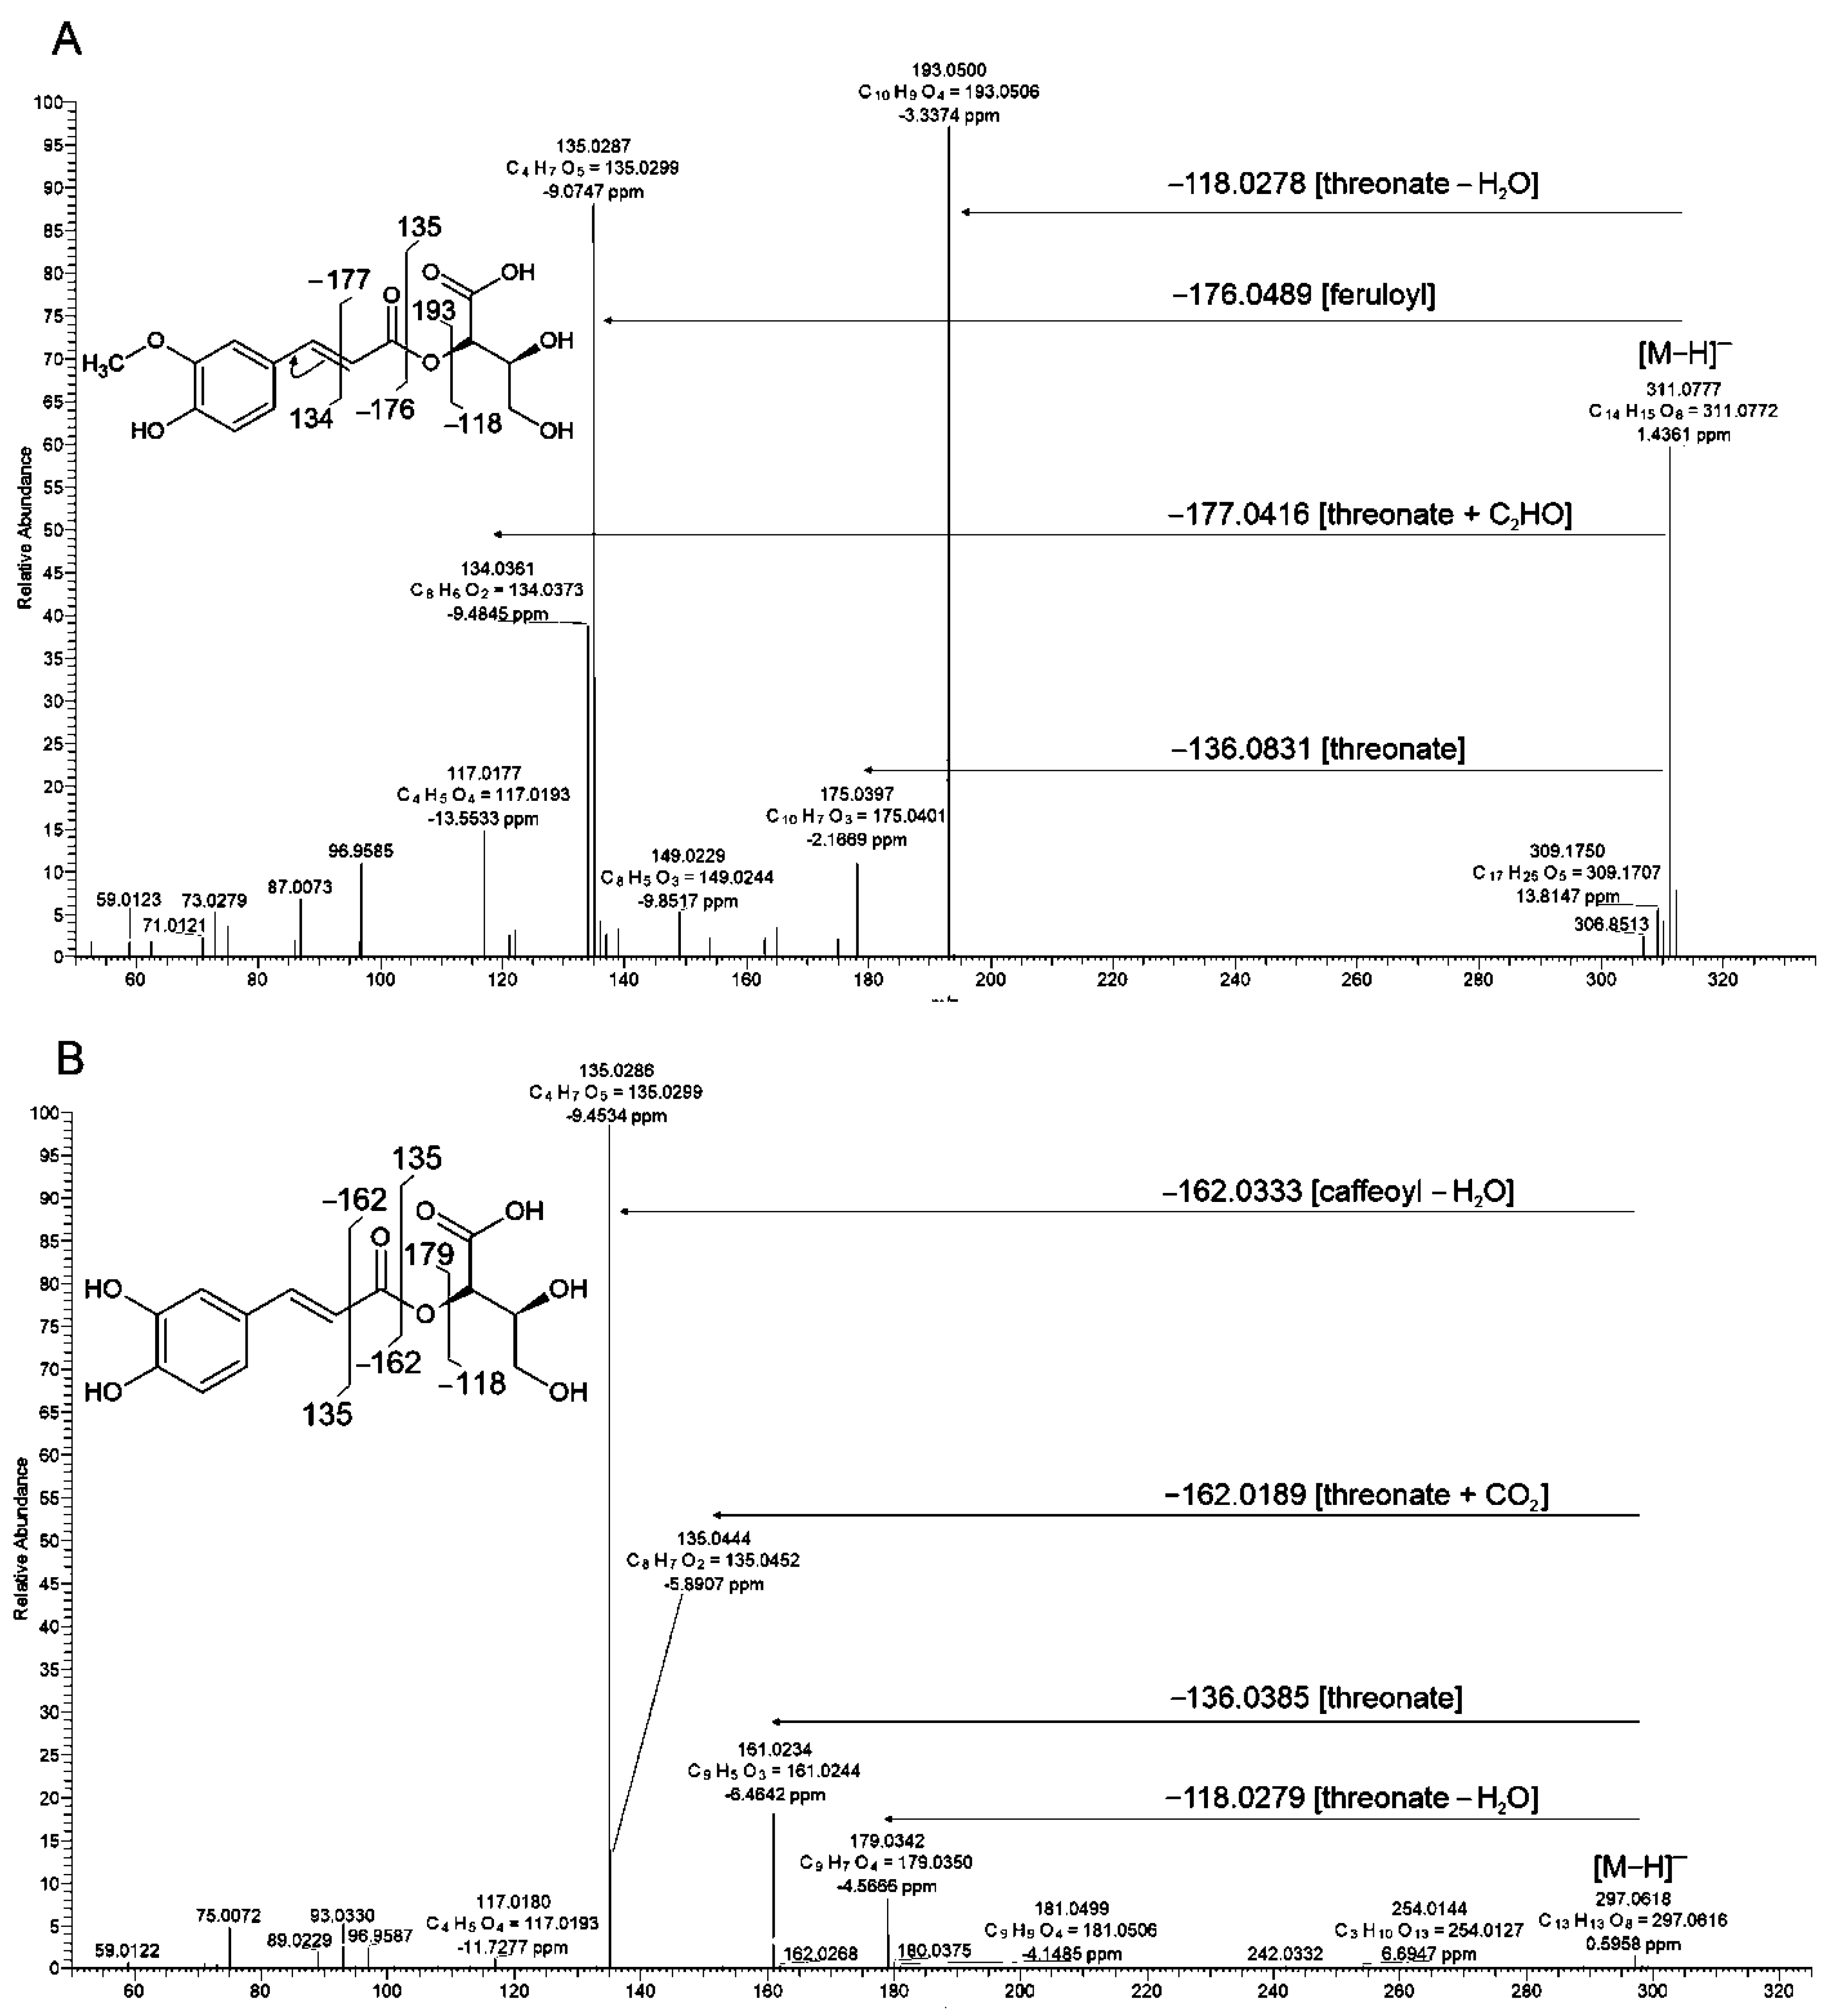
2.3.2. Esters of Hydroxycinnamic and Threonic Acids

In addition to quinic acid conjugates, the most abundant signals detected in all studied organs corresponded to sugar acid, mainly threonic acid, derivatives. The main fragmentation pathway of deprotonated ion of compound 42 indicated loss of the 118.0278 Da fragment corresponding to threonic acid moiety [threonic acid-H2O]. The main product ion at m/z = 193.0499 Da revealed loss of the entire ferulic acid moiety (Figure 5A). Less abundant ions were related to the parallel fragmentation scheme in which losses of 176.0489 Da corresponded to [feruloyl-H2O]. Two-way fragmentation gave evidence for a similar stability of both acidic components of 42 in CID. Minor product ions at m/z = 149.0597 and m/z = 134.0361 Da corresponded to [feruloyl-CO2] and [feruloyl-C2O2], indicating a preserved ester bond in fragmentation of 42. Measurement of the exact mass of ionized compound 42 enabled the calculation of chemical formula C14H15O8, which confirmed the presence of feruloyl and threonate moieties in this structure. Therefore, 42 was determined as feruloylthreonic acid.
The main product ions of compounds 18 and 63 yielded an analogous fragmentation scheme as 42 and the exact mass calculation of product ions indicated caffeic and p-coumaric acid residues in those structures, which in turn pointed at caffeoylthreonic and p-coumaroylthreonic acids as respective compounds. Analogously to feruloylthreonic acid, expected product ions of deprotonated compound 18 should correspond to [threonic acid-H] and [caffeic acid-CO2], which were both characterized by the same nominal masses at m/z = 135 Da. Analysis in the MSn mode with a low resolution of mass measurement could not support discrimination between both product ions. Nevertheless, a high-resolution MS spectra ion at m/z = 135.0288 (C4H7O5) corresponded to threonate and a second ion at m/z = 135.04444 Da (C8H7O2) to decarboxylated caffeic acid, confirming the presence of both acid moieties in the structure of compound 18 (Figure 5B). Interestingly, according with our pathway enrichment analysis present in these highly abundant conjugates (18, 42, 63), threonic acid could be generated as a degradation product of ascorbate in plants [64].
Threonate esters have so far not been reported in Brachypodium or in closely related barley and wheat. However, such compounds were identified in other members of the Poaceae family including silvergrass (Miscanthus sp.), orchard grass (Dactylis glomerata) and maize [54,65,66]. 2-O-caffeoylthreonic acid was previously identified by NMR in D. glomerata [65] and Crataegus species (Rosaceae) [67]. Moreover, 4-O- and 2-O-p-coumaroylthreonate were observed as precursors in moss cuticle biosynthesis [68]. 2-O-caffeoylthreonates with 3-O- and 4-O-isomers of caffeoylthreonate were also reported in leaves of Pulmonaria officinalis (Boraginaceae) [69] and Fagus Sylvatica tree (Fagaceae) [70], which confirmed structural diversity and the wide presence of these metabolites.

2.3.3. Hydroxycinnamic Acid Amides

Our analysis of MSn and MS/MS spectra also enabled identification of conjugates of p-coumaric, caffeic and ferulic acid with putrescine and agmatine. Among these, compounds 10 and 12 have similar masses of protonated [M+H]+ ion at m/z = 235 Da and calculated chemical formula from exact mass as C13H17O2N2 (Figure 6A). Compounds 10 and 12 Also share product ion at m/z = 147 Da that correspond to dehydrated p-coumaric acid. In both compounds losses of –NH4 group and of entire putrescine moiety can be also observed (Figure 6BC). Fragmentation of compound 12 was characterized by additional product ion at m/z = 119 Da, which is typical for p-coumaric acid with preserved peptide bond between acidic and polyamine substituents.
Regarding this, we tentatively assigned compounds 10 and 12 as p-coumaroyl-N-putrescine isomeric structures. The same scheme of fragmentation and differences in product ion intensities were observed for compounds 11 and 23. The protonated [M+H]+ ions of both metabolites yielded losses of fragment 88 Da, corresponding to putrescine, whereas the main product ions at m/z = 248 and 177 Da in an MS2 scan indicated a ferulic acid molecule. In an MS3 scan of compound 23, an additional product ion at m/z = 145 Da indicated peptide bond preservation during fragmentation steps. The calculated chemical formula of compounds 11 and 23 and fragmentation spectra corresponded to C14H21O3N2, which complied with feruloyl-N-putrescine isomers, similar to 10 and 12. In an MS3 scan of compound 23, an additional product ion at m/z = 145 Da indicated peptide bond preservation during fragmentation steps. In grasses, two geometric isomers of hydroxycinnamic acids cis and trans were previously reported [71]. Trans isomers constitute the predominantly occurring form in plants, but they can be transformed to corresponding cis isomers by UV-radiation. Concerning this, we assumed that the isomeric hydroxycinnamic acid amides revealing differences in their fragmentation pattern represented cis-trans conformers.
Compounds 40 and 49 were observed only in the positive ionization mode. The protonated [M+H]+ ions of both molecules yielded losses of the main fragment of 130 Da with product ions at m/z = 147 and 177 Da, corresponding to p-coumaroyl and feruloyl moieties, respectively. The accurate mass measurement suggested C14H19O2N4 and C15H21O3N4 chemical formulae for 40 and 49, respectively. Four nitrogen atoms containing a substituent with adequate chemical formulation indicated agmatine presence in those structures. Consequently, compounds 40 and 49 were determined as p-coumaroylagmatine and feruloylagmatine. The latter compound has already been reported in Brachypodium leaves [72]. Agmatine derivatives were also observed in barley, including complex hordatine A, B and C structures that possess antifungal activities [58]. Agmatine conjugates with hydroxycinnamic acids were also reported in wheat [73] and species representing other plant families like African shrub Maerua edulis in which cis-trans conformers of p-coumaroylagmatine were distinct [74].

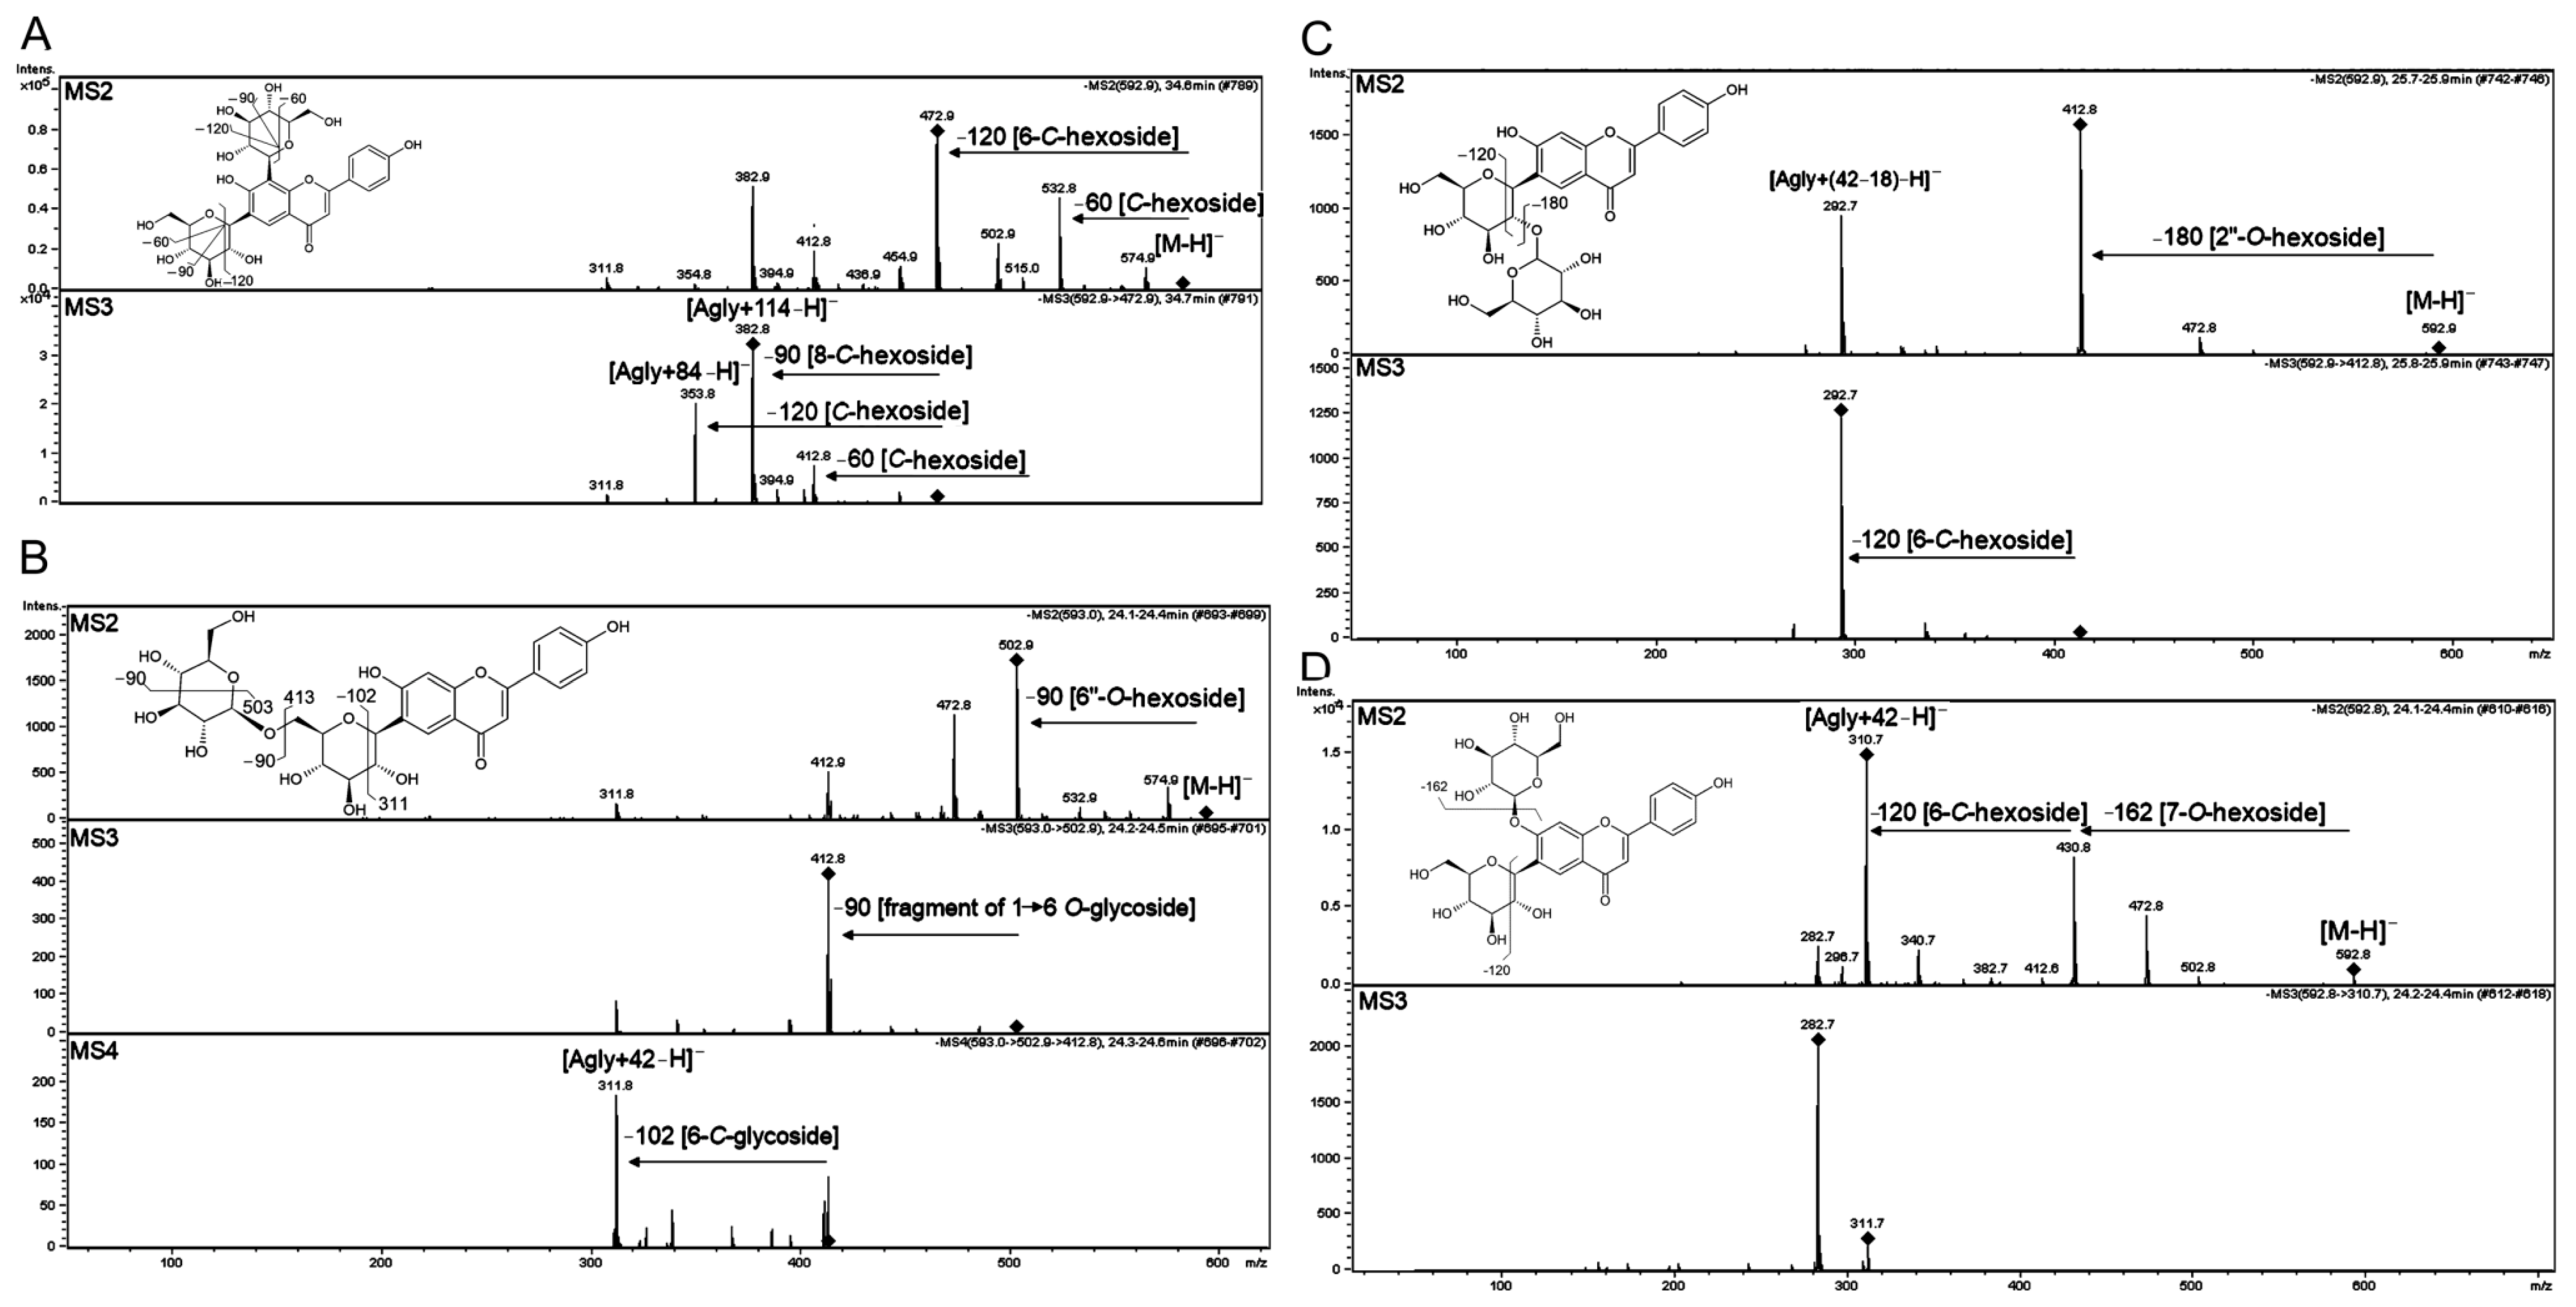
2.3.4. Flavonoid Glycosides

The highest number of compounds identified in this study belonged to flavonoids. MSn fragmentation schemes of the same or similar molecules were previously described in Poaceae plants including barley and wheat [58,62,75]. Therefore, structural similarities and conservation of structures can be deduced for those closely related species. Our analysis resulted in identification of isomeric structures of glycosylated flavonols (quercetin, isorhamnetin), flavones (apigenin, luteolin and chrysoeriol) and proantocyanidins. The aglycone type of molecular mass 270 and 286 Da were further confirmed as apigenin and luteolin, respectively, referring to pseudo-MS3 spectrum described previously [76]. The characteristic product ions at m/z 199, 175, 151 and 133 determined the aglycone as luteolin whereas the characteristic product ions at m/z 153, 145, 121 and 119 determined the aglycone as apigenin. In roots, derivatives of O-methylated flavonoids like isorhamnetin, tricin and chrysoeriol were mainly identified. Glycosides of all these aglycones were present in Poaceae species in diverse structural configuration [58,62,75]. We mainly found hexose(s), deoxyhexose(s) and pentose(s) sugar substituents of analyzed flavonoid aglycones. However, a precise sugar structure could not be determined by MS analysis. The presence of glucose and galactose could be suggested in Brachypodium flavonoid glycoconjugates as both hexoses were found in flavonoids of closely related species barley and wheat [77,78]. Among other sugar only rhamnose as deoxyhexose and arabinose as pentose were described in flavonoids of Poaceae family.
Among the different aglycone-sugar conjugates, we identified O-glycosides and C-glycosides as well as O-,C-glycosides. In addition, LC-MSn analysis of flavonoid diglycosides enabled distinguishing interglycosidic bonds in glycosyl(1→6)glycosides and glycosyl(1→2)glycosides [58,62]. Unfortunately, the exact positions of aglycone substitutions in flavonoid glycosides were difficult to establish without NMR analysis. However, on the basis of similarities in fragmentation scheme with mass spectra of flavone derivatives reported in species closely related to Brachypodium, including barley and wheat, 4-OH- and 7-OH- groups could be suggested as positions of glycosylation of flavonoid derivatives from Brachypodium [58,62,75].

O-Glycosides

Deprotonated [M−H] ions of compounds 41, 52 and 78 underwent sequential losses of two 162 Da fragments, first in the MS2 and then MS3 spectra. The HR LC-MS analysis confirmed detachment of two C6H10O5 fragments, which indicated two dehydrated hexoses moieties [hexose-H2O]. Neutral losses of dehydrated glycosidic residues are characteristic for O-hexosides of flavonoids [58,62]. During MSn analysis of compounds 41, 52 and 78 detachments of two hexosyl units was observed indicating two separate glycosylation sites at flavonoid aglycone (Table 3). The main product ion at m/z = 287.05247 Da obtained from [M+H]+ ions of 41 and 52 as well as m/z = 301.07037 Da from [M+H]+ of 78 corresponded to luteolin and chrysoeriol, respectively. Therefore, these compounds were assigned as luteolin di-O-hexoside (41 and 52) and chrysoeriol di-O-hexoside (78).
Unlike compounds 41, 52 and 78, metabolites 89 and 91 have the main [M−H-308] fragment typical for O-hexosyldeoxyhexoside moiety. The [M+H-162]+ and [M+H-146]+ ions were detected at a lower abundance, suggesting a deoxyhexosyl(1→6)hexosidic bond in these structures according to [79]. The major protonated product ions at m/z = 331.08045 and m/z = 301.07037 Da corresponded to tricin and chrysoeriol aglycones, respectively. A relatively high, intense [M+H-164]+ ion in MS2 spectrum of metabolite 90 proved that deoxyhexose is external sugar in this molecule. Furthermore, the detachment of an entire moiety of deoxyhexose was typical for deoxyhexosyl(1→2)glycosyl interglycosidic bond.

O,C-Glycosides

Compounds 68, 69 and 76 with [M−H] at m/z = 593.15155 and calculated chemical formula C27H30O15 have been identified as isomeric structures of apigenin di-hexoside (Figure 7). Differences in mass spectra of these isomers obtained in negative MSn mode enabled to distinguish 7-O, 2″-O and 6″-O-glycoconjugates according to [58,80]. The major [Agly+42-H] and [Agly + 72-H] product ions of compounds 68 and 76 were typical for C-glycosides of apigenin (isovitexin) [80]. In addition, the main product [M-162] ion of 76 indicated that the second hexoside was at the 7-O-position in the flavone aglycone, which collectively allowed us to assume that 76 was apigenin 6-C,7-O-di-hexoside (probably isovitexin 7-O-glucoside, common name saponarin) (Figure 7D). The main product ions, [M-90-H] and [M-102-H], observed in the mass spectra of compound 68, were previously reported for 6-C-[6″-O-hexoside]-hexoside thus 68 was suggested to have the structure of apigenin 6-C-[6″-O-hexoside]- hexoside (Figure 7B). The presence of [Agly + (42-18)-H] and [Agly + (72-18)-H] suggested a 6-C-[2″-O-hexoside]- hexoside structure in 69 (Figure 7C).
O-glucoside. Postulated structures and proposed simplified fragmentation schemes are shown. The product ions subjected to fragmentation in MS3 or MS4 are indicated with turned squares at the ion apexes.

Di-C-Glycosides

Compounds 57, 58, 72, 73, 75 and 79-81 were identified as flavonoid di-C-glycosides on the basis of characteristic fragmentation and main product ions [Agly+84-H] and [Agly+114-H] [80] (Figure 7A). The identification of compounds 57, 68, 69 and 76 highlighted the problem with the automatic annotation of metabolomic signals resulting from the diversity of isomeric or isobaric structures available in mass spectra databases. In the case of these four compounds (m/z = 593.15155), we found 110 entries (with error ppm = 5) in the Metlin database [81]. For this reason, identification of such isomeric structures could be only done by MS/MS or MSn fragmentation scheme analysis.
Structural similarity in C-glycosides of apigenin and luteolin between Brachypodium, barley wheat and maize were significant [58,75,82]. However, C-glycosylation could be catalysed by different enzymes in Poaceae plants, as for example, by UDP-glucose-dependent C-glucosyltransferase in rice and wheat [83] or by bifunctional C-/O-glycosyltransferase in maize [82]. In these cereals as well as in Brachypodium, C-glycosides of the flavones apigenin and luteolin were dominant metabolites, with glycosylation occurring singly or doubly at the 8-C and 6-C positions. Structural isomerism related to glycoconjugation hindered proper C-glycosides identification in Brachypodium plant by simple annotation to dedicated databases. Furthermore, significant changes in content of saponarin isomers can be observed during plant development as was detected for barley [84]; therefore, detailed flavonoids studies in Brachypodium should be further extended in developmental context.

2.3.5. Acylated Flavonoids
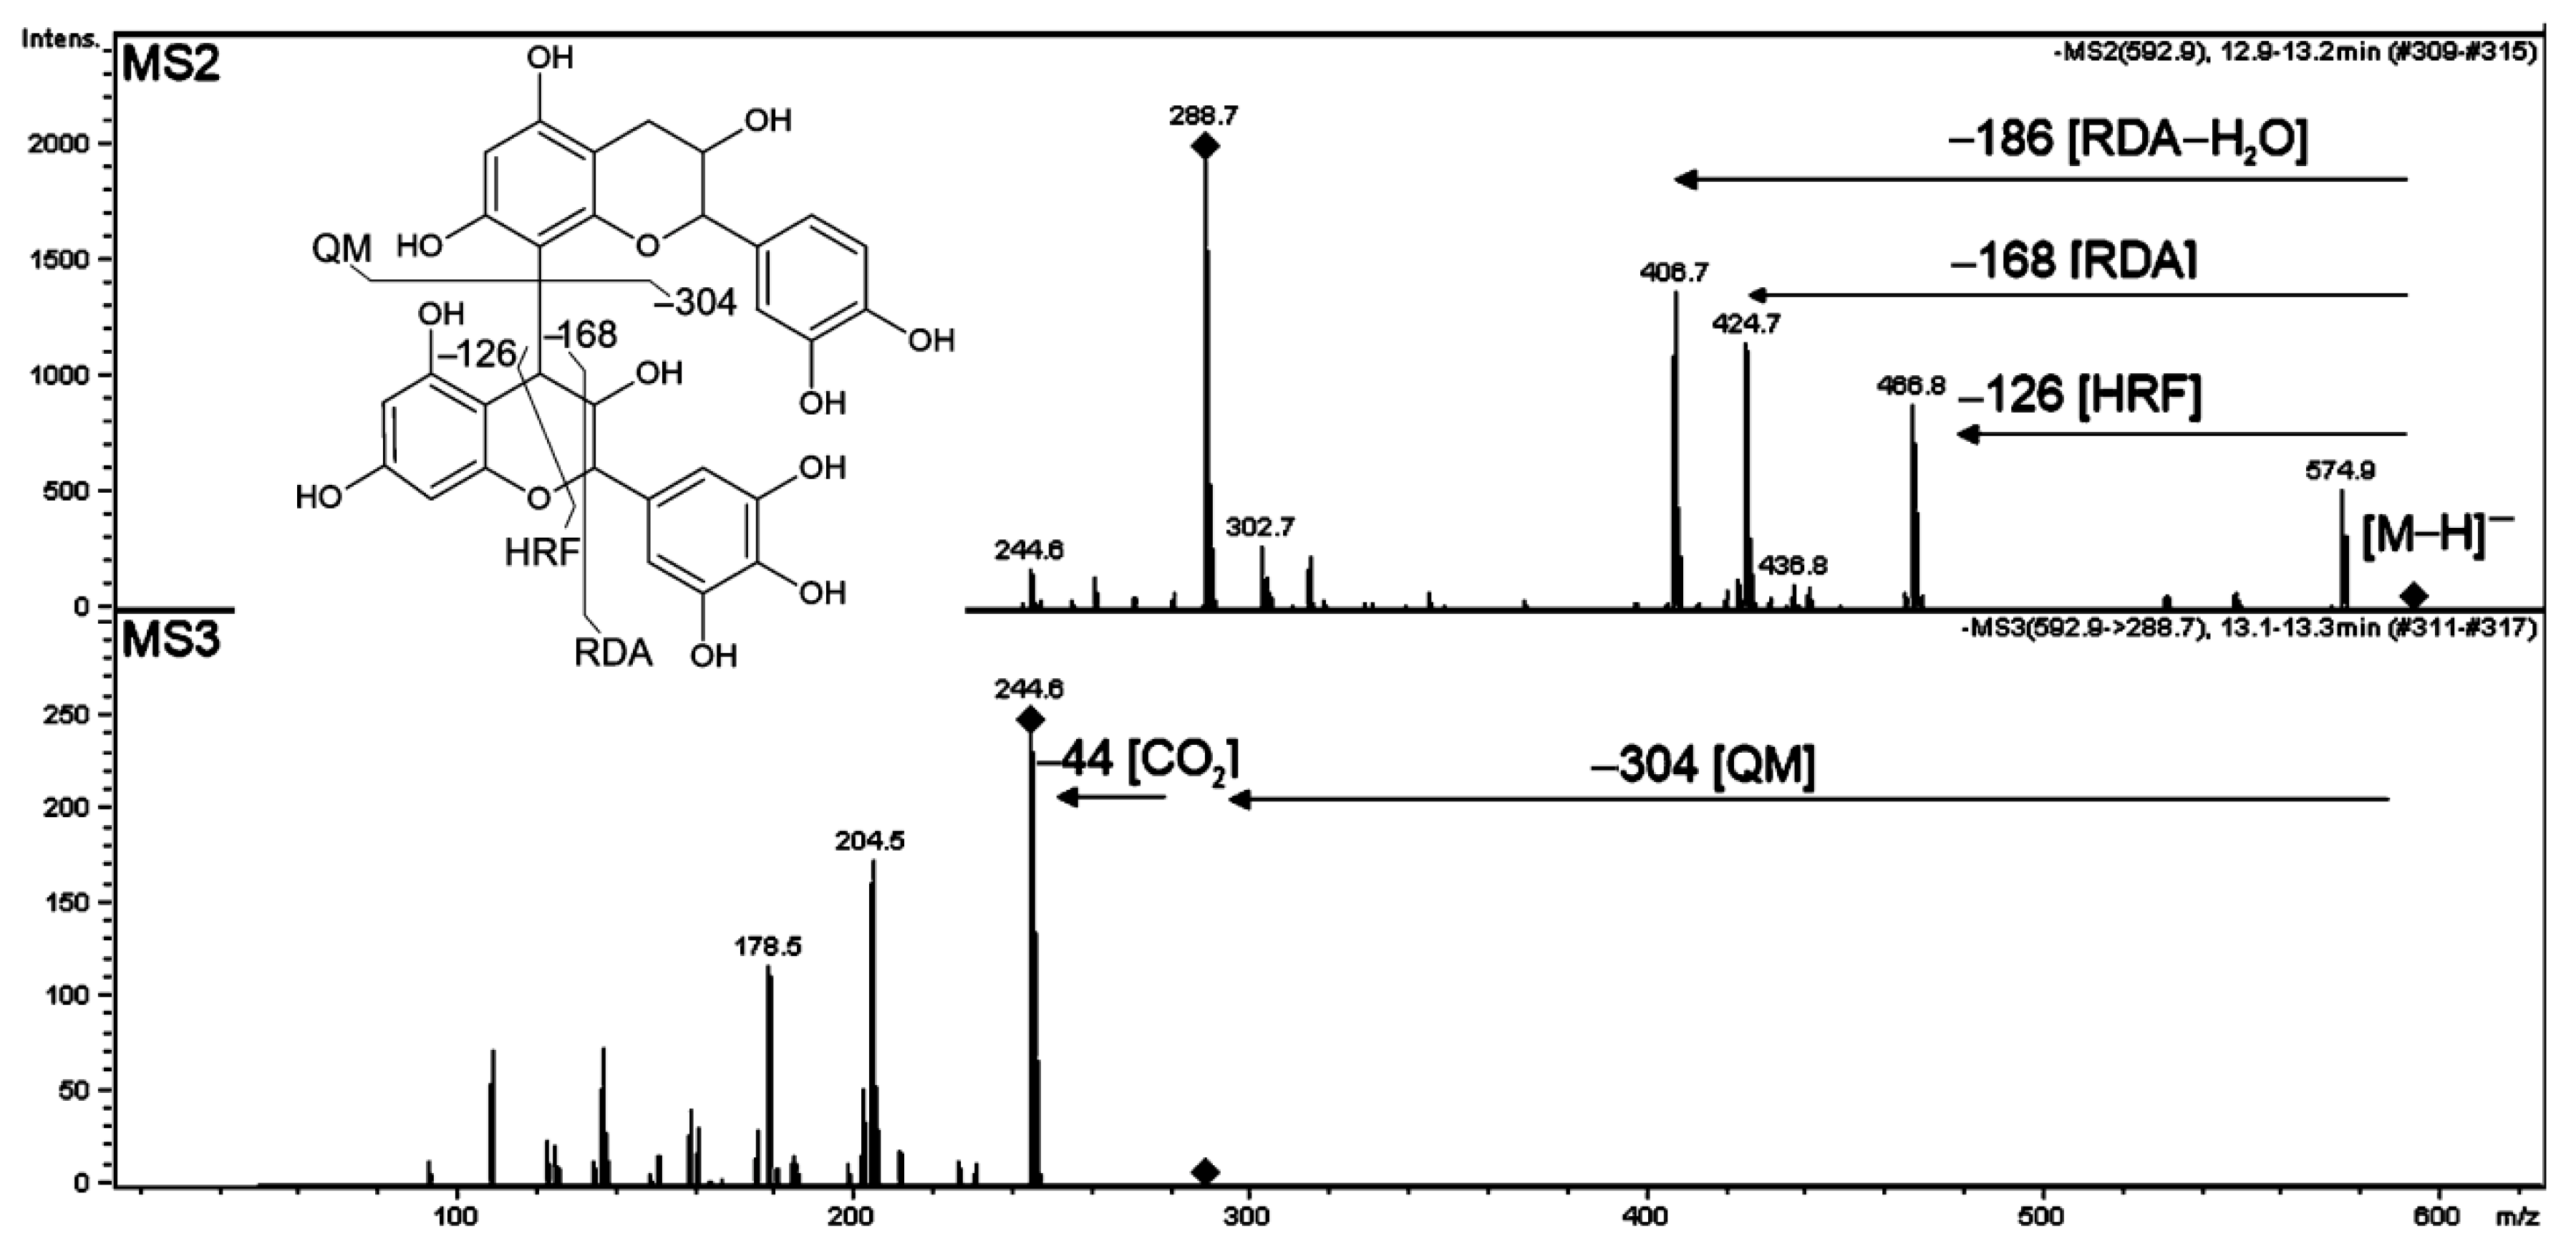
Acylated flavones, in which glycosides are substituted with hydroxycinnamic acids, i.e., p-coumaric, caffeic, ferulic and sinapic acids, present in barley and wheat have been studied by NMR and mass spectrometry and were identified as 7-O-[6″-acyl]-glucosides and 7-O-[6″-acyl]-glucosyl-4’-O-glycosides [85,86,87]. Surprisingly, in Brachypodium we identified only one acylated flavonoid (60) that was detected in leaves while in Poaceae family different isomeric and isobaric structures are present. According to literature data from other related species the structure was established as isoorientin 2″-O-hexoside 7-O-[6″-sinapoyl]-hexoside [58]. The absence of acylated flavonoids in our analysis may eventually arise from our plant growth conditions and/or age of plants used in our analysis, therefore presence of acylated flavonoids in Brachypodium cannot be excluded.

2.3.6. Flavan-3-ols

Our LC/MS analysis revealed that spikes of Brachypodium were rich in flavan-3-ol derivatives, mainly from the proanthocyanidin group. Stereoisomers catechin and epicatechin as well as gallocatechin and epigallocatechin showed the same product ions and very similar ratios on the MS/MS or MSn spectra, thus even preliminary identification of these isomers was not possible based on the obtained MS spectra. The position and the stereochemistry of the interflavan linkage could not be elucidated by MS. Procyanidins can be classified into A-type and B-type depending on the stereo configuration and linkage between monomers. B-type procyanidins possess a single C-C interflavan bond while A-type procyanidins have additional ether bond. The (epi)catechin, (epi)gallocatechin and galloyl subunits were identified in Brachypodium as procyanidin A- and B-type on the basis of typical fragment detachments in MS/MS of deprotonated molecules according to [88,89]. Compounds 24 and 25 have the main product ions at m/z = 305.07 and 289.07 Da indicating (epi)gallocatechin as a core aglycone. The observed main fragments detached from the [M−H] ion of 24 and 25 at 120.021 and 152.011 Da, corresponding to chemical formulae and masses of hydroxybenzoic and gallic acids, respectively. Therefore, 24 and 25 were identified as (epi)gallocatechin O-hydroxybenzoate and O-gallate.
High resolution mass spectrometry as well as MSn enabled to trace the way of fragmentation of dimeric and trimeric structures of (epi)catechin and (epi)gallocatechin proanthocyanidin. An example of the fragmentation of compound 15 is the hRetro Diels-Adler reaction (RDA), which resulted in the detachment of fragment 168 Da, typical for (epi)gallocatechin oligomers (Figure 8). The most abundant product ion at m/z = 407 Da resulted from water elimination from RDA product and [M−H-126] ions from heterocyclic ring fission (HRF). In the parallel fragmentation, a Quinone-Methide cleavage of interflavan bond occurred and the remaining deprotonated ions corresponded to (epi)catechin monomer. Therefore, 15 was identified as a procyanidin B-type dimer. Compounds 7 and 27 possessed a similar fragmentation scheme as compound 15; however, their m/z ratios indicated A-type interflavan bonds in those proanthocyanidis. Trimeric proanthocyanidins (6, 7 and 20) were also observed. The typical RDA and QM fragments corresponded to (epi)catechin and (epi)gallocatechin subunits in those structures.
Proanthocyanidins are well described in several cereal and grass species, including sorghum and barley, due to their nutritional and technological importance [90]. For instance, barley grains have been shown to be especially rich in proanthocyanidins, which contribute to haze formation in barley beer [91]. However, despite well-characterized Brachypodium genes responsible for catechin and epicatechin biosynthesis [92] the number of studies on the accumulation of proanthocyanidins in Brachypodium plants is very limited. Only (-)-epicatechin was detected by widely targeted metabolome analysis in seeds and leaves of Bd21 and Bd3-1 [12]. Overall, our study revealed differential accumulation of proanthocyanidins among Brachypodium organs. We observed high accumulation levels of these compounds in seeds and intermediate accumulation level in leaves while only compounds 6 ((epi)gallocatechin trimer) and 24 ((epi)gallocatechin O-hydroxybenzoate) were detected in roots. Di- to penta-mers and galloylated proanthocyanidins were found in barley. Epiafzelechin derivatives, which are abundant in buckwheat (Fagopyrum esculentum) [93], were not detected during our analysis.

3. Material and Methods

3.1. Plant Material

Seeds of Brachypodium lines Bd21 and Bd3-1 were obtained from Robert Hasterok (University of Silesia, Katowice, Poland). Plants were grown in soil in a controlled growth chamber at 23 or 20 °C (day or night) under short day conditions (8 h light and 16 h darkness) for 4 weeks at 50–60% relative humidity and irradiance of 100 µmol m−2 s−1. Seeds were sown in 9 × 9 cm square pots filled with soil mixed with peat. In the third week of cultivation a supplemental liquid fertilizer (N total 12% w/w, P2O5 4% w/w, K2O 6% w/w, B 0.01% w/w, Cu 0.0007% w/w, Fe 0.015% w/w, Mn 0.012% w/w, Mo 0.001% w/w, Zn 0.005% w/w) was applied in a concentration of 1 mL/1 L of water. Subsequently, light conditions were changed to a long day (16 h light and 8 h darkness) and plants were grown until the developmental stage of spikes, i.e, watery ripe: first grains have reached half their final size (71–73 in BBCH scale according to [94]). Samples of the spikes, leaves and roots were collected, weighted and placed in 2ml tubes containing zirconia beads, then immediately frozen in liquid nitrogen and stored at −80 °C until further processing. An extraction buffer containing 0.5 mM lidocaine and 0.5 mM camphorsulfonic acid in DMSO was added (2.5 µL /1 mg of fresh plant weight) to each tube. Samples were homogenized with a Precellys Evolution (Bertin, France) tissue grinder and centrifuged in 4 °C at 15,000 g. Supernatants were collected and directly subjected to LC-MS analysis.

3.2. Chemicals

The lidocaine and camphorsulfonic acid were from Merck SA (Darmstadt, Germany and the DMSO from Bioshop (Burlington, ON, Canada). Acetonitrile for LC-MS analyses was from VWR Chemicals (Radnor, PA, USA) and the formic acid was from Merck SA (Darmstadt, Germany). Standards of compounds (caffeic acid, isoorientin, apigenin 6-C-glucoside-8-C-arabinoside, luteolin-3,7-di-O-glucoside, tricin 7-O-glucoside and tricin glucosylrhamnoside) were purchased from Extrasynthese (Genay, France). Isoorientin 2″-O-glucoside, isovitexin 7-O-glucoside, isoscoparin 2″-O-glucoside and apigenin 6-C-arabinoside-8-C-glucoside were purified from plant material and their structures were confirmed with NMR analysis as described previously [58].

3.3. Metabolite Profiling

Analysis and identification of metabolites was performed using two complementary LC-MS systems using the previously published approach [58]. First of them (low resolution HPLC-DAD-MSn) consisted of 1100 HPLC system with a photodiode-array detector (Agilent, Santa Clara, CA, USA) equipped with an XBridge Shield C18 column (150 × 2.1 mm, 3.5 μm particle size; (Waters, Milford, CT, USA) coupled to an Esquire 3000 ion trap mass spectrometer (Bruker Daltonics, Billerica, MA, USA). Chromatographic separations were conducted with injection volume 10 µL using water with 0.1% formic acid (solvent A) and acetonitrile (solvent B) at the flow rate 0.2 mL/min and the following gradient: 0–6 min from 8% to 10% B, 6–40 min to 20% B, 40–46 min to 98% B maintained for 5 min. The MSn spectra were separately recorded in the negative and positive ion modes. The second system (high resolution UPLC-MS/MS) consisted of UPLC equipped with a photodiode-array detector (Acquity System; Waters) hyphenated to a high-resolution Q-Exactive hybrid MS/MS quadrupole Orbitrap mass spectrometer (Thermo Fisher Scientific, Waltham, MA, USA). Chromatographic separation was performed on an Acquity UPLC HSS T3 C18 chromatographic column (2.1 × 50 mm, 1.8 μm particle size; Waters) at 22 °C using water containing 0.1% formic acid (solvent A) and acetonitrile (solvent B). The injection volume was 5 μL, gradient elution started at 100% of A and linearly changed to 20% of B over 2 min, then to 30% of B over 8 min and to 95% of B over 1 min maintained for 2 min. UV absorbance was recorded in the 230–450 nm wavelength range with a resolution of 2 nm. Q-Exactive MS operated in Xcalibur version 3.0.63 with the following settings: heated electrospray ionization ion source voltage −3 kV or 3 kV; sheath gas flow 30 L/min; auxiliary gas flow 13 L/min; ion source capillary temperature 250 °C; auxiliary gas heater temperature 380 °C. MS/MS mode (data-dependent acquisition) was recorded in negative and positive ionization, at resolution 70,000 and AGC (ion population) target 3e6, scan range 80 to 1000 m/z.

3.4. Metabolite Identification

Individual compounds were tentatively identified on the basis of low resolution LC-MSn mass spectra if corresponding fragmentation spectra and m/z signals were confirmed in high resolution UPLC-MS/MS. Particular structures were suggested via comparison of the exact molecular masses with ∆ less than 5 ppm, mass spectra and retention times to those of standard compounds, spectra in available databases (PubChem, ChEBI, Metlin, Reaxys, DynLib and KNApSAck) [48,66,81,95,96,97] and literature data. Confirmation of isomeric aglycone type was based on available standard compounds and methods described previously [76]. Pseudo-MS3 spectra of flavonoids O-glycosides with in-source CID 80 eV enabled to confirm fragmentation typical for luteolin based on the presence of product ions at m/z 117 and 135 for and excluded presence of other isomers e.g., kaempferol.

3.5. Bioinformatic Processing

High-resolution raw UPLC-MS/MS data were separately processed by MZmine 2.53 [98] for negative and positive ionization. In first step, lists of masses were generated in each scan of the raw data files (Supplementary File S1). Chromatograms for each exact mass detected over the scans were built by a Chromatogram Builder algorithm. These chromatograms were deconvoluted using an ADAP Wavelets algorithm and subsequently subjected to isotope elimination, adduct and complex searching, followed by retention times normalization among peak lists. Such transformed peaks were aligned across all samples by a Join aligner module. The resulting peak table was completed by supplemental peak detection with a peak finder algorithm prior to missing value imputation (gap-filling). The obtained result table was subjected to further statistical analysis and visualizations.

3.6. Statistical Analysis

Statistical analysis was performed with a Genstat 21 (VSN International, Hempstead United Kingdom). Observations below the detection limit were substituted with half of the minimum non-zero observation for each metabolite and then observations were transformed by log2(x). Two-way analysis of variance (ANOVA) was performed with the experiments as a block (random effects) and organ line as two fixed factors. Analysis was performed together with positive and negative ionization. Significant changes in the accumulation of metabolites was indicated by the effect on an organ, line or by the interaction an organ x line with p-value < 0.05. To select metabolites with significant differences between lines in each organ, the definition of DAM was introduced. Only signals with a significant interaction of line and organ (LxO) or with significant effects on a line (L) were classified as DAMs. Additionally, for each signal, we calculated fold change (FC) in each organ as a ratio of signal intensities in the Bd3-1 and Bd21 lines (Bd3-1/Bd21) to restrict analysed DAMs to those with FC > 2 (|log2(Bd3-1/Bd21)| > 1). Visualizations including PCA 3D plot (generated with data after log2 transformation), heatmaps and Venn diagrams were created in R (R Foundation for Statistical Computing).

3.7. Pathway Enrichment Analyses

Pathway enrichment analyses were conducted with all m/z signals from the combined positive and negative ionization modes and only with m/z signals representing DAMs. Data was imported to a functional analysis module in MetaboAnalyst 5.0 [40]. This enabled direct m/z value annotation to metabolic data base for O. sativa subsp. Japanese from the Kyoto Encyclopedia of Genes and Genomes (KEGG) [35,37]. Signals with significant annotation were further subjected to pathway-level enrichment on the basis of mummichog algorithms in a pathway analysis module of MetaboAnalyst 5.0. This module filtered metabolites over-represented on the pathway level in addition to pathway topology analysis. Enrichment was ranked on the basis of mummichog algorithms followed by Benjamini-Hochberg false discovery rate (FDR) correction. Pathway topology was scored on the basis of relative-betweenness centrality, to estimate the relative importance of individual nodes to the overall pathway network. The node impact values were normalized by the sum of the importance of the pathway to estimate maximum impact of each pathway as 1. Significantly enriched metabolic pathways upon differentiating factors were selected if FDR < 0.03 and pathway impact > 0.3 were consistent across multiple comparisons.

Supplementary Materials

The following supporting information can be downloaded at: https://www.mdpi.com/article/10.3390/molecules27185956/s1, Figure S1: High resolution MS/MS spectra of sulphur-containing dicarboxylic acids; Figure S2: Representative UV chromatograms; Table S1: Scoring of pathway mapping; Table S2: Pathway mapping conducted on m/z signals significantly differentiating roots of Bd21 and Bd3-1 lines; Table S3: Pathway mapping conducted on m/z signals significantly differentiating leaves of Bd21 and Bd3-1 lines; Table S4: Pathway mapping conducted on m/z signals significantly differentiating spikes of Bd21 and Bd3-1 lines; File S1. Parameters of raw MS/MS data processing by MZmine software.

Author Contributions

Conceptualization, P.B. and A.P.; methodology, A.P., A.S., M.P-B. and P.B.; software, A.P. and A.S.; investigation, A.P., N.J.-R. and M.P.-B.; data curation, A.P. and A.S.; writing—original draft preparation, A.P., A.S. and P.B.; writing—review and editing, A.P. and P.B.; supervision, P.B.; funding acquisition, A.P. and P.B. All authors have read and agreed to the published version of the manuscript.

Funding

This work was supported by the National Science Centre SONATA grant (2015/17/D/NZ9/03347) to AP and SONATA BIS grant (2012/07/E/NZ2/04098) to PB.

Institutional Review Board Statement

Not applicable.

Informed Consent Statement

Not applicable.

Data Availability Statement

Most of the data used in the current study is contained within the article. Remaining data that support the findings of this study is available from the corresponding authors upon request.

Acknowledgments

We are grateful to Piotr Kachlicki (Institute for Plant Genetics, Polish Academy of Sciences, Poznań) for substantive support during the revision of the manuscript.

Conflicts of Interest

The authors declare no conflict of interest.

Sample Availability

Samples of the compounds are not available from the authors.

References

  1. Huo, N.; Lazo, G.R.; Vogel, J.P.; You, F.M.; Ma, Y.; Hayden, D.M.; Coleman-Derr, D.; Hill, T.A.; Dvorak, J.; Anderson, O.D.; et al. The nuclear genome of Brachypodium distachyon: Analysis of BAC end sequences. Funct. Integr. Genom. 2008, 8, 135–147. [Google Scholar] [CrossRef] [PubMed]
  2. Brkljacic, J.; Grotewold, E.; Scholl, R.; Mockler, T.; Garvin, D.F.; Vain, P.; Brutnell, T.; Sibout, R.; Bevan, M.; Budak, H.; et al. Brachypodium as a Model for the Grasses: Today and the Future. Plant Physiol. 2011, 157, 3–13. [Google Scholar] [CrossRef]
  3. The International Brachypodium Initiative. Genome sequencing and analysis of the model grass Brachypodium distachyon. Nature 2010, 463, 763–768. [Google Scholar] [CrossRef]
  4. Goodstein, D.M.; Shu, S.Q.; Howson, R.; Neupane, R.; Hayes, R.D.; Fazo, J.; Mitros, T.; Dirks, W.; Hellsten, U.; Putnam, N.; et al. Phytozome: A comparative platform for green plant genomics. Nucleic Acids Res. 2012, 40, D1178–D1186. [Google Scholar] [CrossRef] [PubMed]
  5. Tello-Ruiz, M.K.; Naithani, S.; Gupta, P.; Olson, A.; Wei, S.; Preece, J.; Jiao, Y.P.; Wang, B.; Chougule, K.; Garg, P.; et al. Gramene 2021: Harnessing the power of comparative genomics and pathways for plant research. Nucleic Acids Res. 2021, 49, D1452–D1463. [Google Scholar] [CrossRef]
  6. Gordon, S.P.; Contreras-Moreira, B.; Woods, D.P.; Marais, D.L.D.; Burgess, D.; Shu, S.Q.; Stritt, C.; Roulin, A.C.; Schackwitz, W.; Tyler, L.; et al. Extensive gene content variation in the Brachypodium distachyon pan-genome correlates with population structure. Nat. Commun. 2017, 8, 2184. [Google Scholar] [CrossRef] [PubMed]
  7. Tao, Y.; Nadege, S.W.; Huang, C.; Zhang, P.; Song, S.; Sun, L.; Wu, Y. Brachypodium distachyon is a suitable host plant for study of Barley yellow dwarf virus. Virus Genes 2016, 52, 299–302. [Google Scholar] [CrossRef]
  8. do Amaral, F.P.; Pankievicz, V.C.S.; Arisi, A.C.M.; de Souza, E.M.; Pedrosa, F.; Stacey, G. Differential growth responses of Brachypodium distachyon genotypes to inoculation with plant growth promoting rhizobacteria. Plant Mol. Biol. 2016, 90, 689–697. [Google Scholar] [CrossRef]
  9. Powell, J.J.; Carere, J.; Sablok, G.; Fitzgerald, T.L.; Stiller, J.; Colgrave, M.L.; Gardiner, D.M.; Manners, J.M.; Vogel, J.P.; Henry, R.J.; et al. Transcriptome analysis of Brachypodium during fungal pathogen infection reveals both shared and distinct defense responses with wheat. Sci. Rep. 2017, 7, 17212. [Google Scholar] [CrossRef]
  10. Kong, L.A.; Wu, D.Q.; Cui, J.K.; Huang, W.K.; Peng, H.; Peng, D.L. Testing and modelling the potential of three diploid plants in Poaceae as a new pathosystem to investigate the interactions between cereal hosts and cereal cyst nematode (Heterodera avenae). Plant Pathol. 2016, 65, 682–688. [Google Scholar] [CrossRef]
  11. Priest, H.D.; Fox, S.E.; Rowley, E.R.; Murray, J.R.; Michael, T.P.; Mockler, T.C. Analysis of Global Gene Expression in Brachypodium distachyon Reveals Extensive Network Plasticity in Response to Abiotic Stress. PLoS ONE 2014, 9, e87499. [Google Scholar] [CrossRef]
  12. Onda, Y.; Hashimoto, K.; Yoshida, T.; Sakurai, T.; Sawada, Y.; Hirai, M.Y.; Toyooka, K.; Mochida, K.; Shinozaki, K. Determination of growth stages and metabolic profiles in Brachypodium distachyon for comparison of developmental context with Triticeae crops. Proc. R. Soc. B 2015, 282, 20150964. [Google Scholar] [CrossRef]
  13. Onda, Y.; Inoue, K.; Sawada, Y.; Shimizu, M.; Takahagi, K.; Uehara-Yamaguchi, Y.; Hirai, M.Y.; Garvin, D.F.; Mochida, K. Genetic Variation for Seed Metabolite Levels in Brachypodium distachyon. Int. J. Mol. Sci. 2019, 20, 2348. [Google Scholar] [CrossRef] [PubMed]
  14. Lopez-Alvarez, D.; Zubair, H.; Beckmann, M.; Draper, J.; Catalan, P. Diversity and association of phenotypic and metabolomic traits in the close model grasses Brachypodium distachyon, B. stacei and B. hybridum. Ann. Bot. 2017, 119, 545–561. [Google Scholar] [PubMed]
  15. Pasquet, J.C.; Chaouch, S.; Macadre, C.; Balzergue, S.; Huguet, S.; Martin-Magniette, M.L.; Bellvert, F.; Deguercy, X.; Thareau, V.; Heintz, D.; et al. Differential gene expression and metabolomic analyses of Brachypodium distachyon infected by deoxynivalenol producing and non-producing strains of Fusarium graminearum. BMC Genom. 2014, 15, 629. [Google Scholar] [CrossRef] [PubMed]
  16. Fisher, L.H.C.; Han, J.W.; Corke, F.M.K.; Akinyemi, A.; Didion, T.; Nielsen, K.K.; Doonan, J.H.; Mur, L.A.J.; Bosch, M. Linking Dynamic Phenotyping with Metabolite Analysis to Study Natural Variation in Drought Responses of Brachypodium distachyon. Front. Plant Sci. 2016, 7, 1751. [Google Scholar] [CrossRef] [PubMed]
  17. Shi, H.; Ye, T.; Song, B.; Qi, X.; Chan, Z. Comparative physiological and metabolomic responses of four Brachypodium distachyon varieties contrasting in drought stress resistance. Acta Physiol. Plant. 2015, 37, 122. [Google Scholar] [CrossRef]
  18. Handakumbura, P.P.; Stanfill, B.; Rivas-Ubach, A.; Fortin, D.; Vogel, J.P.; Jansson, C. Metabotyping as a Stopover in Genome-to-Phenome Mapping. Sci. Rep. 2019, 9, 1858. [Google Scholar] [CrossRef] [PubMed]
  19. Skalska, A.; Beckmann, M.; Corke, F.; Savas Tuna, G.; Tuna, M.; Doonan, J.H.; Hasterok, R.; Mur, L.A.J. Metabolomic Variation Aligns with Two Geographically Distinct Subpopulations of Brachypodium distachyon before and after Drought Stress. Cells 2021, 10, 683. [Google Scholar] [CrossRef]
  20. Piasecka, A.; Jedrzejczak-Rey, N.; Bednarek, P. Secondary metabolites in plant innate immunity: Conserved function of divergent chemicals. New Phytol. 2015, 206, 948–964. [Google Scholar] [CrossRef]
  21. Weng, J.-K.; Philippe, R.N.; Noel, J.P. The Rise of Chemodiversity in Plants. Science 2012, 336, 1667–1670. [Google Scholar] [CrossRef] [PubMed]
  22. Vogt, T. Phenylpropanoid Biosynthesis. Mol. Plant 2010, 3, 2–20. [Google Scholar] [CrossRef] [PubMed]
  23. Garvin, D.F.; Gu, Y.-Q.; Hasterok, R.; Hazen, S.P.; Jenkins, G.; Mockler, T.C.; Mur, L.A.J.; Vogel, J.P. Development of Genetic and Genomic Research Resources for Brachypodium distachyon, a New Model System for Grass Crop Research. Crop Sci. 2008, 48, S-69–S-84. [Google Scholar] [CrossRef]
  24. Vogel, J.P.; Garvin, D.F.; Leong, O.M.; Hayden, D.M. Agrobacterium-mediated transformation and inbred line development in the model grass Brachypodium distachyon. Plant Cell Tiss. Org. Cult. 2006, 84, 199–211. [Google Scholar] [CrossRef]
  25. Ingram, P.A.; Zhu, J.; Shariff, A.; Davis, I.W.; Benfey, P.N.; Elich, T. High-throughput imaging and analysis of root system architecture in Brachypodium distachyon under differential nutrient availability. Philos. Trans. R. Soc. Lond. Ser. B Biol. Sci. 2012, 367, 1559–1569. [Google Scholar] [CrossRef]
  26. Cui, Y.; Lee, M.Y.; Huo, N.; Bragg, J.; Yan, L.; Yuan, C.; Li, C.; Holditch, S.J.; Xie, J.; Luo, M.-C.; et al. Fine Mapping of the Bsr1 Barley Stripe Mosaic Virus Resistance Gene in the Model Grass Brachypodium distachyon. PLoS ONE 2012, 7, e38333. [Google Scholar] [CrossRef]
  27. Lee, M.Y.; Yan, L.; Gorter, F.A.; Kim, B.Y.T.; Cui, Y.; Hu, Y.; Yuan, C.; Grindheim, J.; Ganesan, U.; Liu, Z.; et al. Brachypodium distachyon line Bd3-1 resistance is elicited by the barley stripe mosaic virus triple gene block 1 movement protein. J. Gen. Virol. 2012, 93, 2729–2739. [Google Scholar] [CrossRef]
  28. Gill, U.S.; Lee, S.; Jia, Y.; Mysore, K.S. Exploring natural variation for rice sheath blight resistance in Brachypodium distachyon. Plant Signal. Behav. 2019, 14, 1546527. [Google Scholar] [CrossRef]
  29. Gill, U.S.; Uppalapati, S.R.; Nakashima, J.; Mysore, K.S. Characterization of Brachypodium distachyon as a nonhost model against switchgrass rust pathogen Puccinia emaculata. BMC Plant Biol. 2015, 15, 113. [Google Scholar] [CrossRef]
  30. Peraldi, A.; Griffe, L.L.; Burt, C.; McGrann, G.R.D.; Nicholson, P. Brachypodium distachyon exhibits compatible interactions with Oculimacula spp. and Ramularia collo-cygni, providing the first pathosystem model to study eyespot and ramularia leaf spot diseases. Plant Pathol. 2014, 63, 554–562. [Google Scholar] [CrossRef] [Green Version]
  31. Kouzai, Y.; Kimura, M.; Watanabe, M.; Kusunoki, K.; Osaka, D.; Suzuki, T.; Matsui, H.; Yamamoto, M.; Ichinose, Y.; Toyoda, K.; et al. Salicylic acid-dependent immunity contributes to resistance against Rhizoctonia solani, a necrotrophic fungal agent of sheath blight, in rice and Brachypodium distachyon. New Phytol. 2018, 217, 771–783. [Google Scholar] [CrossRef]
  32. Jiang, Y.; Wang, X.; Yu, X.; Zhao, X.; Luo, N.; Pei, Z.; Liu, H.; Garvin, D.F. Quantitative Trait Loci Associated with Drought Tolerance in Brachypodium distachyon. Front. Plant Sci. 2017, 8, 811. [Google Scholar] [CrossRef] [PubMed]
  33. Bednarek, P.; Franski, R.; Kerhoas, L.; Einhorn, J.; Wojtaszek, P.; Stobiecki, M. Profiling changes in metabolism of isoflavonoids and their conjugates in Lupinus albus treated with biotic elicitor. Phytochemistry 2001, 56, 77–85. [Google Scholar] [CrossRef]
  34. Bednarek, P.; Schneider, B.; Svatos, A.; Oldham, N.J.; Hahlbrock, K. Structural complexity, differential response to infection, and tissue specificity of indolic and phenylpropanoid secondary metabolism in Arabidopsis roots. Plant Physiol. 2005, 138, 1058–1070. [Google Scholar] [CrossRef] [PubMed]
  35. Naithani, S.; Gupta, P.; Preece, J.; D’Eustachio, P.; Elser, J.L.; Garg, P.; Dikeman, D.A.; Kiff, J.; Cook, J.; Olson, A.; et al. Plant Reactome: A knowledgebase and resource for comparative pathway analysis. Nucleic Acids Res. 2019, 48, D1093–D1103. [Google Scholar] [CrossRef]
  36. Zhou, S.; Kremling, K.A.; Bandillo, N.; Richter, A.; Zhang, Y.K.; Ahern, K.R.; Artyukhin, A.B.; Hui, J.X.; Younkin, G.C.; Schroeder, F.C.; et al. Metabolome-Scale Genome-Wide Association Studies Reveal Chemical Diversity and Genetic Control of Maize Specialized Metabolites. Plant Cell 2019, 31, 937–955. [Google Scholar] [CrossRef]
  37. Kanehisa, M.; Goto, S. KEGG: Kyoto Encyclopedia of Genes and Genomes. Nucleic Acids Res. 2000, 28, 27–30. [Google Scholar] [CrossRef]
  38. Minen, R.I.; Martinez, M.P.; Iglesias, A.A.; Figueroa, C.M. Biochemical characterization of recombinant UDP-sugar pyrophosphorylase and galactinol synthase from Brachypodium distachyon. Plant Physiol. Biochem. 2020, 155, 780–788. [Google Scholar] [CrossRef]
  39. Kroymann, J.; Textor, S.; Tokuhisa, J.G.; Falk, K.L.; Bartram, S.; Gershenzon, J.; Mitchell-Olds, T. A gene controlling variation in Arabidopsis glucosinolate composition is part of the methionine chain elongation pathway. Plant Physiol. 2001, 127, 1077–1088. [Google Scholar] [CrossRef]
  40. Pan, L.; Meng, C.; Wang, J.; Ma, X.; Fan, X.; Yang, Z.; Zhou, M.; Zhang, X. Integrated omics data of two annual ryegrass (Lolium multiflorum L.) genotypes reveals core metabolic processes under drought stress. BMC Plant Biol. 2018, 18, 26. [Google Scholar] [CrossRef] [Green Version]
  41. Yamamoto, N.; Takano, T.; Tanaka, K.; Ishige, T.; Terashima, S.; Endo, C.; Kurusu, T.; Yajima, S.; Yano, K.; Tada, Y. Comprehensive analysis of transcriptome response to salinity stress in the halophytic turf grass Sporobolus virginicus. Front. Plant Sci. 2015, 6, 241. [Google Scholar] [CrossRef] [PubMed]
  42. Murphy, K.M.; Zerbe, P. Specialized diterpenoid metabolism in monocot crops: Biosynthesis and chemical diversity. Phytochemistry 2020, 172, 112289. [Google Scholar] [CrossRef] [PubMed]
  43. Hardtke, C.S. Gibberellin Signaling: GRASs Growing Roots Dispatch. Curr. Biol. 2003, 13, R366–R367. [Google Scholar] [CrossRef]
  44. Reyes-Hernández, B.J.; Srivastava, A.C.; Ugartechea-Chirino, Y.; Shishkova, S.; Ramos-Parra, P.A.; Lira-Ruan, V.; Díaz de la Garza, R.I.; Dong, G.; Moon, J.-C.; Blancaflor, E.B.; et al. The root indeterminacy-to-determinacy developmental switch is operated through a folate-dependent pathway in Arabidopsis thaliana. New Phytol. 2014, 202, 1223–1236. [Google Scholar] [CrossRef] [PubMed]
  45. Ashihara, H.; Stasolla, C.; Fujimura, T.; Crozier, A. Purine salvage in plants. Phytochemistry 2018, 147, 89–124. [Google Scholar] [CrossRef]
  46. Trabucco, G.M.; Matos, D.A.; Lee, S.J.; Saathoff, A.J.; Priest, H.D.; Mockler, T.C.; Sarath, G.; Hazen, S.P. Functional characterization of cinnamyl alcohol dehydrogenase and caffeic acid O-methyltransferase in Brachypodium distachyon. BMC Biotechnol. 2013, 13, 61. [Google Scholar] [CrossRef]
  47. Sumner, L.W.; Amberg, A.; Barrett, D.; Beale, M.H.; Beger, R.; Daykin, C.A.; Fan, T.W.M.; Fiehn, O.; Goodacre, R.; Griffin, J.L.; et al. Proposed minimum reporting standards for chemical analysis. Metabolomics 2007, 3, 211–221. [Google Scholar] [CrossRef] [PubMed]
  48. Degtyarenko, K.; De Matos, P.; Ennis, M.; Hastings, J.; Zbinden, M.; McNaught, A.; Alcantara, R.; Darsow, M.; Guedj, M.; Ashburner, M. ChEBI: A database and ontology for chemical entities of biological interest. Nucleic Acids Res. 2008, 36, D344–D350. [Google Scholar] [CrossRef]
  49. Kushnir, M.M.; Urry, F.M.; Frank, E.L.; Roberts, W.L.; Shushan, B. Analysis of catecholamines in urine by positive-ion electrospray tandem mass spectrometry. Clin. Chem. 2002, 48, 323–331. [Google Scholar] [CrossRef]
  50. Thiele, B.; Füllner, K.; Stein, N.; Oldiges, M.; Kuhn, A.J.; Hofmann, D. Analysis of amino acids without derivatization in barley extracts by LC-MS-MS. Anal. Bioanal. Chem. 2008, 391, 2663–2672. [Google Scholar] [CrossRef]
  51. Ogura, Y.; Ishihara, A.; Iwamura, H. Induction of Hydroxycinnamic Acid Amides and Tryptophan by Jasmonic Acid, Abscisic Acid and Osmotic Stress in Barley Leaves. Z. Naturforsch. C 2001, 56, 193–202. [Google Scholar] [CrossRef] [PubMed]
  52. Sarnoski, P.J.; Boyer, R.R.; O’Keefe, S.F. Application of proanthocyanidins from peanut skins as a natural yeast inhibitory agent. J. Food Sci. 2012, 77, M242–M249. [Google Scholar] [CrossRef] [PubMed]
  53. Stobiecki, M.; Skirycz, A.; Kerhoas, L.; Kachlicki, P.; Muth, D.; Einhorn, J.; Mueller-Roeber, B. Profiling of phenolic glycosidic conjugates in leaves of Arabidopsis thaliana using LC/MS. Metabolomics 2006, 2, 197–219. [Google Scholar] [CrossRef]
  54. Parveen, I.; Wilson, T.; Donnison, I.S.; Cookson, A.R.; Hauck, B.; Threadgill, M.D. Potential sources of high value chemicals from leaves, stems and flowers of Miscanthus sinensis ‘Goliath’ and Miscanthus sacchariflorus. Phytochemistry 2013, 92, 160–167. [Google Scholar] [CrossRef]
  55. Klausen, K.; Mortensen, A.G.; Laursen, B.; Haselmann, K.F.; Jespersen, B.M.; Fomsgaard, I.S. Phenolic Compounds in Different Barley Varieties: Identification by Tandem Mass Spectrometry (QStar) and NMR; Quantification by Liquid Chromatography Triple Quadrupole-Linear Ion Trap Mass Spectrometry (Q-Trap). Nat. Prod. Commun. 2010, 5, 407–414. [Google Scholar] [CrossRef] [PubMed]
  56. Clifford, M.N.; Johnston, K.L.; Knight, S.; Kuhnert, N. Hierarchical scheme for LC-MSn identification of chlorogenic acids. J. Agric. Food Chem. 2003, 51, 2900–2911. [Google Scholar] [CrossRef]
  57. Cuyckens, F.; Claeys, M. Determination of the glycosylation site in flavonoid mono-O-glycosides by collision-induced dissociation of electrospray-generated deprotonated and sodiated molecules. J. Mass Spectrom. 2005, 40, 364–372. [Google Scholar] [CrossRef]
  58. Piasecka, A.; Sawikowska, A.; Krajewski, P.; Kachlicki, P. Combined mass spectrometric and chromatographic methods for in-depth analysis of phenolic secondary metabolites in barley leaves. J. Mass Spectrom. 2015, 50, 513–532. [Google Scholar] [CrossRef]
  59. Handrick, V.; Vogt, T.; Frolov, A. Profiling of hydroxycinnamic acid amides in Arabidopsis thaliana pollen by tandem mass spectrometry. Anal. Bioanal. Chem. 2010, 398, 2789–2801. [Google Scholar] [CrossRef]
  60. Moheb, A.; Ibrahim, R.K.; Roy, R.; Sarhan, F. Changes in wheat leaf phenolome in response to cold acclimation. Phytochemistry 2011, 72, 2294–2307. [Google Scholar] [CrossRef]
  61. von Ropenack, E.; Parr, A.; Schulze-Lefert, P. Structural analyses and dynamics of soluble and cell wall-bound phenolics in a broad spectrum resistance to the powdery mildew fungus in barley. J. Biol. Chem. 1998, 273, 9013–9022. [Google Scholar] [CrossRef] [PubMed]
  62. Ferreres, F.; Andrade, P.B.; Valentão, P.; Gil-Izquierdo, A. Further knowledge on barley (Hordeum vulgare L.) leaves O-glycosyl-C-glycosyl flavones by liquid chromatography-UV diode-array detection-electrospray ionisation mass spectrometry. J. Chromatogr. 2008, 1182, 56–64. [Google Scholar] [CrossRef] [PubMed]
  63. Lallemand, L.A.; Zubieta, C.; Lee, S.G.; Wang, Y.; Acajjaoui, S.; Timmins, J.; McSweeney, S.; Jez, J.M.; McCarthy, J.G.; McCarthy, A.A. A Structural Basis for the Biosynthesis of the Major Chlorogenic Acids Found in Coffee. Plant Physiol. 2012, 160, 249–260. [Google Scholar] [CrossRef] [PubMed]
  64. Smirnoff, N. Ascorbic acid metabolism and functions: A comparison of plants and mammals. Free Radic. Biol. Med. 2018, 122, 116–129. [Google Scholar] [CrossRef] [PubMed]
  65. Parveen, I.; Winters, A.; Threadgill, M.D.; Hauck, B.; Morris, P. Extraction, structural characterisation and evaluation of hydroxycinnamate esters of orchard grass (Dactylis glomerata) as substrates for polyphenol oxidase. Phytochemistry 2008, 69, 2799–2806. [Google Scholar] [CrossRef]
  66. Desmet, S.; Saeys, Y.; Verstaen, K.; Dauwe, R.; Kim, H.; Niculaes, C.; Fukushima, A.; Goeminne, G.; Vanholme, R.; Ralph, J.; et al. Maize specialized metabolome networks reveal organ-preferential mixed glycosides. Comput. Struct. Biotechnol. J. 2021, 19, 1127–1144. [Google Scholar] [CrossRef] [PubMed]
  67. Kuczkowiak, U.; Petereit, F.; Nahrstedt, A. Hydroxycinnamic Acid Derivatives Obtained from a Commercial Crataegus Extract and from Authentic Crataegus spp. Sci. Pharm. 2014, 82, 835–846. [Google Scholar] [CrossRef]
  68. Renault, H.; Alber, A.; Horst, N.A.; Basilio Lopes, A.; Fich, E.A.; Kriegshauser, L.; Wiedemann, G.; Ullmann, P.; Herrgott, L.; Erhardt, M.; et al. A phenol-enriched cuticle is ancestral to lignin evolution in land plants. Nat. Commun. 2017, 8, 14713. [Google Scholar] [CrossRef]
  69. Krzyzanowska-Kowalczyk, J.; Pecio, L.; Moldoch, J.; Ludwiczuk, A.; Kowalczyk, M. Novel Phenolic Constituents of Pulmonaria officinalis L. LC-MS/MS Comparison of Spring and Autumn Metabolite Profiles. Molecules 2018, 23, 2277. [Google Scholar] [CrossRef]
  70. Cadahía, E.; Fernández de Simón, B.; Aranda, I.; Sanz, M.; Sánchez-Gómez, D.; Pinto, E. Non-targeted Metabolomic Profile of Fagus Sylvatica L. Leaves using Liquid Chromatography with Mass Spectrometry and Gas Chromatography with Mass Spectrometry. Phytochem. Anal. 2015, 26, 171–182. [Google Scholar] [CrossRef]
  71. Zeng, Z.C.; Liu, C.M.; Luo, S.J.; Chen, J.; Gong, E.S. The Profile and Bioaccessibility of Phenolic Compounds in Cereals Influenced by Improved Extrusion Cooking Treatment. PLoS ONE 2016, 11, e0161086. [Google Scholar] [CrossRef]
  72. Carere, J.; Powell, J.; Fitzgerald, T.; Kazan, K.; Gardiner, D.M. BdACT2a encodes an agmatine coumaroyl transferase required for pathogen defence in Brachypodium distachyon. Physiol. Mol. Plant Pathol. 2018, 104, 69–76. [Google Scholar] [CrossRef]
  73. Jin, S.; Yoshida, M. Antifungal Compound, Feruloylagmatine, Induced in Winter Wheat Exposed to a Low Temperature. Biosci. Biotechnol. Biochem. 2000, 64, 1614–1617. [Google Scholar] [CrossRef] [PubMed]
  74. Stevenson, P.C.; Green, P.W.C.; Farrell, I.W.; Brankin, A.; Mvumi, B.M.; Belmain, S.R. Novel Agmatine Derivatives in Maerua edulis With Bioactivity Against Callosobruchus maculatus, a Cosmopolitan Storage Insect Pest. Front. Plant Sci. 2018, 9, 1506. [Google Scholar] [CrossRef] [PubMed]
  75. Wojakowska, A.; Perkowski, J.; Goral, T.; Stobiecki, M. Structural characterization of flavonoid glycosides from leaves of wheat (Triticum aestivum L.) using LC/MS/MS profiling of the target compounds. J. Mass Spectrom. 2013, 48, 329–339. [Google Scholar] [CrossRef] [PubMed]
  76. Wojakowska, A.; Piasecka, A.; García-López, P.M.; Zamora-Natera, F.; Krajewski, P.; Marczak, Ł.; Kachlicki, P.; Stobiecki, M. Structural analysis and profiling of phenolic secondary metabolites of Mexican lupine species using LC–MS techniques. Phytochemistry 2013, 92, 71–86. [Google Scholar] [CrossRef]
  77. Asenstorfer, R.E.; Wang, Y.; Mares, D.J. Chemical structure of flavonoid compounds in wheat (Triticum aestivum L.) flour that contribute to the yellow colour of Asian alkaline noodles. J. Cereal Sci. 2006, 43, 108–119. [Google Scholar] [CrossRef]
  78. Frost, S.; Harborne, J.B.; King, L. Identification of the flavonoids in five chemical races of cultivated barley. Hereditas 1977, 85, 163–168. [Google Scholar] [CrossRef]
  79. Kachlicki, P.; Einhorn, J.; Muth, D.; Kerhoas, L.; Stobiecki, M. Evaluation of glycosylation and malonylation patterns in flavonoid glycosides during LC/MS/MS metabolite profiling. J. Mass Spectrom. 2008, 43, 572–586. [Google Scholar] [CrossRef]
  80. Ferreres, F.; Gil-Izquierdo, A.; Andrade, P.B.; Valentao, P.; Tomas-Barberan, F.A. Characterization of C-glycosyl flavones O-glycosylated by liquid chromatography-tandem mass spectrometry. J. Chromatogr. 2007, 1161, 214–223. [Google Scholar] [CrossRef]
  81. Guijas, C.; Montenegro-Burke, J.R.; Domingo-Almenara, X.; Palermo, A.; Warth, B.; Hermann, G.; Koellensperger, G.; Huan, T.; Uritboonthai, W.; Aisporna, A.E.; et al. METLIN: A Technology Platform for Identifying Knowns and Unknowns. Anal. Chem. 2018, 90, 3156–3164. [Google Scholar] [CrossRef] [PubMed]
  82. Falcone Ferreyra, M.L.; Rodriguez, E.; Casas, M.I.; Labadie, G.; Grotewold, E.; Casati, P. Identification of a Bifunctional Maize C- and O-Glucosyltransferase. J. Biol. Chem. 2013, 288, 31678–31688. [Google Scholar] [CrossRef] [PubMed]
  83. Brazier-Hicks, M.; Evans, K.M.; Gershater, M.C.; Puschmann, H.; Steel, P.G.; Edwards, R. The C-Glycosylation of Flavonoids in Cereals. J. Biol. Chem. 2009, 284, 17926–17934. [Google Scholar] [CrossRef]
  84. Brauch, D.; Porzel, A.; Schumann, E.; Pillen, K.; Mock, H.-P. Changes in isovitexin-O-glycosylation during the development of young barley plants. Phytochemistry 2018, 148, 11–20. [Google Scholar] [CrossRef]
  85. Ohkawa, M.; Kinjo, J.; Hagiwara, Y.; Hagiwara, H.; Ueyama, H.; Nakamura, K.; Ishikawa, R.; Ono, M.; Nohara, T. Three New Anti-Oxidative Saponarin Analogs from Young green Barley Leaves. Chem. Pharm. Bull. 1998, 46, 1887–1890. [Google Scholar] [CrossRef]
  86. Norbaek, R.; Aaboer, D.B.F.; Bleeg, I.S.; Christensen, B.T.; Kondo, T.; Brandt, K. Flavone C-glycoside, phenolic acid, and nitrogen contents in leaves of barley subject to organic fertilization treatments. J. Agric. Food Chem. 2003, 51, 809–813. [Google Scholar] [CrossRef] [PubMed]
  87. Ishihara, A.; Ogura, Y.; Tebayashi, S.; Iwamura, H. Jasmonate-induced changes in flavonoid metabolism in barley (Hordeum vulgare) leaves. Biosci. Biotechnol. Biochem. 2002, 66, 2176–2182. [Google Scholar] [CrossRef] [PubMed]
  88. Lin, L.Z.; Sun, J.H.; Chen, P.; Monagas, M.J.; Harnly, J.M. UHPLC-PDA-ESUHRMSn Profiling Method To Identify and Quantify Oligomeric Proanthocyanidins in Plant Products. J. Agric. Food Chem. 2014, 62, 9387–9400. [Google Scholar] [CrossRef]
  89. Rue, E.A.; Rush, M.D.; van Breemen, R.B. Procyanidins: A comprehensive review encompassing structure elucidation via mass spectrometry. Phytochem. Rev. 2018, 17, 1–16. [Google Scholar] [CrossRef]
  90. Zhu, F. Proanthocyanidins in cereals and pseudocereals. Crit. Rev. Food Sci. Nutr. 2019, 59, 1521–1533. [Google Scholar] [CrossRef]
  91. Verardo, V.; Cevoli, C.; Pasini, F.; Gómez-Caravaca, A.M.; Marconi, E.; Fabbri, A.; Caboni, M.F. Analysis of Oligomer Proanthocyanidins in Different Barley Genotypes Using High-Performance Liquid Chromatography–Fluorescence Detection–Mass Spectrometry and Near-Infrared Methodologies. J. Agric. Food Chem. 2015, 63, 4130–4137. [Google Scholar] [CrossRef] [PubMed]
  92. Mochida, K.; Uehara-Yamaguchi, Y.; Takahashi, F.; Yoshida, T.; Sakurai, T.; Shinozaki, K. Large-scale collection and analysis of full-length cDNAs from Brachypodium distachyon and integration with Pooideae sequence resources. PLoS ONE 2013, 8, e75265. [Google Scholar]
  93. Ölschläger, C.; Regos, I.; Zeller, F.J.; Treutter, D. Identification of galloylated propelargonidins and procyanidins in buckwheat grain and quantification of rutin and flavanols from homostylous hybrids originating from F. Esculentum × F. homotropicum. Phytochemistry 2008, 69, 1389–1397. [Google Scholar] [CrossRef]
  94. Stauss, R. Compendium of Growth Stage Identification Keys for Mono- and Dicotyledoneus Plants: Extended BBCH Scale; Ciba-Geigy: Basel, Switzerland, 1994; p. 94. [Google Scholar]
  95. Afendi, F.M.; Okada, T.; Yamazaki, M.; Hirai-Morita, A.; Nakamura, Y.; Nakamura, K.; Ikeda, S.; Takahashi, H.; Altaf-Ul-Amin, M.; Darusman, L.K.; et al. KNApSAcK Family Databases: Integrated Metabolite-Plant Species Databases for Multifaceted Plant Research. Plant Cell Physiol. 2012, 53, e1. [Google Scholar] [CrossRef] [PubMed]
  96. Goodman, J. Reaxys. J. Chem. Inf. Model. 2009, 49, 2897–2898. [Google Scholar] [CrossRef]
  97. Sayers, E.W.; Agarwala, R.; Bolton, E.E.; Brister, J.R.; Canese, K.; Clark, K.; Connor, R.; Fiorini, N.; Funk, K.; Hefferon, T.; et al. Database resources of the National Center for Biotechnology Information. Nucleic Acids Res. 2019, 47, D23–D28. [Google Scholar] [CrossRef]
  98. Pluskal, T.; Castillo, S.; Villar-Briones, A.; Oresic, M. MZmine 2: Modular framework for processing, visualizing, and analyzing mass spectrometry-based molecular profile data. BMC Bioinform. 2010, 11, 395. [Google Scholar] [CrossRef] [PubMed] [Green Version]
Figure 1. Three-dimensional principal component analysis (PCA) plot of global metabolite profiles in leaves (green), spikes (blue) and roots (red) of Brachypodium Bd21 (light colours) and Bd3-1 (dark colours) lines.
Molecules 27 05956 g001
Figure 2. Venn diagrams indicating (A) number of shared and unique signals (p-value < 0.01) in Brachypodium with significant effect of organ (O), line (L), or interaction organ × line (O × L); (B) number of shared and organ-specific differentially accumulating metabolites (DAMs) defined as signals meeting the conditions: p-value < 0.05 for factor L or O × L; |log2 (fold change)| > 1.5, where fold change was Bd3-1/Bd21 signal intensities.
Molecules 27 05956 g002
Figure 4. Low resolution MS2 and MS3 fragmentation spectra obtained in negative ionization of isomeric hydroxycinnamoyl-quinic acid (HQA) conjugates with hydroxycinnamic acids. (A) compound 43, 4-feruloylquinic acid, (B) compound 26, 5-feruloylqiunic acid. Postulated structures and proposed simplified fragmentation schemes are shown. The product ions subjected to fragmentation in MS3 or MS4 are indicated with turned squares at the ion apexes.
Molecules 27 05956 g004
Figure 5. High resolution MS/MS spectra with simplified fragmentation schemes obtained in negative ionization. (A) compound 42, feruloylthreonic acid, and (B) compound 18, caffeoylthreonic acid. Postulated structures are shown as 2-O-threonate, however, precise esterification position on threonic acid cannot be solved by MS fragmentation analysis.
Molecules 27 05956 g005
Figure 6. Representative chromatogram (A) and high-resolution MS/MS spectra obtained in positive ionization of two isomeric structures of p-coumaroyl-N-putrescine (B) compound 10 and (C) compound 12. Postulated structure and proposed simplified fragmentation schemes are shown.
Molecules 27 05956 g006
Figure 7. Identification of isomeric structures of apigenin di-glucosides in Brachypodium based on low-resolution MS2, MS3 and MS4 fragmentation spectra obtained in negative ionization. (A) Compound 57, apigenin 6,8-di-C-glucoside, (B) compound 68, apigenin 6-C-[6″-O-glucoside]-glucoside, (C) compound 69, apigenin 6-C-[2″-O-glucoside]-glucoside, (D) compound 79 isovitexin 7.
Molecules 27 05956 g007
Figure 8. Low-resolution MS2 and MS3 fragmentation spectra obtained in negative ionization supporting identification of compound 15, prodelphinidin B-type structure. Postulated structure and proposed simplified fragmentation scheme are shown. The product ions subjected to fragmentation in MS3 or MS4 are indicated with turned squares at the ion apexes.
Molecules 27 05956 g008
Table 1. The most represented metabolic pathways based on pathway enrichment analysis performed with all MS signals detected in Brachypodium roots, leaves and spikes. KEGG—Kyoto Encyclopedia of Genes and Genomes [37]; total—number of compounds included in biological pathway in the database; hits—number of compounds matched in our analysis; FDR—false discovery rate; impact—pathway impact value related to the number of links occurred upon a node in pathway topology graph. Full set of data including other pathways as well as lists of annotated metabolites is available as Supplementary Table S1.
Biological Pathway (KEGG)TotalHitsFDRImpact
Flavonoid biosynthesis47404.31 × 10−60.75288
Galactose metabolism27252.72 × 10−51
Amino sugar and nucleotide sugar metabolism50390.0001770.92767
Valine, leucine and isoleucine biosynthesis22200.0004260.99998
Pentose and glucuronate interconversions17160.0009711
Flavone and flavonol biosynthesis12120.0015391
2-Oxocarboxylic acid metabolism12120.0015391
Pentose phosphate pathway19160.0109950.9532
Purine metabolism63420.0115040.67941
Tyrosine metabolism18150.0145840.79191
Ascorbate and aldarate metabolism18150.0145840.8806
Vitamin B6 metabolism11100.0260260.96153
Table 2. Metabolic pathways discriminating Bd21 and Bd3-1 lines in particular organs selected based on pathway enrichment analysis performed with MS signals representing differentially accumulating metabolites (DAMs). KEGG—Kyoto Encyclopedia of Genes and Genomes [37]; total—number of compounds included in biological pathway in the database; hits—number of compounds matched in our analysis; FDR—false discovery rate; impact—pathway impact value related to the number of links occurred upon a node in pathway topology graph. Full sets of data including other pathways as well as lists of annotated metabolites are available as Supplementary Table S2 (roots), Supplementary Table S3 (leaves) and Supplementary Table S4 (spikes).
Biological Pathway Enrichment (KEGG)TotalHitsFDRImpact
RootsGalactose metabolism27257.41 × 10−71
Diterpenoid biosynthesis47320.0012530.61959
Flavonoid biosynthesis47320.0012530.64212
Valine, leucine and isoleucine biosynthesis22180.0012530.68294
Caffeine metabolism10100.0016360
Pentose phosphate pathway19150.0076660.85473
One carbon pool by folate880.0076661
Flavone and flavonol biosynthesis12100.0250630
2-Oxocarboxylic acid metabolism12100.0250630
LeavesFlavonoid biosynthesis47422.39 × 10−60.7644
Galactose metabolism27240.0019791
Valine, leucine and isoleucine biosynthesis22200.0030650.8355
Histidine metabolism17160.0048911
Flavone and flavonol biosynthesis12120.00540
2-Oxocarboxylic acid metabolism12120.00540
Pentose phosphate pathway19170.0074340.99999
Vitamin B6 metabolism11110.0079080.99999
Diterpenoid biosynthesis47340.0280470.69919
SpikesFlavonoid biosynthesis47413.39 × 10−50.75288
Galactose metabolism27250.0003671
Pentose phosphate pathway19180.0026280.99999
Valine, leucine and isoleucine biosynthesis22200.0032640.8355
Flavone and flavonol biosynthesis12120.0068080
2-Oxocarboxylic acid metabolism12120.0068080
Vitamin B6 metabolism11110.0111730.99999
Pentose and glucuronate interconversions17150.0210230.85716
Histidine metabolism17150.0210231
Cysteine and methionine metabolism46340.0210230.75798
Table 3. Specialized metabolites identified in leaves, roots and spikes of Brachypodium, using two complementary MS systems: HPLC-ESI-MSn and UPLC-HR-MS/MS. Chemical formulas were calculated on the basis of accurate masses measured in HR-MS/MS, and fragmentation pathways are given on the basis of ESI-MSn. The main peaks in MS2 or MS3 taken for further fragmentation are highlighted in bold. Identification levels are given according to the Metabolomics Standards Initiative recommendation [47]. ChEBI—respective identifiers of chemical structure in the Chemical Entities of Biological Interest database [48]. *—indicates detection of metabolites in particular organs. #—ChEBI identifiers for other optic isomers of the compound: 75667, 75666, 75668, 75672, 75670, 75669. Std.—identification supported with analysis of available standard compounds; sh—spectrum shoulder.
#Fragmentation Pathway in MSn [m/z]IdentificationExact mass of [M+H]+ or [M−H]; [Da]∆ ppmChemical Formulaλmax [nm]LeavesRootsSpikesChEBIIdentification Level References
Negative IonizationPositive IonizationIon TypeMeasuredCalculated
1 MS2: 137, 90, 64Dopamine[M+H]+154.08638154.08640.8102C8H11NO2 ***182432[49]
2 MS2: 165, 147, 136
MS3: 147, 123
Tyrosine[M+H]+182.081 182.0812−1.1348C9H11NO3 ** 181862[50]
3 MS2: 116, 86Leucine (Isoleucine)[M+H]+132.1018 132.1019−0.5152C6H13NO2 ***250172[50]
4 MS2: 163, 89
MS3: 131
N-Caffeoyl-putrescine[M+H]+251.13862 251.139−1.589C13H18N2O3 ***174173[51]
5 MS2: 145, 120
MS3: 79
Phenylalanine[M+H]+166.086 166.0863−1.3614C9H11NO2260***280442[50]
6MS2: 727, 609, 559, 541, 483, 423, 303
MS3: 559, 423, 303
(epi)Gallocatechin trimer[M−H]913.18583 913.18332.791C45H38O21 *** 3[52]
7MS2: 771, 711, 593, 543, 467, 303, 289
MS3: 697, 543, 289
Proanthocyanidins trimer A-type[M−H]897.19086 897.18842.779C45H38O20 * 3[52]
8MS2: 305, 265, 223, 205, 161, 143, 125
MS3: 223, 205
Caffeic acid derivative[M−H]367.12504367.12461.24C17H20O9 * 1497822[53]
9MS2: 269, 209, 167 Vanilic acid-hexoside[M−H]329.0883329.08781.5932C14H18O9 * * 2[54]
10 MS2: 218, 89p-Coumaroyl-N-putrescine[M+H]+235.1441235.14410.0370C13H18N2O290sh** 704312[51]
11 MS2: 248, 177, 144, 114, 98
MS3: 145
Feruloyl-N-putrescine[M+H]+265.15424265.1547−1.16337C14H20N2O3 ** 92993[51]
12MS2: 233, 119
MS3: 117, 93
MS2: 218, 176, 147, 114, 89, 73
MS3: 147
p-Coumaroyl-N-putrescine[M+H]+235.14375235.1441−1.507C13H18N2O ** 3[51]
13MS2: 203, 159, 142, 116MS2: 188, 146
MS3: 146, 118
Tryptophan[M+H]+205.097205.0972−0.9744C11H12N2O2285***278971Std
14MS2: 299, 239, 209, 179, 137
MS3:
Hydroxybenzoic acid hexoside[M−H]299.0765299.07728−2.349C13H16O8282 *167412[54]
15MS2: 574, 467, 425, 407, 289
MS3: 245, 205, 177
MS2: 595, 443, 427, 317, 307, 289
MS3: 289, 247
Prodelphinidin B-type[M−H]593.13153593.13012.472C30H26O13 *75664#2[52,55]
16MS2: 315, 153
MS3: 108
Dihydroxybenzoic acid hexoside[M−H]315.0718 315.0722−1.1026C13H16O9286 * 2[54]
17 MS2: 160
MS3: 134, 132, 115
Serotonin[M+H]+177.1019177.1022−2.0138C₁₀H₁₂N₂O275, 298sh* *287901Std
18MS2: 179, 135
MS3:117, 89, 75
MS2: 163, 136,137
MS3: 136, 118
Caffeoylthreonic acid[M−H]297.0611297.0616−1.664C13H14O8 *** 2[54]
19MS2: 461, 225, 153
MS3: 108, 90
Dihydroxybenzoic acid hexosyldeoxyhexoside[M−H]461.1299461.1301−0.459C19H26O13281 * 3[54]
20MS2: 863, 755, 695, 591, 407, 289, 243
MS3: 524, 283
Catechin-gallocatechin-catechin[M−H]881.19622881.19353.141C45H38O19 * 3[52,55]
21MS2: 179, 134, 119 Caffeic acid[M−H]179.03439179.035−3.307C9H8O4304sh** 362811Std
22MS2: 299, 239, 197, 153, 138
MS3: 182, 153,138, 121
Syringic acid-hexoside[M−H]359.09827359.097821.2393C15H20O10 * * 2[54]
23 MS2: 248, 177, 145
MS3: 177
feruloyl-N-putrescine[M+H]+265.1548265.15470.3229C14H20N2O3 ** 3[51]
24MS2: 305, 289, 241, 225, 139
MS3: 223, 184, 139, 97
MS2: 337, 305, 185, 153
MS3: 153, 125
(epi)Gallocatechin O-hydroxybenzoate[M−H]425.08831425.08781.187C22H18O9 *** 3[52,55]
25MS2: 439, 325, 305, 289, 191, 163, 131
MS3: 115
(epi)Gallocatechin 3-O-gallate[M−H]457.07885 457.07763.859C22H18O11 * `3[52,55]
26MS2: 323, 193, 173, 135
MS3: 149, 135
MS2: 353, 309, 274, 238, 177, 145
MS3: 145
5-Feruloylquinic acid [M−H]367.1028367.1035−1.831C17H20O9280sh, 320* *86388#2[56]
27MS2: 607, 589, 333, 203
MS3: 333, 203
Prodelphinidin A-type dimer (Prodelphinidin A1) [M−H]607.11102 607.10932.786C30H24O14 * [52,55]
28MS2: 463, 301MS2: 465, 303, 229, 201
MS3: 303
Quercetin di-O-hexoside [M−H]625.14292625.1413.035C27H30O17253, 353* 3[53,57]
29MS2: 353, 179, 173
MS3: 109, 93
MS2: 192, 165, 1464-Caffeoylquinic acid[M−H]353.06743 353.06672.136C16H18O9340sh, 305* *754912[56]
30MS2: 665, 635, 563, 503, 473, 443, 383, 353
MS3: 353, 297
Apigenin 6-C-hexoside-8-C-pentoside 7-O-hexoside[M−H]725.1924 725.1898−3.4967C32H38O19266, 335 3[58]
31MS2: 489, 399, 369
MS3: 369
Luteolin 6,8-di-C-hexoside[M−H]609.1435 609.1450−2.5141C27H30O16262, 345* *65532[58]
32MS2: 577, 407, 289
MS3: 289, 143
MS2: 579, 427, 291Procyanidin B-type dimer[M−H]577.13679 577.13512.843C30H26O12 *756302[52,55]
33MS3: 245, 205, 137, 125
MS3: 203
MS2: 157, 139, 123(epi)Catechin[M−H]289.07255 289.07182.728C15H14O6 *230532[55]
34MS2:595, 483, 423, 305, 283
MS3 (609-483): 303, 179
MS3 (609-305): 289, 143
MS2: 611, 443, 317Prodelphinidin B-type[M−H]609.12659 609.1252.646C30H26O14 * 2[52]
35 MS2: 275, 235, 218, 147, 118
MS3: 218, 147, 112
N-p-Coumaroyl spermidine[M+H]+292.07275 292.07173.706C34H37N3O6285sh * 2[59]
36MS2: 609, 301
MS3: 301, 272
MS2: 627, 611, 465, 303
MS3: 369, 303
Quercetin O-deoxyhexosylhexoside-O-hexoside[M−H]771.1991 771.1890.1549C33H40O21255, 353* 3[58]
37MS2: 463, 301MS2: 610, 551, 465, 303
MS3: 303
Quercetin di-O-hexoside II[M−H]625.13971 625.141−2.099C27H30O17253, 353** 3[53,57]
38MS2: 193, 134 Ferulic acid[M−H]193.05024 193.0506−2.031C10H10O4300sh, 326** 176203[53,57]
39MS2: 179, 135, 117
MS3:117, 89
MS2: 299, 136Apigenin 7,4’-dimethyl ether[M−H]297.07752297.07682.266C17H14O5 * 176202[60]
40MS2: 233, 119MS2: 260, 217, 147, 114
MS3: 217, 98
p-Coumaroylagmatine[M+H]+277.16547 277.1659−1.560C14H20N4O2295sh***328182[54]
41MS2: 489, 447, 285, 254
MS3: 285, 254
MS2: 567, 449, 287Luteolin di-O-hexoside[M−H]609.1477 609.14612.614C27H30O16267, 348 * 2[61]
42MS2: 311, 193, 149, 135
MS3: 135, 119
Feruloylthreonic acid[M−H]311.07697 311.0772−0.87C14H16O8 * 3[57]
43MS2: 193, 173,
MS3: 109, 93
MS2: 404, 369, 277, 1934-Feruloylquinic acid[M−H]367.1037 367.10350.7349C17H20O9 * 3[54]
44MS2: 562, 519, 477, 315
MS3: 357, 315, 285, 243, 199
MS2: 641, 479, 317, 286Isorhamnetin di-O-hexoside[M−H]639.15509 639.1567−2.476C28H32O17259, 369* *600782[56]
45MS2: 695, 635, 593, 454, 473, 413, 311, 249
MS3: 473, 413
Chrysoeriol 6-C-hexoside-8-C-pentoside 7-O-hexoside[M−H]755.20585 755.2042.428C33H40O20250, 348** 3[57]
46MS2: 519, 447, 357, 327MS2: 532, 464, 449, 431, 383, 353, 329, 299
MS3: 432, 413, 383, 353, 329, 320, 299
Orientin 7-O-hexoside[M−H]609.1439 609.1450−1.8549C27H30O16266, 349* 3[58]
47MS2: 369, 325, 163, 145, 119
MS3: 117, 95
Sinapoyl-homovanillic acid[M−H]387.10814 387.1085−1.035C20H20O8 * 3[58]
48MS2: 191, 179, 173,
MS3: 155, 111, 93, 71
MS2: 146, 119, 794-p-Coumaroylquinic acid[M−H]337.0939 337.09292.6396C16H18O8290sh** 19453[54]
49 MS2: 290, 247, 232, 177, 152, 145, 114
MS3: 273, 247, 230, 177, 115
MS4: 145, 113
Feruloylagmatine[M+H]+307.17636 307.1765−0.349C15H22N4O3290sh, 320 *19452[56]
50MS2: 771, 651, 609, 429, 357, 327
MS3: 357, 327, 299
Isoorientin 2”,6”-di-O-hexoside[M−H]771.19946 771.19890.6895C33H40O21270, 344 *755442[61]
51MS2: 489, 447, 357, 327
MS3: 357, 327, 299
MS2: 593, 449, 383, 329, 299
MS3: 431, 383, 353, 299
Isoorientin 7-O-glucoside[M−H]609.1433 609.1450−2.7680C27H30O16268, 348 *755141Std; [58]
52MS2: 489, 447, 327, 285, 255
MS3: 284, 226
MS2: 449, 287, 269
MS3: 287, 259, 213
MS4: 213, 153, 133
Luteolin 3′,7-di-O-glucoside[M−H]609.1475 609.14612.285C27H30O16269, 343* 755141Std
53MS2: 593
MS3: 285, 185, 153, 131
MS2: 595, 491, 449, 335, 311, 287
MS3: 449, 287
Luteolin O-hexosyldeoxyhexoside-O-hexoside[M−H]755.20408 755.2040.084C33H40O20266, 349** 3[57]
54MS2: 623, 447, 315, 299
MS3: 357, 315, 299, 271, 255, 227
MS2: 657, 641, 625, 609, 479, 317, 302, 273
MS3: 342, 317, 273
Isorhamnetin O-hexosyldeoxyhexoside-O-hexoside[M−H]785.21381 785.2146−0.982C34H42O21259, 369** 3[53,57]
55MS2: 477, 357, 315, 255, 217
MS3: 153
Isorhamnetin hexoside[M−H]477.10435 477.10381.05C22H22O12252, 369** 3[53,57]
56MS2: 315, 255
MS3: 153
Isorhamnetin deoxyhexosylhexoside[M−H]623.1624 623.16181.0327C28H32O16- * 75752 or 757583[57]
57MS2: 575, 502, 473, 413, 383
MS3 (593-473): 383, 353, 311
MS3 (593-502): 413, 383, 312
MS2: 577, 559, 541, 529, 499, 457, 427
MS3 (595-529): 511, 427, 367
MS3 (595-577): 559, 529, 511, 481, 445, 427, 409, 380
Apigenin 6,8-di-C-hexoside[M−H]593.1505 593.1512−1.2503C27H30O15269, 339 * 3[53,57]
58MS2:561, 519, 489, 459, 429, 399, 369
MS3:399, 369
MS4:341, 297
MS2: 563, 545, 515, 497, 443, 413
MS3: 545, 515, 497, 485, 467, 395
MS4 (563-497): 413, 395, 312
MS4 (563-545): 509, 497, 467
Luteolin 6-C-pentoside-8-C-hexoside[M−H]579.1492 579.1501−1.489C26H28O15269, 348* *698142[62]
59MS2: 399, 387, 205, 181
MS3: 372, 203
Sinapoyl-homovanillic acid derivative[M−H]597.18205 597.1825−0.742 260, 335***755662[58]
60MS2: 609, 489, MS3: 489, 429, 309
MS4: 309
Isoorientin 2″-O-hexoside 7-O-[6″-sinapoyl]-hexoside[M−H]977.26068 977.25683.929C44H50O25263, 340* 3[58]
61MS2: 469, 307, 161
MS3: 307, 161
Hydroxycoumarin hexoside-pentoside[M−H]469.13626 469.13512.367C20H24O12 * 3[62]
62MS2: 307, 161, 145
MS3: 161, 145, 113
p-Coumaroyl-caffeic acid pentoside[M−H]439.12554 439.12462.175C23H22O10286sh, 315 * 3[56]
63MS2: 163, 135, 119
MS3: 119
p-Coumaroylthreonic acid[M−H]281.0672 281.06671.864C13H14O7290sh* 3[56]
64MS2: 561, 489, 459, 399, 369, 327
MS3: 441, 399, 369
MS4: 341, 313
MS2: 563, 545, 515, 497, 485, 473, 413
MS3: 545, 515, 473, 449, 413, 365
MS4 (563-473): 455, 437, 367, 341
MS4 (563-515): 449, 431, 413
Luteolin 6-C-hexoside-8-C-pentoside[M−H]579.1368 579.13552.17C26H28O15262, 345 * 3[54]
65MS2: 697, 535, 373, 329, 178
MS3: 299, 284, 269, 178, 161
Hydroxypinoresinol di-O-hexoside[M−H]697.23658 697.23662.377C32H42O17278* *34212[62]
66MS2: 489, 429, 327, 309, 285
MS3: 327, 298
MS4: 297, 175
Isoorientin 6”-O-hexoside[M−H]609.1440 609.1450−1.6214C27H30O16266, 347* 753533[58]
67 MS2: 449, 303, 285
MS3: 285
Quercetin O-deoxyhexosylhexoside[M+H]+611.1594 611.1607−2.0245C27H30O16255, 353* * 2[62]
68MS2: 575, 533, 503, 473, 431, 311
MS3: 413, 383, 311
Isovitexin 6”-O-hexoside[M−H]593.15198 593.15201.3952C27H30O15268, 335* 3[53,57]
69MS2: 533, 503, 473, 413, 383, 341, 293
MS3: 312, 293
MS2: 433, 415, 397, 367, 337, 313, 283
MS3: 415, 397, 367, 337, 313, 283367, 283
MS4:283
Isovitexin 2”-O-glucoside[M−H]593.15094 593.15119−0.42709C27H30O15268, 335* 1Std; [58]
70MS2: 489, 429, 369, 357, 339, 309
MS3: 429, 369, 351, 339, 309, 243
MS2: 449, 431, 383, 353, 329, 299
MS3: 431, 413, 383, 353, 329, 299
MS4: 299
Isoorientin 2”-O-glucoside[M−H]609.1476 609.14612.45C27H30O16269, 348 *173791Std; [58]
71MS2:429, 411, 357, 327, 283
MS3: 297, 283
MS4: 269
MS2: 431, 383, 353, 329, 299
MS3: 299
Isoorientin[M−H]447.0939 447.09331.4239C21H20O11 * *179651Std
72MS2: 545, 503, 473, 443, 413, 383, 353, 325
MS3 (563-353): 353, 325, 297
MS3 (563-443): 383, 353, 297, 191
MS2: 547, 529, 511, 451, 337
MS3: 530, 499, 482, 458, 391
MS4: 512, 397
Apigenin 6-C-glucoside-8-C-arabinoside[M−H]563.1409 563.14060.5600C26H28O14265, 335* *179651Std
73MS2: 455, 503, 473, 443, 383, 353, 337
MS3: 353, 325, 297, 203
MS4: 325, 297
Apigenin 6-C-pentoside-8-C-hexoside[M−H]563.1416 563.14061.7191C26H28O14266, 335***90472[62]
74MS2: 447, 357, 327, 285
MS3: 339, 311, 297, 285
MS2: 431, 383, 299
MS3: 299
MS4: 183, 121
Orientin[M−H]447.0926 447.0933−1.4845C21H20O11 * *77813[62]
75MS2: 503, 473, 443, 383, 353
MS3: 365, 325, 221
MS2: 547, 500, 457
MS3: 511, 493, 409
Apigenin 6-C-pentoside-8-C-hexoside[M−H]563.14198 563.14062.4C26H28O14266, 335 755893[62]
76MS2: 593, 503, 473, 431, 311, 297, 283
MS3: 311, 283
MS2: 577, 559, 529, 409, 475, 433, 415, 397, 367, 337, 313, 283
MS3: 559, 529, 498, 415, 397, 367, 337, 283
MS4: 175
Isovitexin 7-O-glucoside[M−H]593.1506 593.1215−0.9416C27H30O15265, 335***754391Std; [58]
77MS2: 653, 491, 329
MS3: 315, 299
Tricin di-O-glucoside[M−H]653.17377 653.17232.216C29H34O17266, 369 * 2[58]
78 MS2: 463, 301
MS3: 301, 286
Chrysoeriol di-O-hexoside[M+H]+625.1755 625.1763−1.3123C28H32O16246, 266, 347 * 3[57]
79MS2: 574, 533, 503, 473, 413, 383
MS3: 413, 383
MS4: 355, 312
MS2: 577, 559, 529, 499, 463, 409, 356
MS3: 541, 529, 499, 452, 427, 377
MS4: 427, 355
Chrysoeriol 6-C-hexoside-8-C-pentoside[M−H]593.1518 593.15121.0147C27H30O15250, 348* 3[57]
80MS2: 577, 503, 457, 383, 353
MS3: 383, 353
Apigenin 6-C-hexoside-8-C-deoxyhexoside[M−H]577.15643 577.15630.262C27H30O14266, 335* * 2[62]
81MS2: 574, 533, 503, 473, 413, 383
MS3: 413, 383
MS4: 352, 338, 312
MS2: 577, 541, 457, 529, 511, 409, 389, 345
MS3: 559, 529, 511, 427
MS4: 511
Chrysoeriol 6-C-pentoside-8-C-hexoside[M−H]593.15277 593.15122.658C27H30O15246, 267, 346 * 3[62]
82MS2: 371, 209, 175
MS3: 209, 121
MS2: 387, 373, 369, 211, 193
MS3: 211
Blumenol C-hexoside-glucuronide[M−H]547.23957 547.2396−0.081C25H39O13255*** 2[58]
83MS2: 341, 311, 283
MS3: 283, 237, 117
MS2: 415, 397, 367, 337, 283
MS3: 283, 271
Isovitexin[M−H]431.0994 431.09842.4502C21H20O10268, 336 *183301Std; [58]
84MS2: 503, 443, 323
MS3: 323, 308
MS4: 308
MS2: 607, 591, 542, 463, 445, 397, 367, 343, 313, 265
MS3: 445, 427, 397, 367, 343, 313
Isoscoparin 2”-O-glucoside[M−H]623.1611 623.1618−1.1011C28H32O16250, 348* *755181Std; [58]
85MS2: 491, 373, 329
MS3: 315, 175
Tricin hexosylmalonate[M−H]577.12073 577.11991.45C26H26O15-* *755183[53]
86MS2: 515, 473, 443, 413, 383, 353
MS3: 325, 297
MS4: 267
MS2: 517, 499, 481, 469, 433, 415, 397, 308
MS3:481, 463, 445, 433, 409, 379
MS4: 463, 445, 433, 397, 373, 351, 329
Apigenin 6-C-pentoside-8-C-pentoside[M−H]535.1458 535.14462.2345C25H26O13265, 335** 3[53]
87MS2: 371, 341, 298
MS3: 327, 313, 298
MS2: 455, 427, 409, 397, 367, 343, 313
MS3 (463-397): 379, 313, 301, 298
MS3 (463-445): 427, 397, 367, 313, 253
MS4 (445-367): 339, 324
MS5 (367-339): 324, 311
Isoscoparin[M−H]461.1089 461.10890.0285C22H22O11 * *182002[62]
88MS2: 476, 329, 314
MS3: 314, 299
MS2: 331,
MS3: 315, 287, 270
Tricin 7-O-glucoside[M−H]491.1192 491.1195−0.6682C23H24O12266, 368* *753491Std
89MS2: 329, 314, 299
MS3: 314, 299
MS2: 493, 331, 315
MS3: 315, 269
Tricin O-hexosyldeoxyhexoside[M−H]637.1769 637.1774−0.733C29H34O16265, 367***1317773[58]
90MS2: 329, 313
MS3: 314
MS2: 493, 475, 331
MS3: 331, 315
MS4: 315, 269
Tricin O-deoxyhexoside-O-hexoside[M−H]637.19042 639.19196−2.3961C29H34O16266, 367 * 3[53,57]
91MS2: 607, 299, 284MS2: 463, 301Chrysoeriol O-hexosyldeoxyhexoside [M−H]607.16864 [M−H]607.16682.959C28H32O15249, 250, 345*** 3[53,57]
92MS2: 313, 299
MS3: 299, 285, 161
MS4: 271, 203, 161
MS2: 315, 270, 253
MS3: 299, 270, 242, 207, 153
Tricin[M−H]329.06758 329.06672.747C17H14O7 * *599793[53,57]
93MS2: 383, 267, 249, 193, 134, 113 Feruloylhydroxycitric acid[M−H]383.06252 383.0621.4026C16H16O11 ** 1763613[58]
Publisher’s Note: MDPI stays neutral with regard to jurisdictional claims in published maps and institutional affiliations.

