

NMR Investigation of the Interaction of Three Non-Steroidal Anti-Inflammatory Drugs with Human Serum Albumin
 , , and
Abstract
: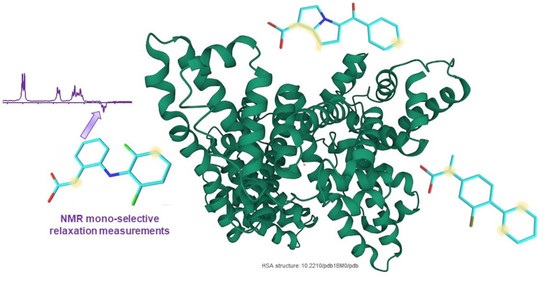
1. Introduction
2. Results and Discussion
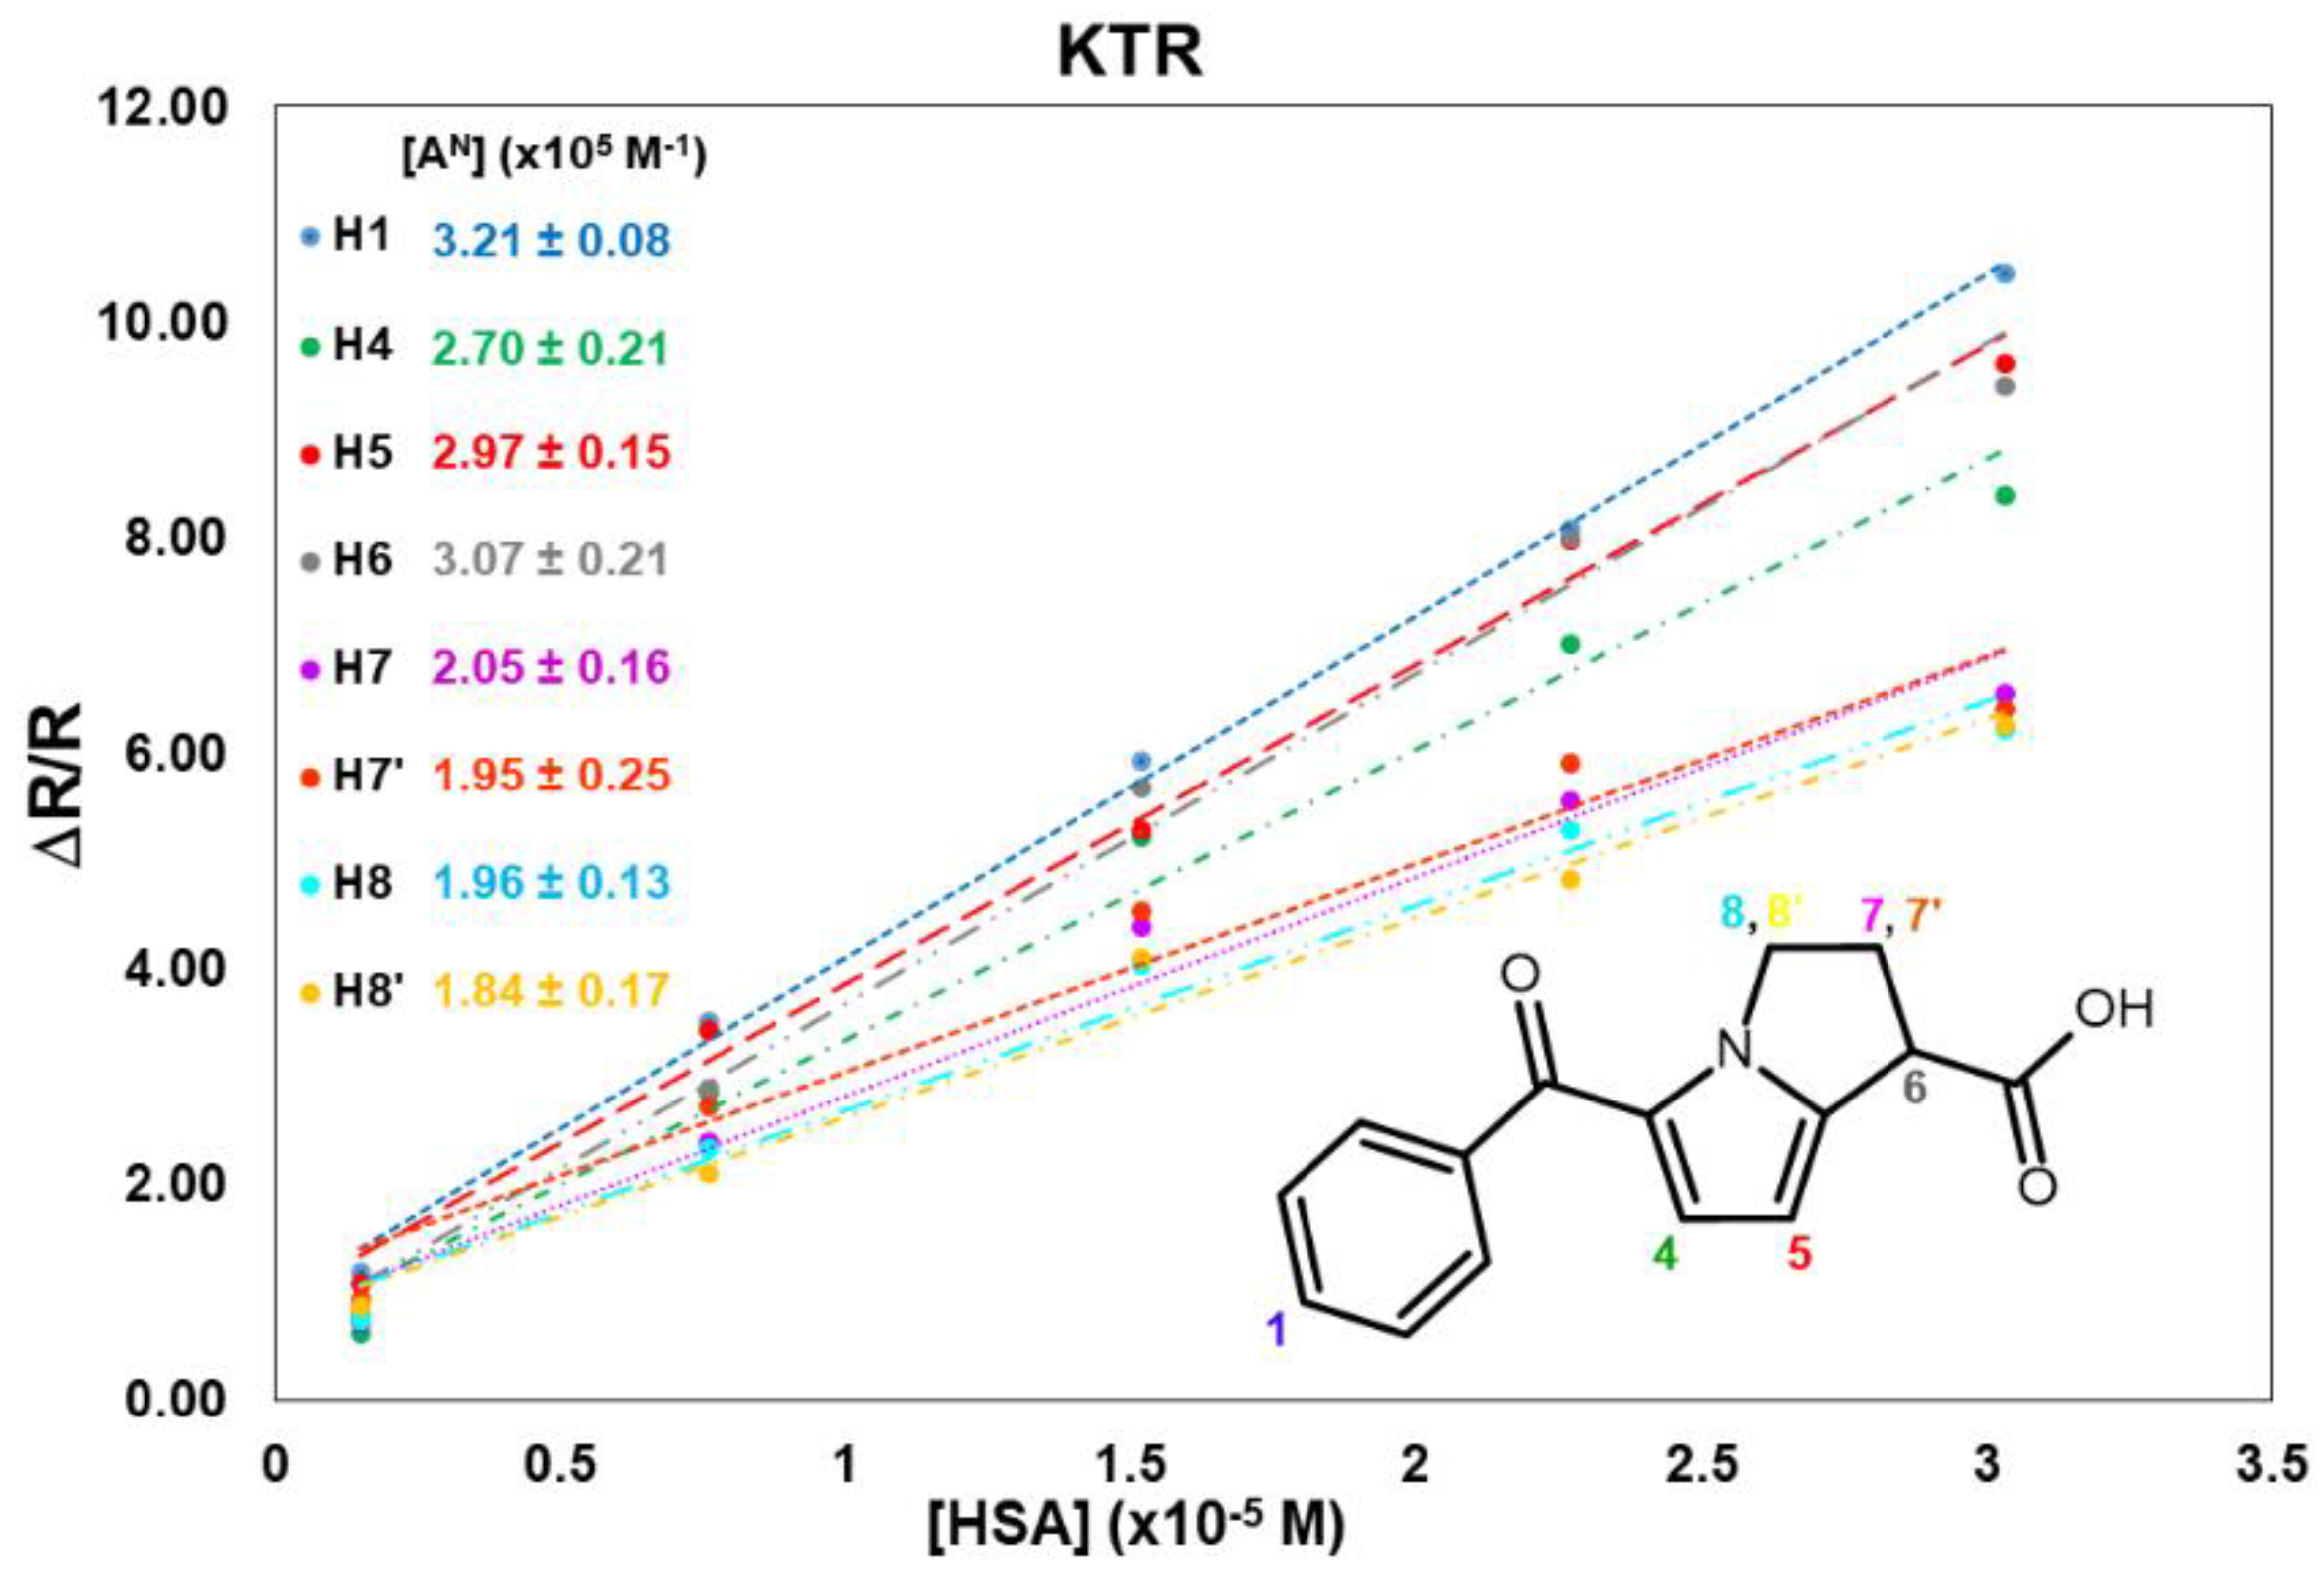
2.1. KTR/HSA Mixtures
2.2. DCF/HSA Mixtures
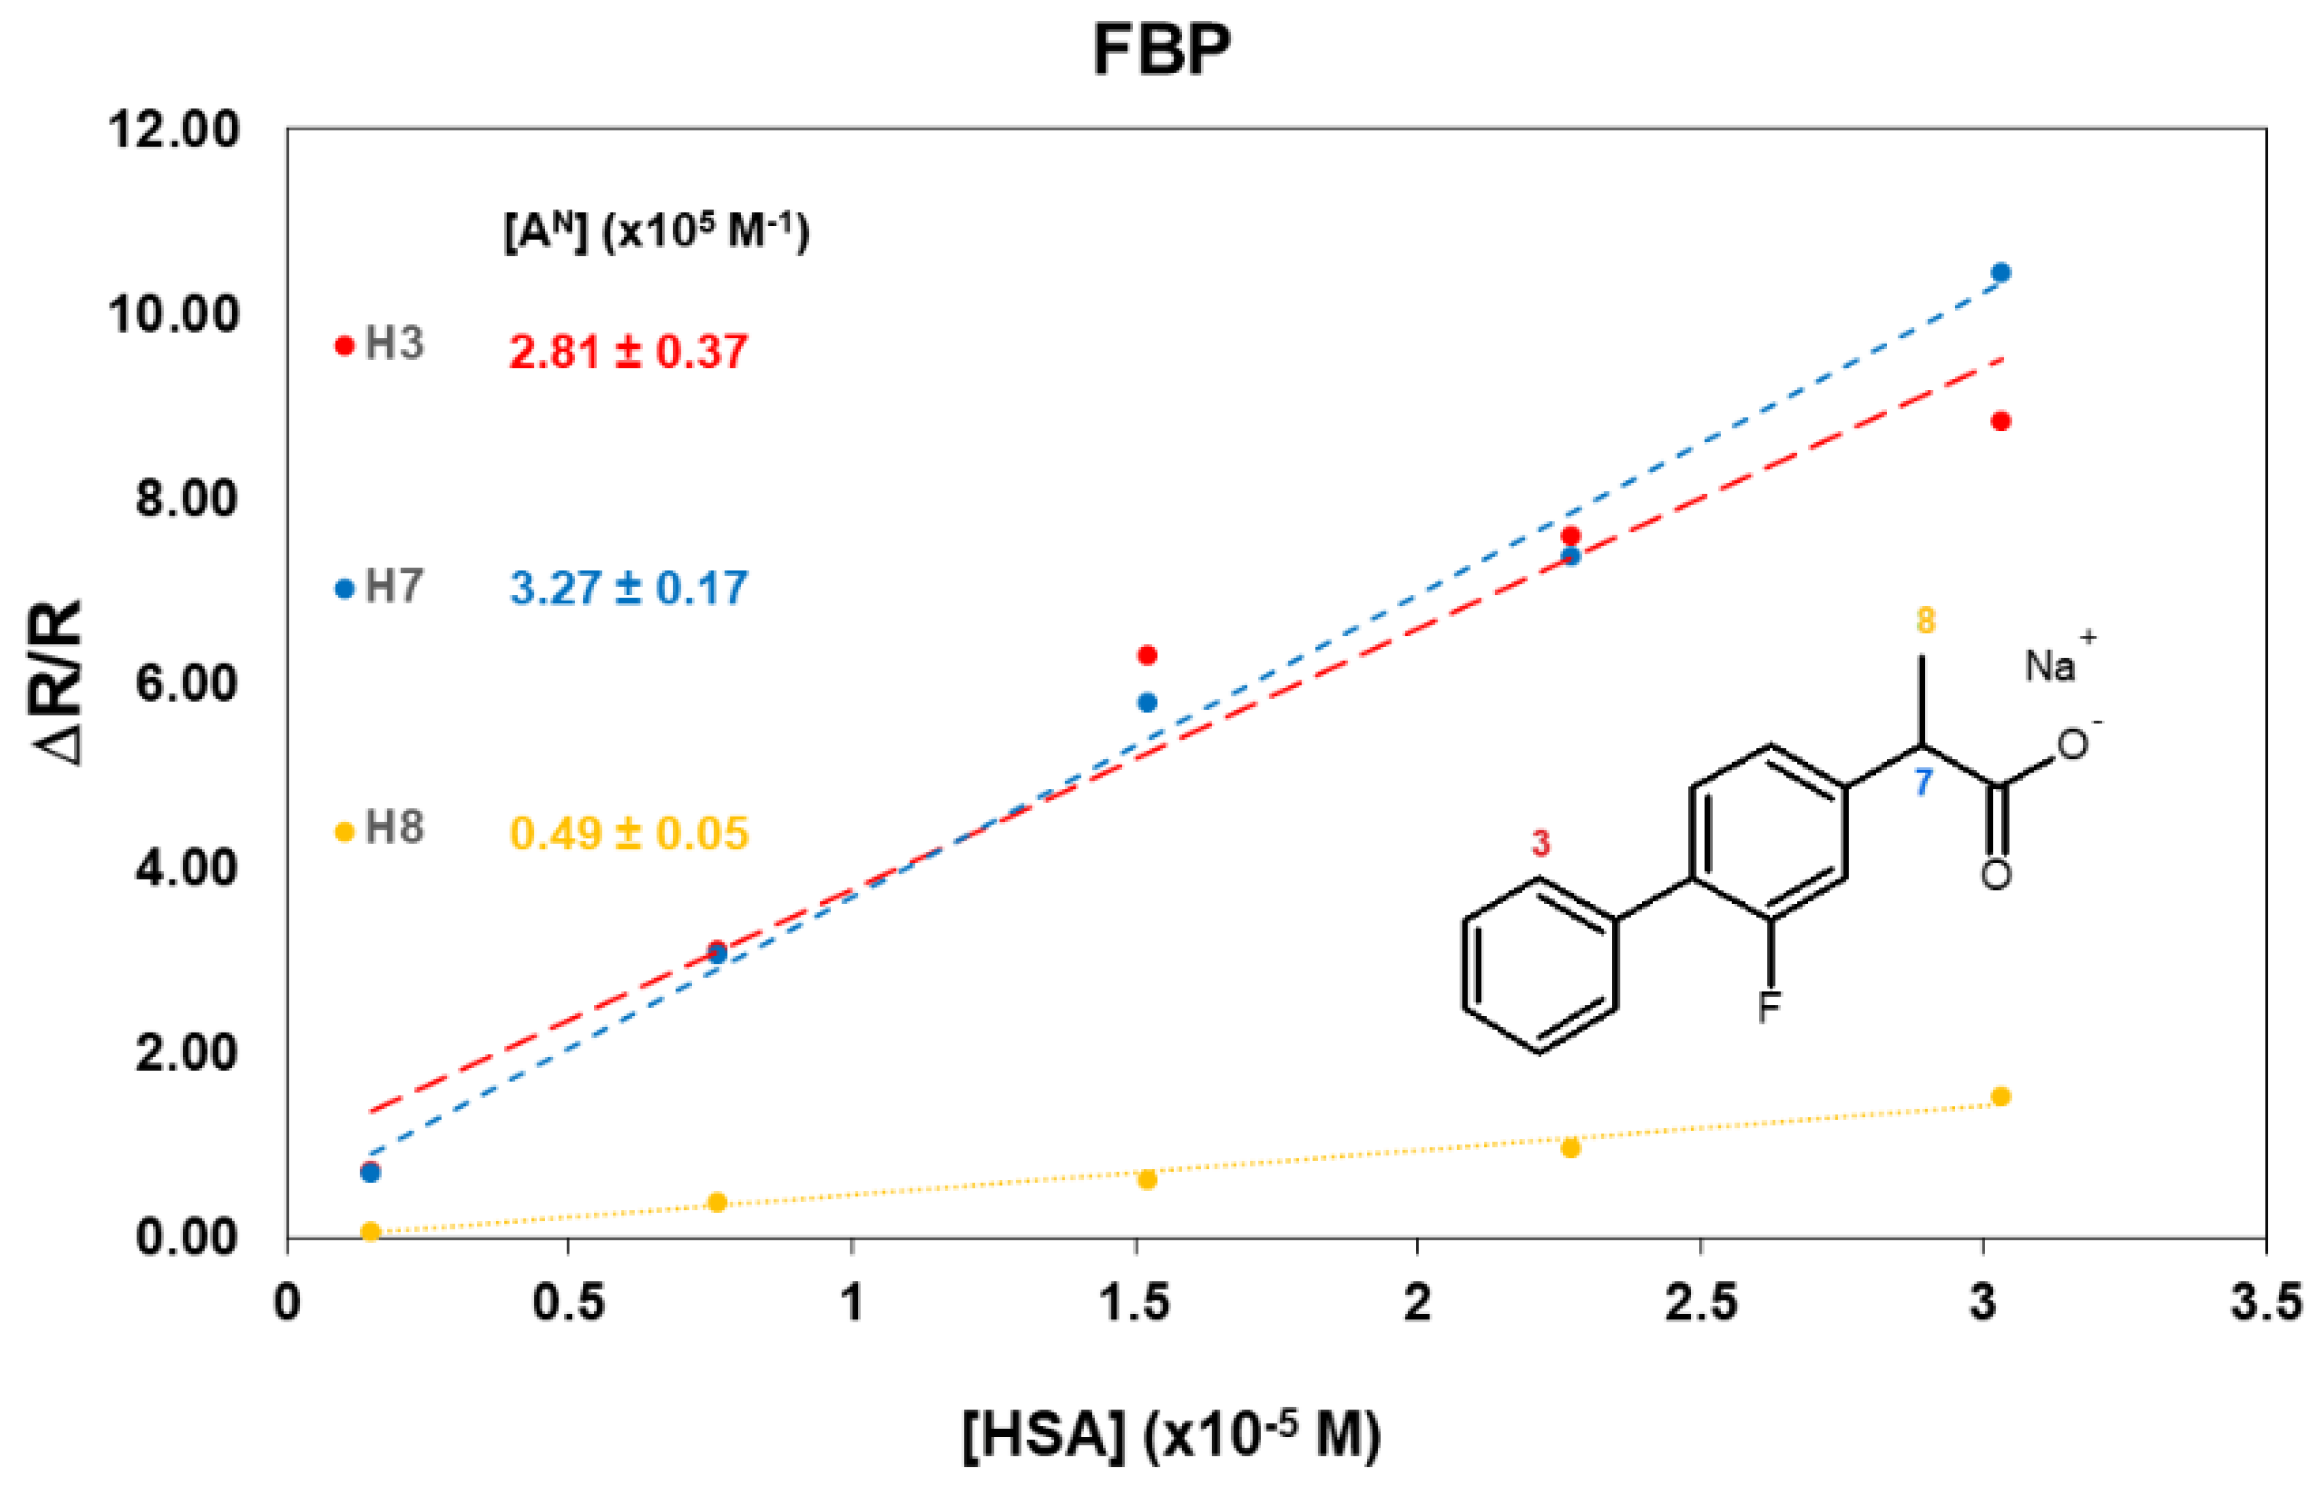
2.3. FBP/HSA Mixtures
3. Materials and Methods
3.1. Materials
3.2. NMR Measurements
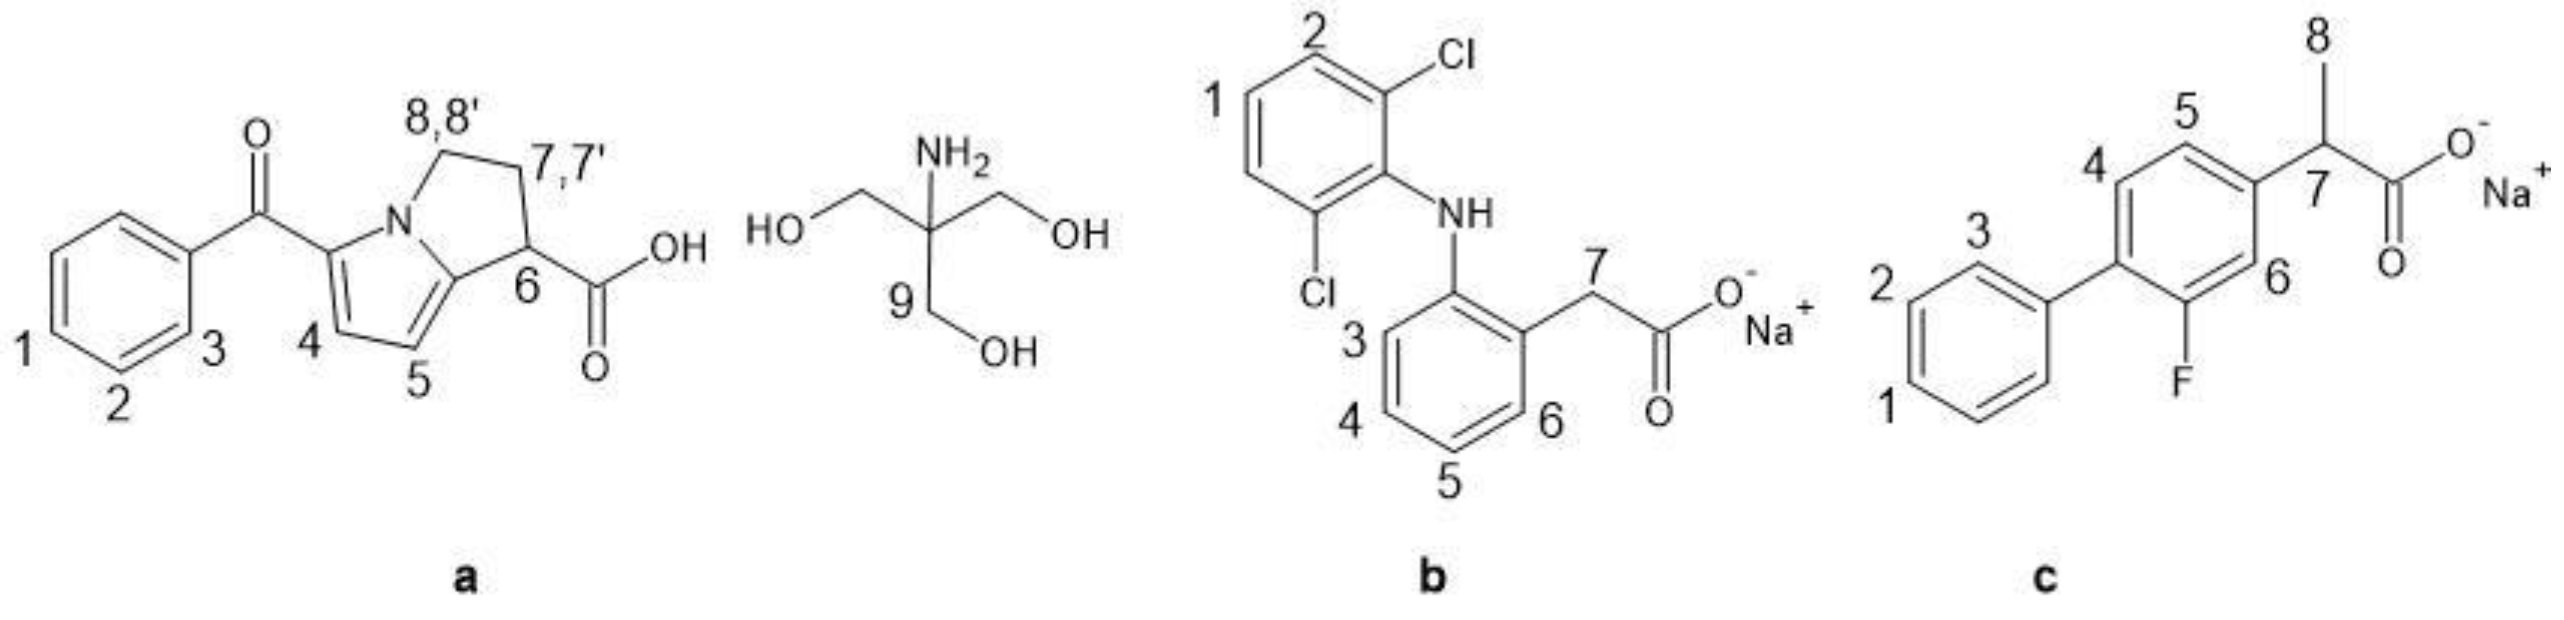
3.3. NMR Characterization Data (Numbering Scheme Referred to Scheme 1)
4. Conclusions
Supplementary Materials
Author Contributions
Funding
Institutional Review Board Statement
Informed Consent Statement
Data Availability Statement
Conflicts of Interest
Sample Availability
Appendix A. 1H Mono-Selective Relaxation Rates, Cross-Relaxation Terms, and Affinity Indexes
References
- McPherson, M.L.; Cimino, N.M. Topical NSAID Formulations. Pain Med. 2013, 14, S35–S39. [Google Scholar] [CrossRef]
- Prasanthan, P.; Kishore, N. HSA nanoparticles in drug recognition: Mechanistic insights with naproxen, diclofenac and methimazole. J. Biomol. Struct. Dynam. 2021, 1–13. [Google Scholar] [CrossRef]
- Czub, M.P.; Handing, K.B.; Venkataramany, B.S.; Cooper, D.R.; Shabalin, I.G.; Minor, W. Albumin-Based Transport of Nonsteroidal Anti-Inflammatory Drugs in Mammalian Blood Plasma. J. Med. Chem. 2020, 63, 6847–6862. [Google Scholar] [CrossRef] [PubMed]
- Chamouard, J.-M.; Barre, J.; Urien, S.; Houin, G.; Tillement, J.-P. Diclofenac binding to albumin and lipoproteins in human serum. Biochem. Pharmacol. 1985, 34, 1695–1700. [Google Scholar] [CrossRef]
- Takla, P.G.; Schulman, S.G.; Perrin, J.H. Measurement of flurbiprofen—Human serum albumin interaction by fluorimetry. J. Pharm. Biomed. Anal. 1985, 3, 41–50. [Google Scholar] [CrossRef]
- Honoré, B.; Brodersen, R. Albumin binding of anti-inflammatory drugs. Utility of a site-oriented versus a stoichiometric analysis. Mol. Pharmacol. 1984, 25, 137–150. [Google Scholar]
- Ràfols, C.; Zarza, S.; Bosch, E. Molecular interactions between some non-steroidal anti-inflammatory drugs (NSAID׳s) and bovine (BSA) or human (HSA) serum albumin estimated by means of isothermal titration calorimetry (ITC) and frontal analysis capillary electrophoresis (FA/CE). Talanta 2014, 130, 241–250. [Google Scholar] [CrossRef]
- Amézqueta, S.; Beltrán, J.L.; Bolioli, A.M.; Campos-Vicens, L.; Luque, F.J.; Ràfols, C. Evaluation of the Interactions between Human Serum Albumin (HSA) and Non-Steroidal Anti-Inflammatory (NSAIDs) Drugs by Multiwavelength Molecular Fluorescence, Structural and Computational Analysis. Pharmaceuticals 2021, 14, 214. [Google Scholar] [CrossRef]
- Cui, Y.; Hao, E.; Hui, G.; Guo, W.; Cui, F. Investigations on the interactions of diclofenac sodium with HSA and ctDNA using molecular modeling and multispectroscopic methods. Spectrochim. Acta A 2013, 110, 92–99. [Google Scholar] [CrossRef]
- Zhang, Y.; Lee, P.; Liang, S.; Zhou, Z.; Wu, X.; Yang, F.; Liang, H. Structural Basis of Non-Steroidal Anti-Inflammatory Drug Diclofenac Binding to Human Serum Albumin. Chem. Biol. Drug Des. 2015, 86, 1178–1184. [Google Scholar] [CrossRef]
- Trynda-Lemiesz, L.; Wiglusz, K. Interactions of human serum albumin with meloxicam: Characterization of binding site. J. Pharm. Biomed. Anal. 2010, 52, 300–304. [Google Scholar] [CrossRef]
- Moser, J.; Hye, A.; Lovell, W.W.; Earl, L.K.; Castell, J.V.; Miranda, M.A. Mechanisms of drug photobinding to proteins: Photobinding of suprofen to human serum albumin. Toxicol. Vitr. 2001, 15, 333–337. [Google Scholar] [CrossRef]
- Maity, S.; Gundampati, R.K.; Suresh Kumar, T.K. NMR Methods to Characterize Protein-Ligand Interactions. Nat. Prod. Commun. 2019, 14, 1934578X19849296. [Google Scholar] [CrossRef] [Green Version]
- Gossert, A.D.; Jahnke, W. NMR in drug discovery: A practical guide to identification and validation of ligands interacting with biological macromolecules. Prog. Nucl. Magn. Reson. Spectrosc. 2016, 97, 82–125. [Google Scholar] [CrossRef] [PubMed]
- Valensin, G.; Sabatini, G.; Tiezzi, E. Determination of Zero- and Double-Quantum Relaxation Transition Probabilities by Multiple-Selective Irradiation Methods. In Advanced Magnetic Resonance Techniques in Systems of High Molecular Complexity; Niccolai, N., Valensin, G., Eds.; Birkhäuser: Boston, MA, USA, 1986; pp. 69–76. [Google Scholar]
- Diaz-Perez, M.J.; Chen, J.C.; Aubry, A.-F.; Wainer, I.W. The direct determination of the enantiomers of ketorolac and parahydroxyketorolac in plasma and urine using enantioselective liquid chromatography on a human serum albumin-based chiral stationary phase. Chirality 1994, 6, 283–289. [Google Scholar] [CrossRef]
- Ji, Z.-S.; Li, C.-G.; Mao, X.-A.; Liu, M.-L.; Hu, J.-M. NMR Study on the Low-Affinity Interaction of Human Serum Albumin with Diclofenac Sodium. Chem. Pharm. Bull. 2002, 50, 1017–1021. [Google Scholar] [CrossRef] [PubMed] [Green Version]
- Liu, M.; Nicholson, J.K.; Lindon, J.C. Analysis of Drug–Protein Binding Using Nuclear Magnetic Resonance Based Molecular Diffusion Measurements. Anal. Commun. 1997, 34, 225–228. [Google Scholar] [CrossRef]
- Jenkins, B.G. Detection of site-specific binding and co-binding of ligands to macromolecules using 19F NMR. Life Sci. 1991, 48, 1227–1240. [Google Scholar] [CrossRef]
- Martini, S.; Bonechi, C.; Corbini, G.; Rossi, C. Determination of the modified ‘affinity index’ of small ligands and macromolecular receptors from NMR spin-lattice relaxation data. Chem. Phys. Lett. 2007, 447, 147–153. [Google Scholar] [CrossRef]
- Rossi, C.; Bonechi, C.; Martini, S.; Ricci, M.; Corbini, G.; Corti, P.; Donati, A. Ligand–macromolecule complexes: Affinity index determination by selective nuclear relaxation analysis. Magn. Reson. Chem. 2001, 39, 457–462. [Google Scholar] [CrossRef]
- Kamal, A.J.; Behere, D.V. Spectroscopic studies on human serum albumin and methemalbumin: Optical, steady-state, and picosecond time-resolved fluorescence studies, and kinetics of substrate oxidation by methemalbumin. J. Biol. Inorg. Chem. 2002, 7, 273–283. [Google Scholar] [CrossRef]
- Momot, K.I.; Walker, F.A. Proton NMR relaxation in six-coordinate low-spin Iron(III) tetraphenylporphyrinates: Temperature dependence of proton relaxation rates and interpretation of NOESY experiments. J. Phys. Chem. A 1997, 101, 9207–9216. [Google Scholar] [CrossRef]
- Luy, B.; Frank, A.; Kessler, H. Conformational Analysis of Drugs by Nuclear Magnetic. In Molecular Drug Properties: Measurement and Prediction; Wiley-VCH Verlag: Weinheim, Germany, 2008. [Google Scholar]
- Testa, B.; Vistoli, G.; Pedretti, A.; van de Waterbeemd, H.; Avdeef, A.; Ivanciuc, O.; Ertl, P.; Raevsky, O.; Sadowski, J.; Bostrom, J.; et al. Molecular Drug Properties: Measurement and Prediction; Mannhold, R., Ed.; Wiley-VCH Verlag: Weinheim, Germany, 2007; pp. 207–254. [Google Scholar]
- Martini, S.; Bonechi, C.; Casolaro, M.; Corbini, G.; Rossi, C. Drug–protein recognition processes investigated by NMR relaxation data: A study on corticosteroid–albumin interactions. Biochem. Pharmacol. 2006, 71, 858–864. [Google Scholar] [CrossRef]
- Corbini, G.; Martini, S.; Bonechi, C.; Casolaro, M.; Corti, P.; Rossi, C. Synthetic polymers as biomacromolecular models for studying ligand–protein interactions: A nuclear spin relaxation approach. J. Pharm. Biomed. Anal. 2006, 40, 113–121. [Google Scholar] [CrossRef] [PubMed]
- Zhai, Y.; Deng, P.; Wang, X.; Zhang, C.; Gan, R.; Gan, N.; Sun, Q.; Li, H. Interaction mechanism of olaparib binding to human serum albumin investigated with NMR relaxation data and computational methods. RSC Adv. 2018, 8, 31555–31563. [Google Scholar] [CrossRef] [PubMed]


| [HSA] mg/mL | KTR:HSA | H1 | H4 | H5 | H6 | H7 | H7′ | H8 | H8′ | σ4-5 | xb |
|---|---|---|---|---|---|---|---|---|---|---|---|
| 0 | / | 0.26 | 0.31 | 0.21 | 0.28 | 0.81 | 0.74 | 0.79 | 0.92 | 0.05 | |
| 0.1 | 1315:1 | 1.18 | 0.62 | 1.08 | 0.79 | 0.73 | 0.93 | 0.75 | 0.88 | 0.00 | 0.01 |
| 0.5 | 264:1 | 3.49 | 2.85 | 3.44 | 2.89 | 2.42 | 2.75 | 2.32 | 2.11 | −0.11 | 0.04 |
| 1.0 | 132:1 | 5.95 | 5.17 | 5.28 | 5.68 | 4.35 | 4.63 | 4.04 | 4.19 | −0.19 | 0.07 |
| 1.5 | 88:1 | 8.10 | 7.00 | 7.89 | 8.08 | 5.47 | 5.90 | 5.30 | 4.74 | −0.23 | 0.08 |
| 2.0 | 66:1 | 10.58 | 8.34 | 9.70 | 9.41 | 6.69 | 6.50 | 6.41 | 6.27 | −0.29 | 0.09 |
| [HSA] mg/mL | DCF:HSA | H2 | H3 | H5 | H6 | H7 | σ6-5 | xb |
|---|---|---|---|---|---|---|---|---|
| 0 | / | 0.17 | 0.24 | 0.34 | 0.38 | 1.22 | 0.04 | |
| 0.1 | 1315:1 | 2.36 | 1.79 | 1.50 | 1.35 | 0.49 | −0.05 | 0.02 |
| 0.5 | 264:1 | 8.38 | 6.85 | 5.64 | 5.07 | 1.05 | −0.36 | 0.07 |
| 1.0 | 132:1 | 16.38 | 14.14 | 11.70 | 9.44 | 1.83 | −0.77 | 0.15 |
| 1.5 | 88:1 | 21.73 | 17.90 | 14.37 | 13.50 | 2.42 | −1.01 | 0.19 |
| 2.0 | 66:1 | 28.55 | 25.50 | 19.86 | 17.64 | 3.32 | −1.59 | 0.29 |
| [HSA] mg/mL | FBP:HSA | H3 | H7 | H8 |
|---|---|---|---|---|
| 0 | / | 0.34 | 0.34 | 1.33 |
| 0.1 | 1315:1 | 0.71 | 0.70 | 0.09 |
| 0.5 | 264:1 | 3.06 | 3.08 | 0.42 |
| 1.0 | 132:1 | 6.30 | 5.77 | 0.67 |
| 1.5 | 88:1 | 7.59 | 7.38 | 0.97 |
| 2.0 | 66:1 | 8.73 | 10.46 | 1.59 |
Publisher’s Note: MDPI stays neutral with regard to jurisdictional claims in published maps and institutional affiliations. |
© 2022 by the authors. Licensee MDPI, Basel, Switzerland. This article is an open access article distributed under the terms and conditions of the Creative Commons Attribution (CC BY) license (https://creativecommons.org/licenses/by/4.0/).
Share and Cite
Aiello, F.; Uccello-Barretta, G.; Picchi, C.; Nazzi, S.; Recchimurzo, A.; Balzano, F. NMR Investigation of the Interaction of Three Non-Steroidal Anti-Inflammatory Drugs with Human Serum Albumin. Molecules 2022, 27, 6647. https://doi.org/10.3390/molecules27196647
Aiello F, Uccello-Barretta G, Picchi C, Nazzi S, Recchimurzo A, Balzano F. NMR Investigation of the Interaction of Three Non-Steroidal Anti-Inflammatory Drugs with Human Serum Albumin. Molecules. 2022; 27(19):6647. https://doi.org/10.3390/molecules27196647
Chicago/Turabian StyleAiello, Federica, Gloria Uccello-Barretta, Claudio Picchi, Samuele Nazzi, Alessandra Recchimurzo, and Federica Balzano. 2022. "NMR Investigation of the Interaction of Three Non-Steroidal Anti-Inflammatory Drugs with Human Serum Albumin" Molecules 27, no. 19: 6647. https://doi.org/10.3390/molecules27196647