
Renewable Hydrogen Production by Aqueous Phase Reforming of Pure/Refined Crude Glycerol over Ni/Al-Ca Catalysts

Abstract
: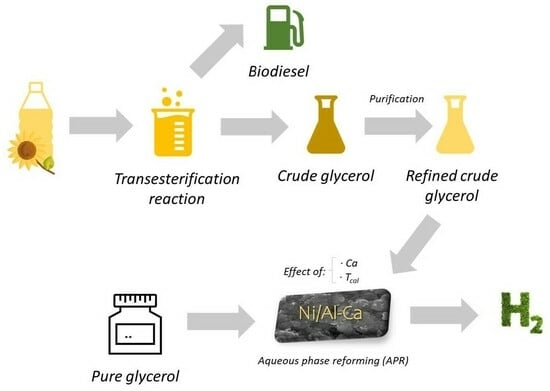
1. Introduction
2. Results
2.1. Physicochemical Characteristics of the Fresh Catalysts
2.1.1. Composition and Textural Properties
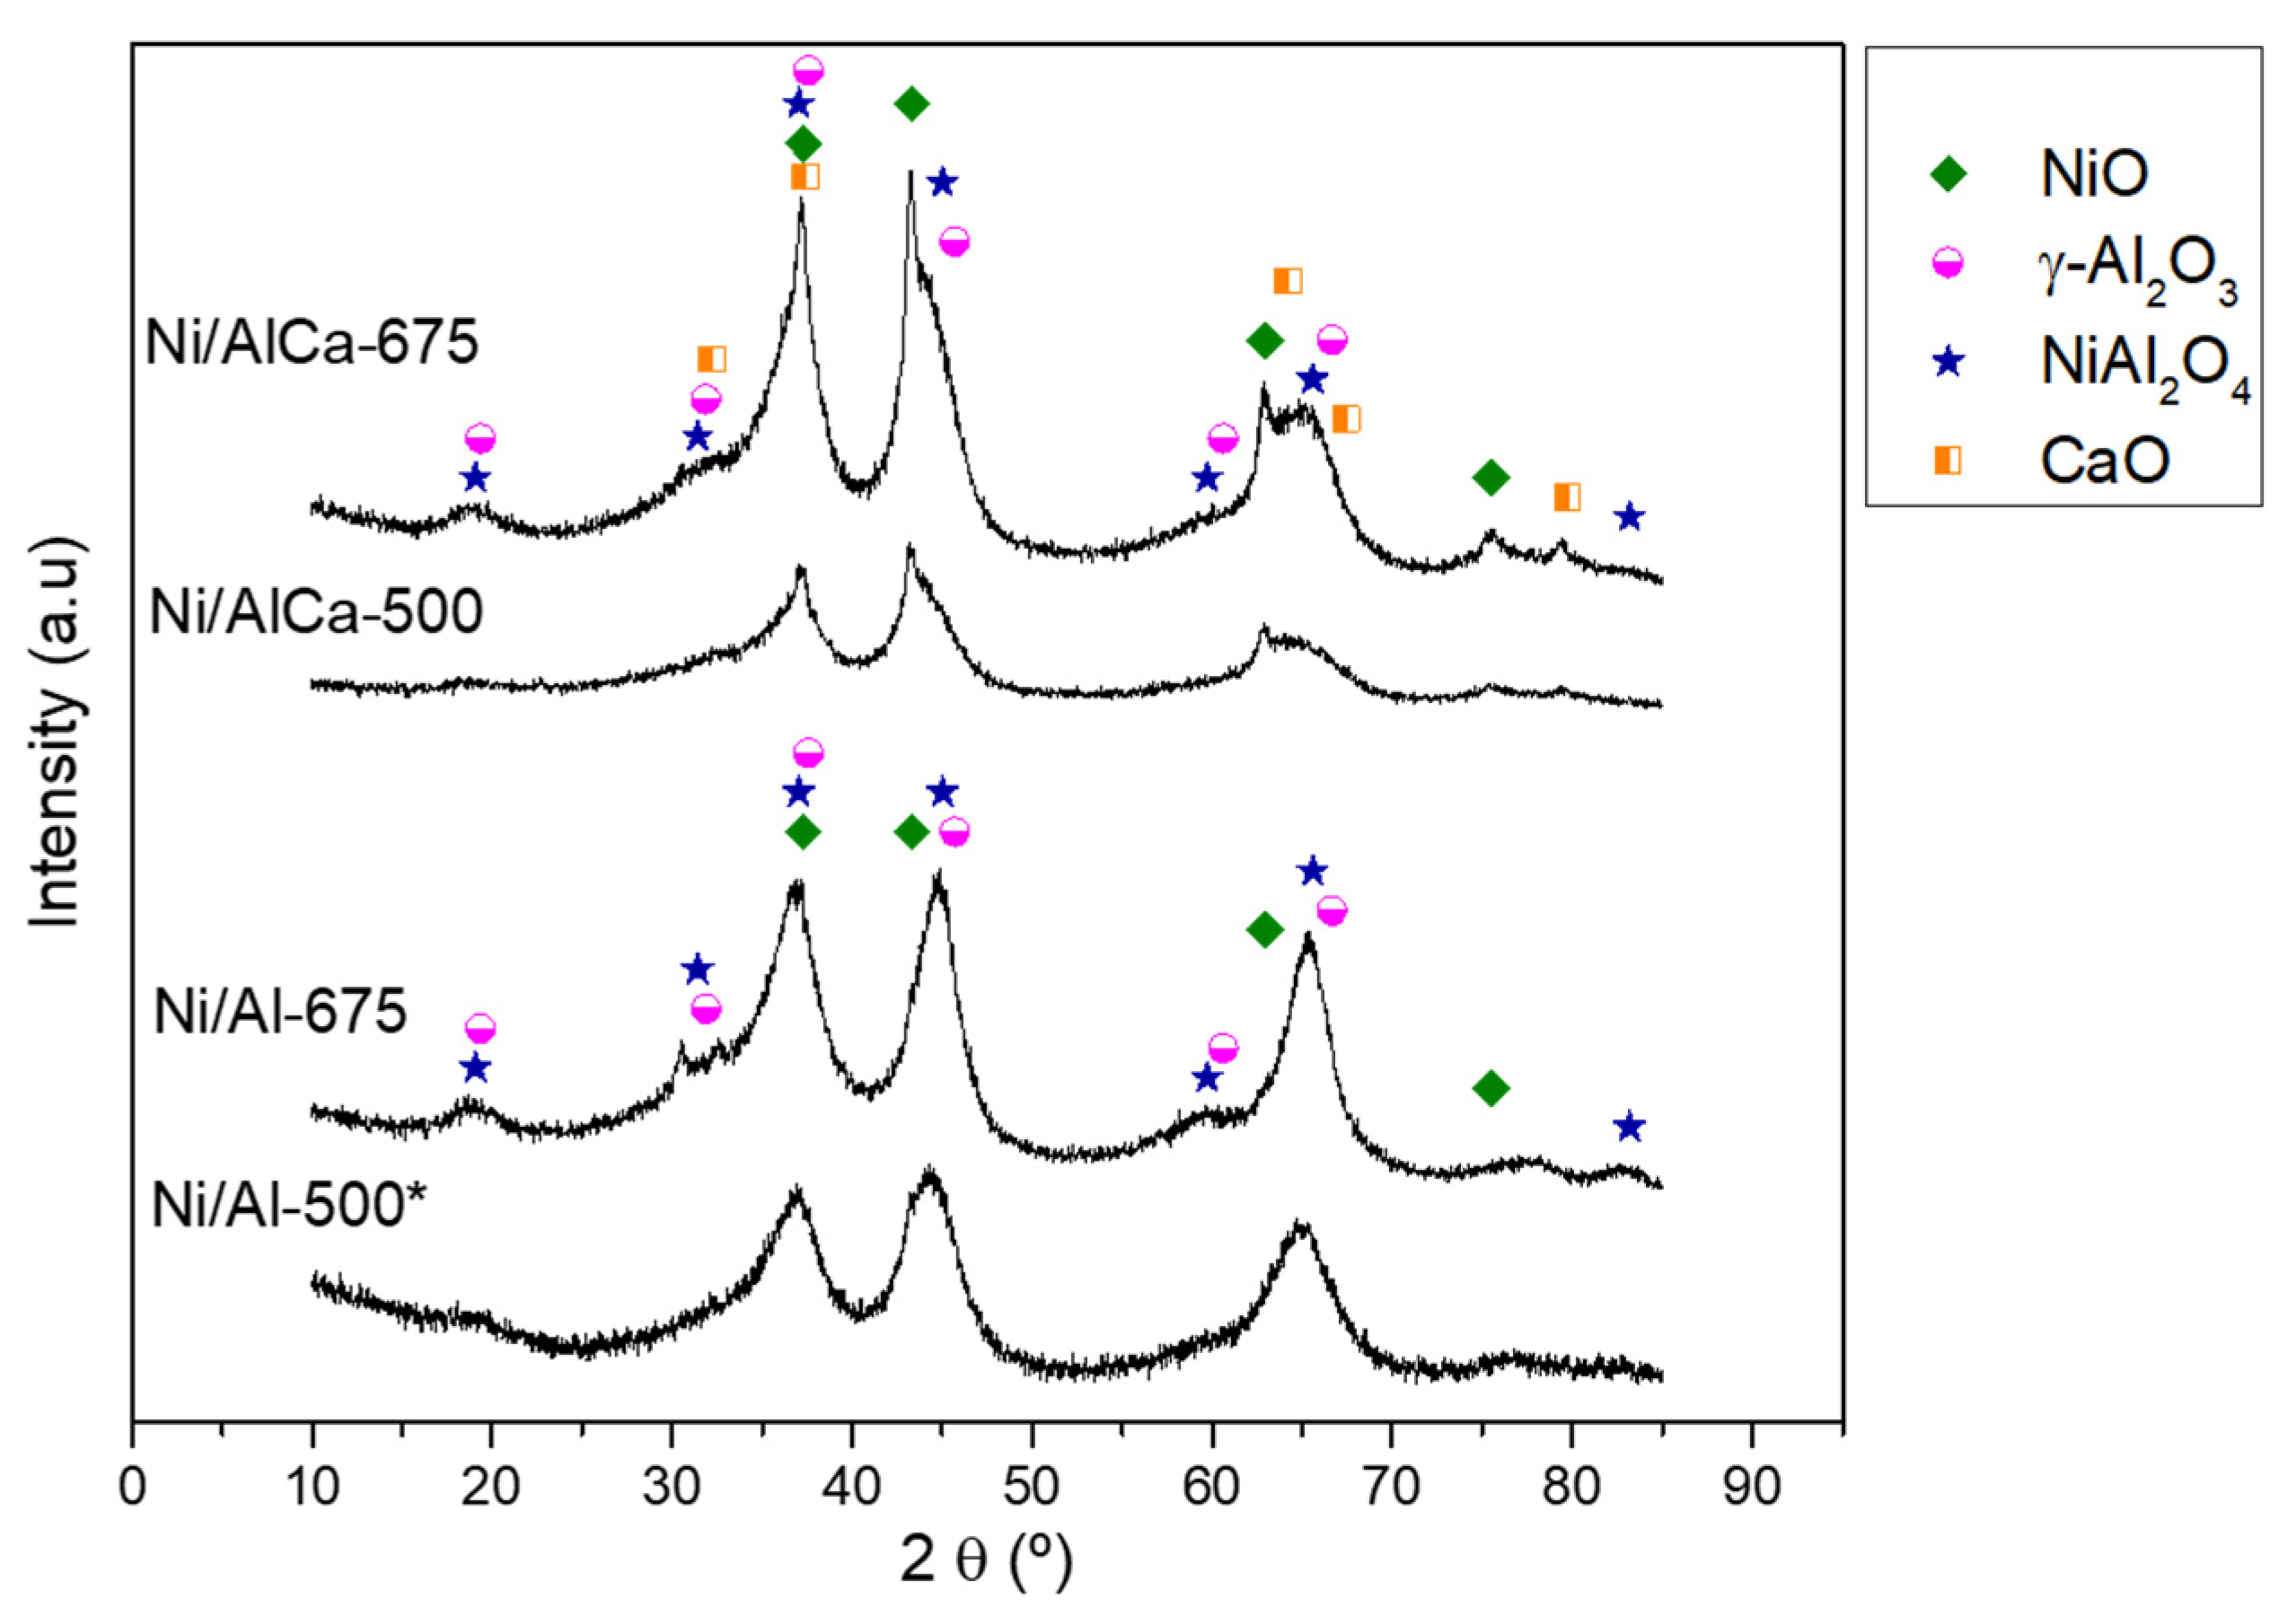
2.1.2. Crystalline Structure
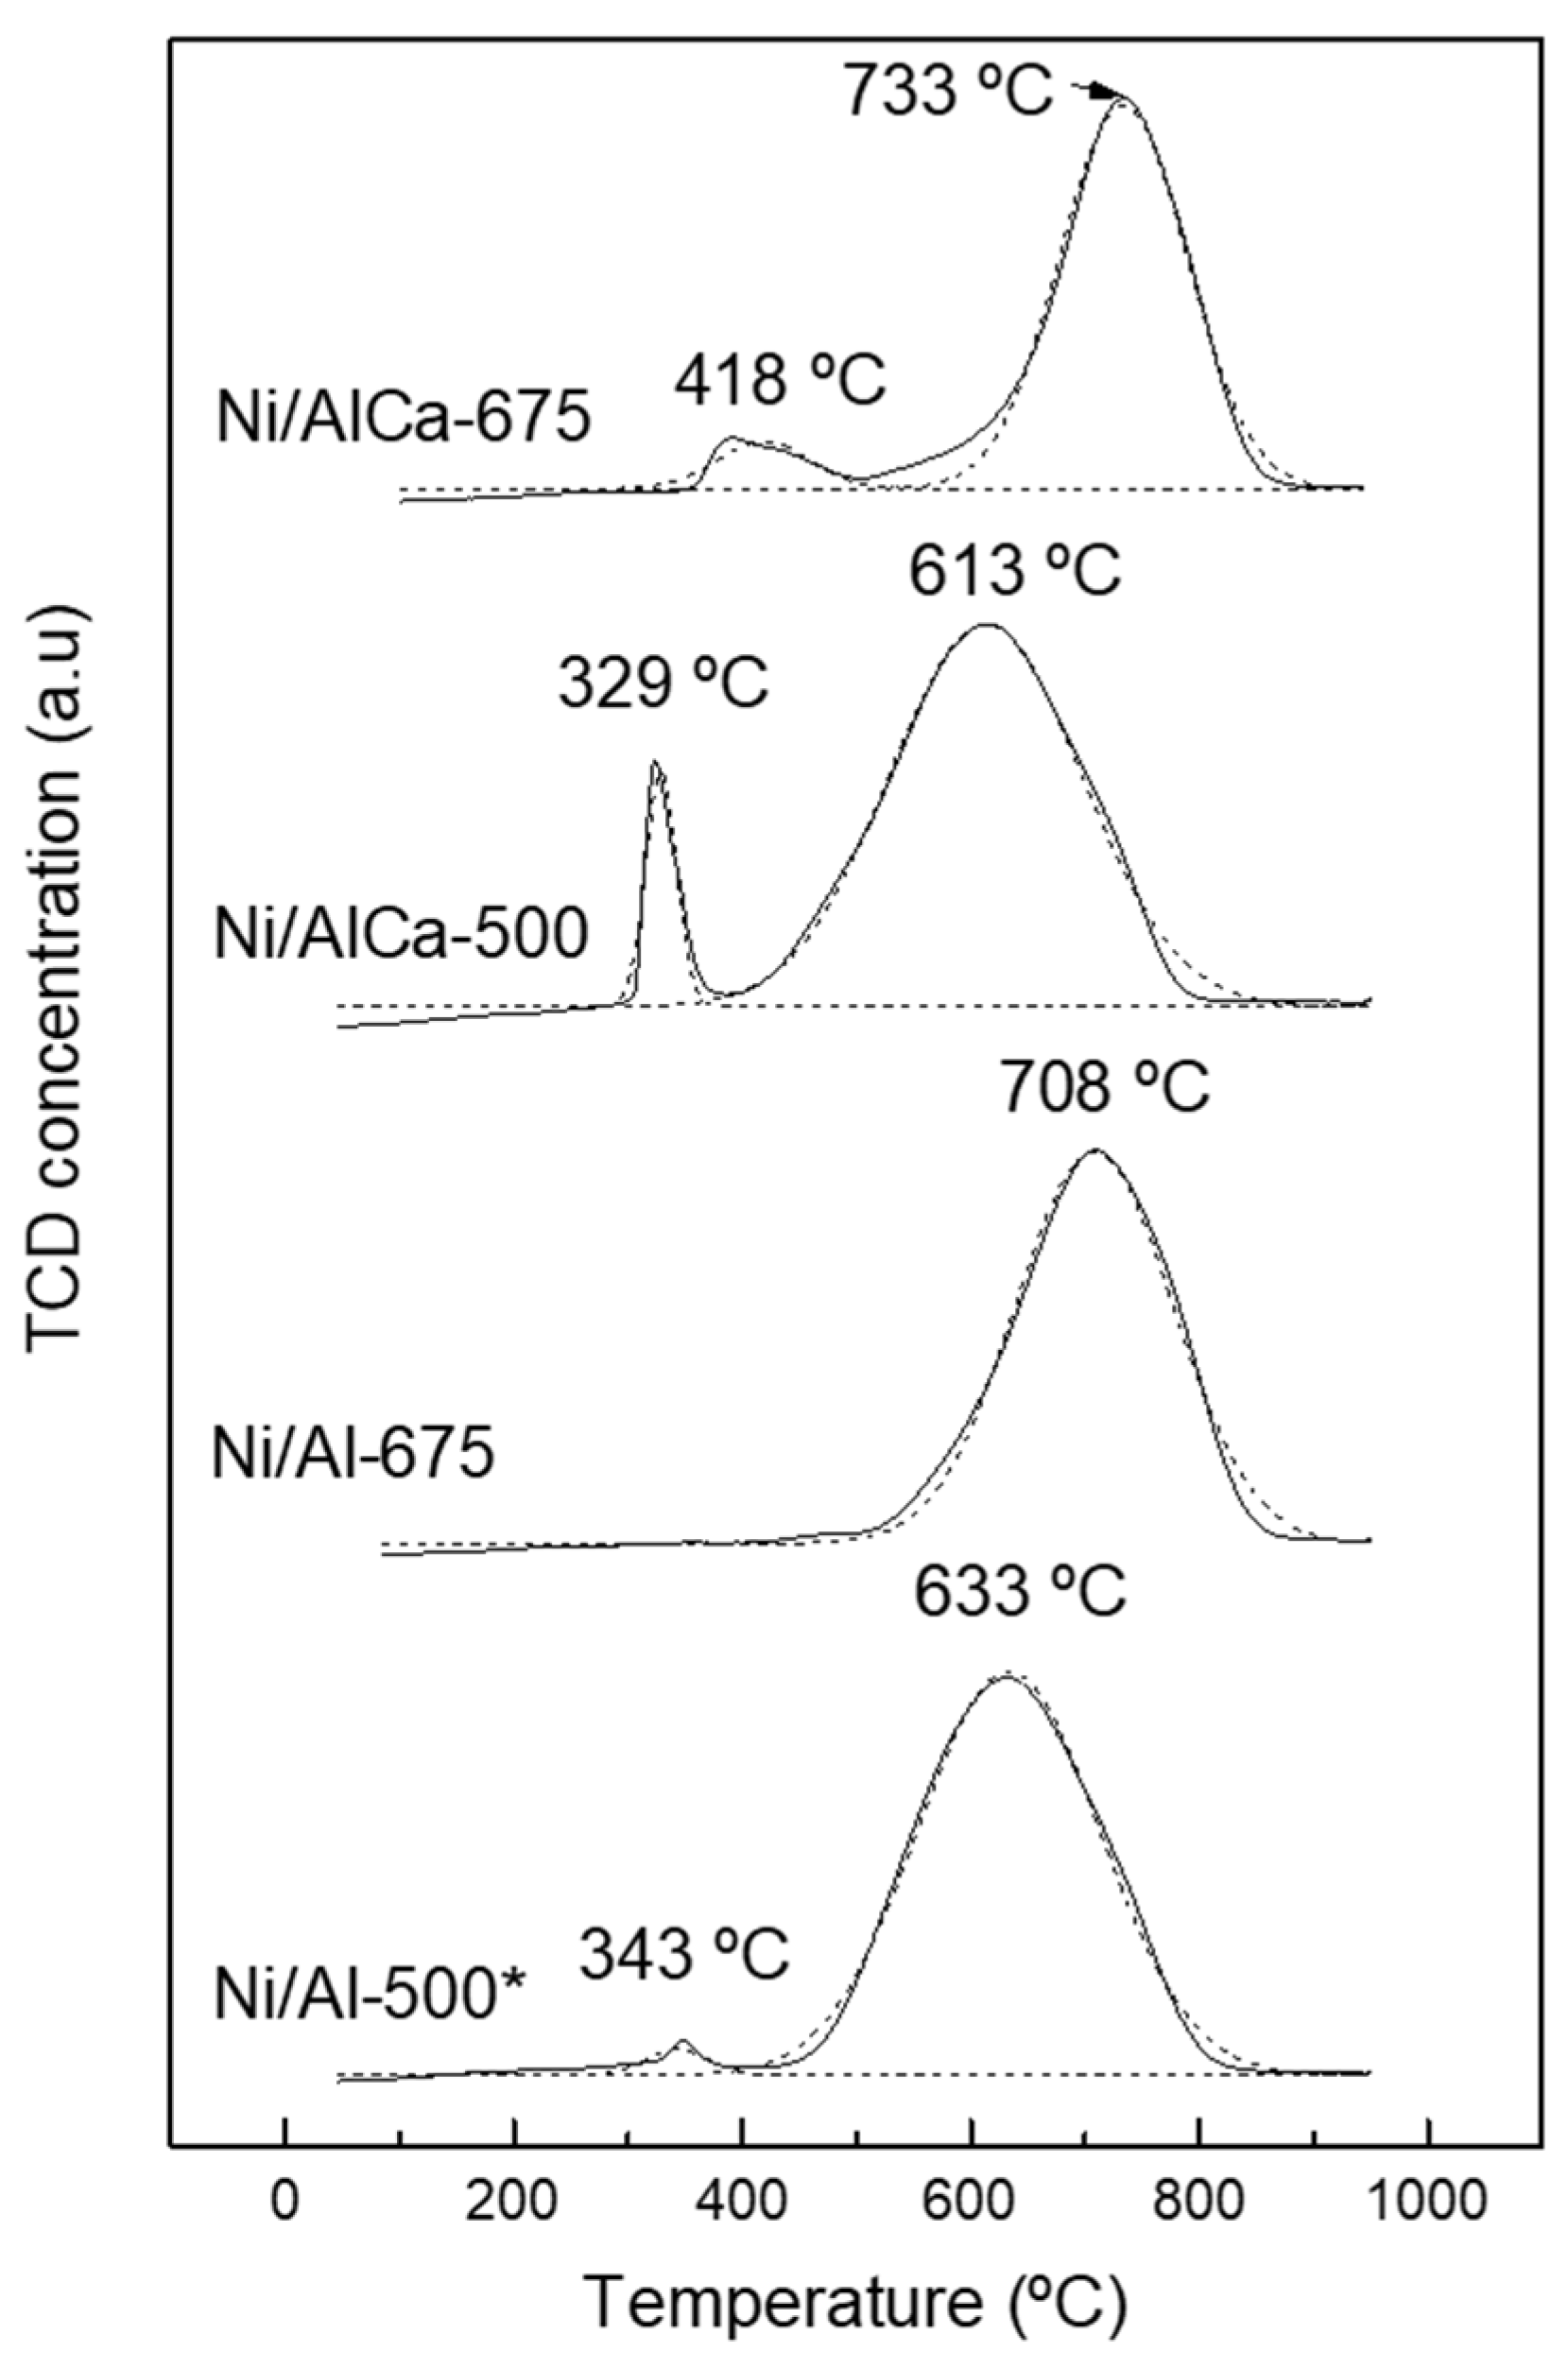
2.1.3. Reducibility
2.1.4. Acidity and Basicity
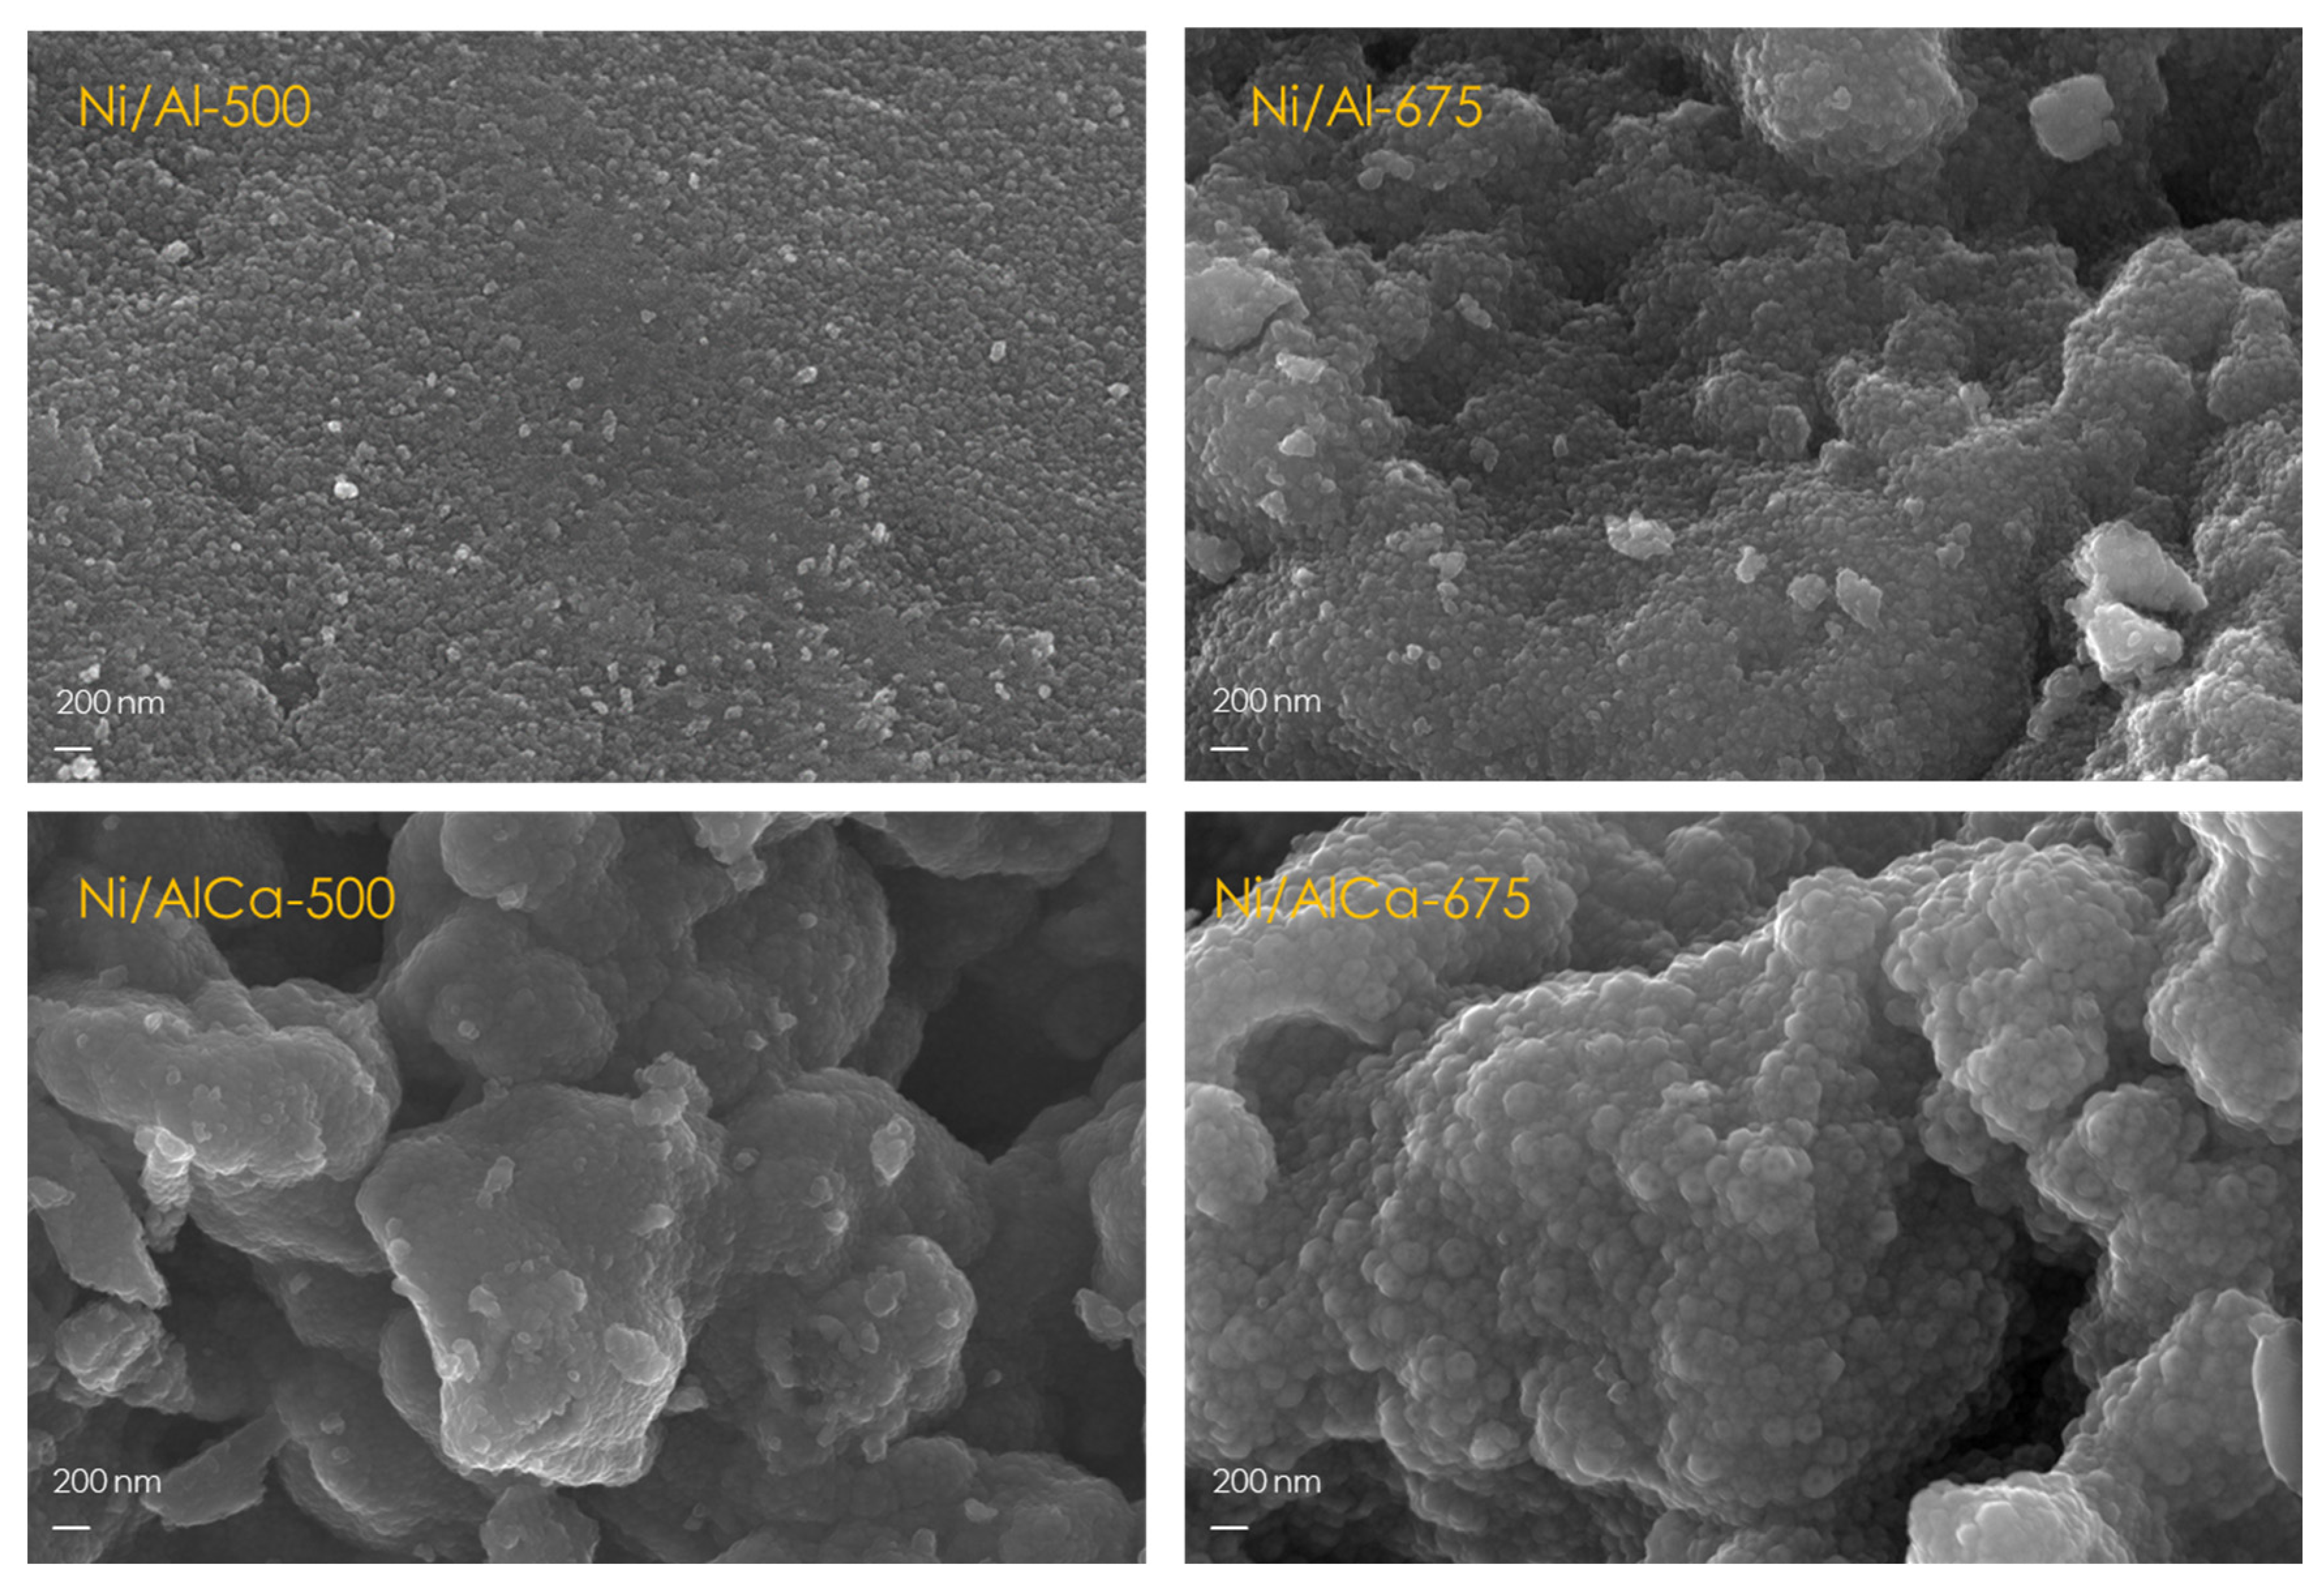
2.1.5. Morphology
2.2. Results from Pure Glycerol
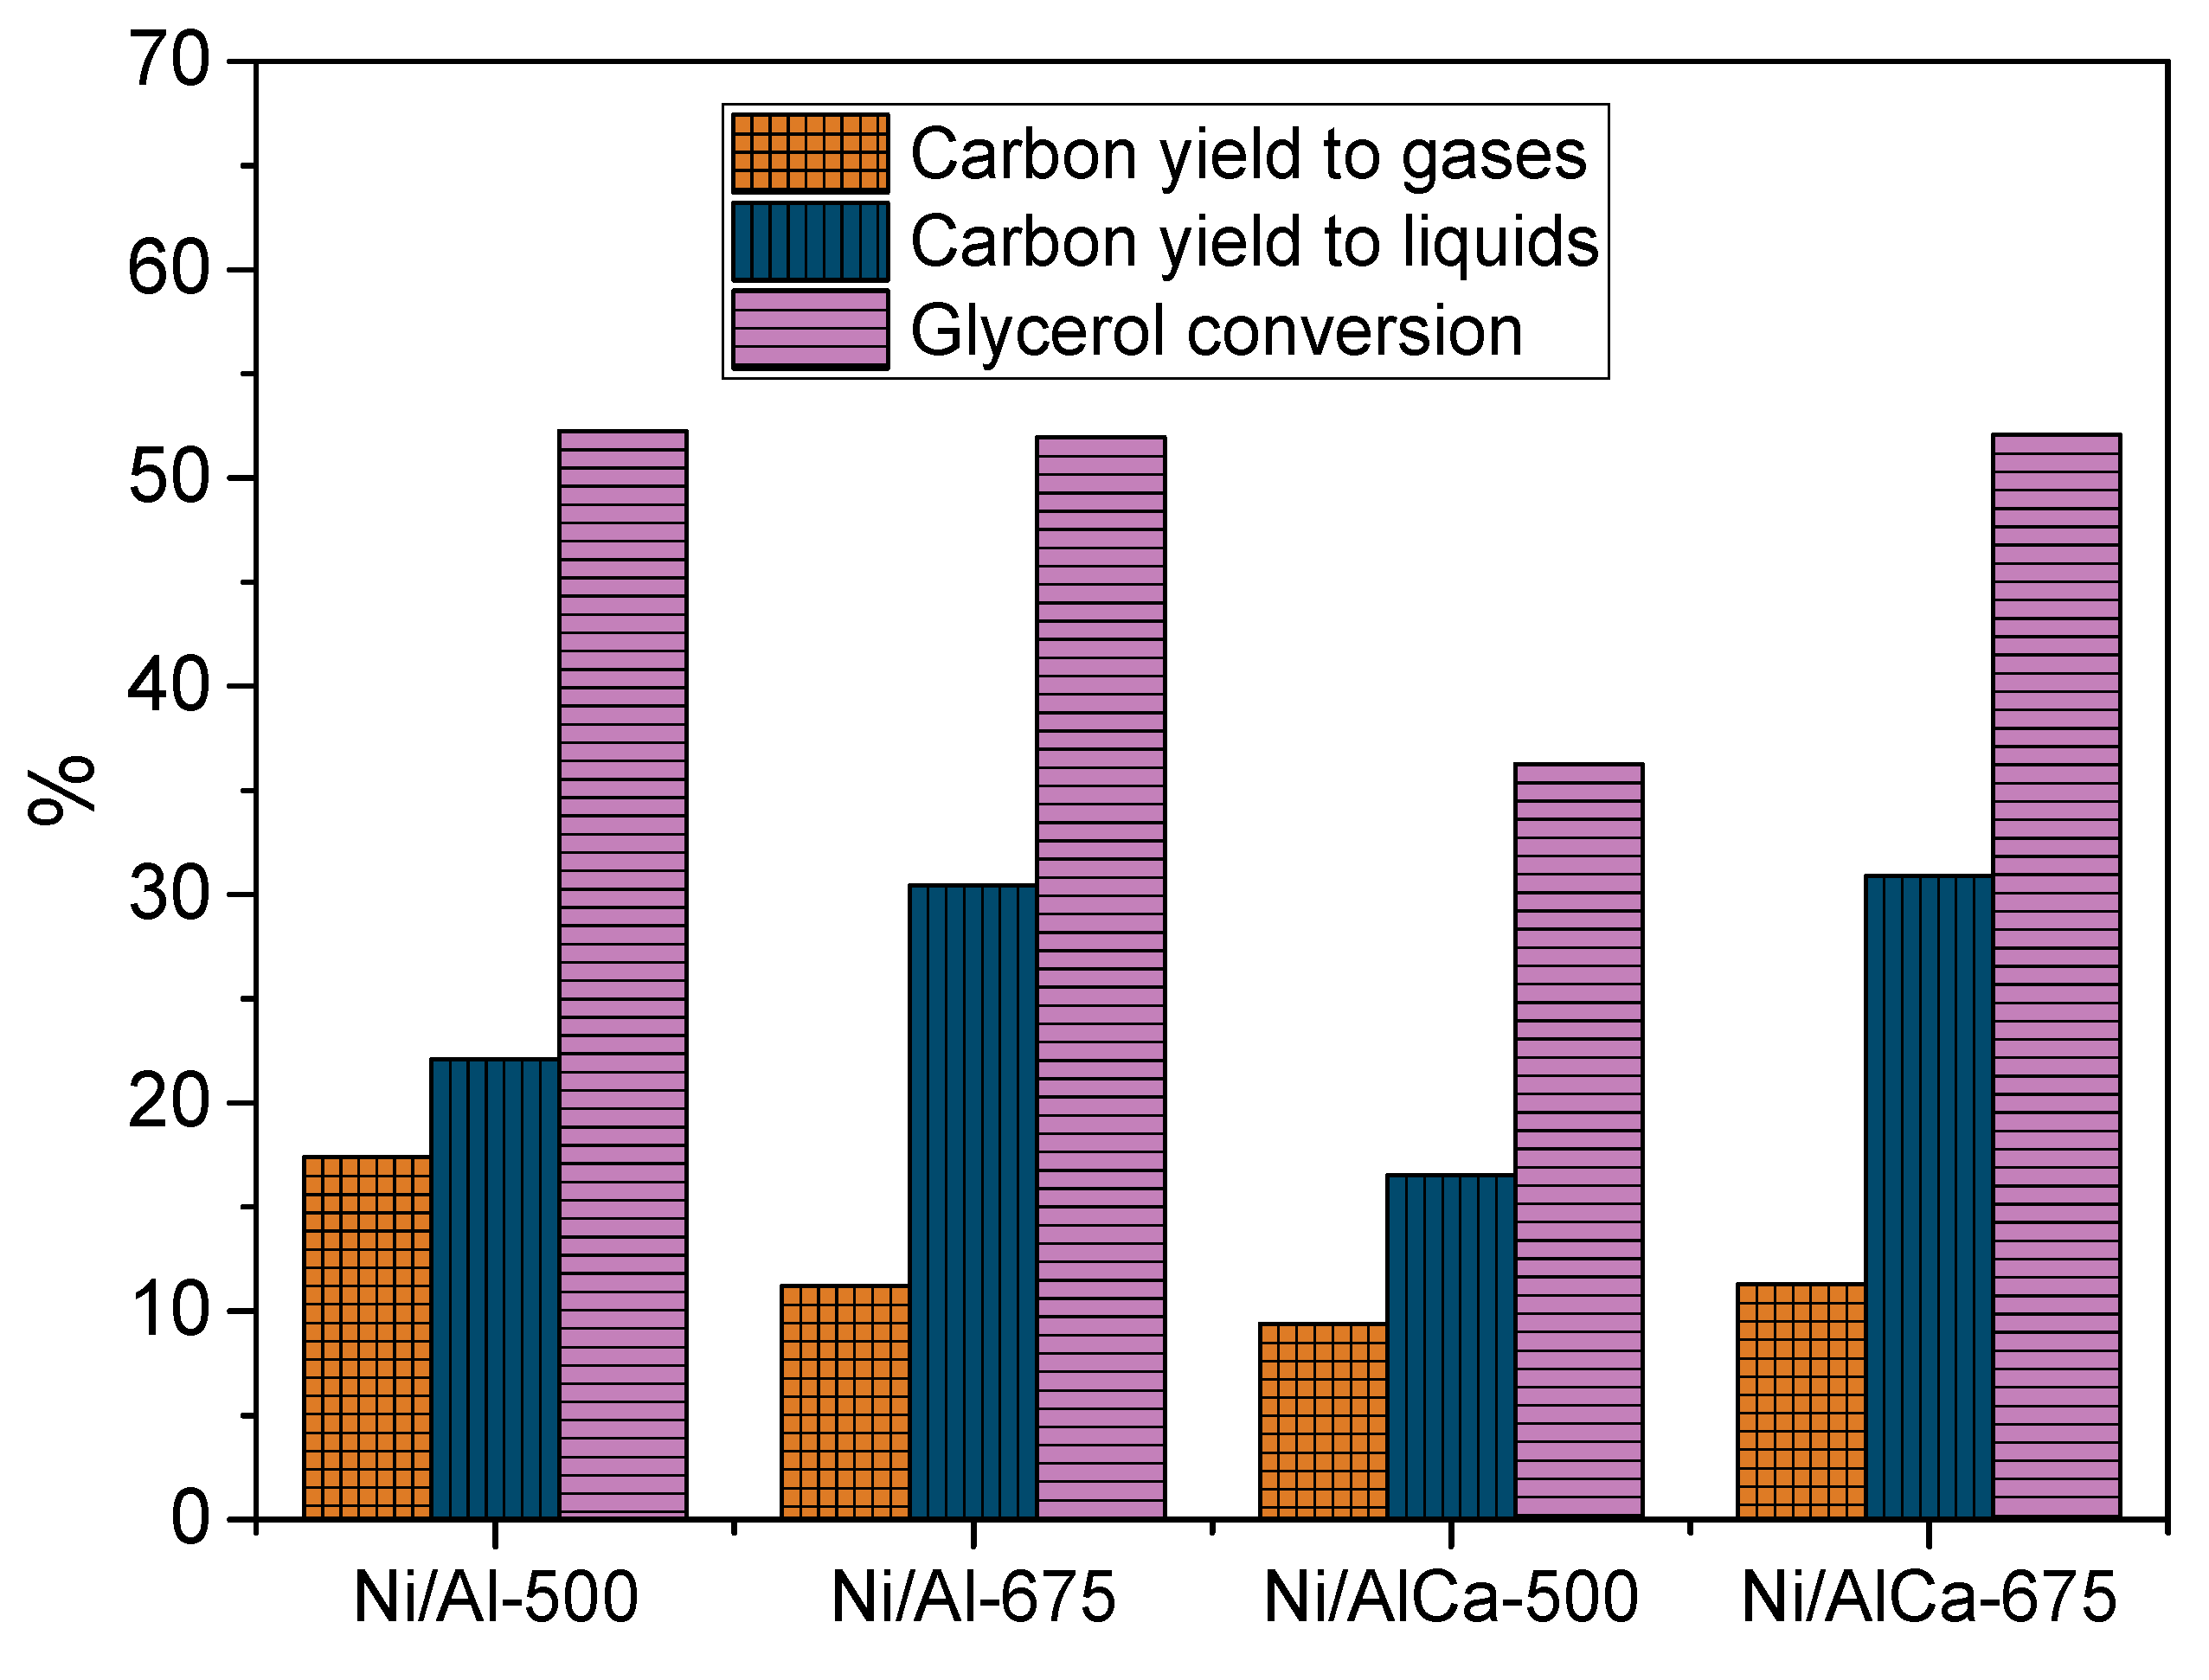
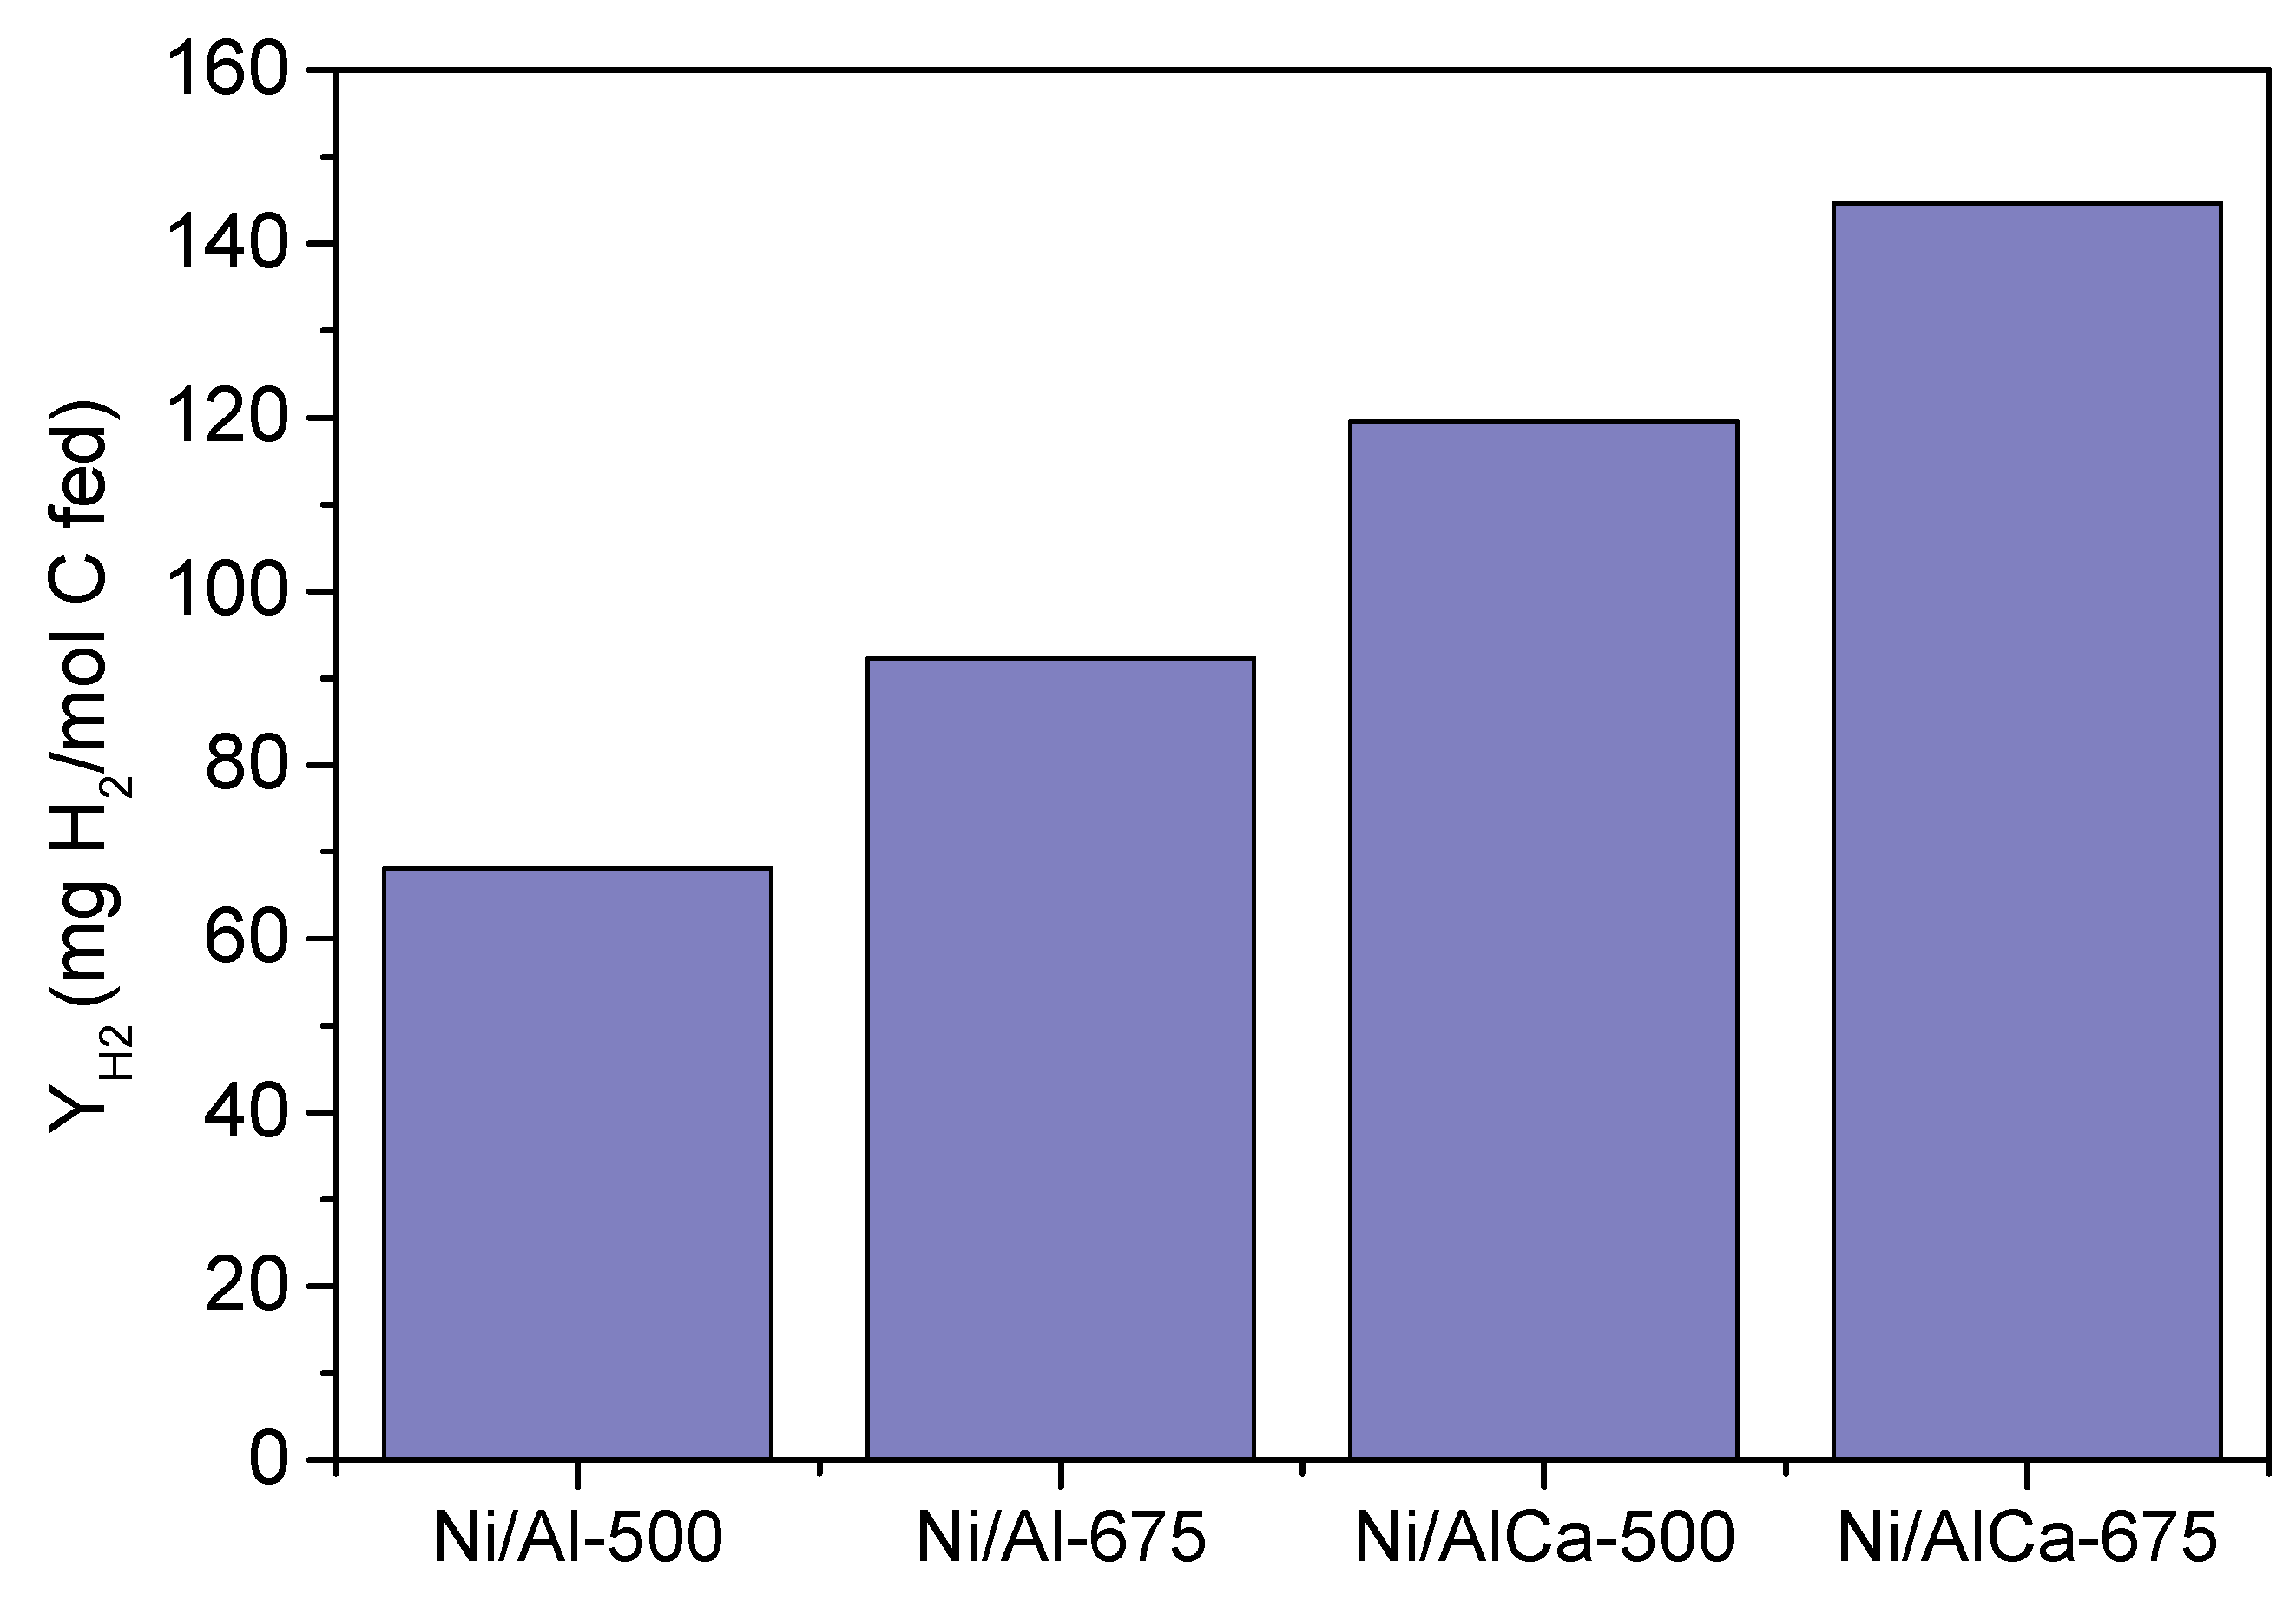
2.2.1. Catalytic Performance
2.2.2. Catalyst Characterization
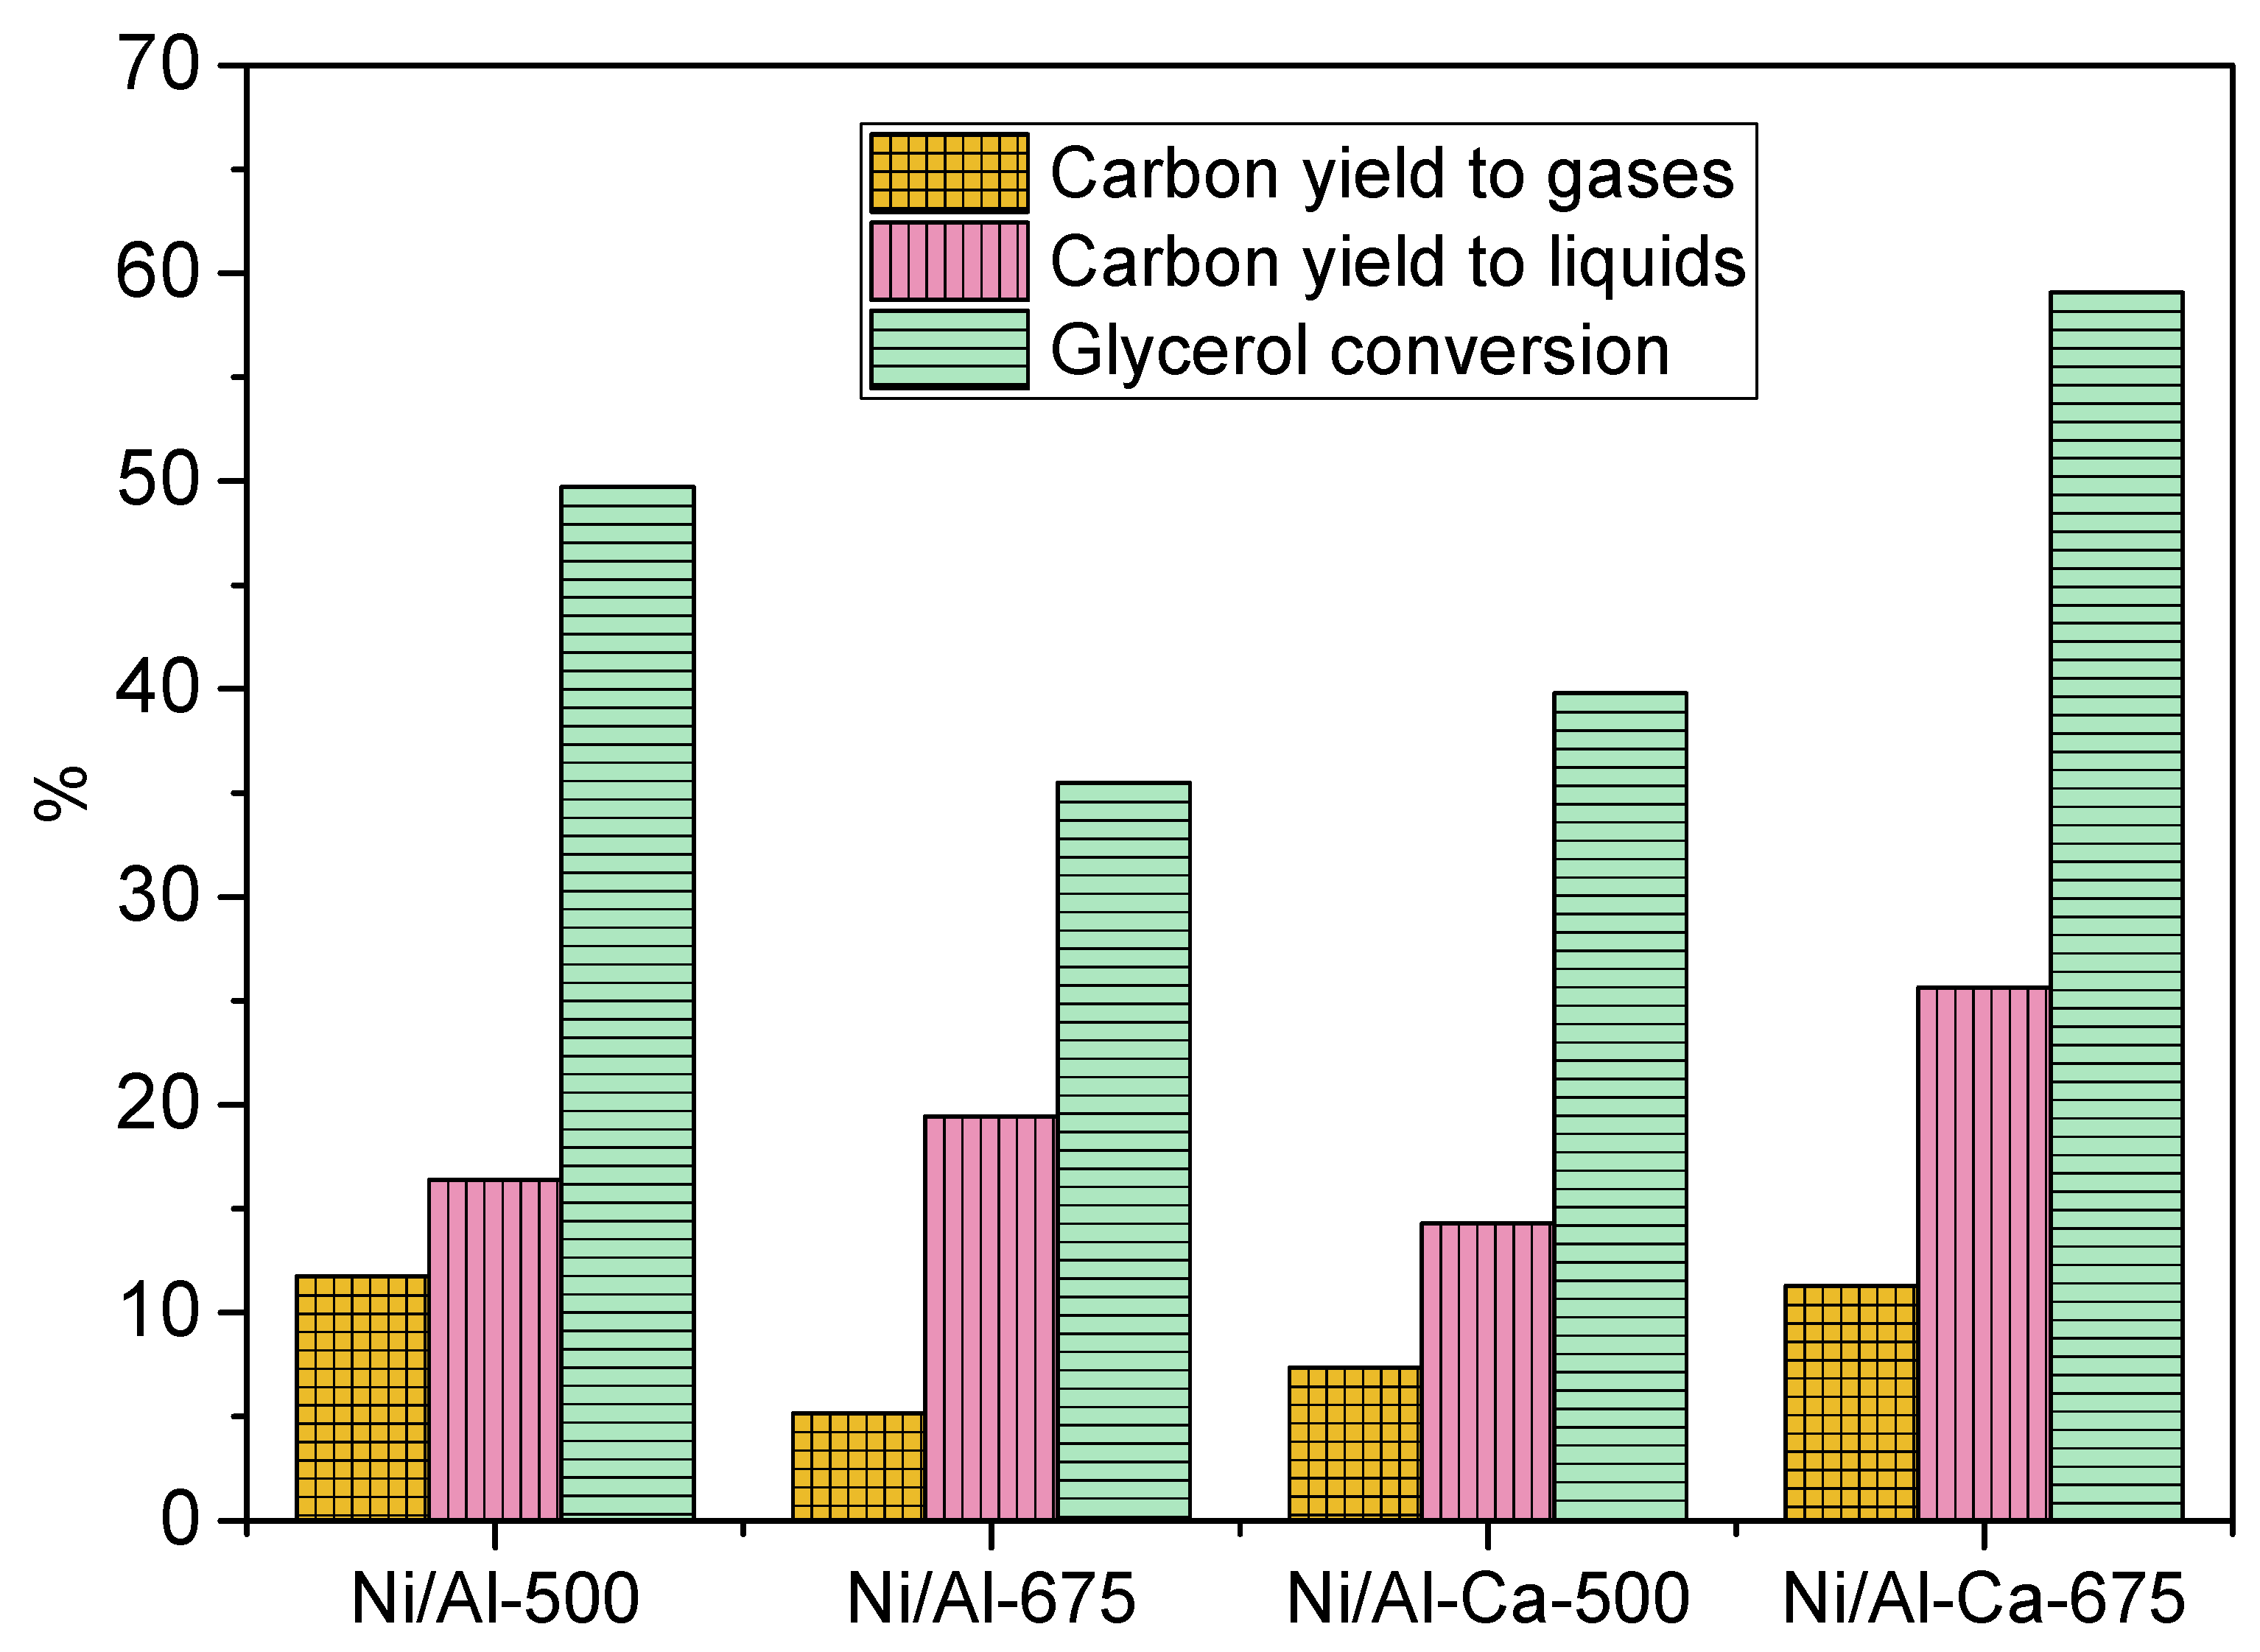
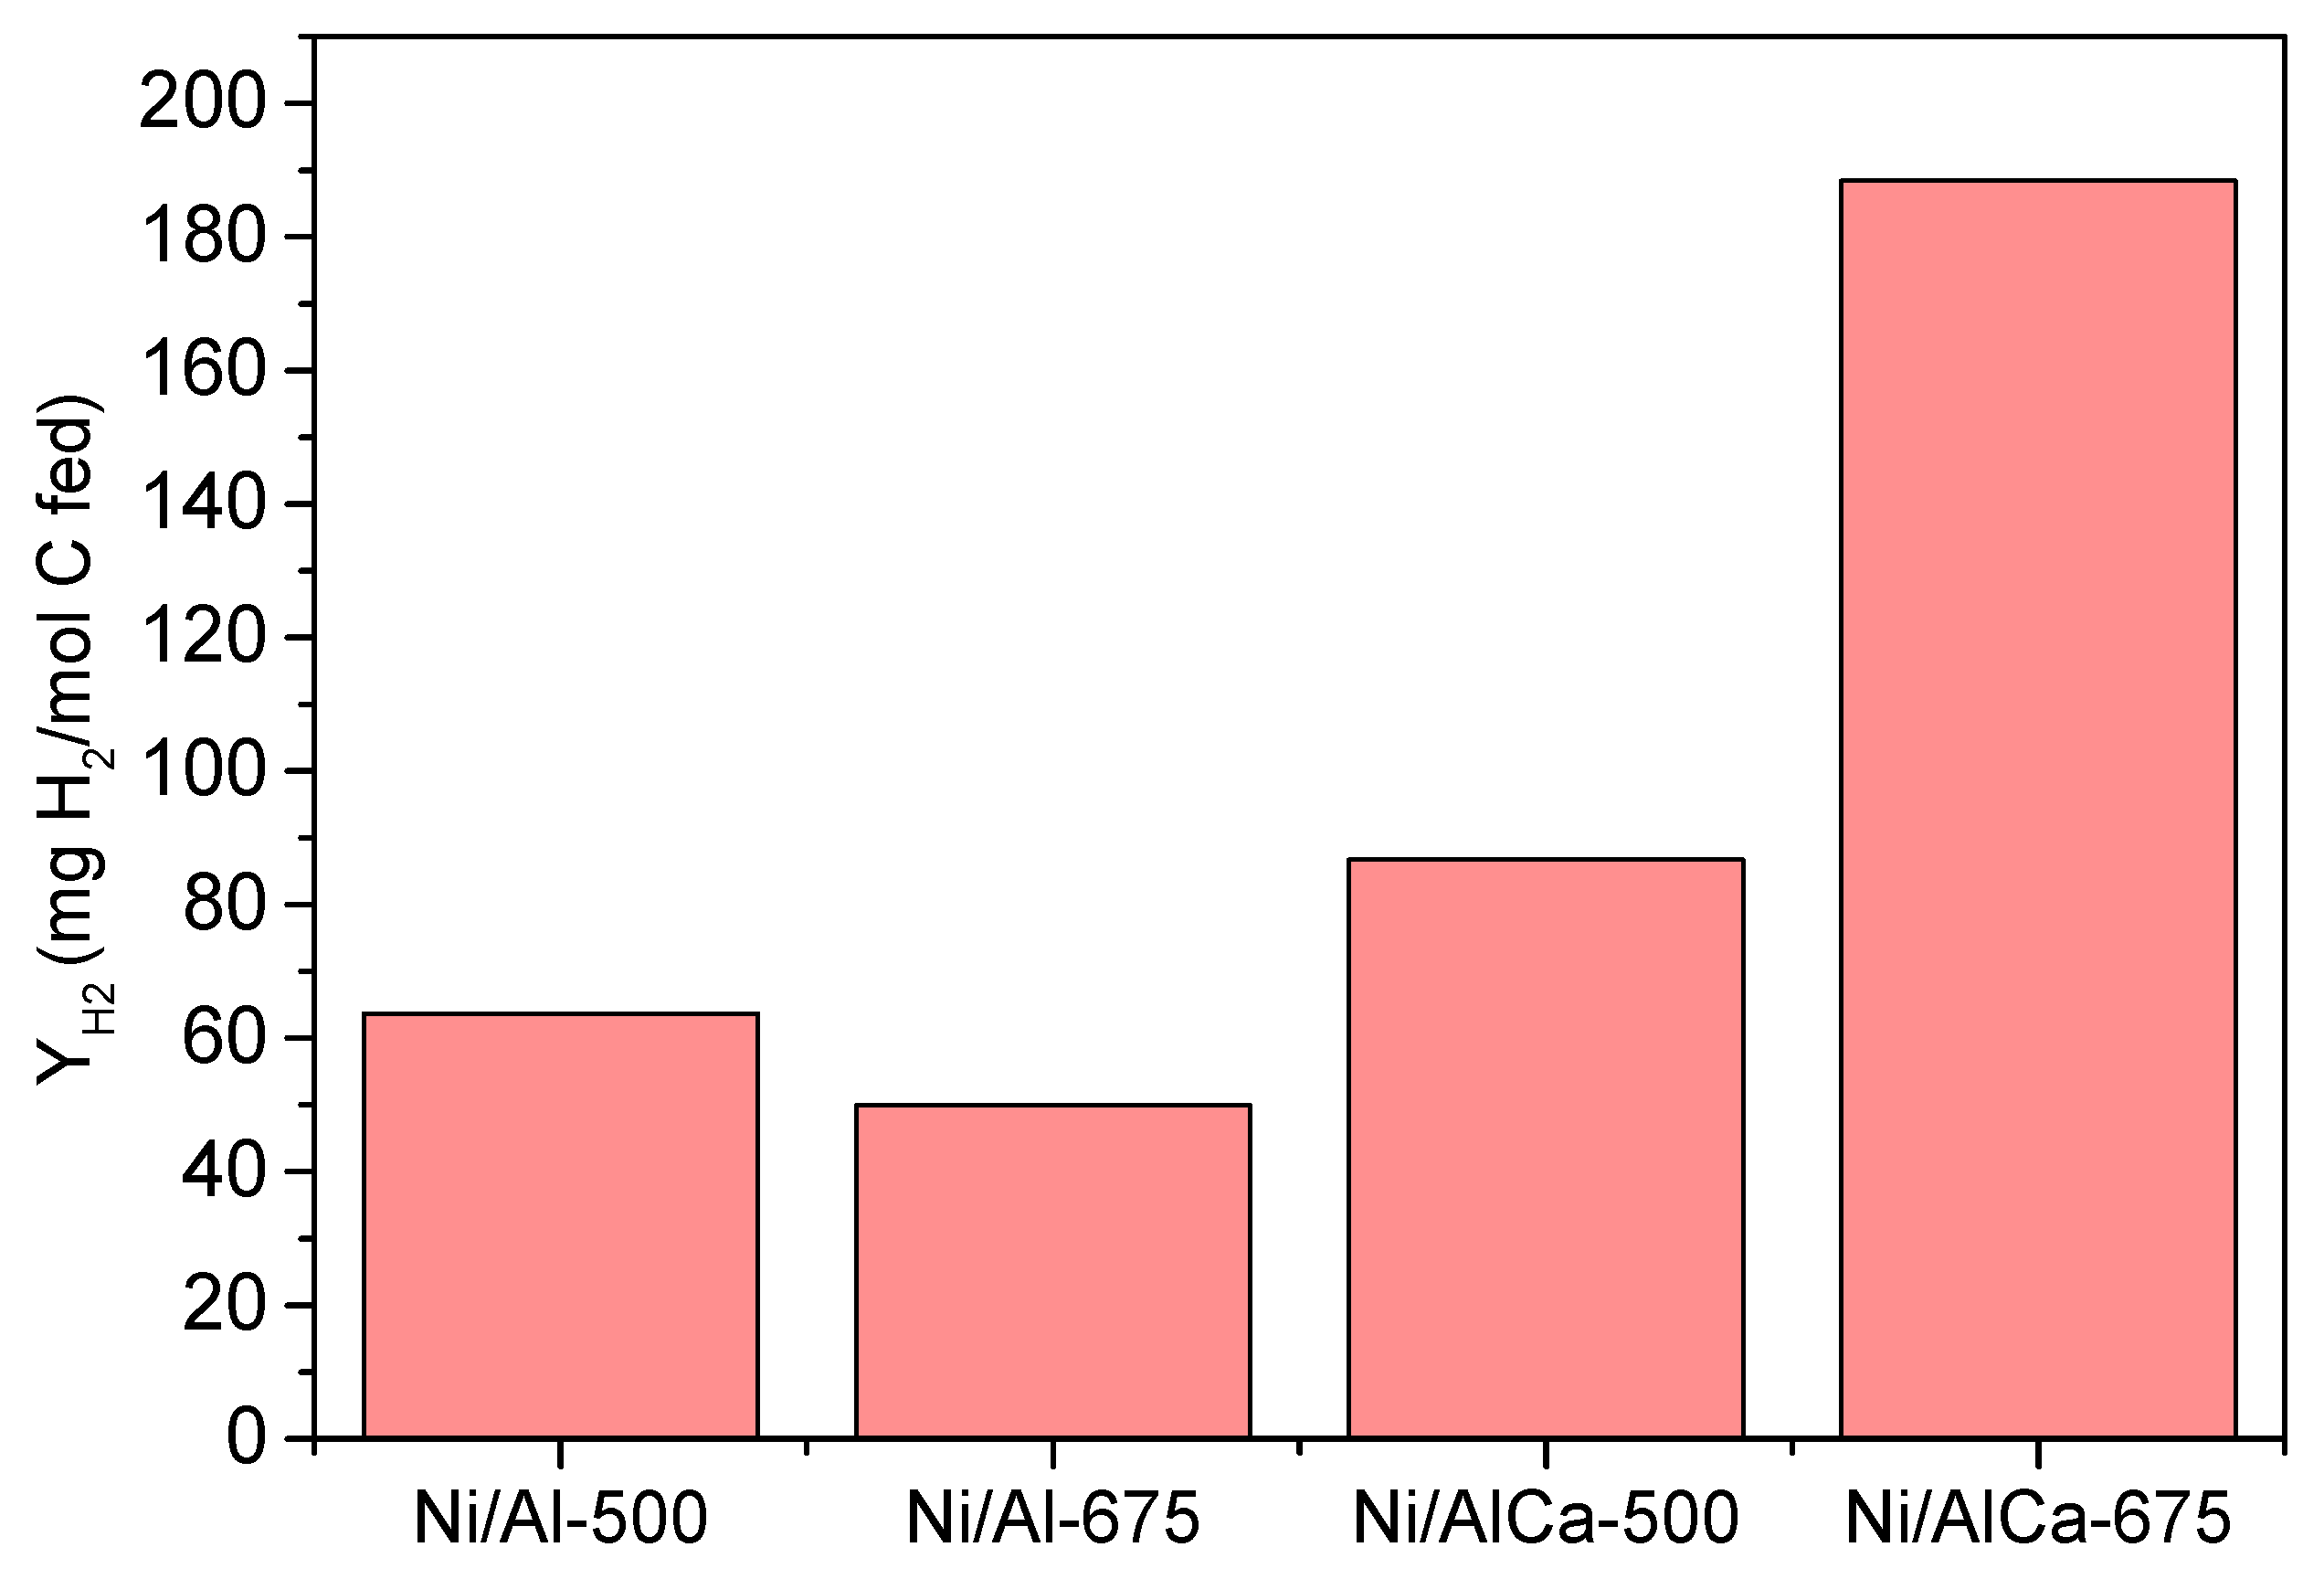
2.3. Results from Refined Crude Glycerol
2.4. Overall: Effect of the Type of Glycerol
3. Experimental Section
3.1. Crude Glycerol and Purification Process
3.2. Synthesis and Characterization of the Catalysts
3.3. Catalytic Performance
4. Conclusions
Supplementary Materials
Author Contributions
Funding
Institutional Review Board Statement
Data Availability Statement
Acknowledgments
Conflicts of Interest
References
- Prokaew, A.; Smith, S.M.; Luengnaruemitchai, A.; Kandiah, M.; Boonyuen, S. Biodiesel production from waste cooking oil using a new heterogeneous catalyst SrO doped CaO nanoparticles. J. Met. Mater. Miner. 2022, 32, 79–85. [Google Scholar] [CrossRef]
- Wu, K.; Dou, B.; Zhang, H.; Liu, D.; Chen, H.; Xu, Y. Effect of impurities of CH3OH, CH3COOH, and KOH on aqueous phase reforming of glycerol over mesoporous Ni-Cu/CeO2 catalyst. J. Energy Inst. 2021, 99, 198–208. [Google Scholar] [CrossRef]
- Mohamed, E.A.; Betiha, M.A.; Negm, N.A. Insight into the Recent Advances in Sustainable Biodiesel Production by Catalytic Conversion of Vegetable Oils: Current Trends, Challenges, and Prospects. Energy Fuels 2023, 37, 2631–2647. [Google Scholar] [CrossRef]
- García, M.; Botella, L.; Gil-Lalaguna, N.; Arauzo, J.; Gonzalo, A.; Sánchez, J.L. Antioxidants for biodiesel: Additives prepared from extracted fractions of bio-oil. Fuel Process. Technol. 2017, 156, 407–414. [Google Scholar] [CrossRef]
- Seretis, A.; Tsiakaras, P. Hydrogenolysis of glycerol to propylene glycol by in situ produced hydrogen from aqueous phase reforming of glycerol over SiO2-Al2O3 supported nickel catalyst. Fuel Process. Technol. 2016, 142, 135–146. [Google Scholar] [CrossRef]
- Liu, S.; Tamura, M.; Shen, Z.; Zhang, Y.; Nakagawa, Y.; Tomishige, K. Hydrogenolysis of glycerol with in-situ produced H-2 by aqueous-phase reforming of glycerol using Pt-modified Ir-ReOx/SiO2 catalyst. Catal. Today 2018, 303, 106–116. [Google Scholar] [CrossRef]
- Reynoso, A.; Ayastuy, J.; Iriarte-Velasco, U.; Gutierrez-Ortiz, M. Aqueous-phase reforming of glycerol over Pt-Co catalyst: Effect of process variables. J. Environ. Chem. Eng. 2022, 10, 107402. [Google Scholar] [CrossRef]
- Seretis, A.; Tsiakaras, P. Crude bio-glycerol aqueous phase reforming and hydrogenolysis over commercial SiO2-Al2O3 nickel catalyst. Renew. Energy 2016, 97, 373–379. [Google Scholar] [CrossRef]
- Fasolini, A.; Cespi, D.; Tabanelli, T.; Cucciniello, R.; Cavani, F. Hydrogen from Renewables: A Case Study of Glycerol Reforming. Catalysts 2019, 9, 722. [Google Scholar] [CrossRef]
- Authayanun, S.; Arpornwichanop, A.; Paengjuntuek, W.; Assabumrungrat, S. Thermodynamic study of hydrogen production from crude glycerol autothermal reforming for fuel cell applications. Int. J. Hydrogen Energy 2010, 35, 6617–6623. [Google Scholar] [CrossRef]
- Yu, J.F.; Ge, Q.J.; Fang, W.; Xu, H.Y. Influences of calcination temperature on the efficiency of CaO promotion over CaO modified Pt/gamma-Al2O3 catalyst. Appl. Catal. A-Gen. 2011, 395, 114–119. [Google Scholar] [CrossRef]
- Jimmy, U.; Mohamedali, M.; Ibrahim, H. Thermodynamic Analysis of Autothermal Reforming of Synthetic Crude Glycerol (SCG) for Hydrogen Production. ChemEngineering 2017, 1, 4. [Google Scholar] [CrossRef]
- Sabokmalek, S.; Alavi, S.M.; Rezaei, M.; Akbari, E. Hydrogen Production by Glycerol Steam Reforming on the Ni/CaO-Al2O3 Catalysts: The Study of Synergistic Effect Between CaO and Al2O3. Catal. Lett. 2023, 1–14. [Google Scholar] [CrossRef]
- Dahdah, E.; Estephane, J.; Gennequin, C.; Aboukais, A.; Aouad, S.; Abi-Aad, E. Effect of La promotion on Ni/Mg-Al hydrotalcite derived catalysts for glycerol steam reforming. J. Environ. Chem. Eng. 2020, 8, 104228. [Google Scholar] [CrossRef]
- Cortright, R.; Davda, R.; Dumesic, J. Hydrogen from catalytic reforming of biomass-derived hydrocarbons in liquid water. Nature 2002, 418, 964–967. [Google Scholar] [CrossRef] [PubMed]
- Guo, Y.; Azmat, M.; Liu, X.; Wang, Y.; Lu, G. Effect of support’s basic properties on hydrogen production in aqueous-phase reforming of glycerol and correlation between WGS and APR. Appl. Energy 2012, 92, 218–223. [Google Scholar] [CrossRef]
- Morales-Marin, A.; Ayastuy, J.; Iriarte-Velasco, U.; Gutierrez-Ortiz, M. Biohydrogen production by glycerol Aqueous-Phase Reforming: Effect of promoters (Ce or Mg) in the NiAl2O4 spinel-derived catalysts. J. Environ. Chem. Eng. 2021, 9, 106433. [Google Scholar] [CrossRef]
- Morales-Marin, A.; Ayastuy, J.; Iriarte-Velasco, U.; Gutierrez-Ortiz, M.; Environm, C.T. Nickel aluminate spinel-derived catalysts for the aqueous phase reforming of glycerol: Effect of reduction temperature. Appl. Catal. B-Environ. 2019, 244, 931–945. [Google Scholar] [CrossRef]
- El Doukkali, M.; Iriondo, A.; Cambra, J.; Gandarias, I.; Jalowiecki-Duhamel, L.; Dumeignil, F.; Arias, P. Deactivation study of the Pt and/or Ni-based gamma-Al2O3 catalysts used in the aqueous phase reforming of glycerol for H2 production. Appl. Catal. A-Gen. 2014, 472, 80–91. [Google Scholar] [CrossRef]
- Koichumanova, K.; Vikla, A.K.K.; De Vlieger, D.J.M.; Seshan, K.; Mojet, B.L.; Lefferts, L. Towards Stable Catalysts for Aqueous Phase Conversion of Ethylene Glycol for Renewable Hydrogen. ChemSusChem 2013, 6, 1717–1723. [Google Scholar] [CrossRef]
- Inns, D.R.; Pei, X.; Irving, D.J.M.; Kondrat, S.A. The influence of phase purity on the stability of Pt/LaAlO3 catalysts in the aqueous phase reforming of glycerol. Mater. Today Chem. 2022, 26, 101230. [Google Scholar] [CrossRef]
- Larimi, A.; Kazemeini, M.; Khorasheh, F. Highly selective doped Pt-MgO nano-sheets for renewable hydrogen production from APR of glycerol. Int. J. Hydrogen Energy 2016, 41, 17390–17398. [Google Scholar] [CrossRef]
- Seretis, A.; Tsiakaras, P. Aqueous phase reforming (APR) of glycerol over platinum supported on Al2O3 catalyst. Renew. Energy 2016, 85, 1116–1126. [Google Scholar] [CrossRef]
- Barbelli, M.L.; Pompeo, F.; Santori, G.F.; Nichio, N.N. Pt catalyst supported on alpha-Al2O3 modified with CeO2 and ZrO2 for aqueous-phase-reforming of glycerol. Catal. Today 2013, 213, 58–64. [Google Scholar] [CrossRef]
- Reynoso, A.J.; Iriarte-Velasco, U.; Gutierrez-Ortiz, M.A.; Ayastuy, J.L. Highly stable Pt/CoAl2O4 catalysts in Aqueous-Phase Reforming of glycerol. Catal. Today 2021, 367, 278–289. [Google Scholar] [CrossRef]
- Menezes, A.O.; Rodrigues, M.T.; Zimmaro, A.; Borges, L.E.P.; Fraga, M.A. Production of renewable hydrogen from aqueous-phase reforming of glycerol over Pt catalysts supported on different oxides. Renew. Energy 2011, 36, 595–599. [Google Scholar] [CrossRef]
- Bastan, F.; Kazemeini, M. Renewable hydrogen production by aqueous-phase reforming of Glycerol using Ni/Al2O3-MgO nano-catalyst: Effect of the Ni loading. Biomass Convers. Biorefinery 2023, 13, 237–246. [Google Scholar] [CrossRef]
- Lee, H.-J.; Shin, G.S.; Kim, Y.-C. Characterization of supported Ni catalysts for aqueous-phase reforming of glycerol. Korean J. Chem. Eng. 2015, 32, 1267–1272. [Google Scholar] [CrossRef]
- Cho, S.H.; Moon, D.J. Aqueous Phase Reforming of Glycerol Over Ni-Based Catalysts for Hydrogen Production. J. Nanosci. Nanotechnol. 2011, 11, 7311–7314. [Google Scholar] [CrossRef]
- Cheng, W.; Wang, Y.S.; Chen, M.Q.; Liang, D.F.; Li, C.; Yang, Z.L.; Wang, J. Hydrogen production from aqueous phase reforming of glycerol over attapulgite-supported nickel catalysts: Effect of acid/base treatment and Fe additive. Int. J. Hydrogen Energy 2022, 47, 7082–7099. [Google Scholar] [CrossRef]
- Wu, K.; Dou, B.; Zhang, H.; Liu, D.; Chen, H.; Xu, Y. Aqueous phase reforming of biodiesel byproduct glycerol over mesoporous Ni-Cu/CeO2 for renewable hydrogen production. Fuel 2022, 308, 122014. [Google Scholar] [CrossRef]
- Guo, Y.; Liu, X.H.; Azmat, M.U.; Xu, W.J.; Ren, J.W.; Wang, Y.Q.; Lu, G.Z. Hydrogen production by aqueous-phase reforming of glycerol over Ni-B catalysts. Int. J. Hydrogen Energy 2012, 37, 227–234. [Google Scholar] [CrossRef]
- Garcia, L.; Valiente, A.; Oliva, M.; Ruiz, J.; Arauzo, J. Influence of operating variables on the aqueous-phase reforming of glycerol over a Ni/Al coprecipitated catalyst. Int. J. Hydrogen Energy 2018, 43, 20392–20407. [Google Scholar] [CrossRef]
- Remon, J.; Gimenez, J.; Valiente, A.; Garcia, L.; Arauzo, J. Production of gaseous and liquid chemicals by aqueous phase reforming of crude glycerol: Influence of operating conditions on the process. Energy Convers. Manag. 2016, 110, 90–112. [Google Scholar] [CrossRef]
- Charisiou, N.D.; Siakavelas, G.; Papageridis, K.N.; Baklavaridis, A.; Tzounis, L.; Polychronopoulou, K.; Goula, M.A. Hydrogen production via the glycerol steam reforming reaction over nickel supported on alumina and lanthana-alumina catalysts. Int. J. Hydrogen Energy 2017, 42, 13039–13060. [Google Scholar] [CrossRef]
- Charisiou, N.D.; Siakavelas, G.; Tzounis, L.; Dou, B.; Sebastian, V.; Hinder, S.J.; Baker, M.A.; Polychronopoulou, K.; Goula, M.A. Ni/Y2O3-ZrO2 catalyst for hydrogen production through the glycerol steam reforming reaction. Int. J. Hydrogen Energy 2020, 45, 10442–10460. [Google Scholar] [CrossRef]
- Silva, J.M.; Ribeiro, L.S.; Orfao, J.J.M.; Soria, M.A.; Madeira, L.M. Low temperature glycerol steam reforming over a Rh-based catalyst combined with oxidative regeneration. Int. J. Hydrogen Energy 2019, 44, 2461–2473. [Google Scholar] [CrossRef]
- Macedo, M.S.; Kraleva, E.; Ehrich, H.; Soria, M.A.; Madeira, L.M. Hydrogen production from glycerol steam reforming over Co-based catalysts supported on La2O3, AlZnOx and AlLaOx. Int. J. Hydrogen Energy 2022, 47, 33239–33258. [Google Scholar] [CrossRef]
- Shabaker, J.W.; Huber, G.W.; Dumesic, J.A. Aqueous-phase reforming of oxygenated hydrocarbons over Sn-modified Ni catalysts. J. Catal. 2004, 222, 180–191. [Google Scholar] [CrossRef]
- Iriondo, A.; Cambra, J.F.; Barrio, V.L.; Guemez, M.B.; Arias, P.L.; Sanchez-Sanchez, M.C.; Navarro, R.M.; Fierro, J.L.G. Glycerol liquid phase conversion over monometallic and bimetallic catalysts: Effect of metal, support type and reaction temperatures. Appl. Catal. B-Environ. 2011, 106, 83–93. [Google Scholar] [CrossRef]
- Wang, Q.; Xie, W.; Jia, X.Y.; Chen, B.Q.; An, S.; Xie, X.Y.; Huang, L.H. Ca-Al layered double hydroxides-derived Ni-based catalysts for hydrogen production via auto-thermal reforming of acetic acid. Int. J. Hydrogen Energy 2019, 44, 20007–20016. [Google Scholar] [CrossRef]
- Reynoso, A.; Ayastuy, J.; Iriarte-Velasco, U.; Gutierrez-Ortiz, M. Bio-hydrogen and valuable chemicals from industrial waste glycerol via catalytic aqueous-phase transformation. Fuel Process. Technol. 2023, 242, 107634. [Google Scholar] [CrossRef]
- Boga, D.A.; Liu, F.; Bruijnincx, P.C.A.; Weckhuysen, B.M. Aqueous-phase reforming of crude glycerol: Effect of impurities on hydrogen production. Catal. Sci. Technol. 2016, 6, 134–143. [Google Scholar] [CrossRef]
- Lehnert, K.; Claus, P. Influence of Pt particle size and support type on the aqueous-phase reforming of glycerol. Catal. Commun. 2008, 9, 2543–2546. [Google Scholar] [CrossRef]
- Remon, J.; Jarauta-Cordoba, C.; Garcia, L.; Arauzo, J. Effect of acid (CH3COOH, H2SO4 and H3PO4) and basic (KOH and NaOH) impurities on glycerol valorisation by aqueous phase reforming. Appl. Catal. B-Environ. 2017, 219, 362–371. [Google Scholar] [CrossRef]
- Remon, J.; Ruiz, J.; Oliva, M.; Garcia, L.; Arauzo, J. Effect of biodiesel-derived impurities (acetic acid, methanol and potassium hydroxide) on the aqueous phase reforming of glycerol. Chem. Eng. J. 2016, 299, 431–448. [Google Scholar] [CrossRef]
- Raso, R.; Garcia, L.; Ruiz, J.; Oliva, M.; Arauzo, J. Aqueous phase hydrogenolysis of glycerol over Ni/Al-Fe catalysts without external hydrogen addition. Appl. Catal. B-Environ. 2021, 283, 119598. [Google Scholar] [CrossRef]
- Thommes, M.; Kaneko, K.; Neimark, A.; Olivier, J.; Rodriguez-Reinoso, F.; Rouquerol, J.; Sing, K. Physisorption of gases, with special reference to the evaluation of surface area and pore size distribution (IUPAC Technical Report). Pure Appl. Chem. 2015, 87, 1051–1069. [Google Scholar] [CrossRef]
- Jing, J.-Y.; Wang, S.-D.; Zhang, X.-W.; Li, Q.; Li, W.-Y. Influence of Ca/Al molar ratio on structure and catalytic reforming performance of Ni/CaO-Al2O3 catalyst. J. Fuel Chem. Technol. 2017, 45, 956–962. [Google Scholar] [CrossRef]
- Medrano, J.; Oliva, M.; Ruiz, J.; Garcia, L.; Afauzo, J. Catalytic steam reforming of model compounds of biomass pyrolysis liquids in fluidized bed reactor with modified Ni/Al catalysts. J. Anal. Appl. Pyrolysis 2009, 85, 214–225. [Google Scholar] [CrossRef]
- Quincoces, C.E.; Dicundo, S.; Alvarez, A.M.; Gonzalez, M.G. Effect of addition of CaO on Ni/Al2O3 catalysts over CO2 reforming of methane. Mater. Lett. 2001, 50, 21–27. [Google Scholar] [CrossRef]
- Raso, R.; Lete, A.; Garcia, L.; Ruiz, J.; Oliva, M.; Arauzo, J. Aqueous phase hydrogenolysis of glycerol with in situ generated hydrogen over Ni/Al3Fe1 catalyst: Effect of the calcination temperature. RSC Adv. 2023, 13, 5483–5495. [Google Scholar] [CrossRef]
- Meng, F.; Zhong, P.; Li, Z.; Cui, X.; Zheng, H. Surface Structure and Catalytic Performance of Ni-Fe Catalyst for Low-Temperature CO Hydrogenation. J. Chem. 2014, 2014, 534842. [Google Scholar] [CrossRef]
- Elias, K.; Lucredio, A.; Assaf, E. Effect of CaO addition on acid properties of Ni-Ca/Al2O3 catalysts applied to ethanol steam reforming. Int. J. Hydrogen Energy 2013, 38, 4407–4417. [Google Scholar] [CrossRef]
- Dias, J.; Assaf, J. Influence of calcium content in Ni/CaO/gamma-Al2O3 catalysts for CO2-reforming of methane. Catal. Today 2003, 85, 59–68. [Google Scholar] [CrossRef]
- Cai, F.; Pan, D.; Ibrahim, J.; Zhang, J.; Xiao, G. Hydrogenolysis of glycerol over supported bimetallic Ni/Cu catalysts with and without external hydrogen addition in a fixed-bed flow reactor. Appl. Catal. A-Gen. 2018, 564, 172–182. [Google Scholar] [CrossRef]
- Chimentao, R.; Miranda, B.; Ruiz, D.; Gispert-Guirado, F.; Medina, F.; Llorca, J.; Santos, J. Catalytic performance of zinc-supported copper and nickel catalysts in the glycerol hydrogenolysis. J. Energy Chem. 2020, 42, 185–194. [Google Scholar] [CrossRef]
- García-Bordejé, E.; Dongil, A.B.; Conesa, J.M.; Guerrero-Ruiz, A.; Rodríguez-Ramos, I. Promotion of Ru or Ni on Alumina Catalysts with a Basic Metal for CO2 Hydrogenation: Effect of the Type of Metal (Na, K, Ba). Nanomaterials 2022, 12, 1052. [Google Scholar] [CrossRef]
- Boukha, Z.; Jimenez-Gonzalez, C.; Gil-Calvo, M.; de Rivas, B.; Gonzalez-Velasco, J.R.; Gutierrez-Ortiz, J.I.; Lopez-Fonseca, R. MgO/NiAl2O4 as a new formulation of reforming catalysts: Tuning the surface properties for the enhanced partial oxidation of methane. Appl. Catal. B-Environ. 2016, 199, 372–383. [Google Scholar] [CrossRef]
- Goma, D.; Delgado, J.J.; Lefferts, L.; Faria, J.; Calvino, J.J.; Cauqui, M.Á. Catalytic Performance of Ni/CeO2/X-ZrO2 (X = Ca, Y) Catalysts in the Aqueous-Phase Reforming of Methanol. Nanomaterials 2019, 9, 1582. [Google Scholar] [CrossRef]
- Barzegari, F.; Kazemeini, M.; Rezaei, M.; Farhadi, F.; Keshavarz, A. Syngas production through CO2 reforming of propane over highly active and stable mesoporous NiO-MgO-SiO2 catalysts: Effect of calcination temperature. Fuel 2022, 322, 124211. [Google Scholar] [CrossRef]
- Raso, R.; Garcia, L.; Ruiz, J.; Oliva, M.; Arauzo, J. Study of Ni/Al-Fe Catalyst Stability in the Aqueous Phase Hydrogenolysis of Glycerol. Catalysts 2020, 10, 1482. [Google Scholar] [CrossRef]
- El Doukkali, M.; Iriondo, A.; Miletic, N.; Cambra, J.; Arias, P. Hydrothermal stability improvement of NiPt-containing gamma-Al2O3 catalysts tested in aqueous phase reforming of glycerol/water mixture for H-2 production. Int. J. Hydrogen Energy 2017, 42, 23617–23630. [Google Scholar] [CrossRef]
- Denigres, R.; Rocha, G.; Montes, C.; Vieira-Coelho, A. Synthesis and Characterization of Boehmites Obtained from Gibbsite in Presence of Different Environments. Mater. Res.-Ibero-Am. J. Mater. 2016, 19, 659–668. [Google Scholar] [CrossRef]
- Ardi, M.S.; Aroua, M.K.; Hashim, N.A. Progress, prospect and challenges in glycerol purification process: A review. Renew. Sustain. Energy Rev. 2015, 42, 1164–1173. [Google Scholar] [CrossRef]
- Roy, D.; Subramaniam, B.; Chaudhari, R. Aqueous phase hydrogenolysis of glycerol to 1,2-propanediol without external hydrogen addition. Catal. Today 2010, 156, 31–37. [Google Scholar] [CrossRef]


| Sample | Ni 1 (molar%) | Al 1 (molar%) | Ca 1 (molar%) | Ni 2 (molar%) | Al 2 (molar%) | Ca 2 (molar%) | Ca/Al 2 (molar%) |
|---|---|---|---|---|---|---|---|
| Ni/Al-500 | 28 | 72 | - | 28.3 3 | 71.7 3 | - | 0 |
| Ni/Al-675 | 28 | 72 | - | 29.0 | 71.0 | - | 0 |
| Ni/AlCa-500 | 28 | 67 | 5 | 25.9 | 69.1 | 5.0 | 7.2 |
| Ni/AlCa-675 | 28 | 67 | 5 | 28.5 | 66.4 | 5.1 | 7.7 |
| Sample | SBET 1 (m2/g) | vp 2 (cm3/g) | dp 2 (nm) |
|---|---|---|---|
| Ni/Al-500 | 256 | 0.145 | 3.7 |
| Ni/Al-675 | 203 | 0.193 | 3.9 |
| Ni/AlCa-500 | 232 | 0.147 | 3.3 |
| Ni/AlCa-675 | 188 | 0.180 | 4.4 |
| Sample | Temperature (°C)/Relative Amount (%) 1 | Total H2 Consumption Nired 2 | ||
|---|---|---|---|---|
| T1/F1 | T2/F2 | mmol H2/gcat | % | |
| Ni/Al-500 | 343/2.1 | 633/97.9 | 4.42 | 90.21 |
| Ni/Al-675 | - | 708/100.0 | 4.31 | 86.01 |
| Ni/AlCa-500 | 329/8.8 | 613/91.2 | 4.78 | 100 |
| Ni/AlCa-675 | 418/8.0 | 733/92.0 | 4.40 | 89.41 |
| Sample | Temperature (°C)/Relative Amount (%) 1 | Total NH3 Desorption | ||||
|---|---|---|---|---|---|---|
| T1/F1 | T2/F2 | T3/F3 | T4/F4 | μmol NH3/gcat | μmol NH3/m2 | |
| Ni/Al-500 | 170/7.3 | 274/37.1 | 503/55.6 | - | 919.58 | 3.59 |
| Ni/Al-675 | 170/10.2 | 275/41.9 | 480/47.9 | - | 548.75 | 2.70 |
| Ni/AlCa-500 | 184/9.0 | 253/28.1 | 455/47.7 | 703/15.2 | 531.93 | 2.29 |
| Ni/AlCa-675 | 182/8.3 | 265/20.4 | 461/47.6 | 711/23.7 | 493.25 | 2.62 |
| Sample | Temperature (°C)/Relative Amount (%) 1 | Total CO2 Desorption | |||
|---|---|---|---|---|---|
| T1/F1 | T2/F2 | T3/F3 | μmol CO2/gcat | μmol CO2/m2 | |
| Ni/Al-500 | 108/13.3 | 170/53.4 | 226/33.3 | 81.44 | 0.32 |
| Ni/Al-675 | 110/9.4 | 176/70.7 | 243/19.9 | 73.56 | 0.46 |
| Ni/AlCa-500 | 115/14.8 | 168/38.6 | 242/46.6 | 156.17 | 0.67 |
| Ni/AlCa-675 | 114/14.1 | 159/34.3 | 235/51.6 | 118.52 | 0.63 |
| Sample | H2 | Others 1 | H2/CO2 |
|---|---|---|---|
| Ni/Al-500 | 16.8 | 83.2 | 0.34 |
| Ni/Al-675 | 29.9 | 70.1 | 0.53 |
| Ni/AlCa-500 | 39.7 | 60.3 | 0.68 |
| Ni/AlCa-675 | 36.8 | 63.2 | 0.73 |
| Sample | SBET 1 (m2/g) | vp 2 (cm3/g) | dp 2 (nm) | Dboehmite 3 (nm) | DNi 3 (nm) |
|---|---|---|---|---|---|
| Ni/Al-500 | 241 (±8) | 0.089 (±0.020) | 3.1 (±0.0) | 28.3 | 5.8 |
| Ni/Al-675 | 134 (±3) | 0.168 (±0.004) | 6.8 (±0.4) | 29.9 | 19.9 |
| Ni/AlCa-500 | 244 (±4) | 0.097 (±0.008) | 3.0 (±0.0) | 20.0 | 14.4 |
| Ni/AlCa-675 | 192 (±8) | 0.132 (±0.012) | 3.1 (±0.1) | 15.0 | 20.4 |
| Sample | H2 | Others 1 | H2/CO2 |
|---|---|---|---|
| Ni/Al-500 | 21.8 | 78.2 | 0.39 |
| Ni/Al-675 | 33.3 | 66.8 | 0.51 |
| Ni/AlCa-500 | 37.8 | 62.2 | 0.64 |
| Ni/AlCa-675 | 46.1 | 53.9 | 0.88 |
| Sample | SBET 1 (m2/g) | vp 2 (cm3/g) | dp 2 (nm) | Dboehmite 3 (nm) | DNi 3 (nm) |
|---|---|---|---|---|---|
| Ni/Al-500 | 235 | 0.108 | 3.0 | 23.0 | 6.7 |
| Ni/Al-675 | 176 | 0.128 | 3.3 | 24.3 | 19.5 |
| Ni/AlCa-500 | 216 | 0.132 | 3.1 | 15.0 | 14.5 |
| Ni/AlCa-675 | 154 | 0.152 | 4.2 | 39.6 | 19.1 |
| Crude Glycerol | Refined Crude Glycerol | |
|---|---|---|
| Physical properties | ||
| pH | 11.87 ± 0.05 | 5.77 ± 0.15 |
| Density (g/cm3) | 1.096 ± 0.000 | 1.265 ± 0.001 |
| LHV (MJ/kg) | 22.673 ± 0.006 | 16.604 ± 0.00 |
| Chemical composition | ||
| Glycerol (wt.%) | 61.69 ± 5.56 | 82.32 ± 4.34 |
| Methanol (wt.%) | 25.91 ± 4.86 | 1.17 ± 0.52 |
| Acetic acid (wt.%) | 0 | 3.15 ± 0.70 |
| Elemental analysis | ||
| C (%) | 31.19 ± 0.25 | 26.60 ± 0.40 |
| H (%) | 6.77 ± 0.15 | 6.24 ± 0.20 |
| O * (%) | 62.05 ± 0.39 | 67.16 ± 0.59 |
Disclaimer/Publisher’s Note: The statements, opinions and data contained in all publications are solely those of the individual author(s) and contributor(s) and not of MDPI and/or the editor(s). MDPI and/or the editor(s) disclaim responsibility for any injury to people or property resulting from any ideas, methods, instructions or products referred to in the content. |
© 2023 by the authors. Licensee MDPI, Basel, Switzerland. This article is an open access article distributed under the terms and conditions of the Creative Commons Attribution (CC BY) license (https://creativecommons.org/licenses/by/4.0/).
Share and Cite
Raso, R.; Abad, E.; García, L.; Ruiz, J.; Oliva, M.; Arauzo, J. Renewable Hydrogen Production by Aqueous Phase Reforming of Pure/Refined Crude Glycerol over Ni/Al-Ca Catalysts. Molecules 2023, 28, 6695. https://doi.org/10.3390/molecules28186695
Raso R, Abad E, García L, Ruiz J, Oliva M, Arauzo J. Renewable Hydrogen Production by Aqueous Phase Reforming of Pure/Refined Crude Glycerol over Ni/Al-Ca Catalysts. Molecules. 2023; 28(18):6695. https://doi.org/10.3390/molecules28186695
Chicago/Turabian StyleRaso, Raquel, Eduardo Abad, Lucía García, Joaquín Ruiz, Miriam Oliva, and Jesús Arauzo. 2023. "Renewable Hydrogen Production by Aqueous Phase Reforming of Pure/Refined Crude Glycerol over Ni/Al-Ca Catalysts" Molecules 28, no. 18: 6695. https://doi.org/10.3390/molecules28186695