1. Introduction
ZnO based ceramic semiconductors are widely used as gas sensors [
1], piezoelectrics, electrodes for solar cells, phosphors, transparent conducting films and varistors [
2]. Varistors possess high energy absorption capability against various surges. They are extensively used as protective devices to regulate transient voltage surges of unwanted magnitudes due to their fast response to over voltage transients. They sense and clamp transient voltage pulses in nanosecond speed [
3]. The exact role of many additives in the electronic structure of ZnO based varistors is uncertain. Improving the electrical properties of ZnO based varistors is under research. The formulation of varistors that have high non-linear characteristics is the most important parameter to consider. Varistors are formed with small amounts of other metal oxides such as Al
2O
3, Bi
2O
3, Co
3O
4, Cr
2O
3, MnO, Sb
2O
3, TiO
2,
etc. Such additives are the main tools that are used to improve the non-linear response and stability of the varistor [
4]. This nonlinear response can be explained by the mechanism concerning the grain boundaries and associated defect concentration gradients [
5]. Electrical properties of the ceramic ZnO depend on the distribution of vacancies, impurities and their behavior. Much has been done in
I–V characterization of ZnO based varistors in previous studies [
4]. It is essential to obtain information on the optical absorption behavior of the ceramic ZnO doped with metal oxides for the examination of electronic states. The optical absorption behavior of ZnO doped with MnO
2, Co
3O
4 is discussed for the different doping levels of V
2O
5 at different processing conditions.
2. Experimental Section
ZnO (99.9% pure, Alfa Aesar) was doped with 0.4MnO
2 (99.999% pure, Alfa Aesar), 0.4Co
2O
3 (99.7% pure, Alfa Aesar) and xV
2O
5 (99.6% pure, Alfa Aesar) where x = 0–1.5 mol%. The detail of the composition is given in
Table 1. Powder of all ingredients (24 hour ball milled) of each mole percent was pre-sintered at 700 °C for 90 minutes in open atmosphere at a heating and cooling rate of 5 °C/min. Samples were ground and polyvinyl alcohol (1.1 wt %) was added as a binder. The dried powder was pressed under a force of 800 kg cm
−2 to form a disk of 10 mm diameter. Finally the disks were sintered at 950 and 1025 °C for 2 hours in air at a heating and cooling rate of 4 °C min
−1. The disk from each sample was ground for 1 hour and granulated by sieving through a 75-mesh screen for the photopyroelectric (PPE) spectroscopy and XRD analysis. Density was calculated using geometrical method. Polished samples were thermally etched for microstructure analysis. Grain size was determined by the grain boundary crossing method. Cu K
α radiation with PANAalytical (Philips) X’Pert Pro PW1830 was used for X-ray analysis. XRD data were analyzed by X’Pert High Score software.
The measurement of PPE signal amplitude has been described elsewhere [
6]. A light beam (300 to 800 nm) from one kW Xenon arc lamp, mechanically chopped at 10 Hz was used for PPE measurements. Optical absorption coefficient (
β) varies with the excitation photon energy (
hυ) [
7]. It is given by the expression, (
βhυ)
2 = (
hυ − Eg), where
hυ is the photon energy,
C is constant and
Eg is the optical energy band gap. PPE signal intensity (
ρ) is directly proportional to
β, hence (
ρhυ)
2 is related to
hυ linearly. From the plot of (
ρhυ)
2 versus hυ,
Eg is obtained by extrapolating the linear fitted region to zero.
Optical absorption edge has been observed in a variety of crystalline and amorphous materials. The optical-absorption edge has an important role in electron or exciton-phonon interactions [
8]. It is found that PPE signal intensities plotted semi logarithmically vary linearly with the photon energy just lower than the fundamental absorption edge [
9]. Therefore, an empirical relation for absolute measuring temperature (
T) and photon energy (
hυ) is given by the equation:
where
k is the Boltzmann constant and
P0,
σ,
υ0 are fitting parameters [
10,
11]. The value
σ/kT determines the exponential slope, where
σ is the steepness factor and is characterized in optical absorption edge. The steepness factor is found (
σA in region-A and
σB in region-B) from the PPE spectrum.
3. Results and Discussion
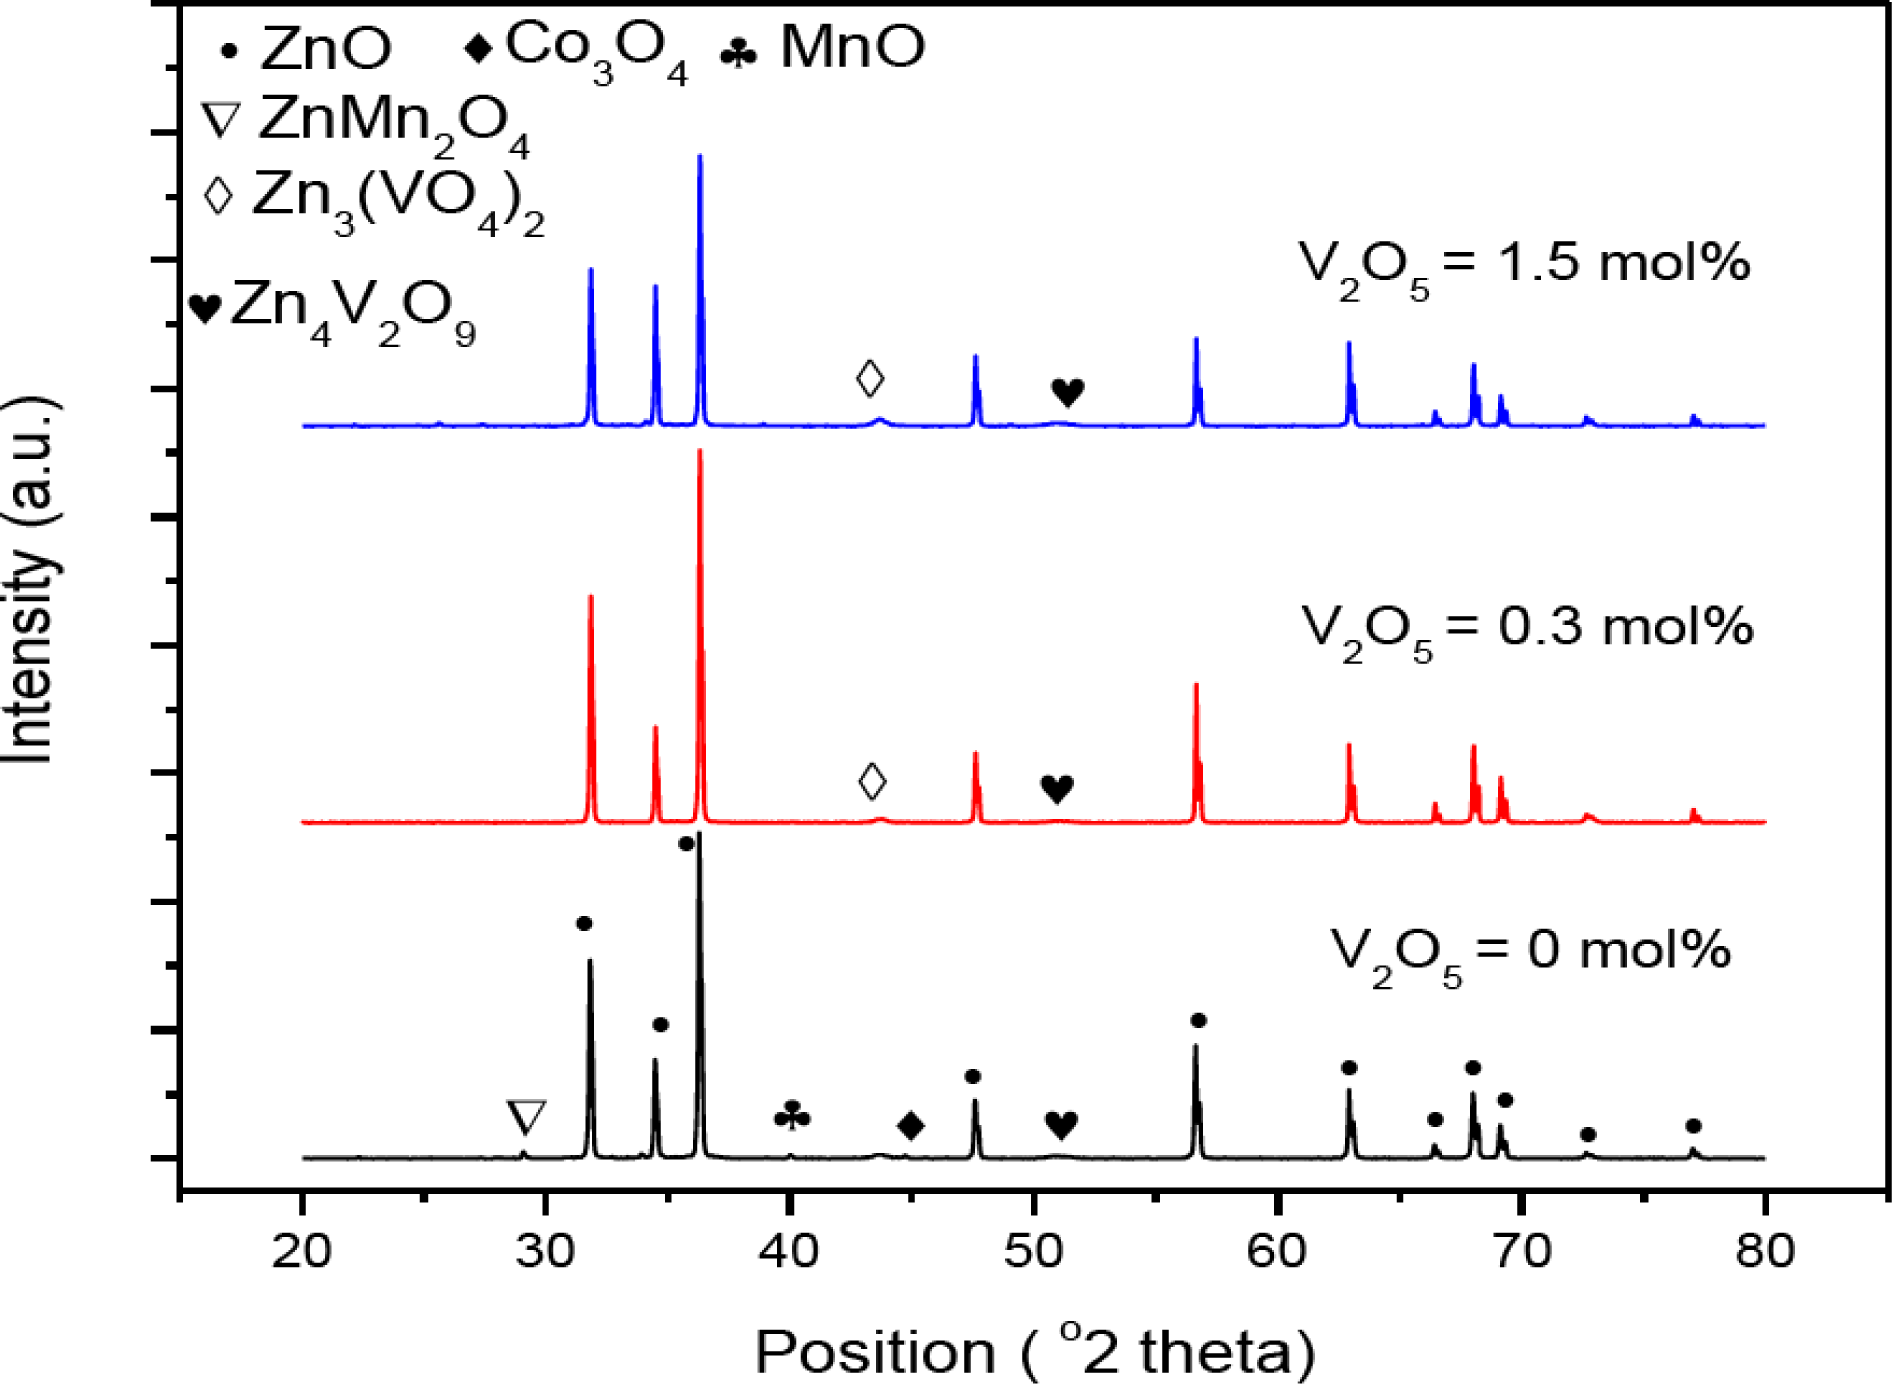
The XRD pattern of the V
2O
5 doped ZnO for the sintering temperature of 1025 °C can be seen in
Figure 1. The samples at 0 mol% of V
2O
5 contain small peaks related to Co
3O
4 (reference code 00-042-1467) at both sintering temperatures but peaks are clearer at 1025 °C. Very small peaks related to ZnMn
2O
4 (reference code 01-077-0470) were also found at both sintering temperatures. Samples doped at 0.3 mol% V
2O
5 contain the secondary phases Zn
3(VO
4)
2 (reference code 00-034-0378), Zn
4V
2O
9 (reference code 01-077-1757). The same phases are also found at all higher doping levels of V
2O
5.
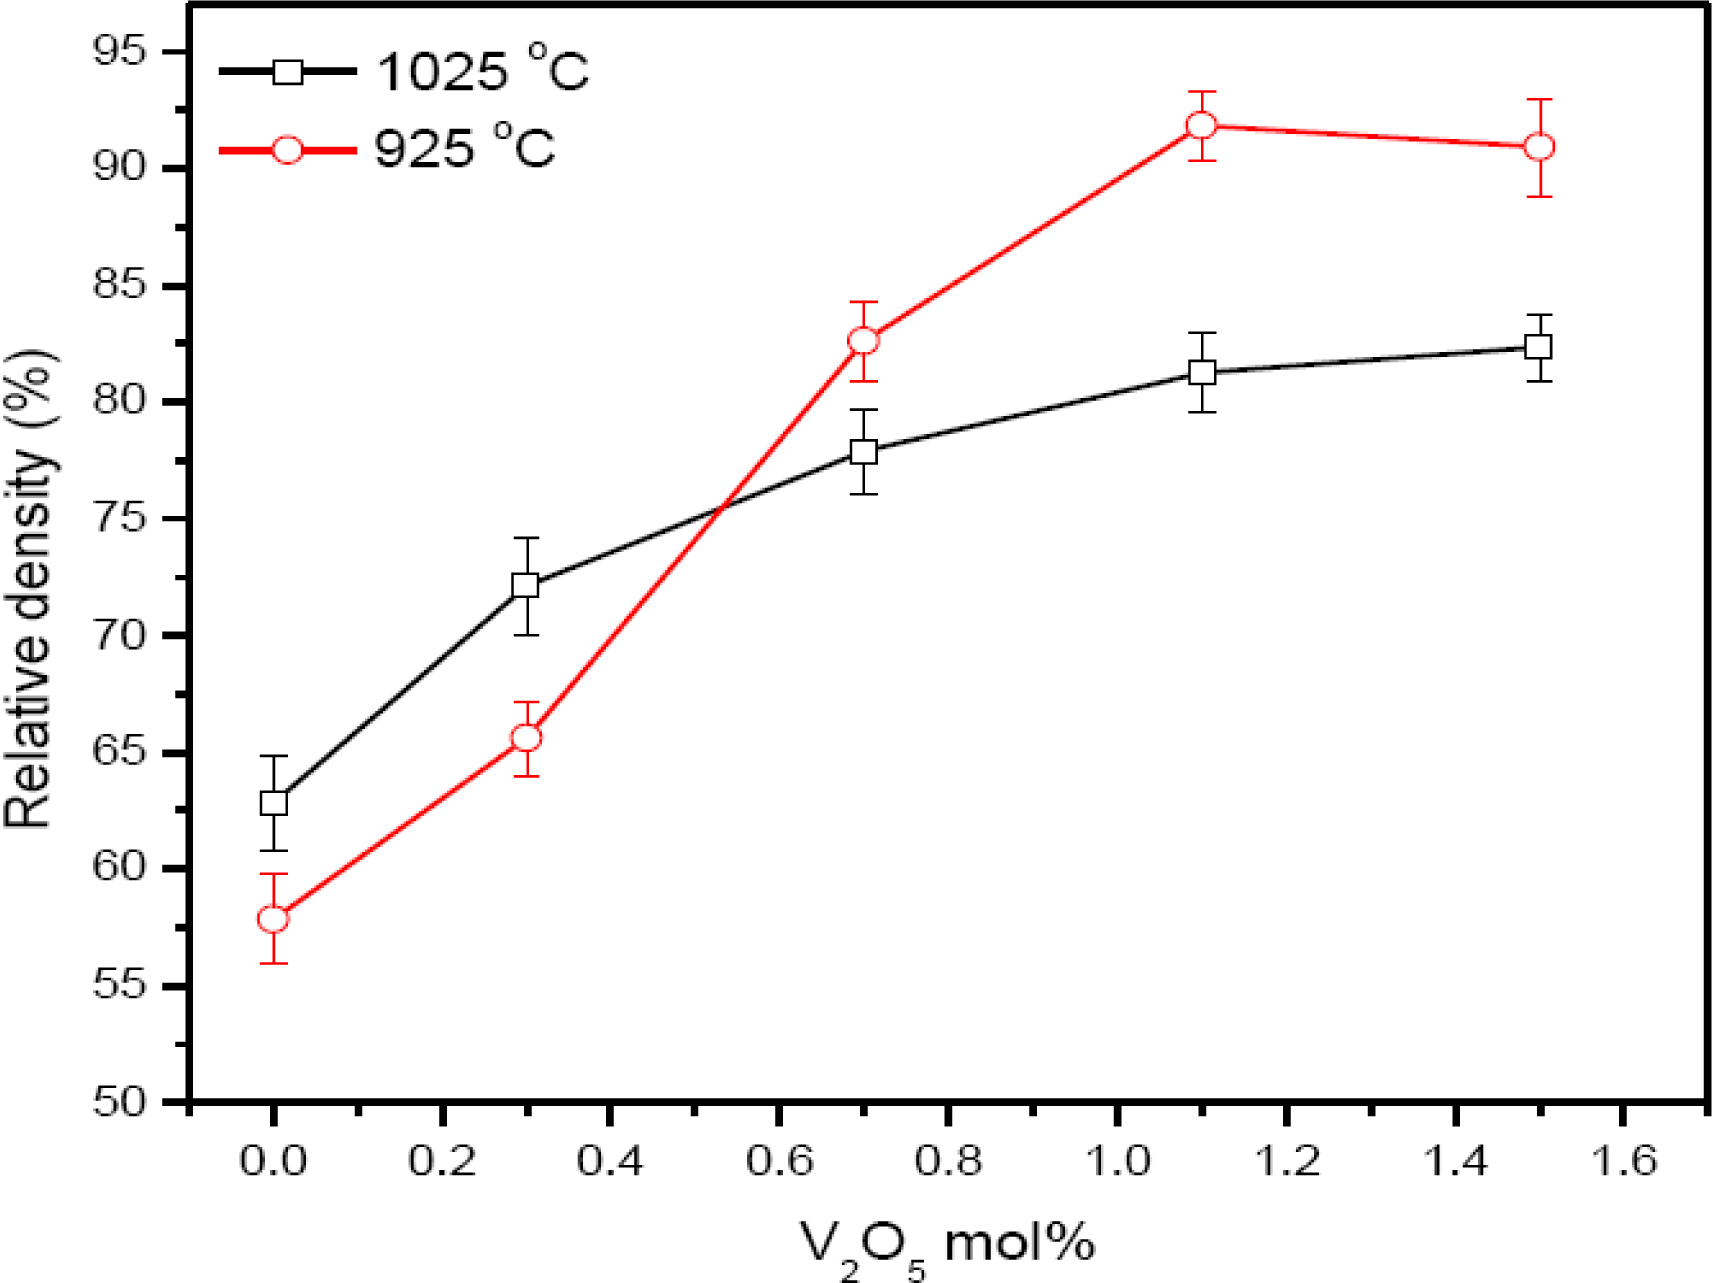
The density increases from 57.8 to 91.8% of the theoretical density at a sintering temperature of 925 °C for a 2 hour sintering time,
Figure 2. The density increases with the increase of V
2O
5 mol% and is in accordance with the literature [
12]. The density increase at 925 °C above 0.7 mol% of V
2O
5 indicates that the densification process is essentially completed at the sintering temperature above 900 °C [
12]. It is expected that the vanadium-rich liquid phase Zn
3(VO
4)
2 enhances the densification by a solution and re-precipitation of ZnO [
13]. The density of the ceramic is increased from 62.8 to 82.4% for the sintering temperature of 1025 °C. Density increases slowly compared to at the lower sintering temperature. The density has a lower value above 0.7 mol% of V
2O
5 at a sintering temperature of 1025 °C than 925 °C. This lower density may be due to the volatility of V
2O
5 [
13].
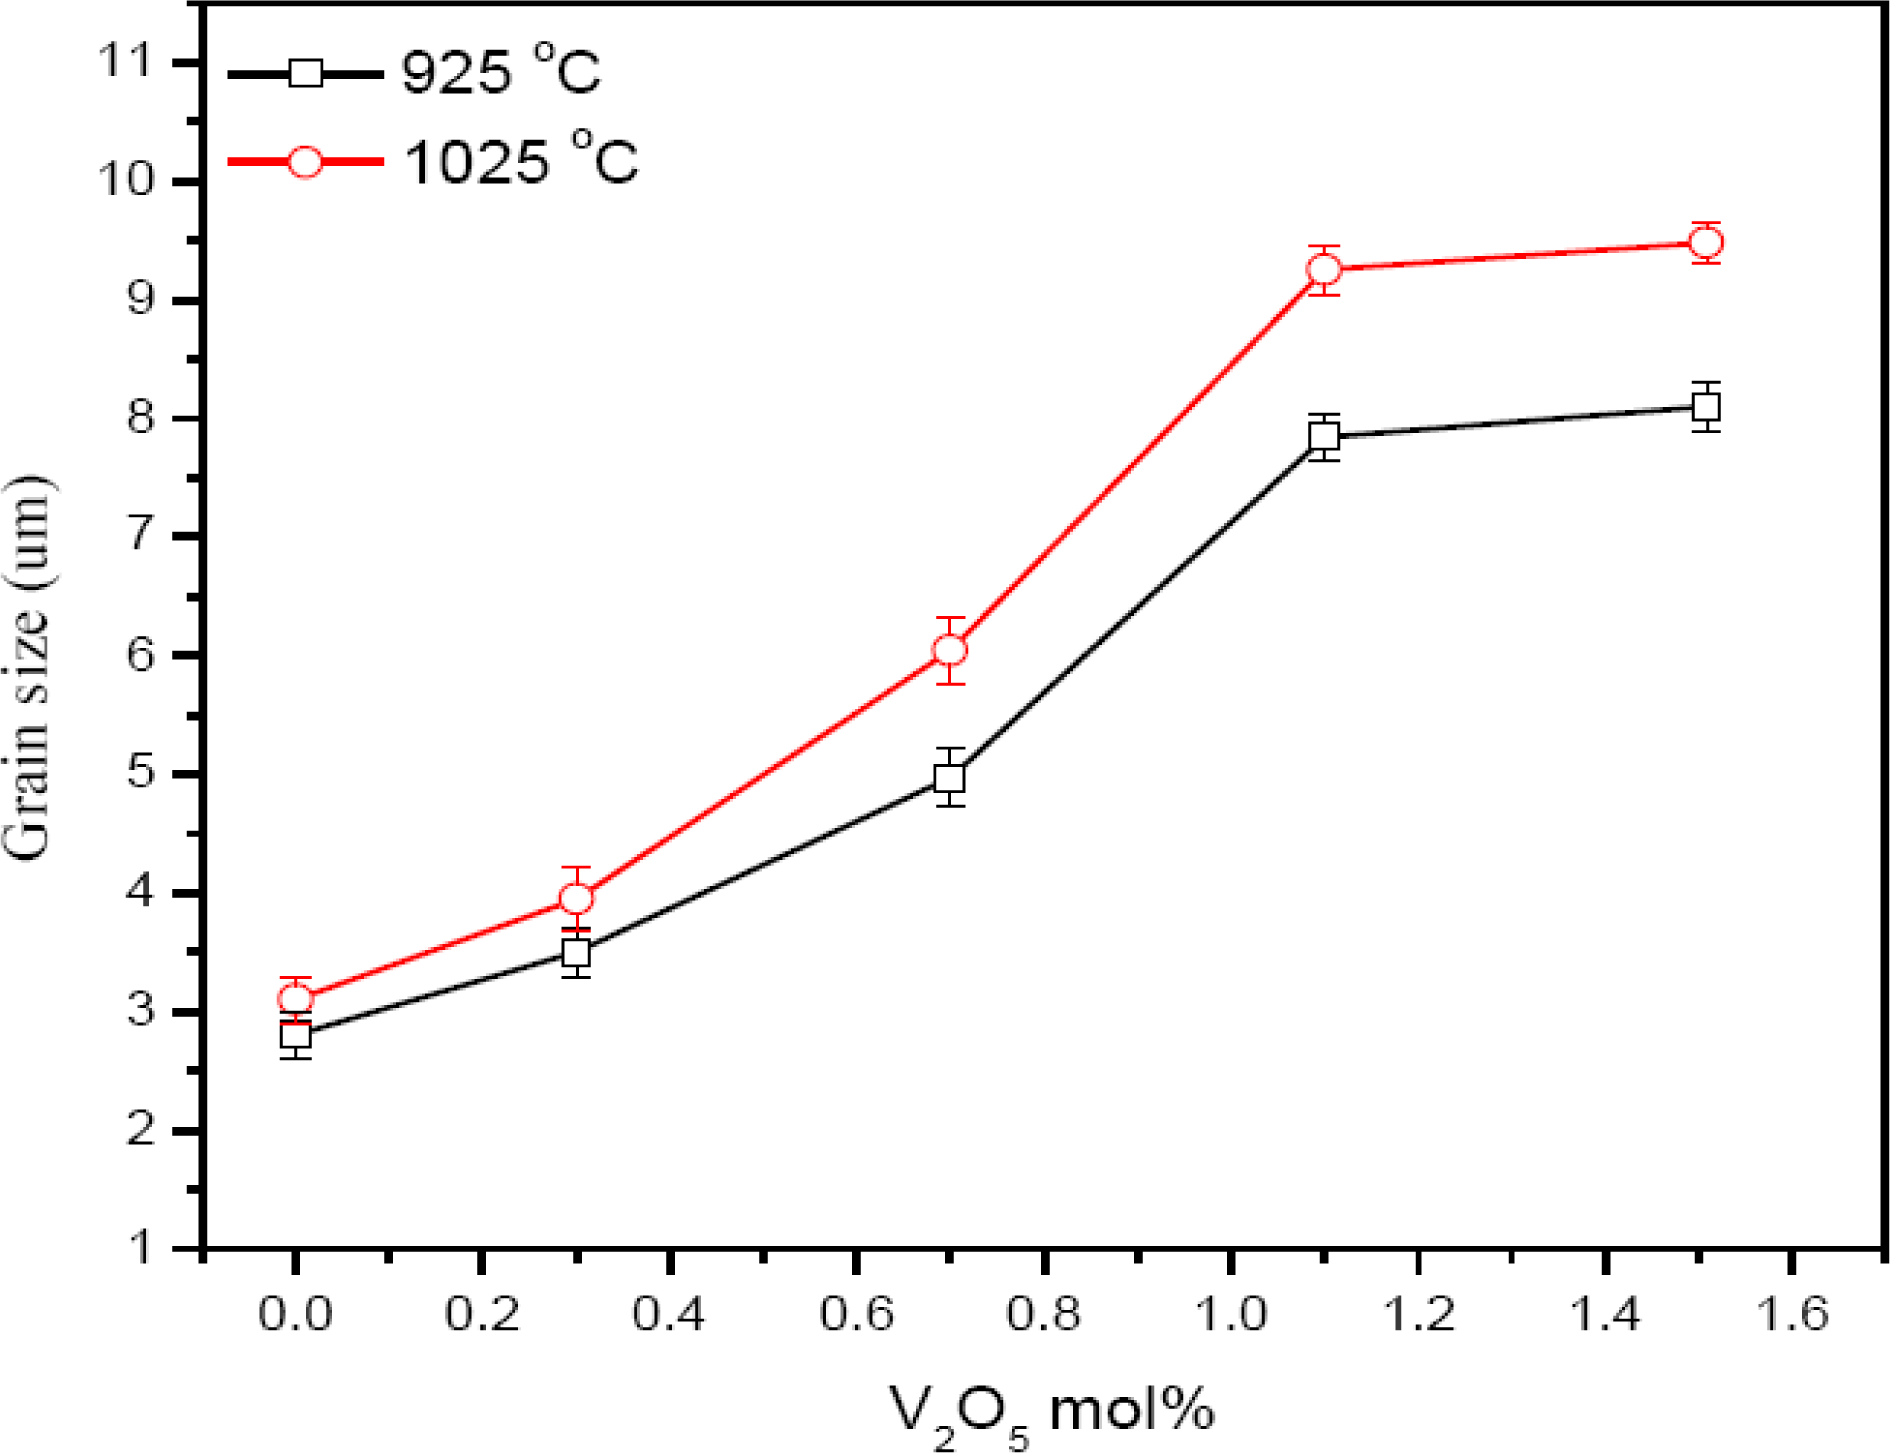
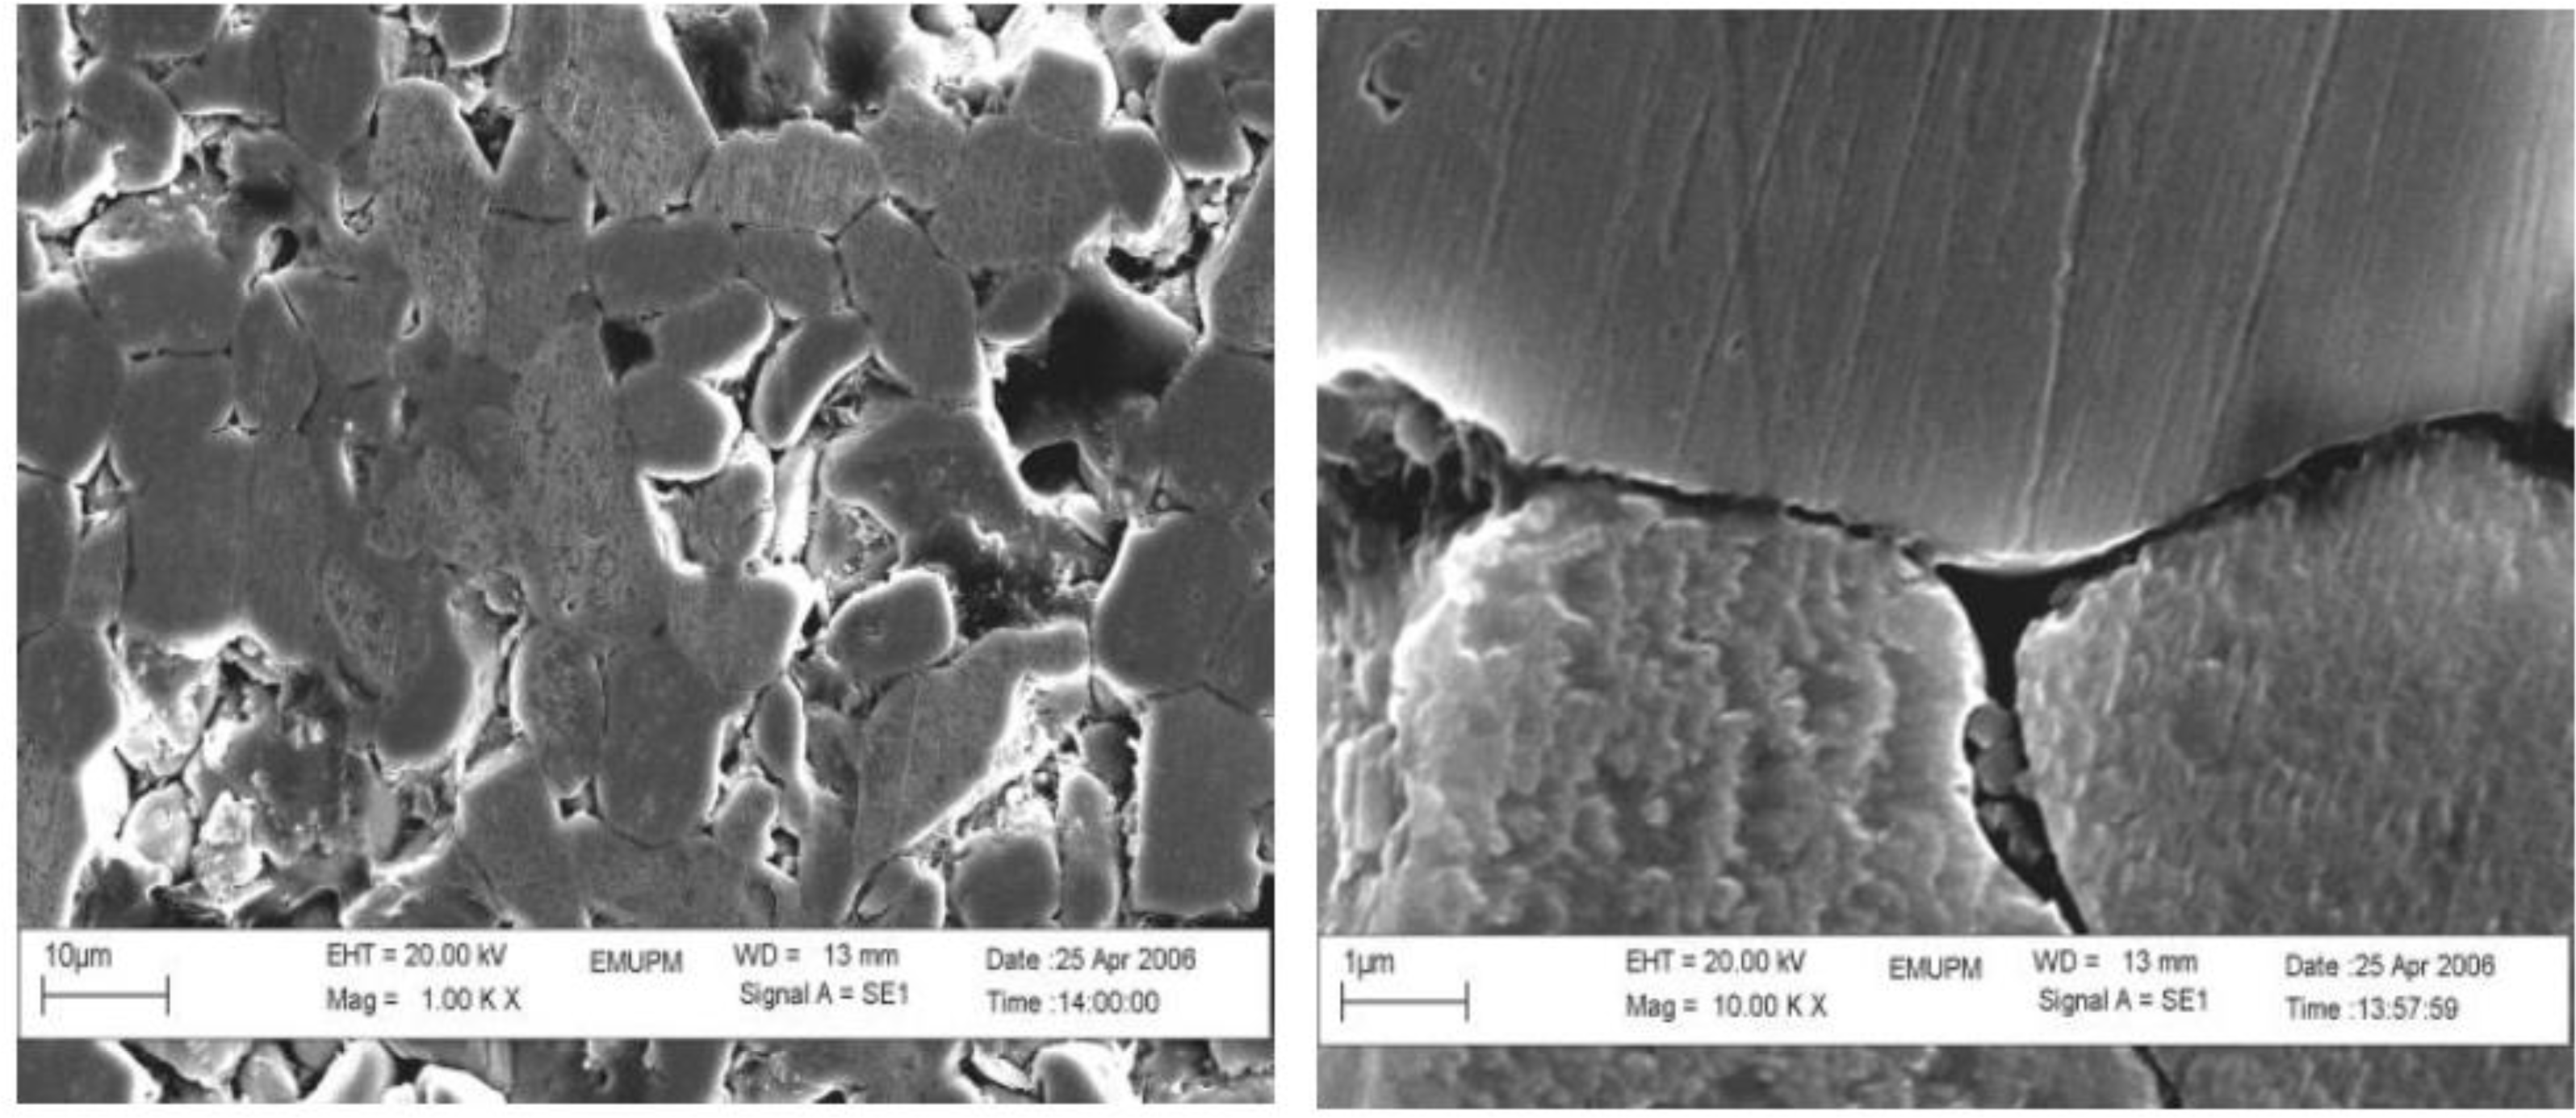
Examination of the microstructure,
Figure 3, shows that the grain size of the ceramic at 0 mol% of V
2O
5 is 2.8 and 3.1 μm and is increased to 8.1 and 9.48 μm at the sintering temperature of 925 and 1025 °C, respectively. The grain size is increased with the increase of sintering temperature at all mol% of V
2O
5. Large grains have oblong shape and small grains are also found in the ceramic. Exaggerated ZnO grain growth is found in the samples,
Figure 4. This is due to the high reactivity of the V-rich liquid phase during sintering, which causes abnormal grain growth [
14]. The addition of V
2O
5 can enhance the densification and grain growth behavior. This fact can be attributed to the formation of Zn
3(VO
4)
2, which acts as a liquid phase sintering aid [
12]. EDX analysis shows that the vanadium is distributed at the grain boundaries as well as triple point junction [
15]. Co and Mn are distributed in the grain boundaries and in the grain interiors [
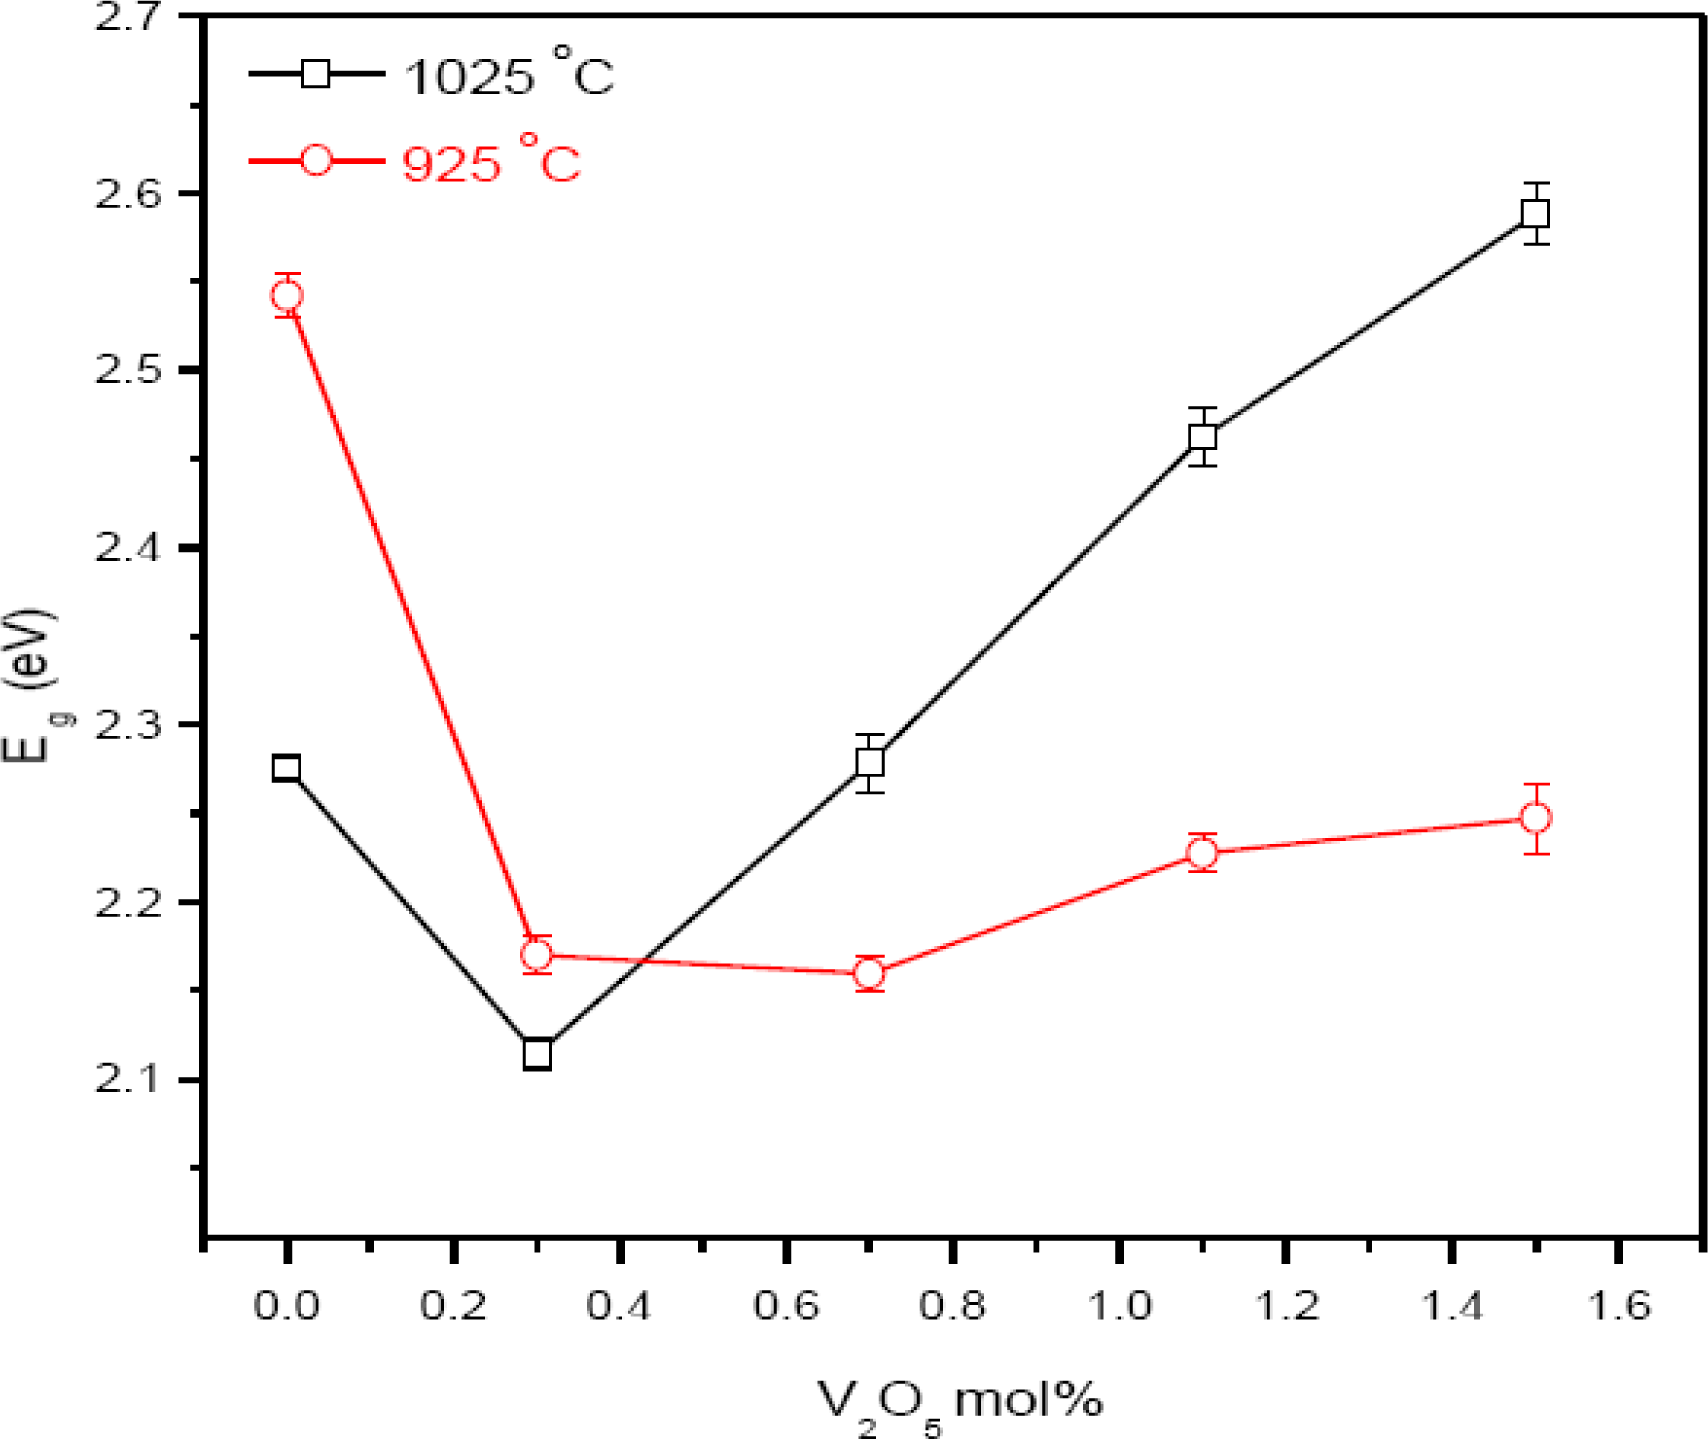
16]. The value of
Eg is reduced from 3.2 eV (pure ZnO) to 2.28 and 2.54 eV at 0 mol% of V
2O
5 for the sintering temperatures of 1025 and 925 °C, respectively (
Figure 5). This is due to 0.4 mol% of MnO
2 and Co
3O
4 because the reduction of
Eg is due to the introduction of interface states by Mn and Co ions as the ionic radius of Co and Mn is smaller than that of Zn
2+. With the addition of 0.3 mol% of V
2O
5, the
Eg decreases from 2.28 and 2.54 eV to 2.17 and 2.11 eV at 1025 and 925 °C, respectively. It is due to the introduction of the interface states.
The ionic radius of Zn
2+ is 0.74 Å and the ionic radius of Vanadium is 0.59 Å, so the reduction in the value of
Eg at 0.3 mol% of V
2O
5 is due to the limited substitution of Vanadium ions in the ZnO lattice. The value of
Eg is increased with the doping level of V
2O
5 beyond 0.3 mol%. It is expected that this may be due to the segregation of the V
2O
5 forming secondary phases Zn
3(VO
4)
2 and Zn
4V
2O
9 and reduces the interface states. The further increase in the value of
Eg may be due to the high volatility of V
2O
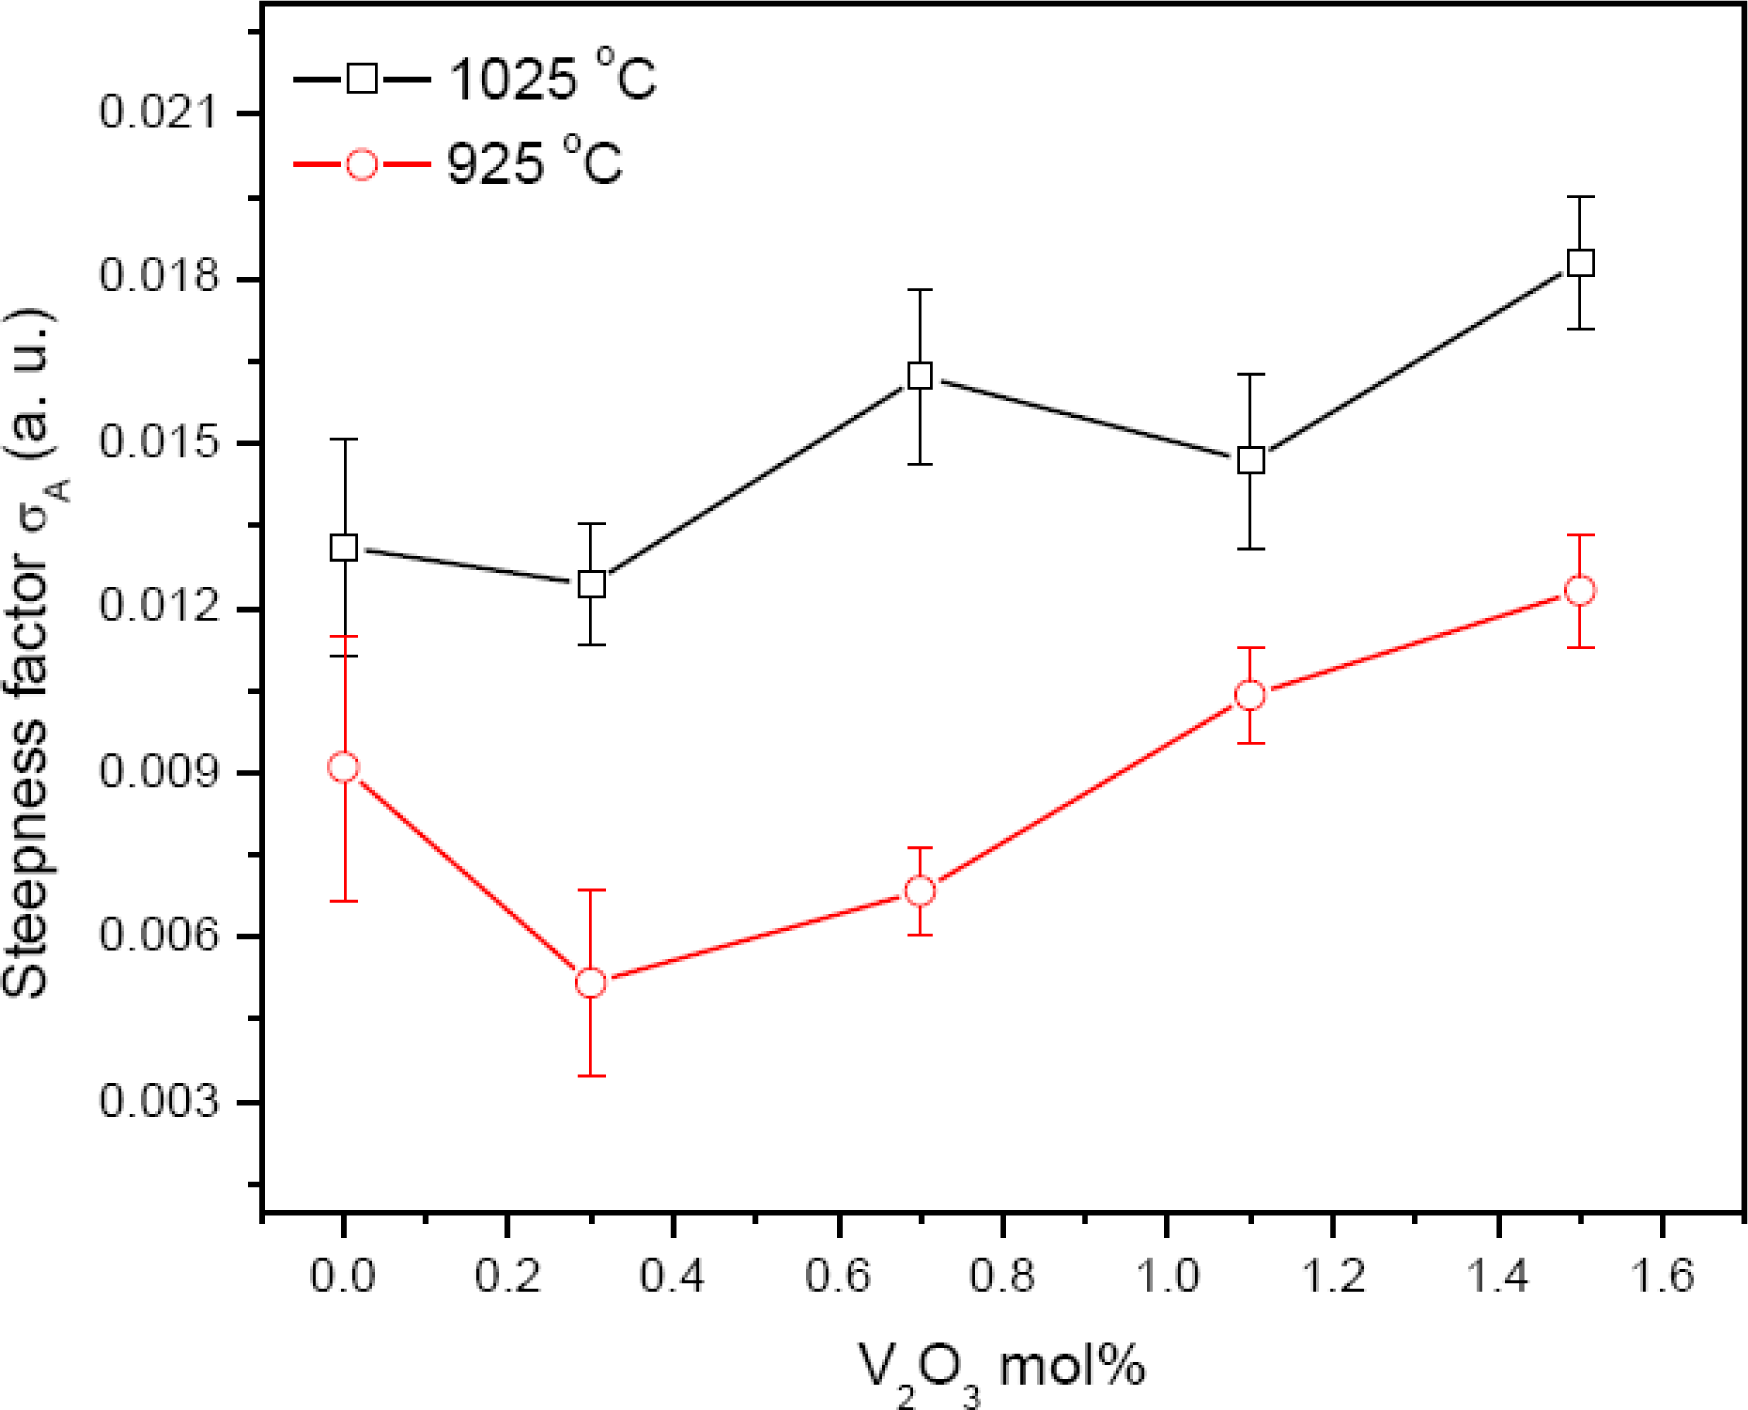
5 at the high sintering temperature of 1025 °C. The steepness factor
σA,
Figure 6, increased with the increase of V
2O
5 doping level for the both sintering temperatures 925 and 1025 °C for the 2 hour sintering time. The increase in the value of
σA with the doping level indicates the decrease in the PPE signal intensity. The decrease in the PPE signal intensity corresponds to the decrease in structural disordering. This indicates the decrease in the interface states with the doping level of V
2O
5. Resultantly, the value of
Eg increases slightly as shown in
Figure 5.
Generally an exponential tail (in region-B) for crystalline semiconductors can be characterized by:
Co is the exponential tail parameter of the order of unity and <
U2>
T is the thermal average of the square of the displacement of the atoms from their equilibrium positions. The term <
U2>
T expresses the energy of displacement of atoms [
17,
18].
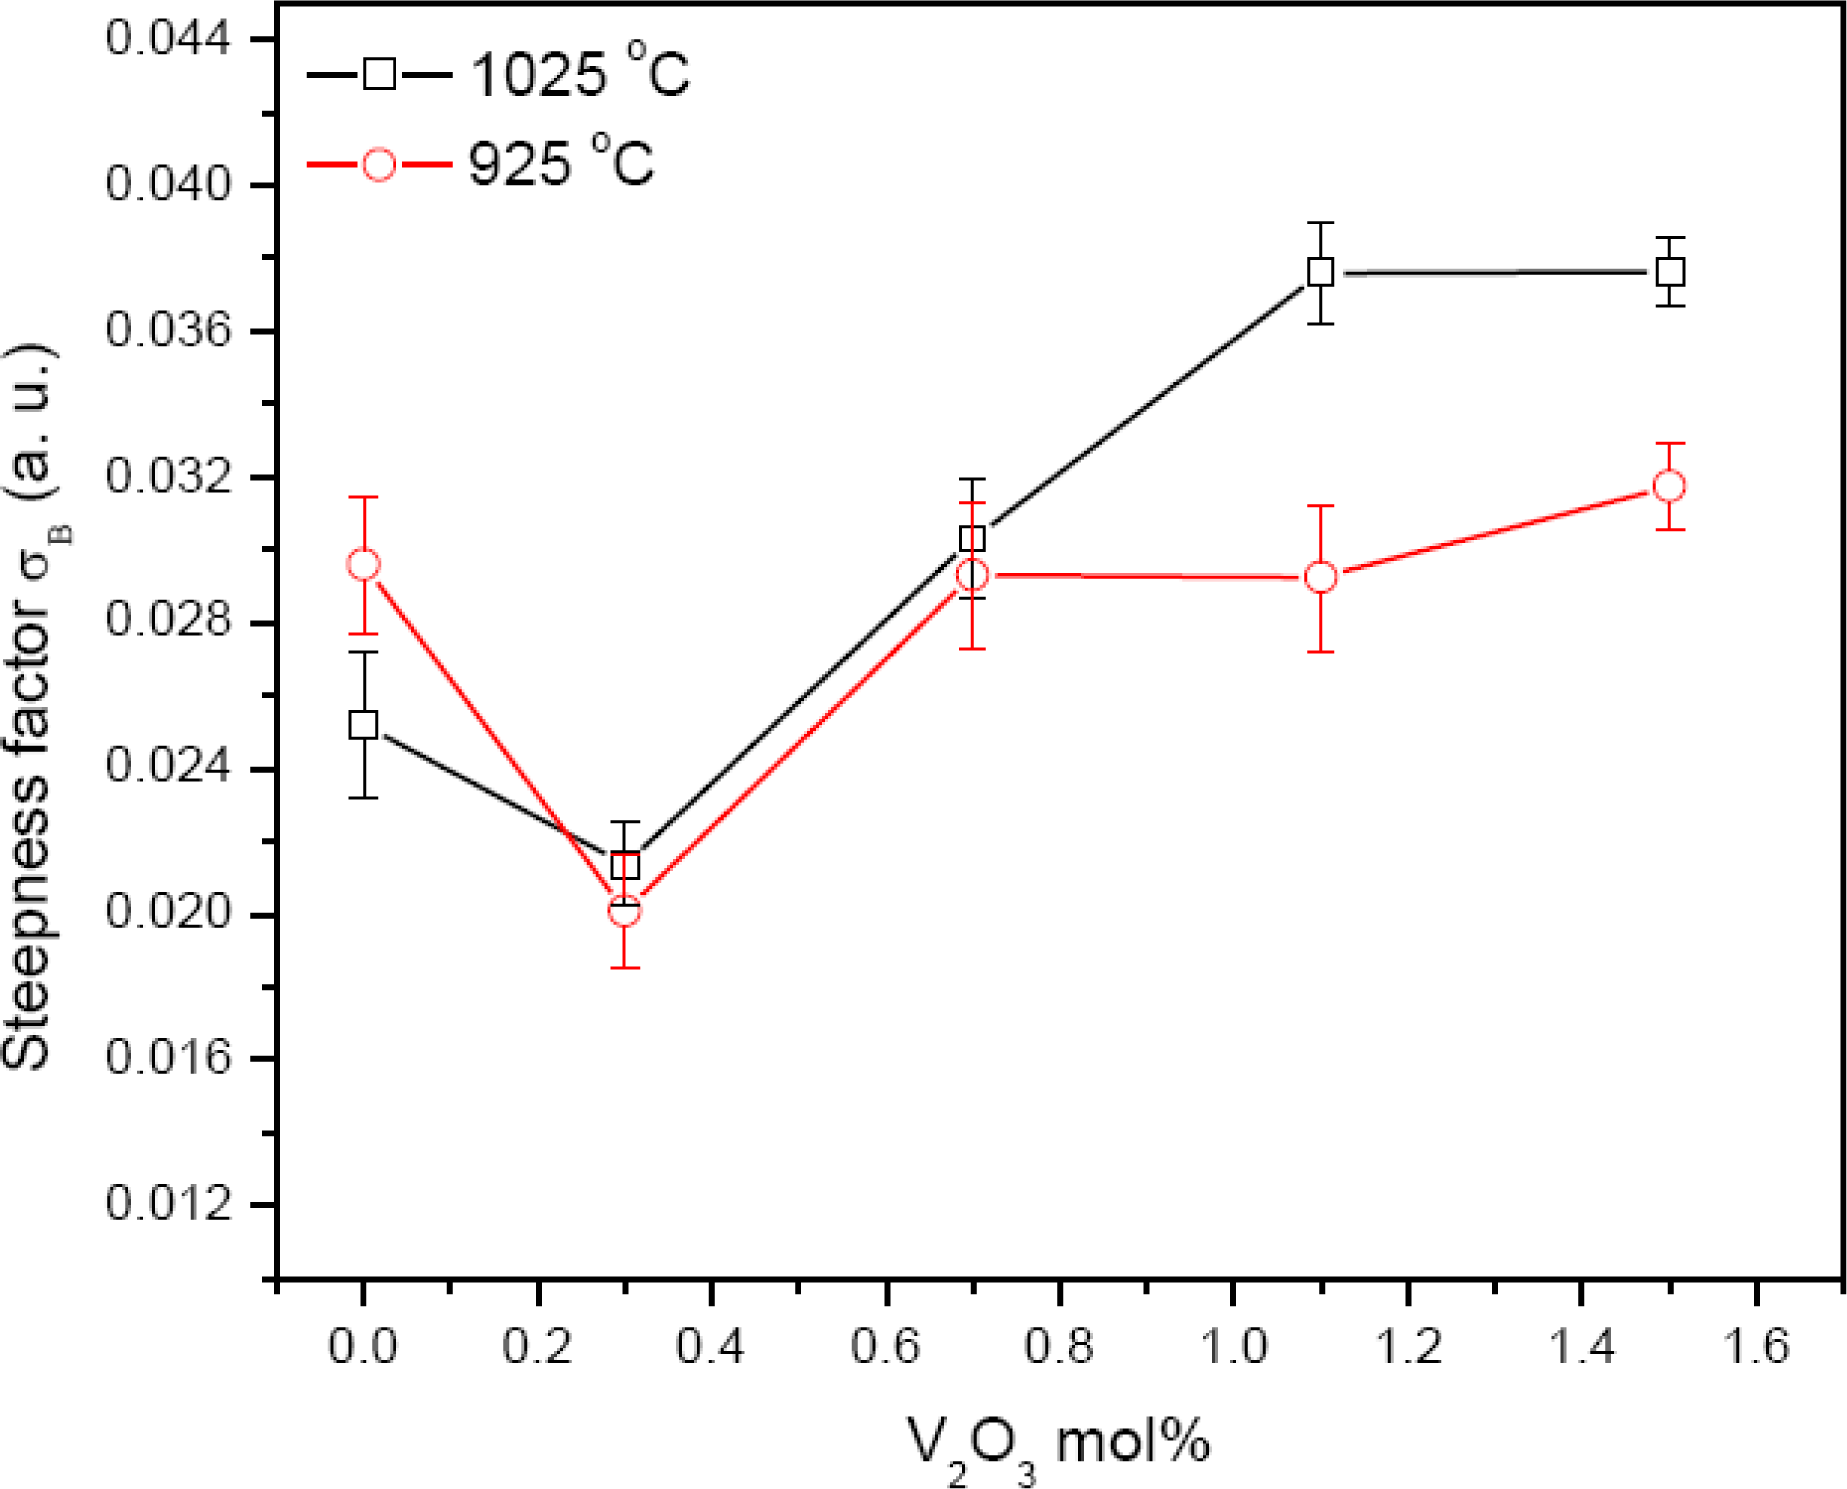
The value of the steepness factor (
σB) decreases with the increase of doping of V
2O
5 for sintering temperatures of 925 and 1025 °C,
Figure 7. This indicates that the average thermal displacement energy of atoms is increasing. This increase indicates an increase in structural disordering. Thus, the value of
Eg decreases. Above 0.3 mol%, the value of
σB increases with the increase of V
2O
5 for both sintering temperatures of 925 and 1025 °C. This indicates that the average thermal displacement energy of atoms is decreasing, which indicates a decrease in structural disordering. Correspondingly, the value of
Eg increases. This may be due to the high volatility of the V
2O
5 and the secondary phases developed in the ceramics.


