Article

Towards the Identification of New Genes Involved in ABA-Dependent Abiotic Stresses Using Arabidopsis Suppressor Mutants of abh1 Hypersensitivity to ABA during Seed Germination

by
Agata Daszkowska-Golec
*,
Edyta Chorazy
,
Miroslaw Maluszynski
and
Iwona Szarejko
Department of Genetics, Faculty of Biology and Environmental Protection, University of Silesia, Jagiellonska 28, 40-032 Katowice, Poland
*
Author to whom correspondence should be addressed.
Int. J. Mol. Sci. 2013, 14(7), 13403-13432; https://doi.org/10.3390/ijms140713403
Submission received: 16 April 2013 / Revised: 20 May 2013 / Accepted: 6 June 2013 / Published: 27 June 2013
(This article belongs to the Section Biochemistry)

Abstract

:
Abscisic acid plays a pivotal role in the abiotic stress response in plants. Although great progress has been achieved explaining the complexity of the stress and ABA signaling cascade, there are still many questions to answer. Mutants are a valuable tool in the identification of new genes or new alleles of already known genes and in elucidating their role in signaling pathways. We applied a suppressor mutation approach in order to find new components of ABA and abiotic stress signaling in Arabidopsis. Using the abh1 (ABA hypersensitive 1) insertional mutant as a parental line for EMS mutagenesis, we selected several mutants with suppressed hypersensitivity to ABA during seed germination. Here, we present the response to ABA and a wide range of abiotic stresses during the seed germination and young seedling development of two suppressor mutants—soa2 (suppressor of abh1 hypersensitivity to ABA 2) and soa3 (suppressor of abh1 hypersensitivity to ABA 3). Generally, both mutants displayed a suppression of the hypersensitivity of abh1 to ABA, NaCl and mannitol during germination. Both mutants showed a higher level of tolerance than Columbia-0 (Col-0—the parental line of abh1) in high concentrations of glucose. Additionally, soa2 exhibited better root growth than Col-0 in the presence of high ABA concentrations. soa2 and soa3 were drought tolerant and both had about 50% fewer stomata per mm2 than the wild-type but the same number as their parental line—abh1. Taking into account that suppressor mutants had the same genetic background as their parental line—abh1, it was necessary to backcross abh1 with Landsberg erecta four times for the map-based cloning approach. Mapping populations, derived from the cross of abh1 in the Landsberg erecta background with each suppressor mutant, were created. Map based cloning in order to identify the suppressor genes is in progress.

1. Introduction

1.1. The Role of Abscisic Acid in the Seed Germination Process

Seed germination commences with water uptake, which is triphasic and lasts until the emergence of the radicle. A complicated network of changes in transcription and protein metabolism, together with changes in the endogenous content of phytohormones, such as abscisic acid (ABA), gibberellins (GAs), brassinosteroids (BRs), ethylene (ET), salicylic acid (SA) and auxins, regulate the process of seed germination in order to ensure the survival of future generations [1]. The ability to tolerate or resist salt, osmotic, dehydration and cold stress is essential for plant survival. When a sudden abiotic stress occurs between the first exposure of seeds to water and the cotyledon greening, the seed germination process can be arrested [24]. In order to maintain or break the period of arrested germination and to complete the germination program, different metabolic pathways, including phytohormone biosynthesis and signaling, are involved. Among them, ABA plays a major function.
ABA signaling and its key role in the adaptation of plants to stress conditions has been the focus of many studies since the early 90’s [57]. Together with ABA, gibberellins (GAs) act as a main regulating factor in seed germination; their role is antagonistic compared to ABA. Hormonal balance is under the control of environmental factors. Before imbibition, seeds are in a dormant state or are quiescent when nondormant seeds are considered. According to North et al. [8] dormancy is an inability of viable seeds to undergo germination under optimal conditions. Dormancy is induced and maintained by ABA and released by GAs. Before seed imbibition, over 10,000 different mRNAs are stored in dry Arabidopsis seeds [9]. Among them, transcripts of genes with ABA response cis-elements in their promoter sequences, such as ABRE, are overrepresented [10]. This implies a major role of ABA in the seed germination process. During imbibition, light and cold act together to break dormancy by inducing the biosynthesis of GAs. Simultaneously, a decreased level of ABA is observed due to a lower level of the expression of genes encoding ABA biosynthesis enzymes, such as NCED3 (9-cis-epoxycarotenoid dioxygenase) and a higher level of the expression of genes encoding ABA catabolism enzymes, such as CYP707A [11]. Many components of the ABA signal transduction pathway take part in the regulation of seed germination under abiotic stress conditions.
The identification of ABA receptors—PYR/PYL/RCAR (PYRABACTIN RESISTANCE1/PYRABACTIN RESISTANCE 1-LIKE/REGULATORY COMPONENT OF ABA RESPONSE 1) revolutionized the understanding of the interactions between ABA signaling components [1215]. These receptors regulate the phosphatases PP2C (PROTEIN PHOSPHATASES 2 C). Phosphatases PP2Cs are thought to be co-receptors of ABA [13,1518]. However, since ABA is buried deep in the pocket of PYR/PYL/RCAR and there is no direct contact between ABA and PP2Cs, the co-receptor concept deviates from that of the classical sense in which two proteins bind the ligand [17]. PP2Cs interact with SnRK2s (SUCROSE NON FERMENTING 1 RELATED KINASES 2) and inhibit their action in the absence of ABA. SnRK2s are important for activating the transcription factors that are crucial for seed germination, such as ABI5 (ABA INSENSITIVE 5) [1921]. ABI5, ABI3 (ABA INSENSITIVE 3) and ABI4 (ABA INSENSITIVE 4) belong to three transcription factor families, which contain the domains: B3-(ABI3), APETALA2-(ABI4), and bZIP-(ABI5) and regulate seed-specific and/or ABA related gene expression [5,2225]. Several mutants in ABI3, ABI4 and ABI5 genes were identified, initially based on their ABA-insensitive phenotype during seed germination; however, it was discovered that they also displayed defects in the response to glucose, NaCl and osmotic stress during germination and seedling development [2629]. The function of other important regulators of seed germination in response to ABA and abiotic stresses was also recognized using ABA mutants insensitive and hypersensitive to ABA during seed germination. The first group includes mutants carrying defects in genes encoding phosphatases, such as ABI1 (ABA INSENSITIVE 1) [3032], ABI2 (ABA INSENSITIVE 2) [30,31], transcription factors, such as CHO1 (CHOTTO1) [33] or components of ubiquitination machinery: RHA2 (RING H2) [34] and AIRP1 (ABA INSENSITIVE RING PROTEIN 1) [35]. In contrast, mutations that led to a hypersensitivity to ABA were identified in the gene-encoding protein phosphatase 2C (AtPP2CA)-AHG3 (ABA HYPERSENSITIVE GERMINATION 3) [36], a gene encoding poly(A)-specific ribonuclease (PARN)-AHG2 (ABA HYPERSENSITIVE GERMINATION 2) [37] and in genes related to RNA metabolism, such as SAD1 (SUPERSENSITIVE TO ABA AND DROUGHT 1) [38], HYL1 (HYPONASTIC LEAVES 1) [39] and ABH1 (ABA HYPERSENSITIVE 1) [40].
ABA is thought to be the main stress hormone acting at seed germination and early seedling development. However, both processes under stress conditions are also regulated by other phytohormones as was revealed through the use of mutants in genes involved in phytohormone metabolism and signaling pathways [1].

1.2. Suppressor Mutants as a Tool in the Identification of New Genes/Alleles and Interactions between Them and the Other Components of the Pathway of Interest

Suppressor screens have been used successfully in Arabidopsis and other model organisms in order to discover new genes or the interactions between those that are already known in signaling pathways. The creation of suppressor mutants has its origin in the mutagenesis of a parental line, which is a mutant that carries a mutation in a gene with an unknown or not fully elucidated function. Among mutation techniques, chemical mutagenesis with EMS (Ethyl methanesulfonate) [4145] or MNU (N-nitroso-N-methylurea) [46] has been most commonly used, while physical mutagenesis (γ rays) was rarely used [47,48]. Suppressor mutants can be classified into two groups: intra- and extragenic supressors according to the position of the suppressor mutation, within or outside the mutated gene. The first group includes mutants that carry mutations within the same gene as in the parental mutant line. This type of mutant was identified, for example, by Belkhadir et al [41] in the studies on deciphering the role of the extracellular domain of BRI1 (BRASSINOSTEROID INSENSITIVE 1), which acts as brassinosteroid receptor. Seeds of a bri1-5 mutant that carried a mutation in the region of the BRI1 encoding leucine rich repeat (LRR) of the extracellular domain were mutagenized with EMS. bri1-5 exhibited a lower level of the BRI1 peptide than the wild-type. Molecular analysis revealed that the BRI1 protein was not properly folded in the mutant and thus it was only localized in the endoplasmic reticulum, not in the plasma membrane like in the wild-type. The intragenic suppressor mutation bri1-5R1 was identified in the same region of BRI1 as the primary mutation bri1-5. Analysis of the suppressor mutant showed that the suppressor mutation was able to revert the level of BRI1 protein to almost the same level as in the wild-type and the peptide was localized properly in the plasma membrane. Using the suppressor mutant, Belkhadir et al. [41] showed the crucial function of the extracellular domain of BRI1 in the localization of the brassinosteroid receptor in the plasma membrane.
The second group of suppressor mutants (extragenic mutants) carry a mutation in a gene other than those present in the parental line. Extragenic mutants prevail among studies engaging suppressor mutations. Extragenic suppressor mutants have been used for the further investigation of gene functions and for deciphering components of signaling pathways, including phytohormones signaling [44,47,48] abiotic stress response [49], biotic stress response [42,43], photosynthesis [50] or morphogenesis [51]. Sugliani et al. [48] isolated a suppressor mutant of the abi3-5 form—the sua (suppressor of abi3-5), which displayed a hypersensitivity to ABA during germination, in contrast to the phenotype of its parental line—abi3-5. The identified suppression was allele-specific, there was no phenotype change in the background of the other abi3 mutants. It was proven that in the wild-type, two types of ABI3 transcripts can be produced—α-ABI3, which was a full-length transcript, and β-ABI3, which was a truncated and nonfunctional mRNA. The regulation of alternative splicing was dependent on the stage of development; the truncated form was produced during the last phase of seed maturation. This type of regulation may have a role in accelerating the time necessary to reduce the level of the ABI3 transcript just before the initiation of germination. In the case of the abi3-5 mutant, the β-ABI3 was the functional transcript because of a frame shift that was caused by the abi3-5 mutation. Analysis of a sua mutant revealed that SUA encoded a splicing factor that decreased the level of the β-ABI3 isoform. A mutation in SUA in the abi3-5 background led to an abnormal ratio of both isoforms and, as a consequence, to an increased sensitivity to ABA during seed germination.
The selection of suppressor mutants and their further phenotypic and molecular analysis is a very important tool in the identification of new genes/alleles, their interactions and in the detection of other components of the pathways of interest. Studies performed by Brady et al [52] clearly confirmed the usefulness of suppressor mutants in revealing the components of ABA signaling. They mutagenized seeds of the ABA-hypersensitive mutant—era1 (enhanced response to ABA 1). As a result of selection in the presence of 0.3 μM ABA, the individuals that displayed an insensitivity to ABA during seed germination in contrast to their parental line era1 were isolated. A series of crosses between the suppressor forms and the already known mutants in ABA-related genes were performed. One of the analyzed suppressors was allelic to the abi3 mutant. A comparative analysis of the ABI3 genomic sequence between the suppressor and the wild-type confirmed that the suppressor carried a point mutation in the ABI3 gene. This result together with very detailed phenotype analysis of the suppressor mutant allowed a working model of interaction between ERA1 and ABI3 to be established. Further analysis revealed that ERA1 is able to farnesylate ABI3 [52].

1.3. The Aim of the Present Study

Although the pathway of ABA signaling in regards to plant response to abiotic stresses has been supplemented with new reports in recent years, there are still many gaps in fully understanding this process. Among the genes whose roles have not been fully explained to date is an ABH1 (CBP80) (ABA hypersensitive 1 (Cap Binding Protein 80)) gene. It encodes a large subunit of the nuclear cap binding complex (CBC).
The role of ABH1 (CBP80) continues to be elusive during seed germination in the presence of ABA and in drought response, except for the known phenotype of the abh1 mutant. Hugouvieux et al. [40,53] showed that abh1 displays a drought-tolerant phenotype. It is able to close its stomata very quickly in response to a water deficit and therefore optimizes the efficiency of water use during stress conditions. Similar trends related to the involvement of ABH1 (CBP80) in drought response were observed in the potato RNAi line [54]. The Arabidopsis abh1 mutant is hypersensitive to low ABA concentrations (0.4 μM) [40] and as further analysis revealed also to salt, mannitol, glucose and ACC during seed germination and early seedling development [55]. abh1 also displays morphological differences when compared to its wild-type Col-0—it has serrated leaves [40] and exhibited a 50% fewer number of stomata [55]. The molecular role of CBC has been well established in relation to its involvement in splicing. It has been shown that CBC binds to the monomethylated cap (GpppN) structure of all RNAs transcribed by RNA polymerase II and participates in the processing of polymerase II RNA primary transcripts. As recent findings have shown, CBC is also involved in pri-miRNA maturation [5659].
It has been reported that CBP20 and CBP80 (ABH1) are necessary for the ABA-dependent induction of miR159 during seed germination. Positive regulators of the ABA signaling transcription factors, MYB33 and MYB101, are downregulated by miR159. The significantly lower level of mature miR159 in abh1 and the subsequent accumulation of MYB33 and MYB101 transcripts result in ABA hypersensitivity during germination [58]. MIR159 expression is regulated by ABI3, and partially by ABI5, in the presence of ABA [60]. Daszkowska-Golec et al. [55] showed that ABI4 is also possibly engaged in that signalosome. The action of miR159 during seed germination shows a connection between CBP80 (ABH1) and well-known ABA signaling components such as ABI3, ABI5 and ABI4.
Taking into account that CBC is involved in many aspects of the ABA signaling network, there is still a need to explain the exact role of ABH1 (CBP80) and to identify new components that interact with ABH1 (CBP80) in the signaling pathway.
In order to gain insight into the mechanism of ABH1 (CBP80) action in ABA and abiotic stress signal transduction during seed germination, a genetic screen for suppressors of abh1 during seed germination in the presence of ABA was undertaken. Suppressor mutants were generated after chemical mutagenesis with EMS and selected as insensitive to 0.4 μM ABA which inhibited the germination of its parental line—abh1 [55,61]. The aim of the present study was to characterize the phenotypic similarities and differences between abh1 and its suppressor mutants during a wide range of abiotic stresses. Here, we present the detailed characteristics of two suppressor mutants of abh1: soa2 (suppressor of abh1 hypersensitivity to ABA 2) and soa3 (suppressor of abh1 hypersensitivity to ABA 3) in the presence of ABA, ACC and abiotic stresses during seed germination, seedling development and the mature stage, as a first step in identifying the suppressor genes.

2. Results

2.1. soa2 and soa3 Exhibit the Suppression of abh1 Hypersensitivity to 0.4 μM ABA during Seed Germination

Suppressor mutants of abh1soa2 (suppressor of abh1 hypersensitivity to ABA 2) and soa3 (suppressor of abh1 hypersensitivity to ABA 3) were isolated based on their insensitivity to 0.4 μM ABA during seed germination after chemical mutagenesis of an abh1 mutant with EMS. In the presence of 0.4 μM ABA seed germination of the parental line of suppressor mutants—abh1 was totally inhibited. All experiments described in the presented study were performed using suppressor mutants in abh1 background in order to compare responses and find the differences between single abh1 mutant and the double mutant carrying the abh1 mutation and the suppressor mutation. In order to establish the response of suppressor mutants to ABA in comparison to abh1 and Columbia-0 (Col-0—the parental line of abh1), a seed germination assay with increasing ABA concentrations was performed. It was shown that both suppressor mutants were capable of germinating not only at 0.4 μM ABA, but also in the presence of higher ABA concentrations, such as 0.8 and 1 μM ABA. However, none of them germinated at a higher level of ABA than Col-0. A concentration of 3 μM ABA completely inhibited the germination of all of the analyzed genotypes (Figure 1).

2.2. Both Suppressor Mutants Are Recessive in Relation to abh1 Hypersensitivity to ABA during Seed Germination and Are Not Allelic

soa2 and soa3 were backcrossed to the original mutant abh1 and the response of F1 and F2 progeny to ABA during seed germination was analyzed. The F1 progeny of both crosses exhibited a hypersensitivity to 0.4 μM ABA, thus indicating that both suppressor genes (soa2 and soa3) were recessive in relation to abh1. This observation was confirmed by an analysis of germination in the F2 progeny, which displayed a segregation ratio of 3:1 of ABA hypersensitive to ABA insensitive germinating seeds, respectively (χ23:1 = 0.025 and χ23:1 = 0.163, p ≤ 0.05; Table 1). In both cases, the only segregating gene in the F2 progeny was the suppressor gene because both suppressor mutants—soa2 and soa3 and their parental line, abh1—carried the homozygous mutation in the ABH1 gene.
In order to test whether soa2 and soa3 carried mutations in the same gene or in different loci, an allelism test was performed. soa2 and soa3 were crossed to each other and the response of F1 and F2 progeny was tested in the same manner as previously described. The F1 progeny displayed an insensitivity to 0.4 μM ABA. When the F2 progeny was analyzed, two phenotypic classes were extracted in a segregation ratio of 11:5 of ABA insensitive to ABA hypersensitive individuals, respectively (soa2 × soa3 χ211:5 = 1.2 and soa3 × soa2 χ23:1 = 1.1, p ≤ 0.05; Table 2).
A detailed description of the phenotypes and genotypes of plants in each cross are presented in Table 3.

2.3. soa2 and soa3 Differ in Root Growth in the Presence of High ABA Concentrations

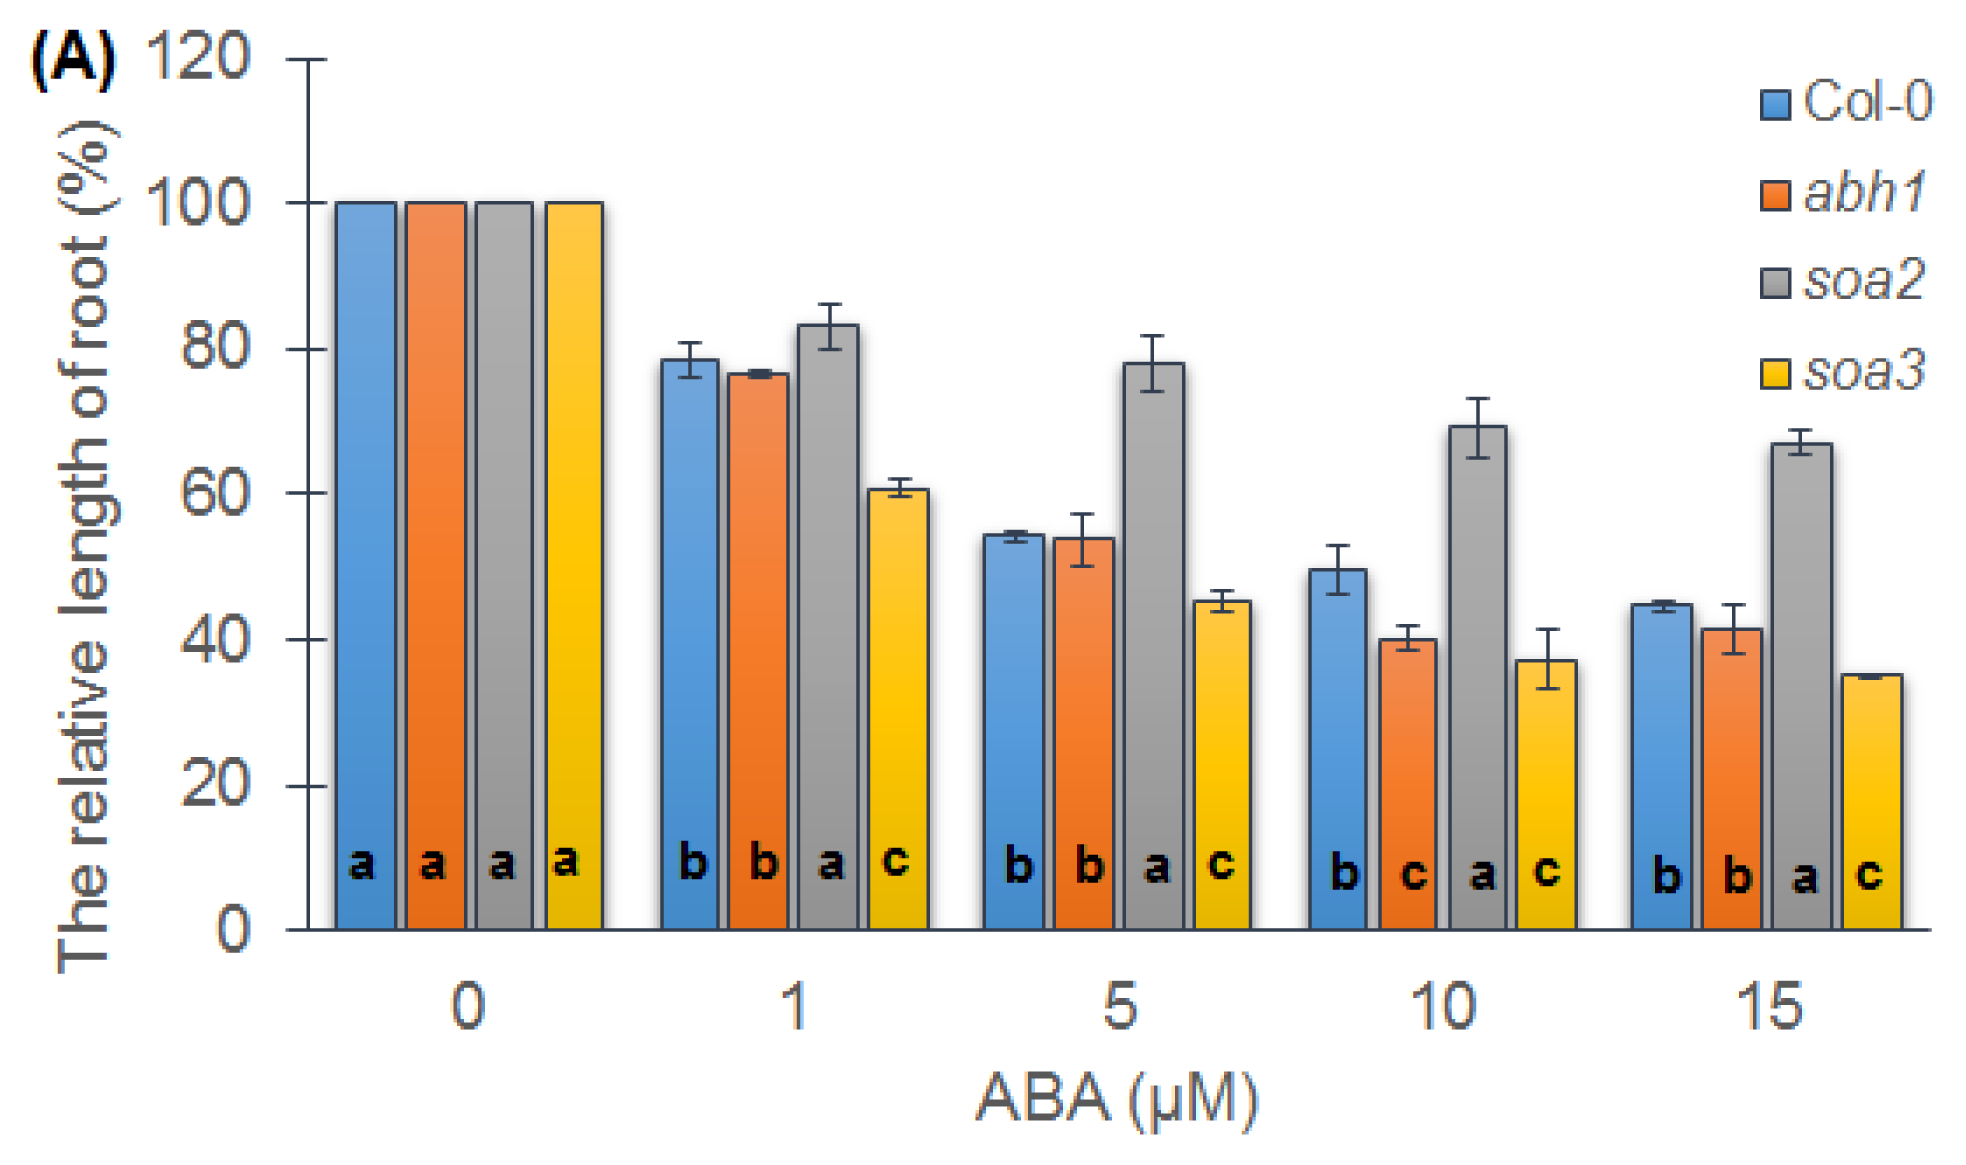
Differences were observed between suppressor mutants during seedling development in relation to root growth in the presence of different ABA concentrations. Only soa2 displayed an insensitivity to a high ABA concentration when compared to the wild-type Col-0 and abh1. In the presence of 15 μM ABA, soa2 displayed only a 30% reduction in root length when compared to the growth on the control medium, whereas the reduction in root elongation of the wild-type and abh1 under these conditions was 60% (Figure 2A).

2.4. Response of Suppressor Mutants to ACC during Seedling Development

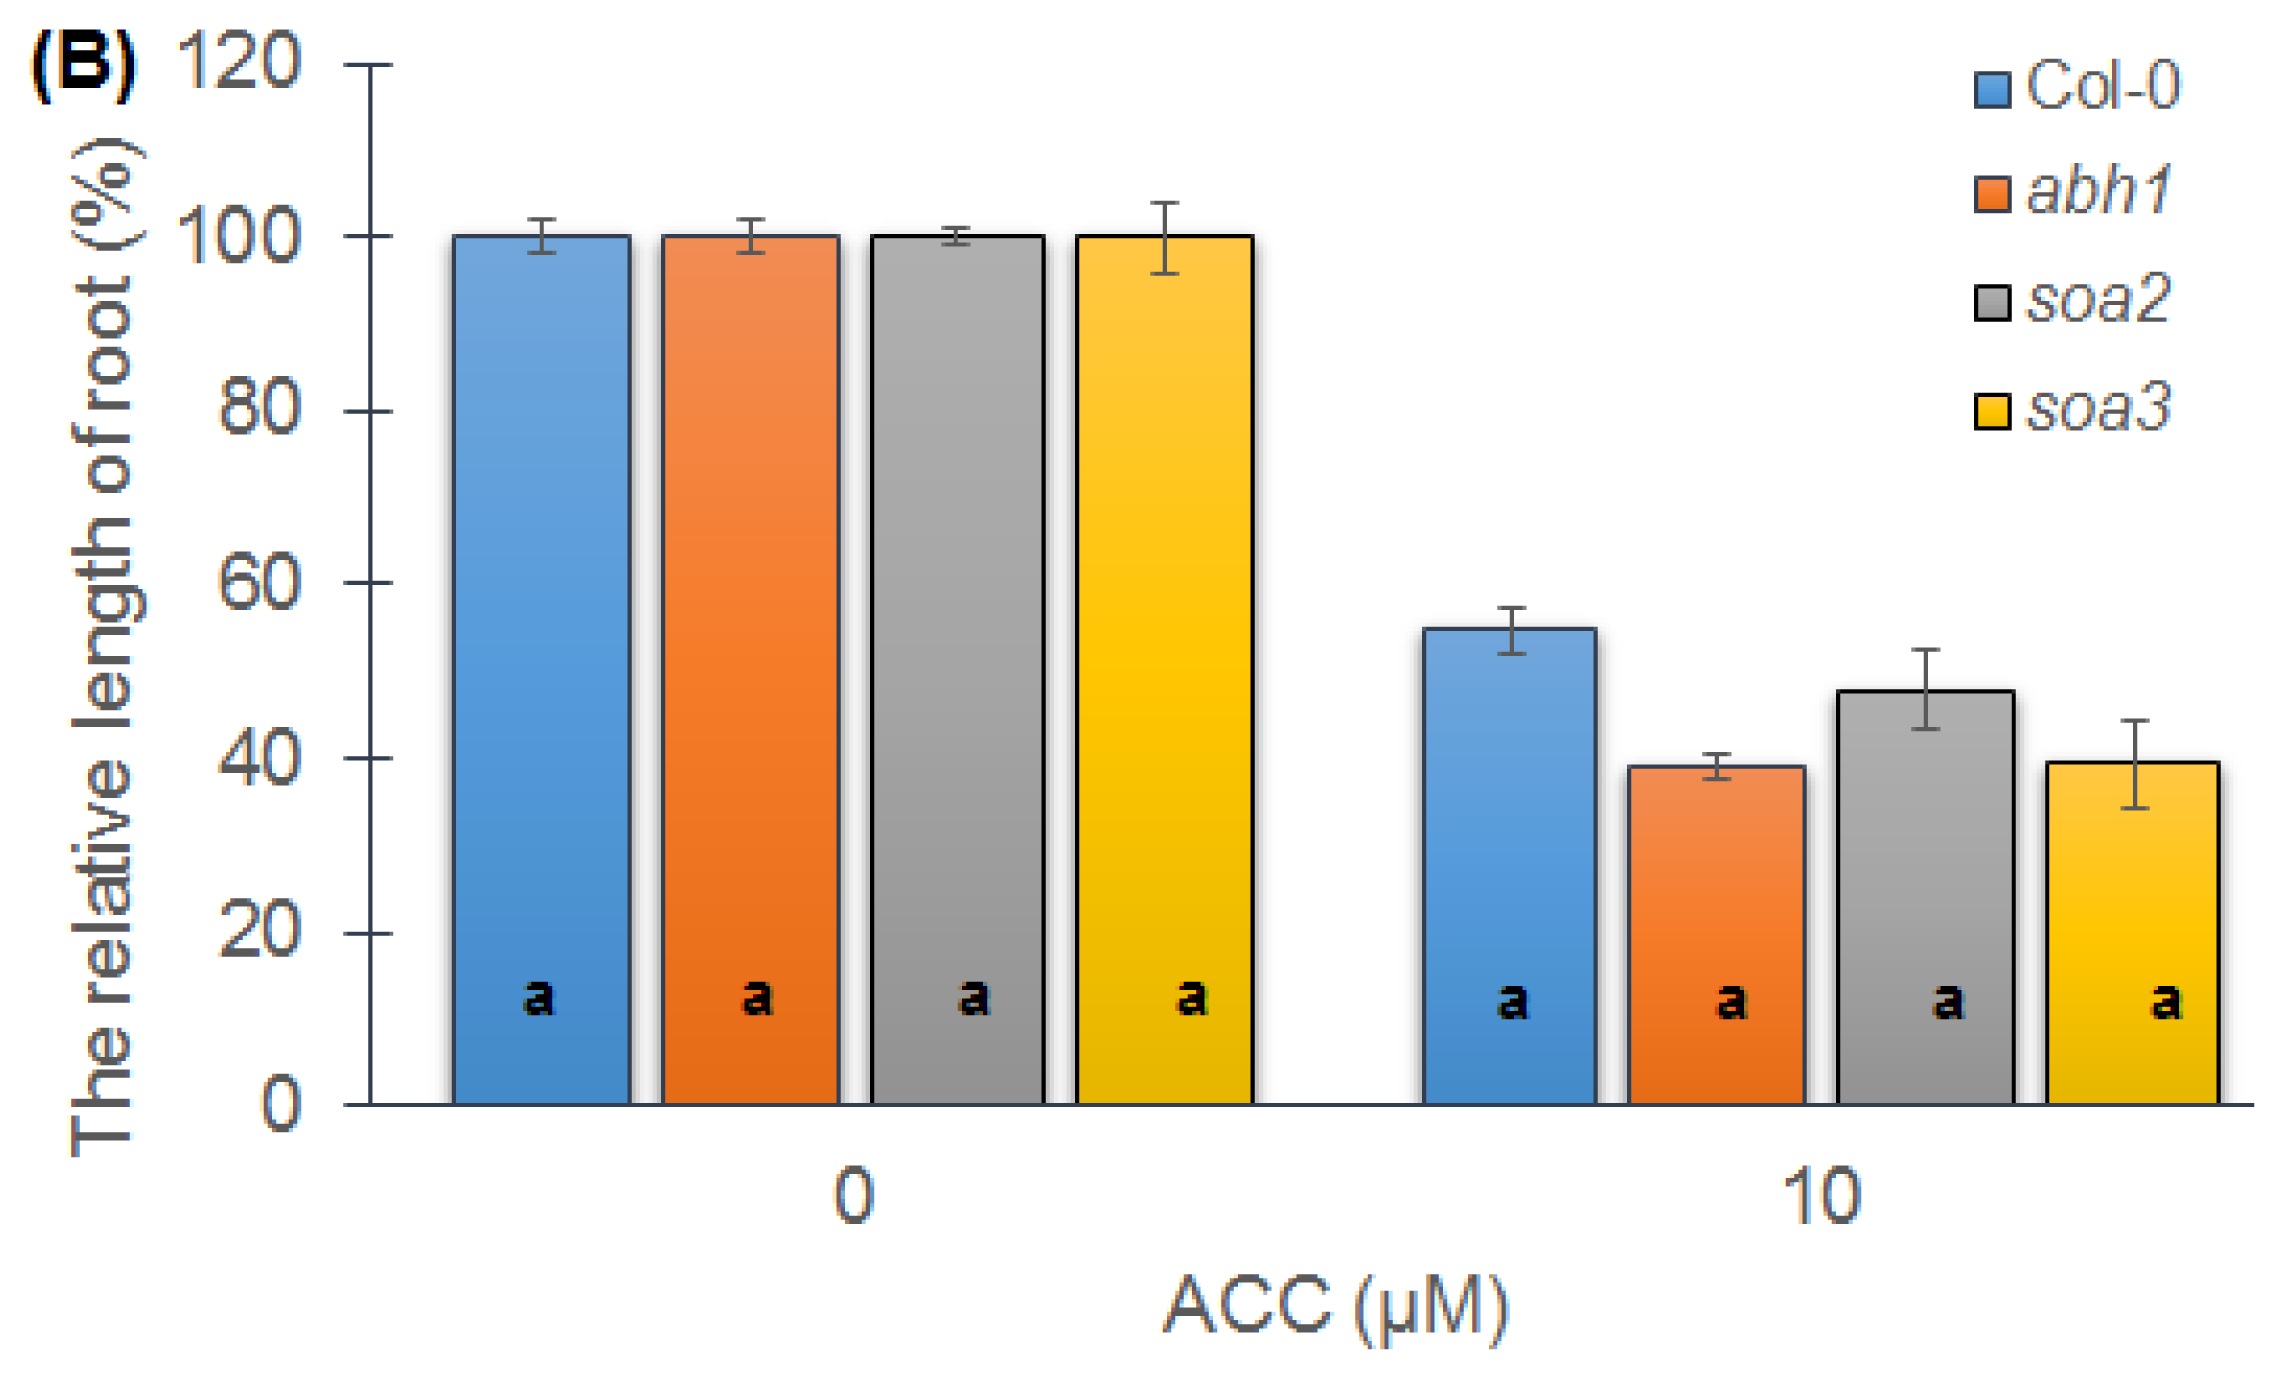
Root growth was analyzed not only in the presence of ABA, but also when a precursor of ethylene, the other phytohormone, was added to the medium. The inhibitory effect of ACC (1-Aminocyclopropane-1-carboxylic acid) on root growth was observed in all of the genotypes studied (Figure 2B). No significant differences between suppressor mutants and abh1 or Col-0 were detected.

2.5. Both Suppressors Are Sensitive to Salt Stress during Seed Germination but Displayed a Differential Response when Young Seedlings Were Tested

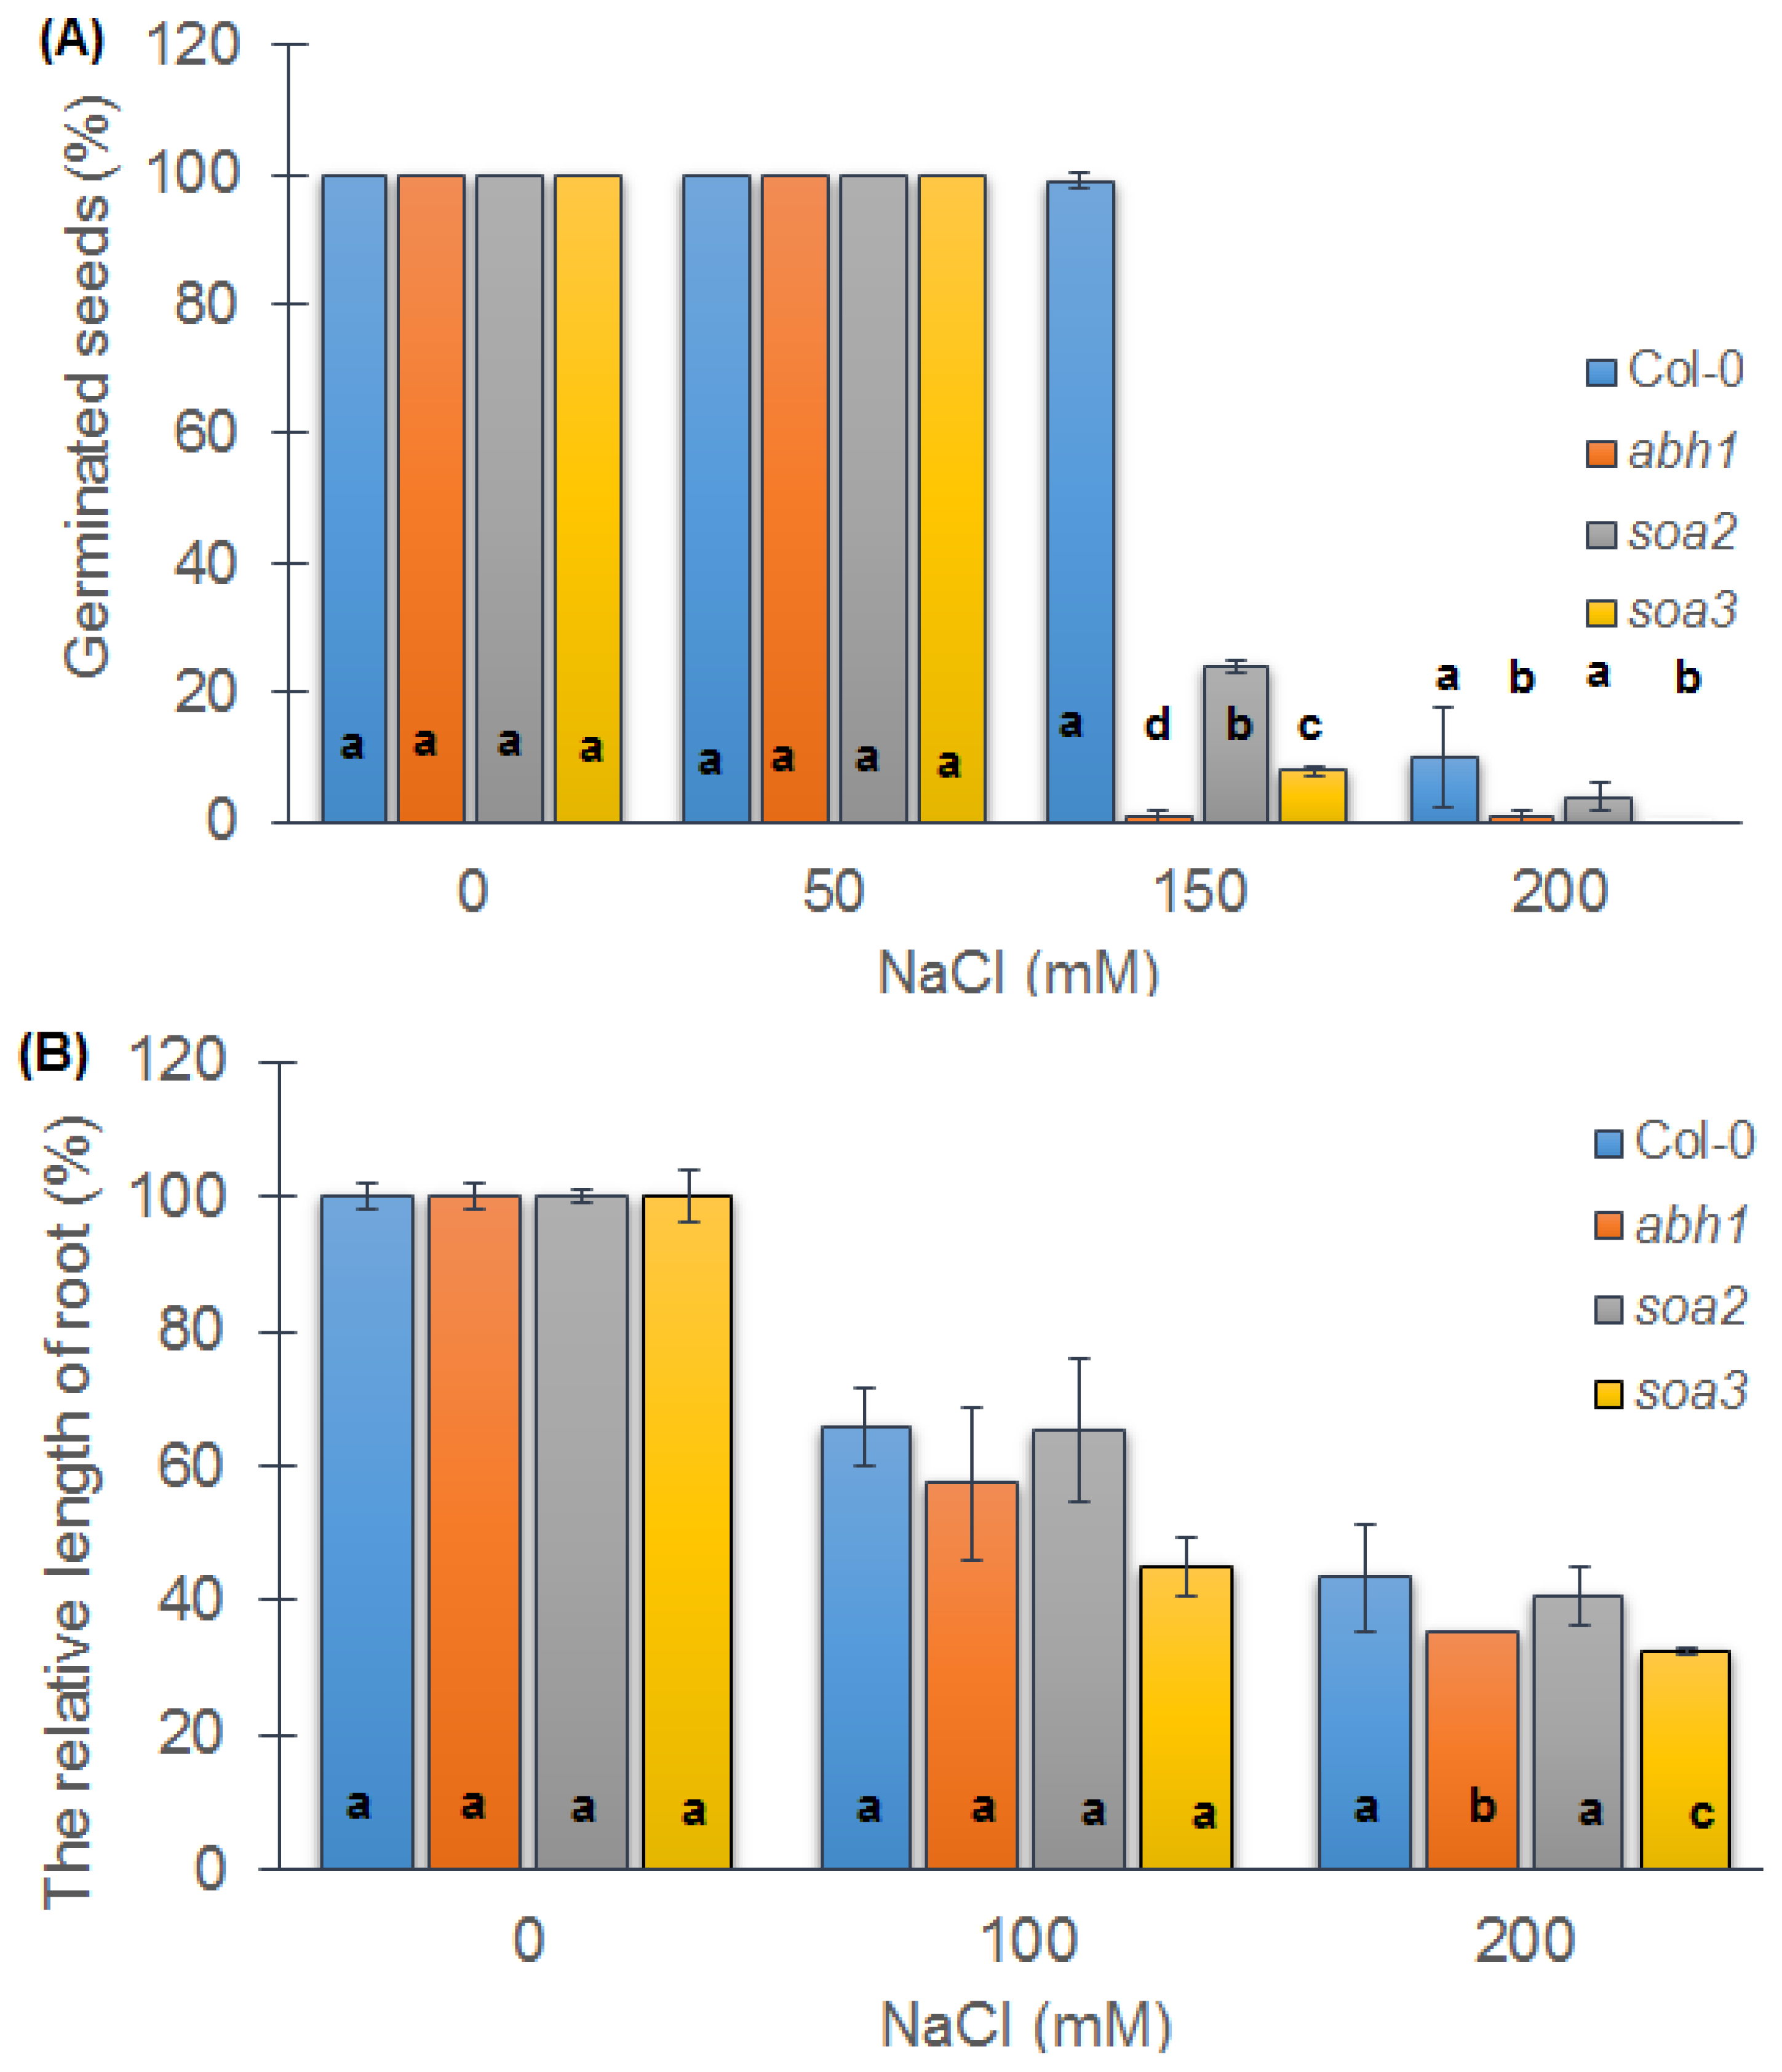
When the response to salt stress was evaluated during seed germination, both suppressors were more tolerant to 150 mM NaCl concentrations than their parental line, abh1, but much less tolerant than the wild-type Col-0. There was a strong tendency toward a decreased germination potential when a higher concentration of NaCl such as 200 mM was applied (Figure 3A). The correlation between seed germination of suppressor mutants in the presence of high NaCl and high ABA concentration was observed.
In addition, the soa2 and soa3 sensitivity to salt treatment was tested during root elongation. No significant differences among the genotypes studied were observed during development in the presence of 100 mM NaCl. In the presence of a higher NaCl concentration (200 mM), both suppressors displayed a higher reduction of root growth than Col-0 and abh1, but the differences between all of the genotypes were small (Figure 3B).

2.6. Response to Osmotic Stress during Seed Germination and Seedling Development of Both Mutants Indicate Differences between Suppressors, the Wild-Type and Parental Line, abh1

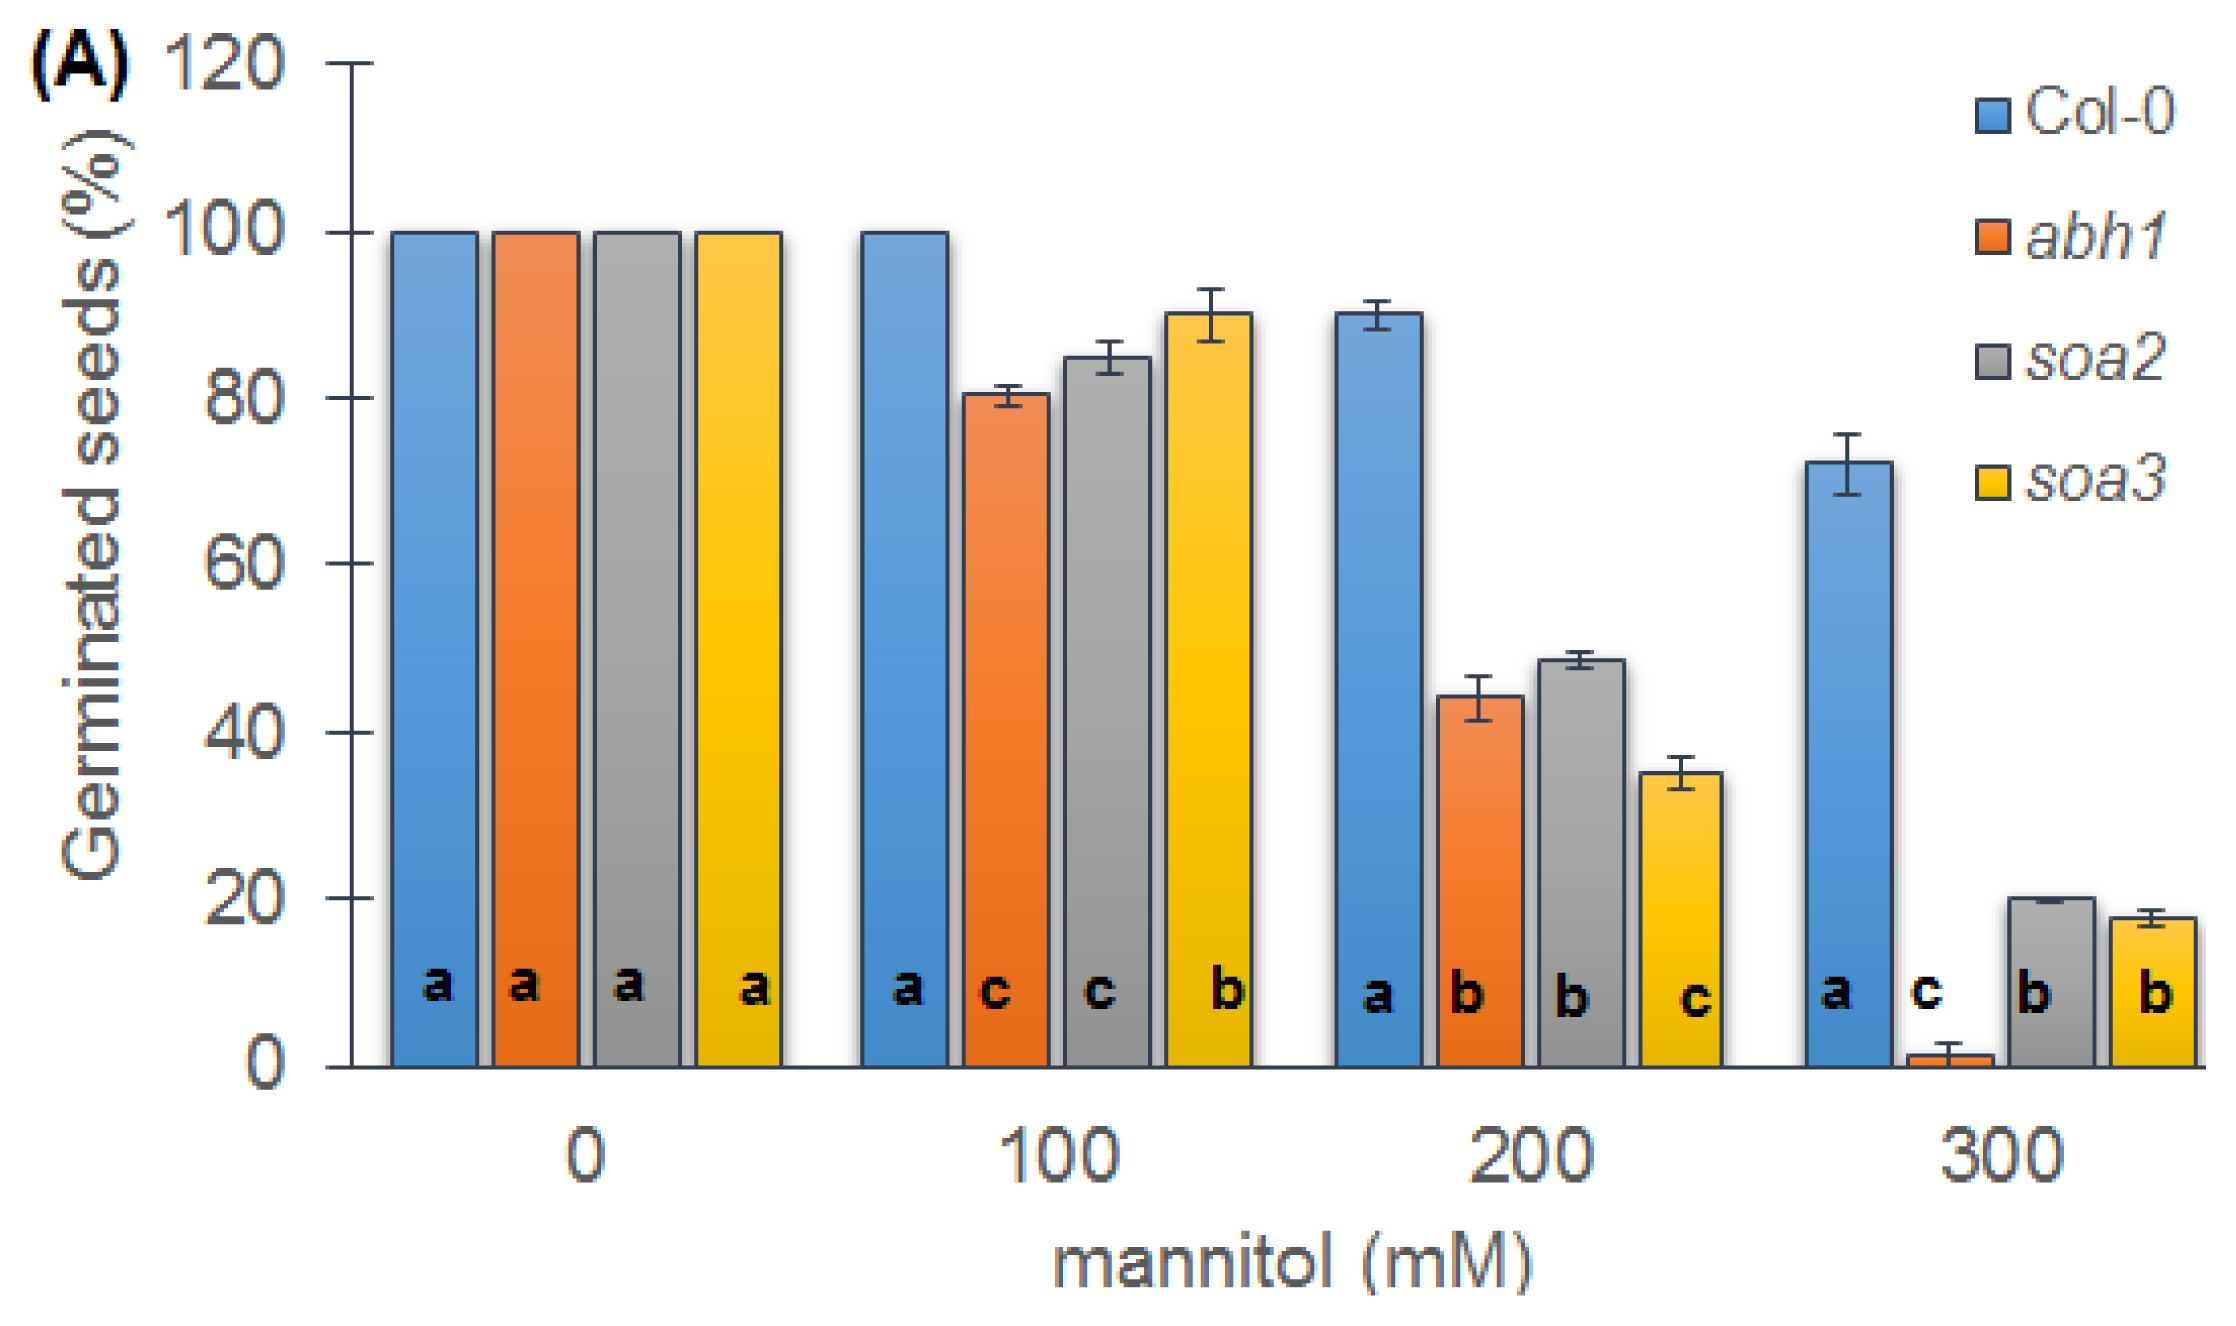
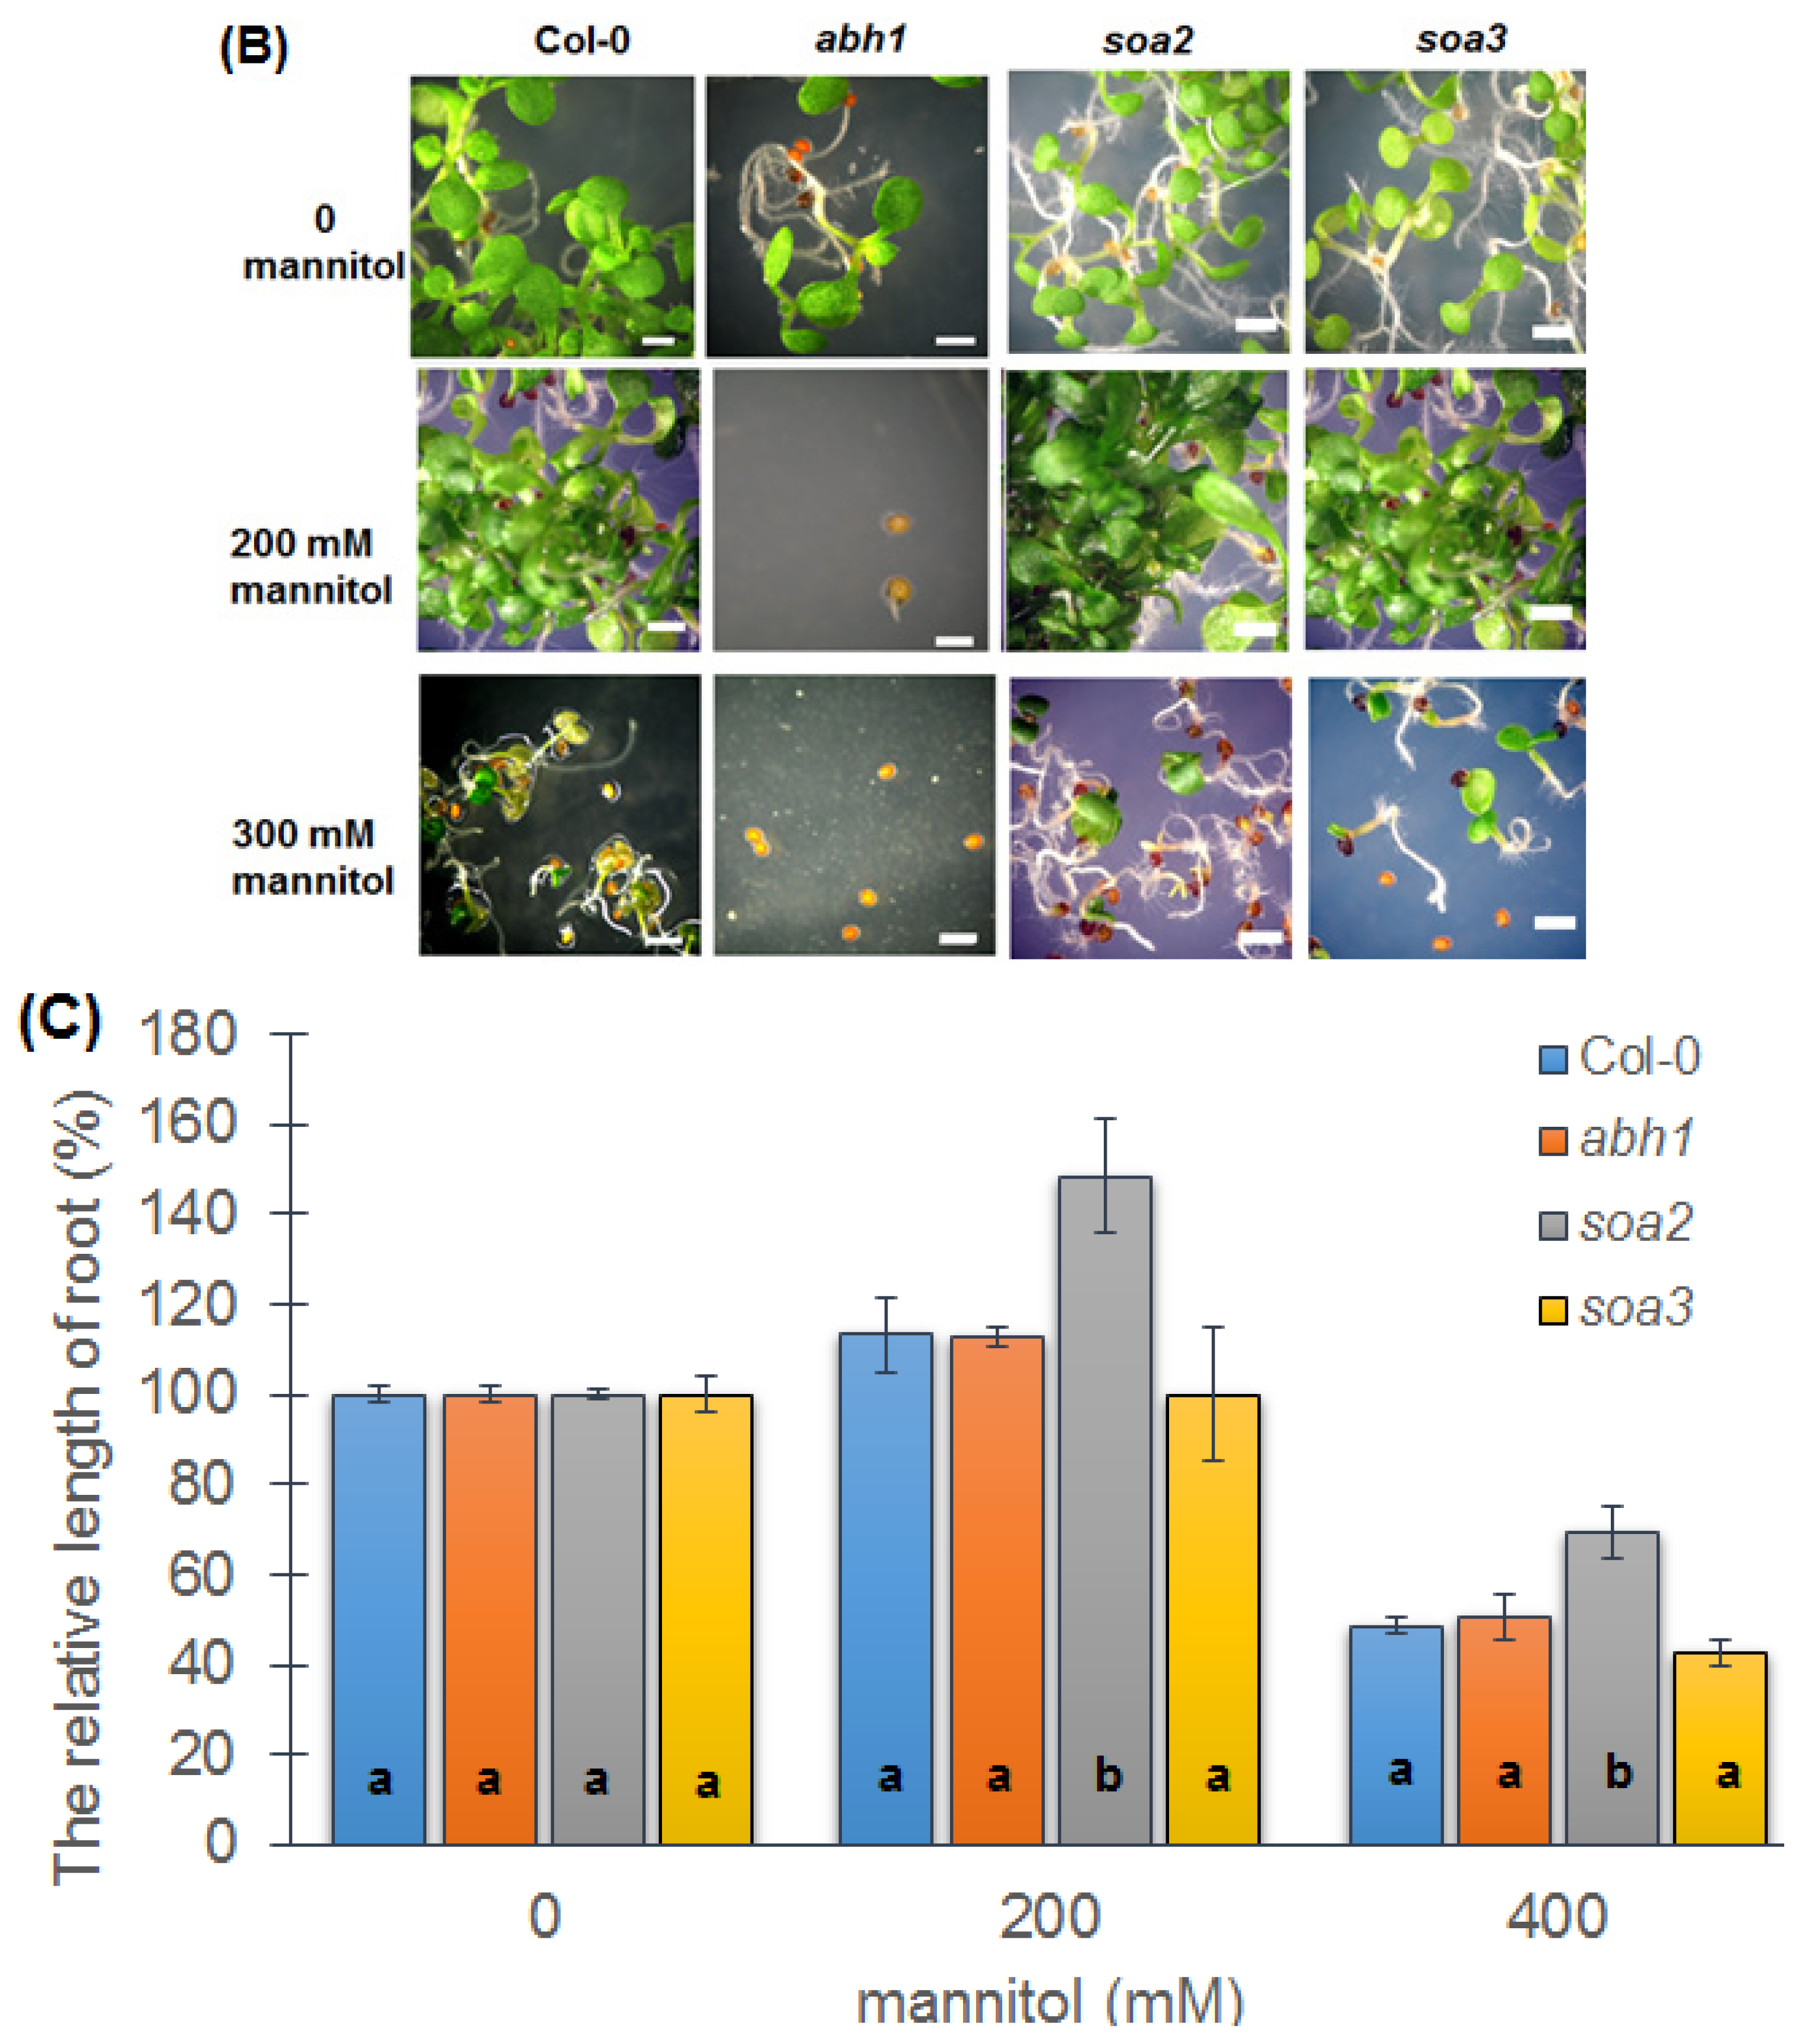
In order to check whether the response to salt was salt-specific or universal for the osmotic stress, the response of both suppressors to mannitol as an osmotic factor was examined. It was observed that 60% and 100% of abh1 seeds showed an inhibition of germination in the presence of 200 and 300 mM of mannitol, respectively. In the case of Col-0, a higher fraction of germinated seeds was observed in the presence of 200 and 300 mM (80% and 70%), when compared to abh1. The response of suppressors was intermediate between their parental line, abh1 and the wild-type, Col-0. In the presence of the highest mannitol concentration, both suppressors were capable of germination at the level of 20%, while abh1 was not (Figure 4A).
Taking into account that the level of sensitivity to abiotic stresses during germination and early seedling growth should also be determined on the basis of cotyledon development, further analyses were performed on the 14th day after the end of stratification. Both suppressor mutants, soa2 and soa3, showed well-developed and fully green cotyledons in the presence of 200 and 300 mM mannitol (Figure 4B). These results together showed that suppressors displayed a reduced sensitivity to osmotic stress during early seedling development.
Similar to the salt stress, the soa2 and soa3 sensitivity to osmotic treatment was also tested during the root elongation growth. soa2 exhibited a tolerance to osmotic stress by continued root growth on a medium containing 200 mM and 400 mM of mannitol. In the presence of 400 mM, the root elongation was reduced to 40%–50% in the case of Col-0, abh1 and soa3 whereas soa2 showed a 70% root growth compared to control conditions (Figure 4C).

2.7. soa2 and soa3 Are Insensitive to High Glucose Concentrations

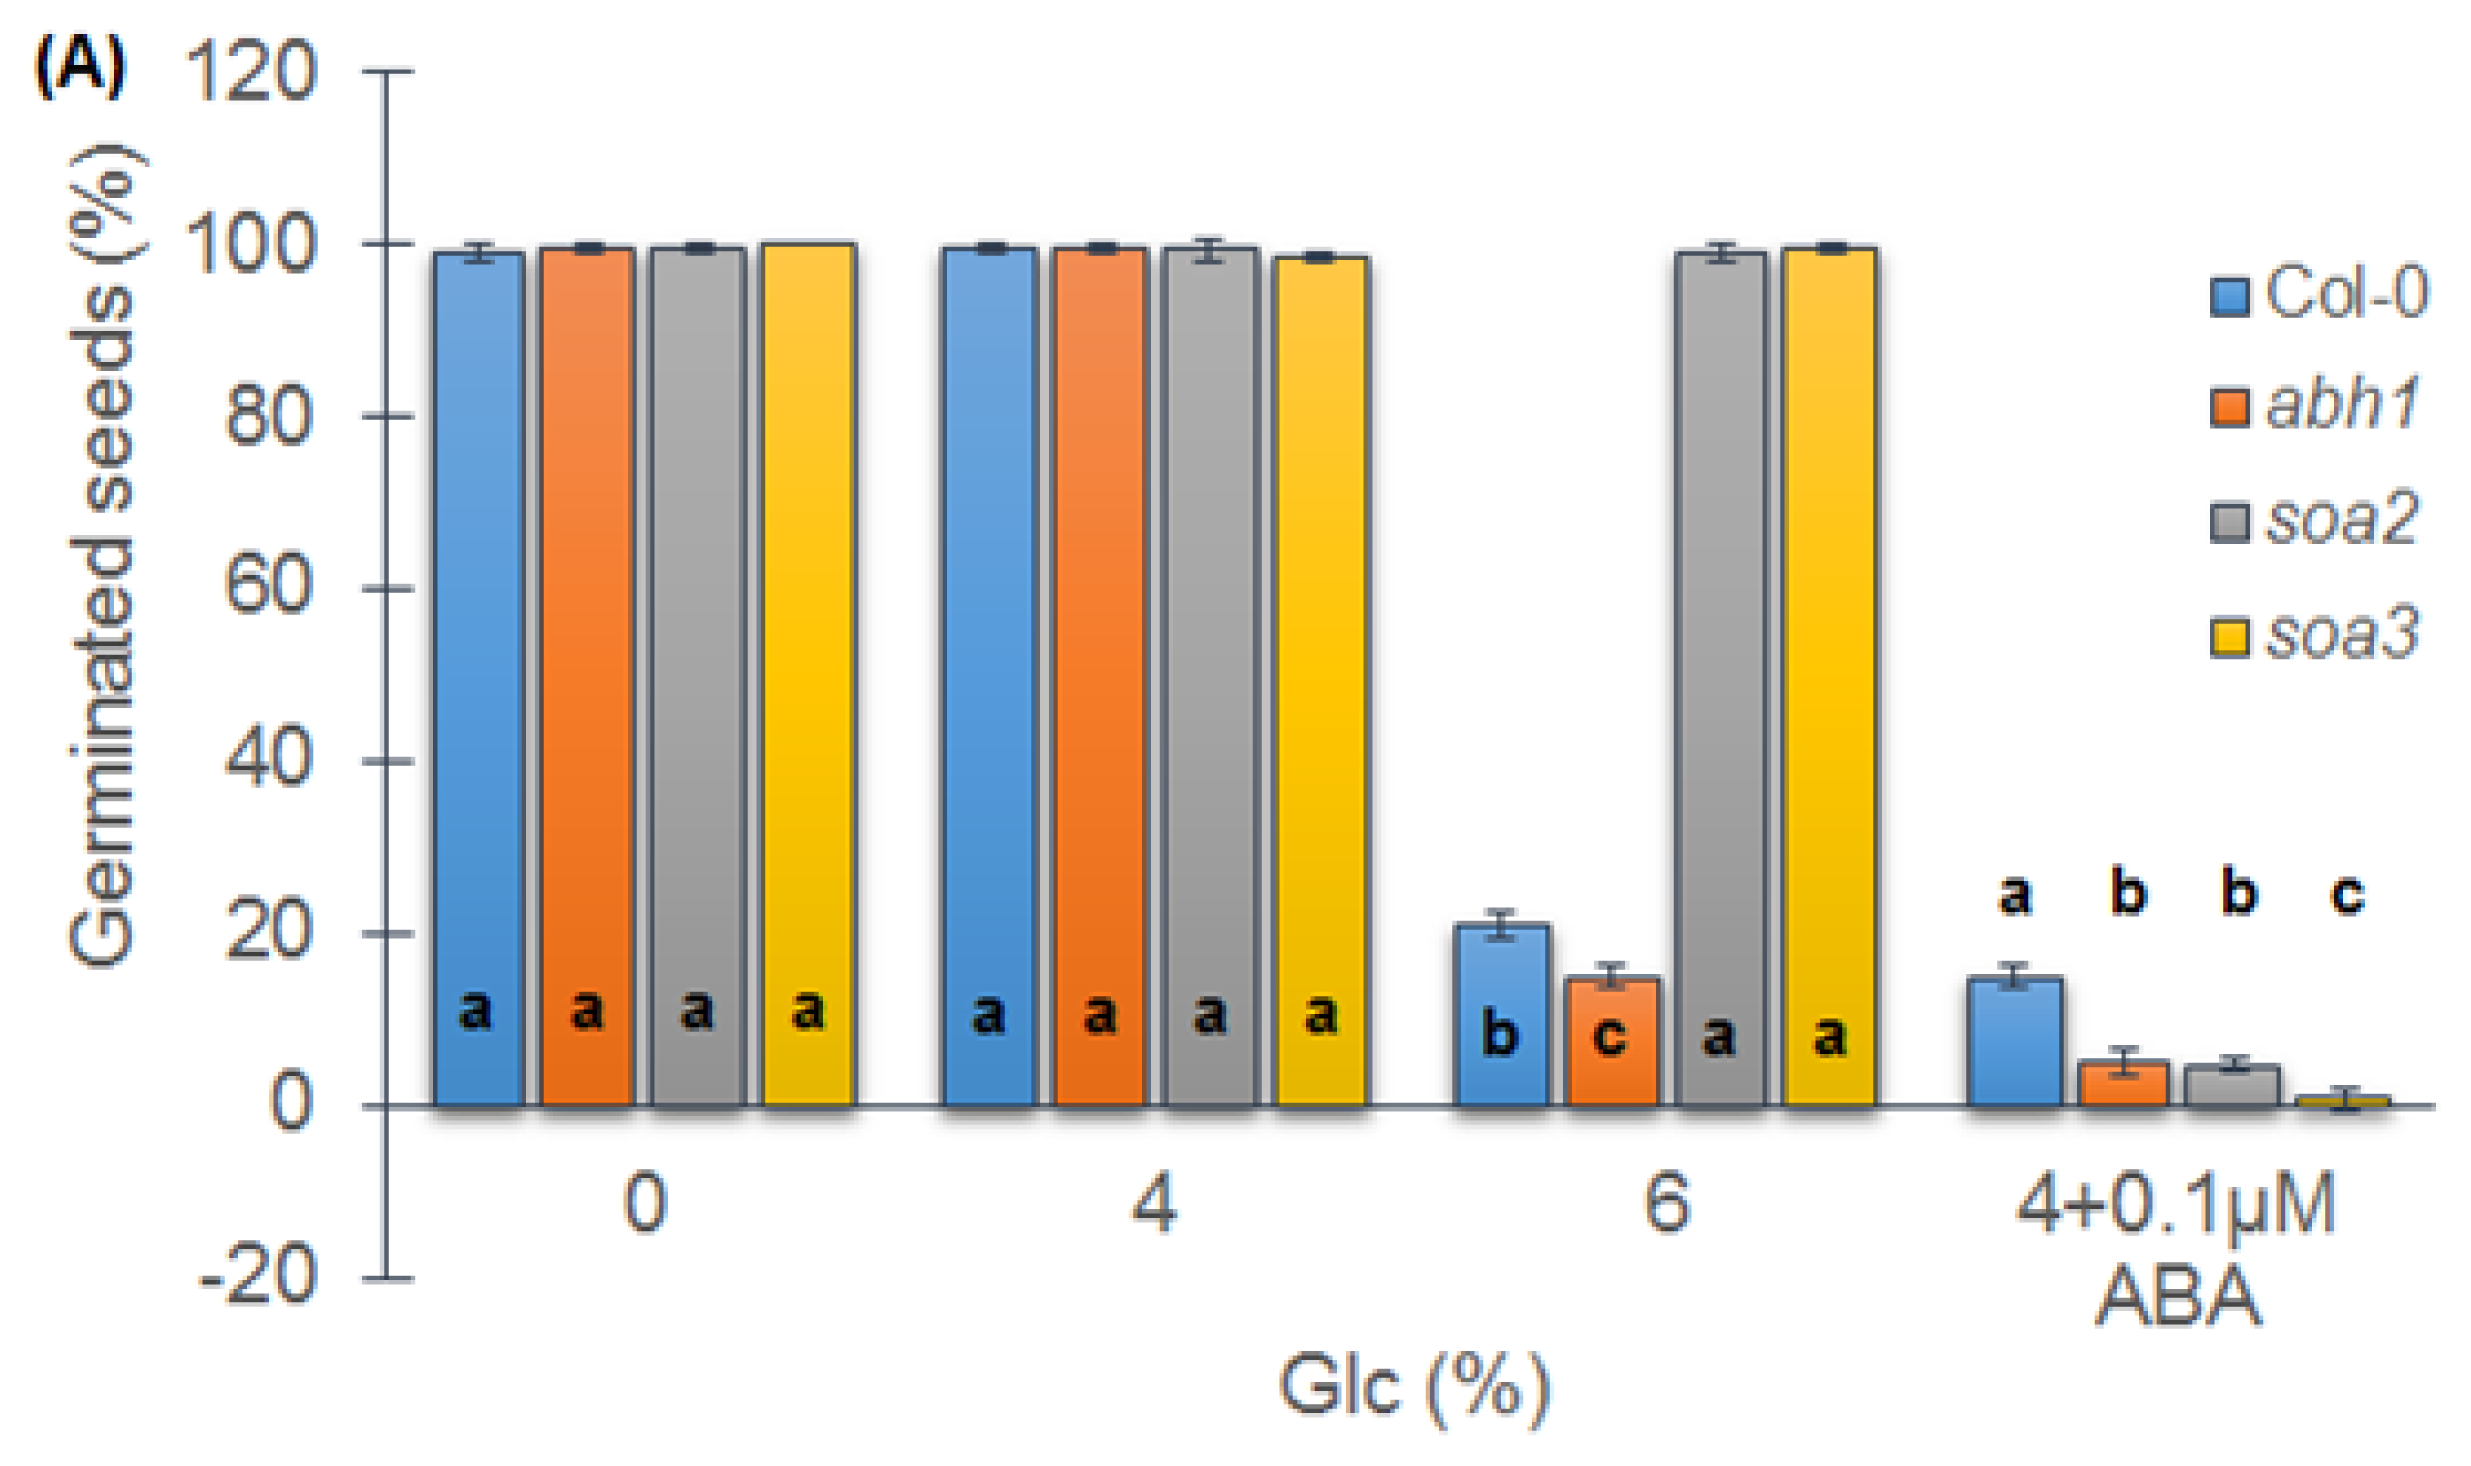
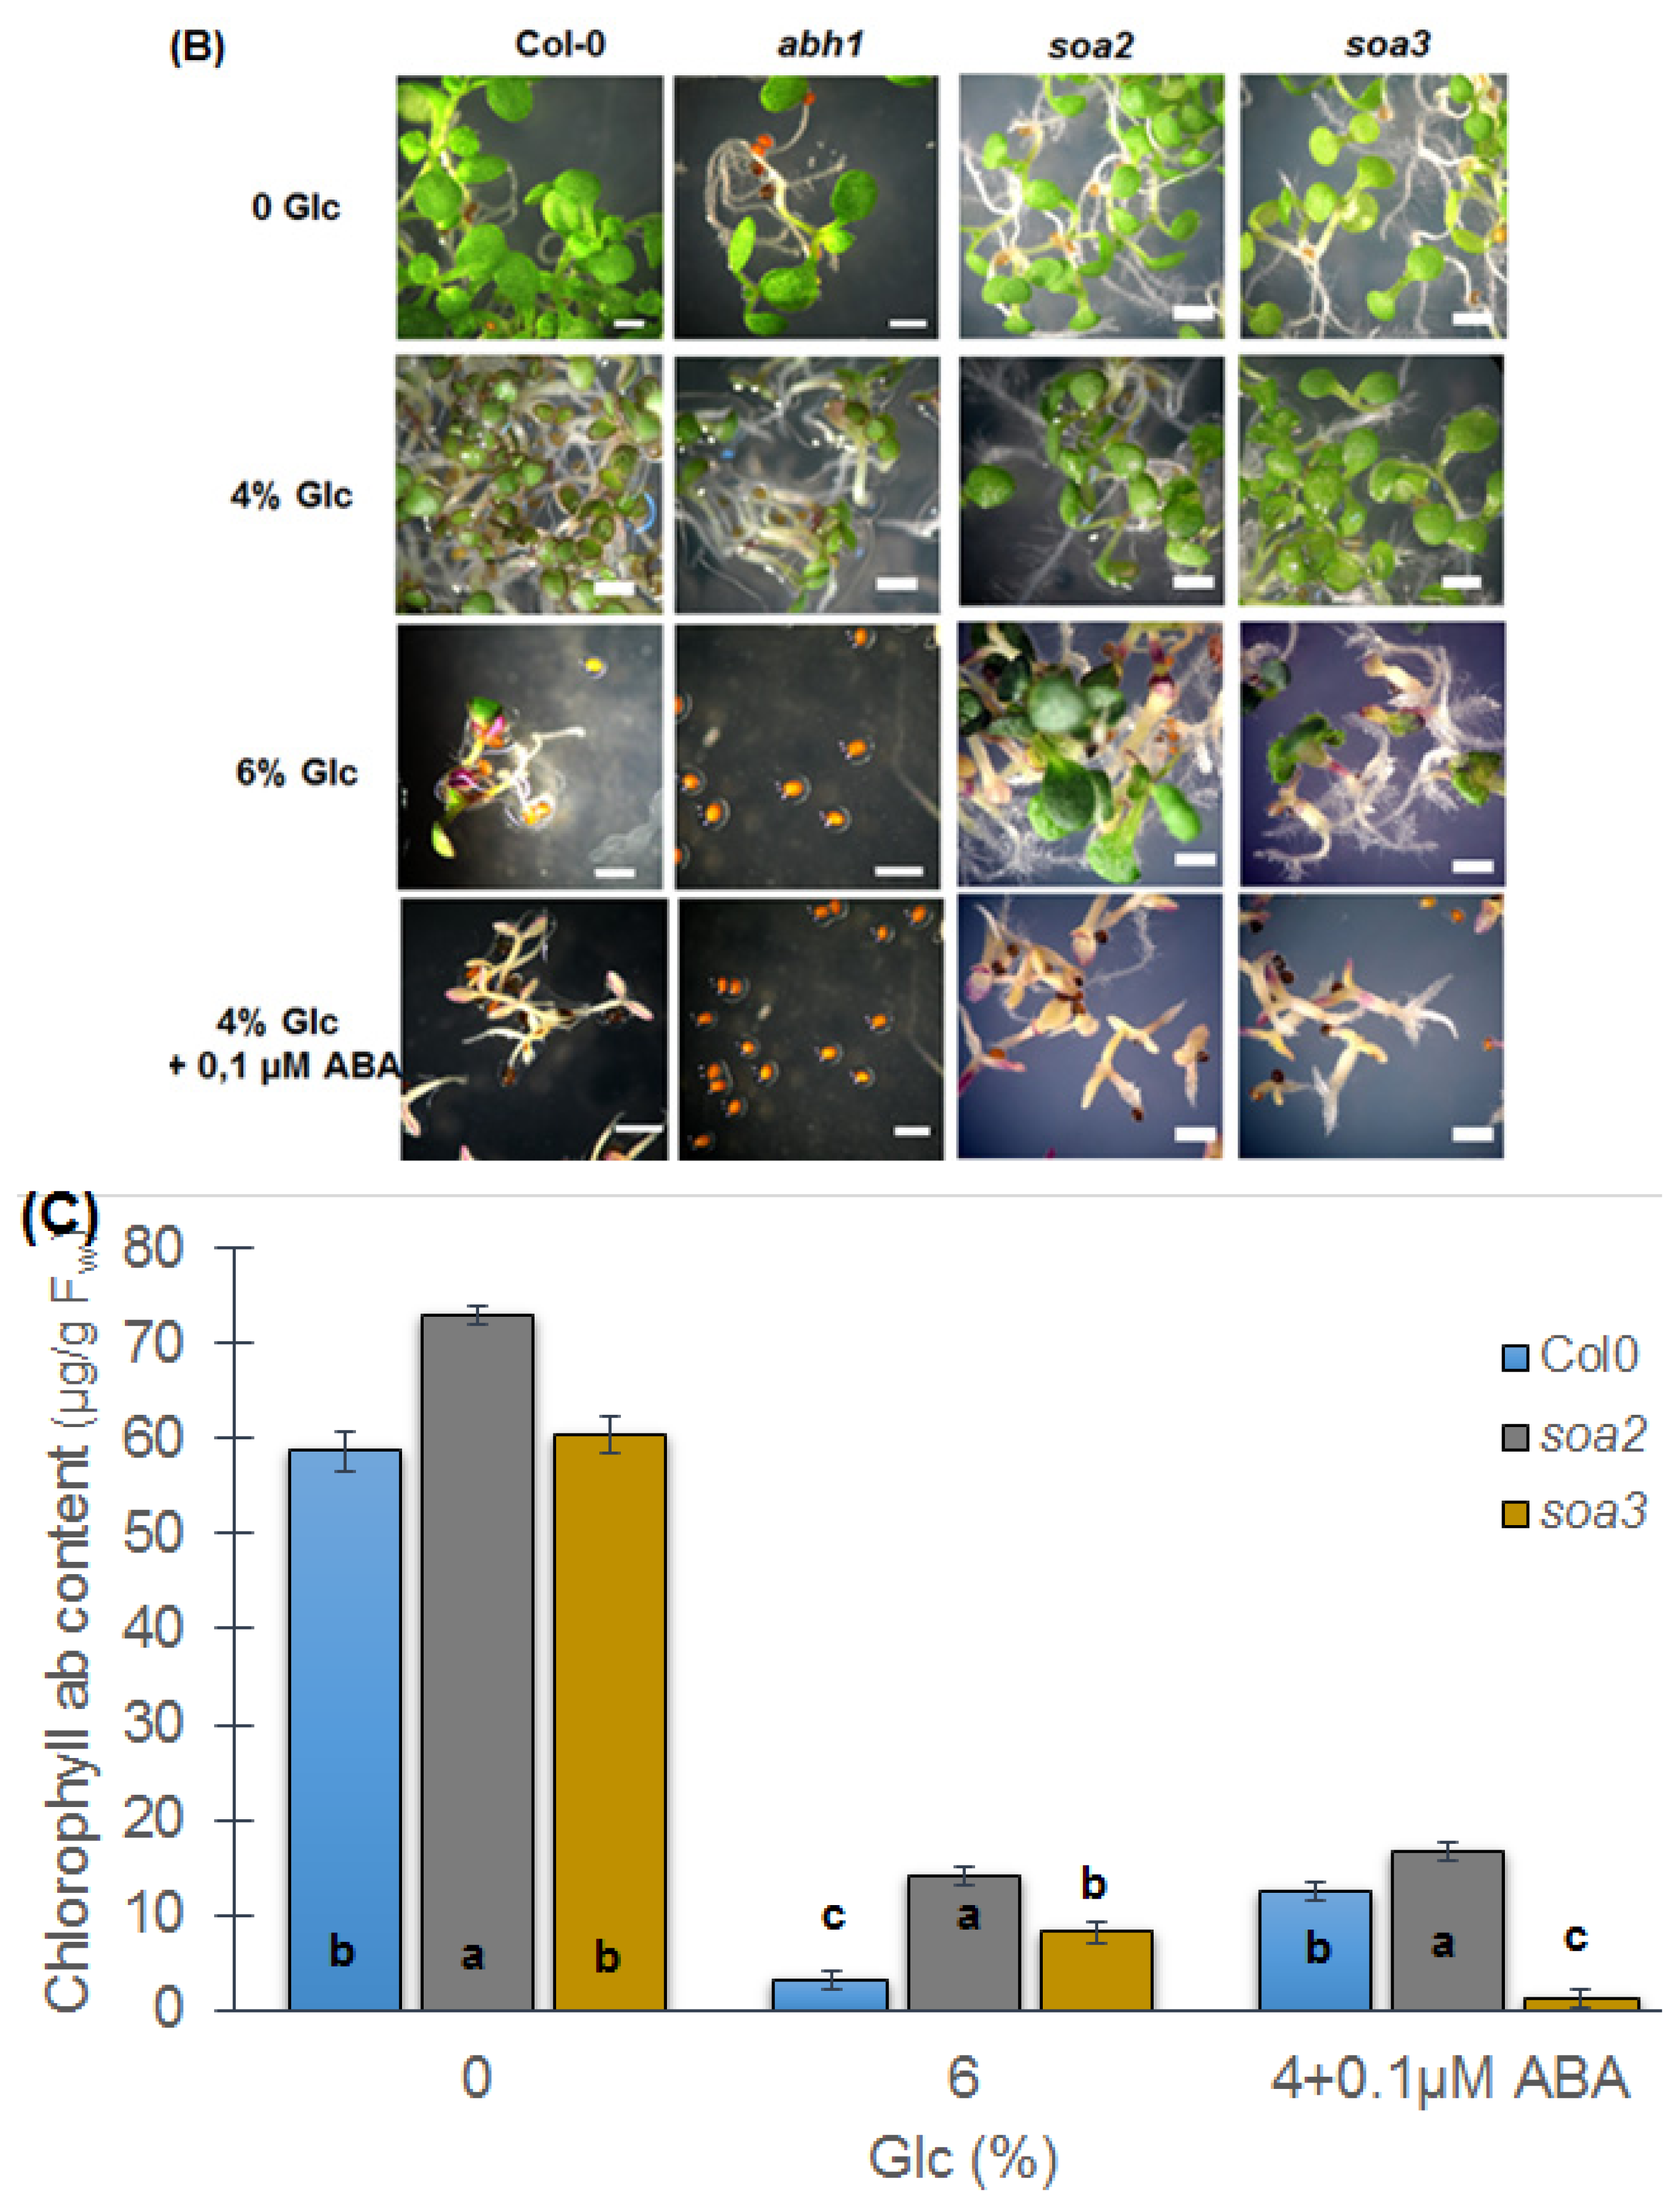
Seed germination of Col-0 is highly affected by high glucose concentration. In order to check whether suppressors displayed a different response to glucose (Glc) than their parental line, abh1 and the wild-type Col-0, a seed germination assay in the presence of different glucose concentrations was performed. In the presence of 4% of Glc, no differences between tested genotypes were observed. The application of 6% of Glc significantly inhibited seed germination of Col-0 and abh1, while both suppressors were able to germinate at the same level as observed on the control medium. When ABA in non-inhibitory concentration (0.1 μM) was added to the medium containing 4% of Glc, a decreased level of seed germination was observed in all of the genotypes studied (Figure 5A). The seedlings developed from seeds that germinated in the presence of 4% Glc with an addition of 0.1 μM ABA exhibited white cotyledons, and inhibited development of roots and were not able to survive (Figure 5B).
In order to quantify the effect of a 6% Glc and 4% of Glc with an addition of 0.1 μM ABA on cotyledon greening, the chlorophyll content of the seedlings was measured. This analysis confirmed the results of the germination test related the tolerance to a high Glc concentration of both suppressor mutants (Figure 5C). Both suppressors displayed a slightly higher level of chlorophyll ab than the wild-type in the presence of 6% Glc. On the medium containing 4% of Glc with an addition of 0.1 μM ABA, a different response of suppressors was observed. The chlorophyll ab content was significantly higher in soa2 than in soa3. Taking together, a higher reduction of seed germination and a lower level of chlorophyll in the developed seedlings in soa3 mutant indicate its higher sensitivity to low ABA concentrations combined with 4% glucose than the soa2 mutant.

2.8. soa2 and soa3 Display a Drought-Tolerant Phenotype

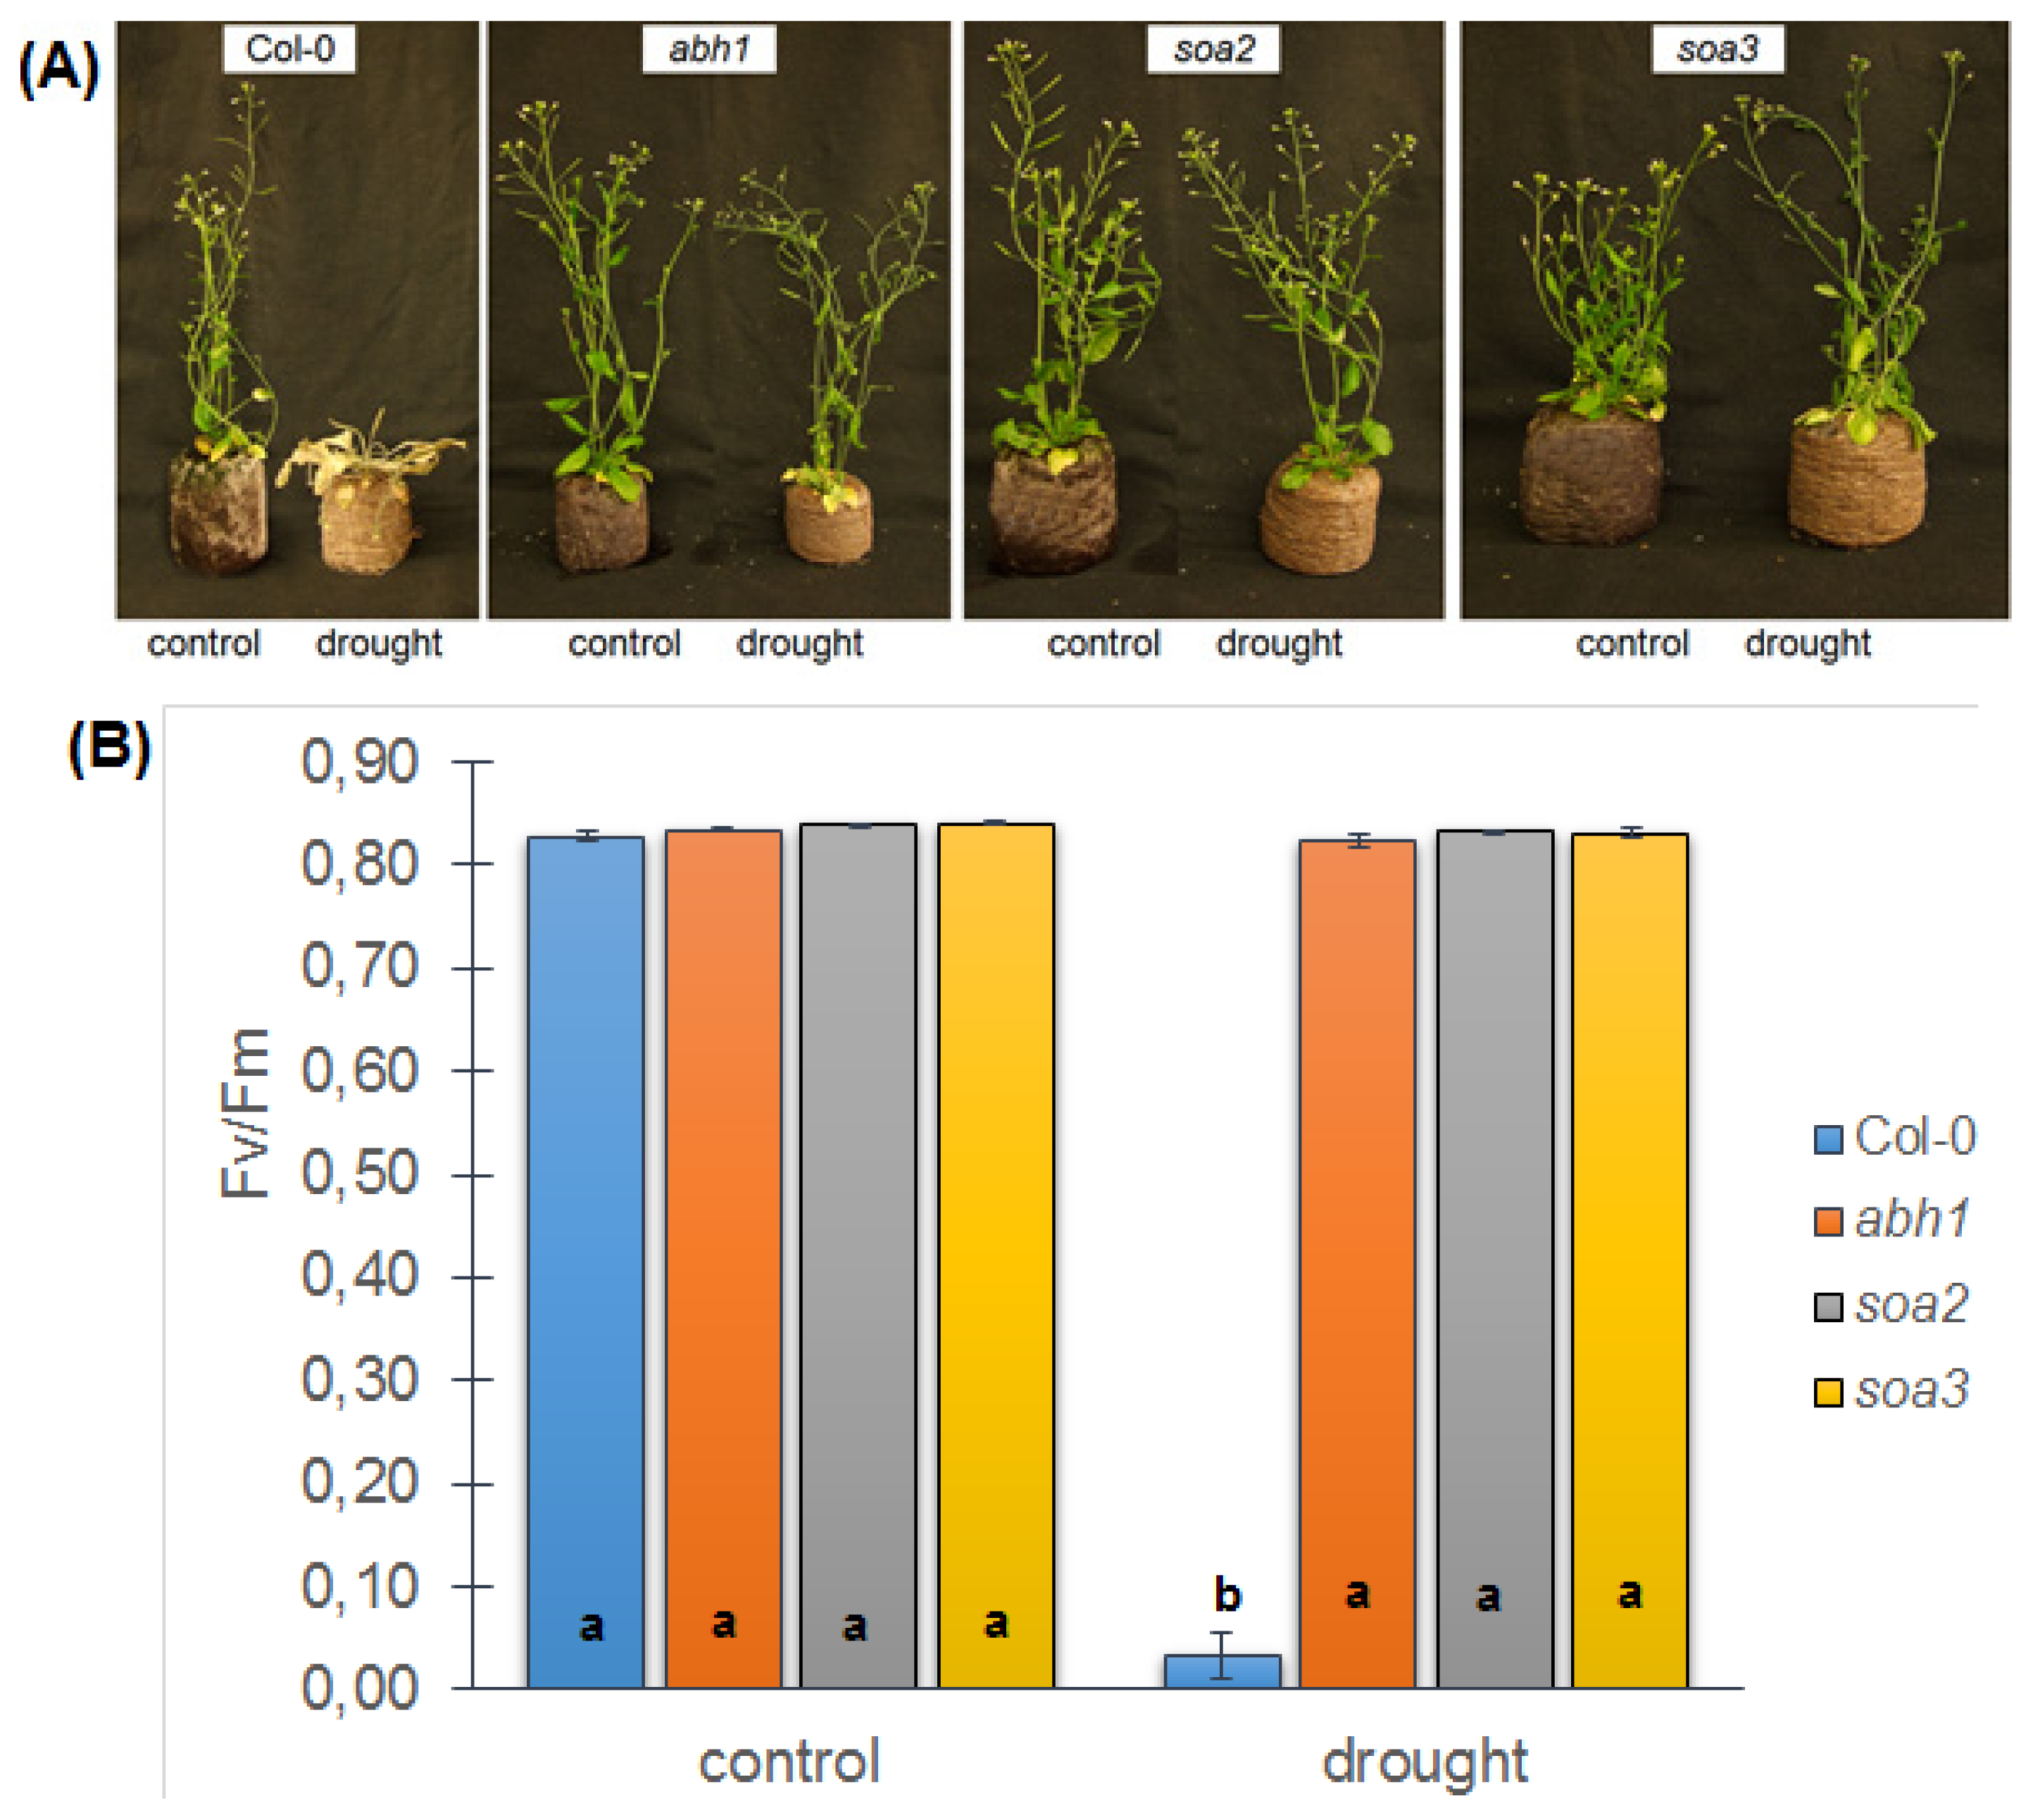
The effect of the suppression of abh1 hypersensitivity to ABA described above was exhibited as the inhibition of the abh1 phenotype in response to stresses, such as salt, osmotic and exogenous glucose, which were applied during seed germination and early seedling development. To check whether the suppression also acts at other stages of plant development, mature plants of the genotypes studied were exposed to drought stress. The abh1 mutant is known to be drought tolerant because of its rapid closure of the stomata in stress conditions [40]. To compare the response of Col-0, abh1 and suppressors to drought stress, drought treatment was applied for 4 weeks, after which the plants were re-watered for 3 days and their phenotype was examined (Figure 6A).
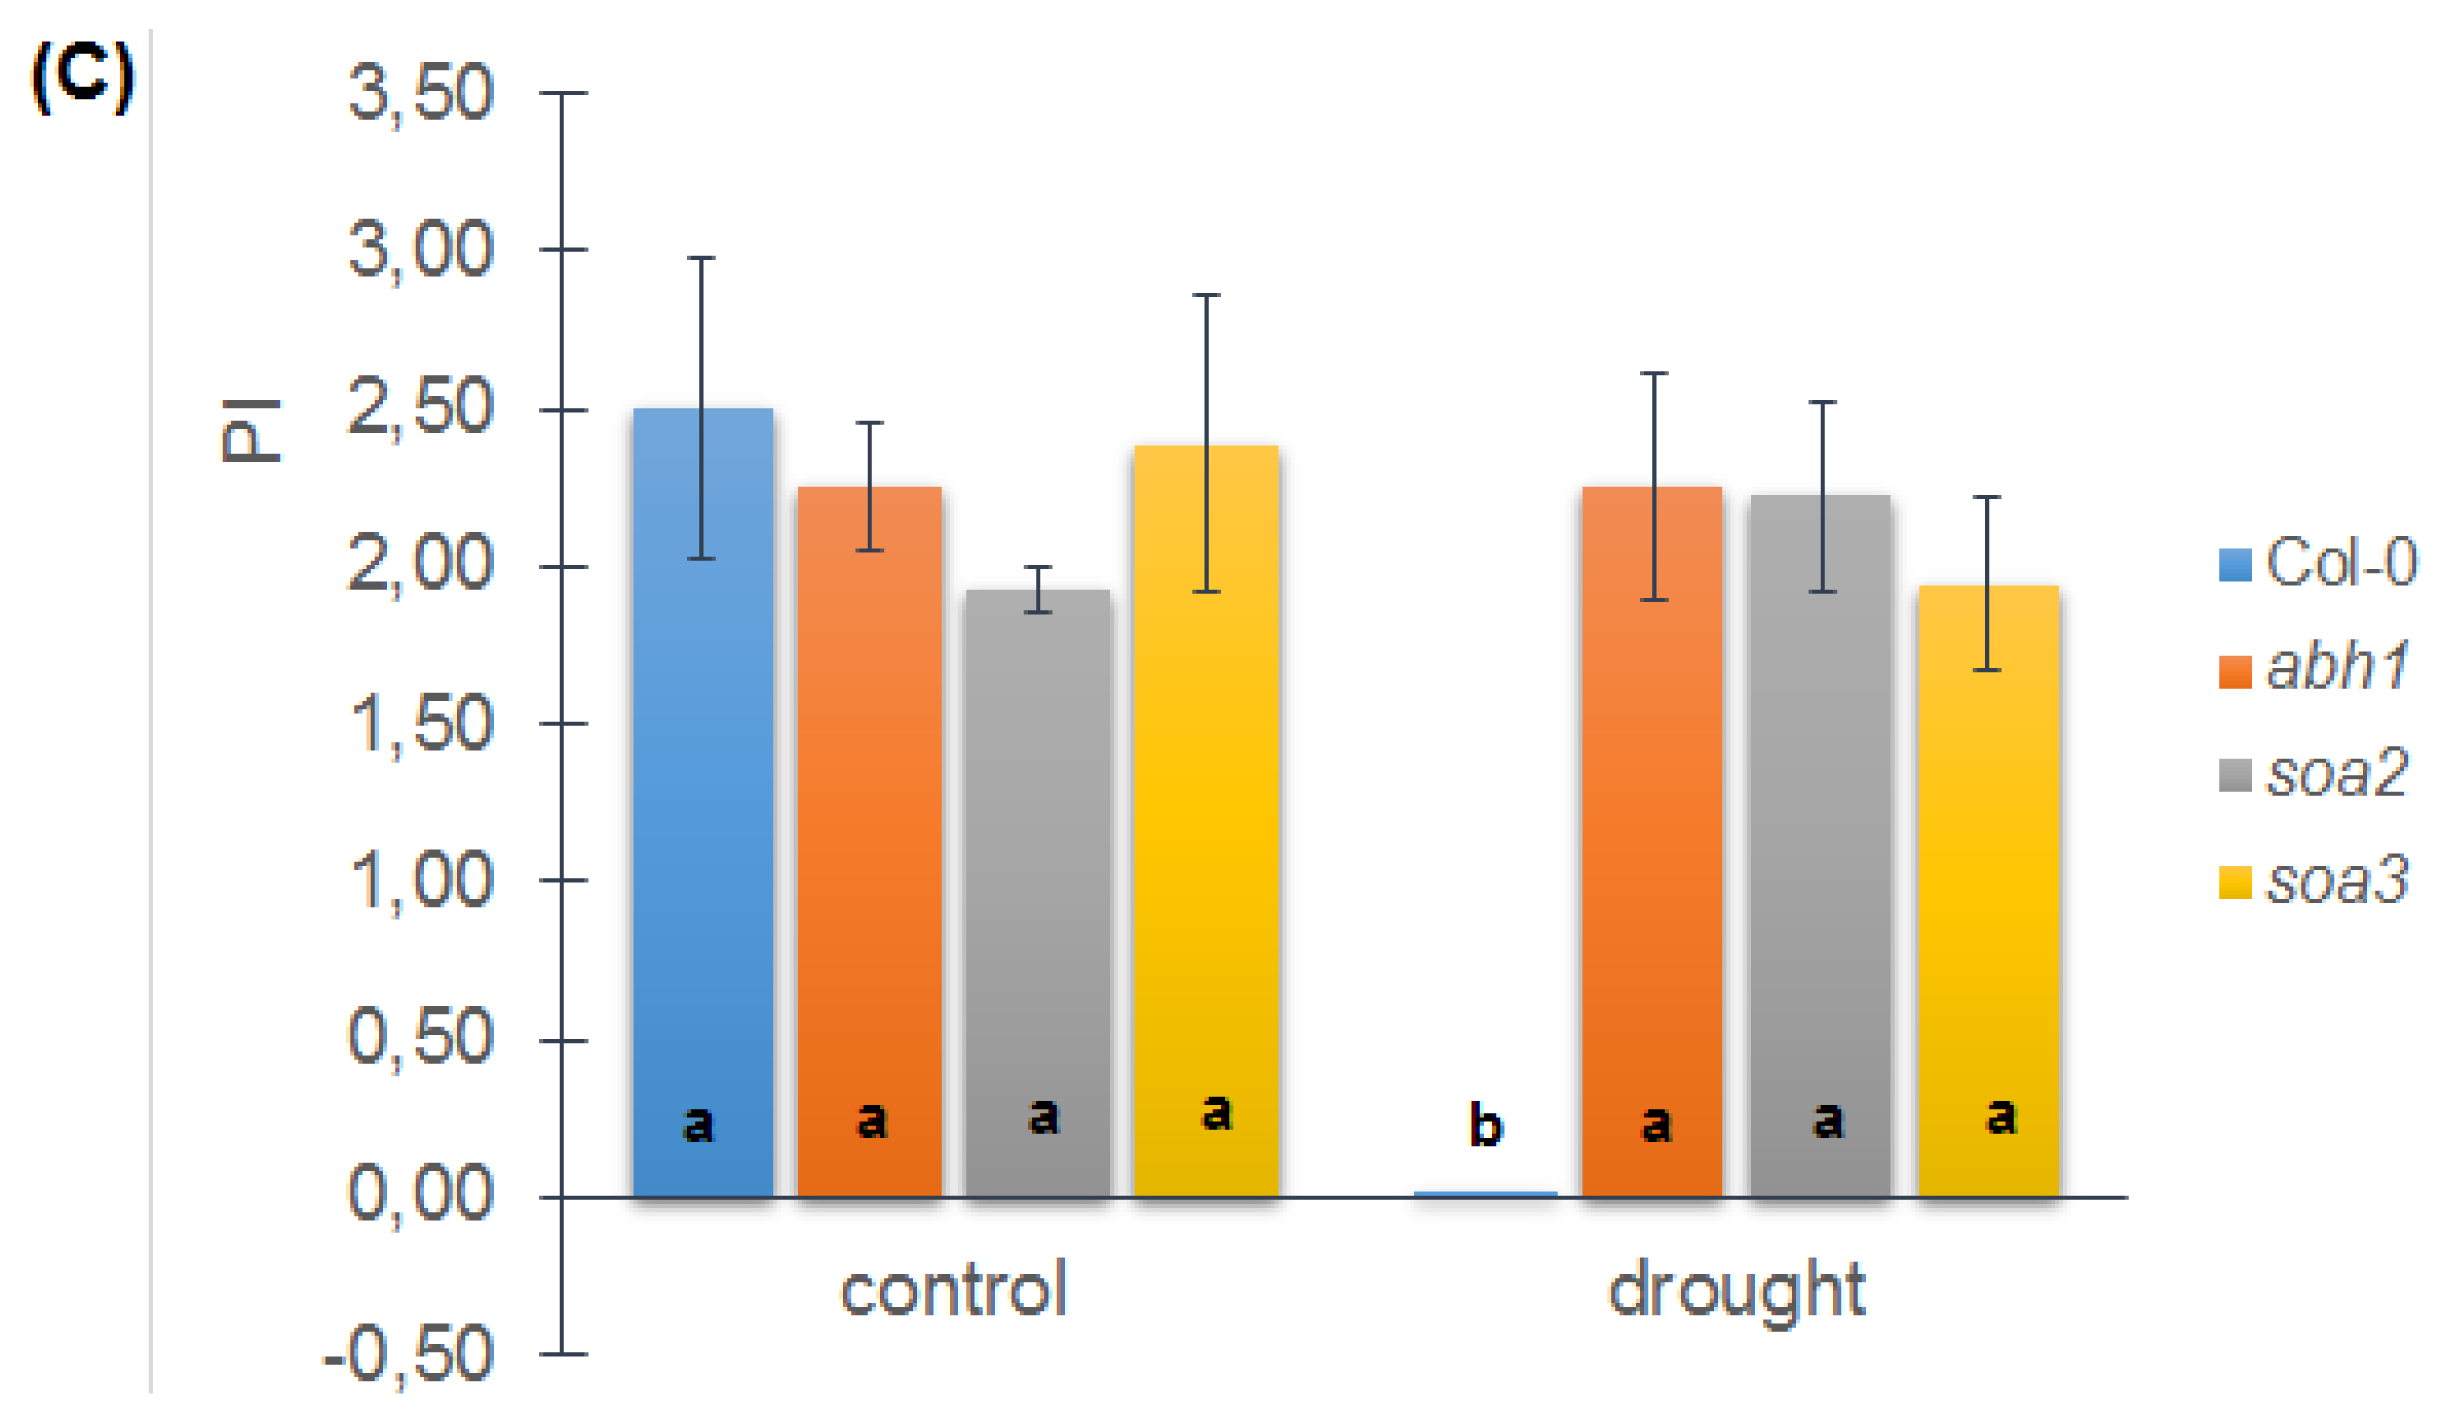
Col-0 did not survive the stress treatment, whereas abh1 and the suppressor mutants displayed a slightly wilty phenotype after 26 days of drought, but restored a normal phenotype after 3 days of re-watering. Fluorimetric measurements on the 30th day of the experiment were conducted using PocketPea (Hansatech, Norfolk, England). Neither the abh1 mutant nor its suppressor mutants displayed any drought-induced changes in PSII performance, in contrast to Col-0 (Figure 6A,B).
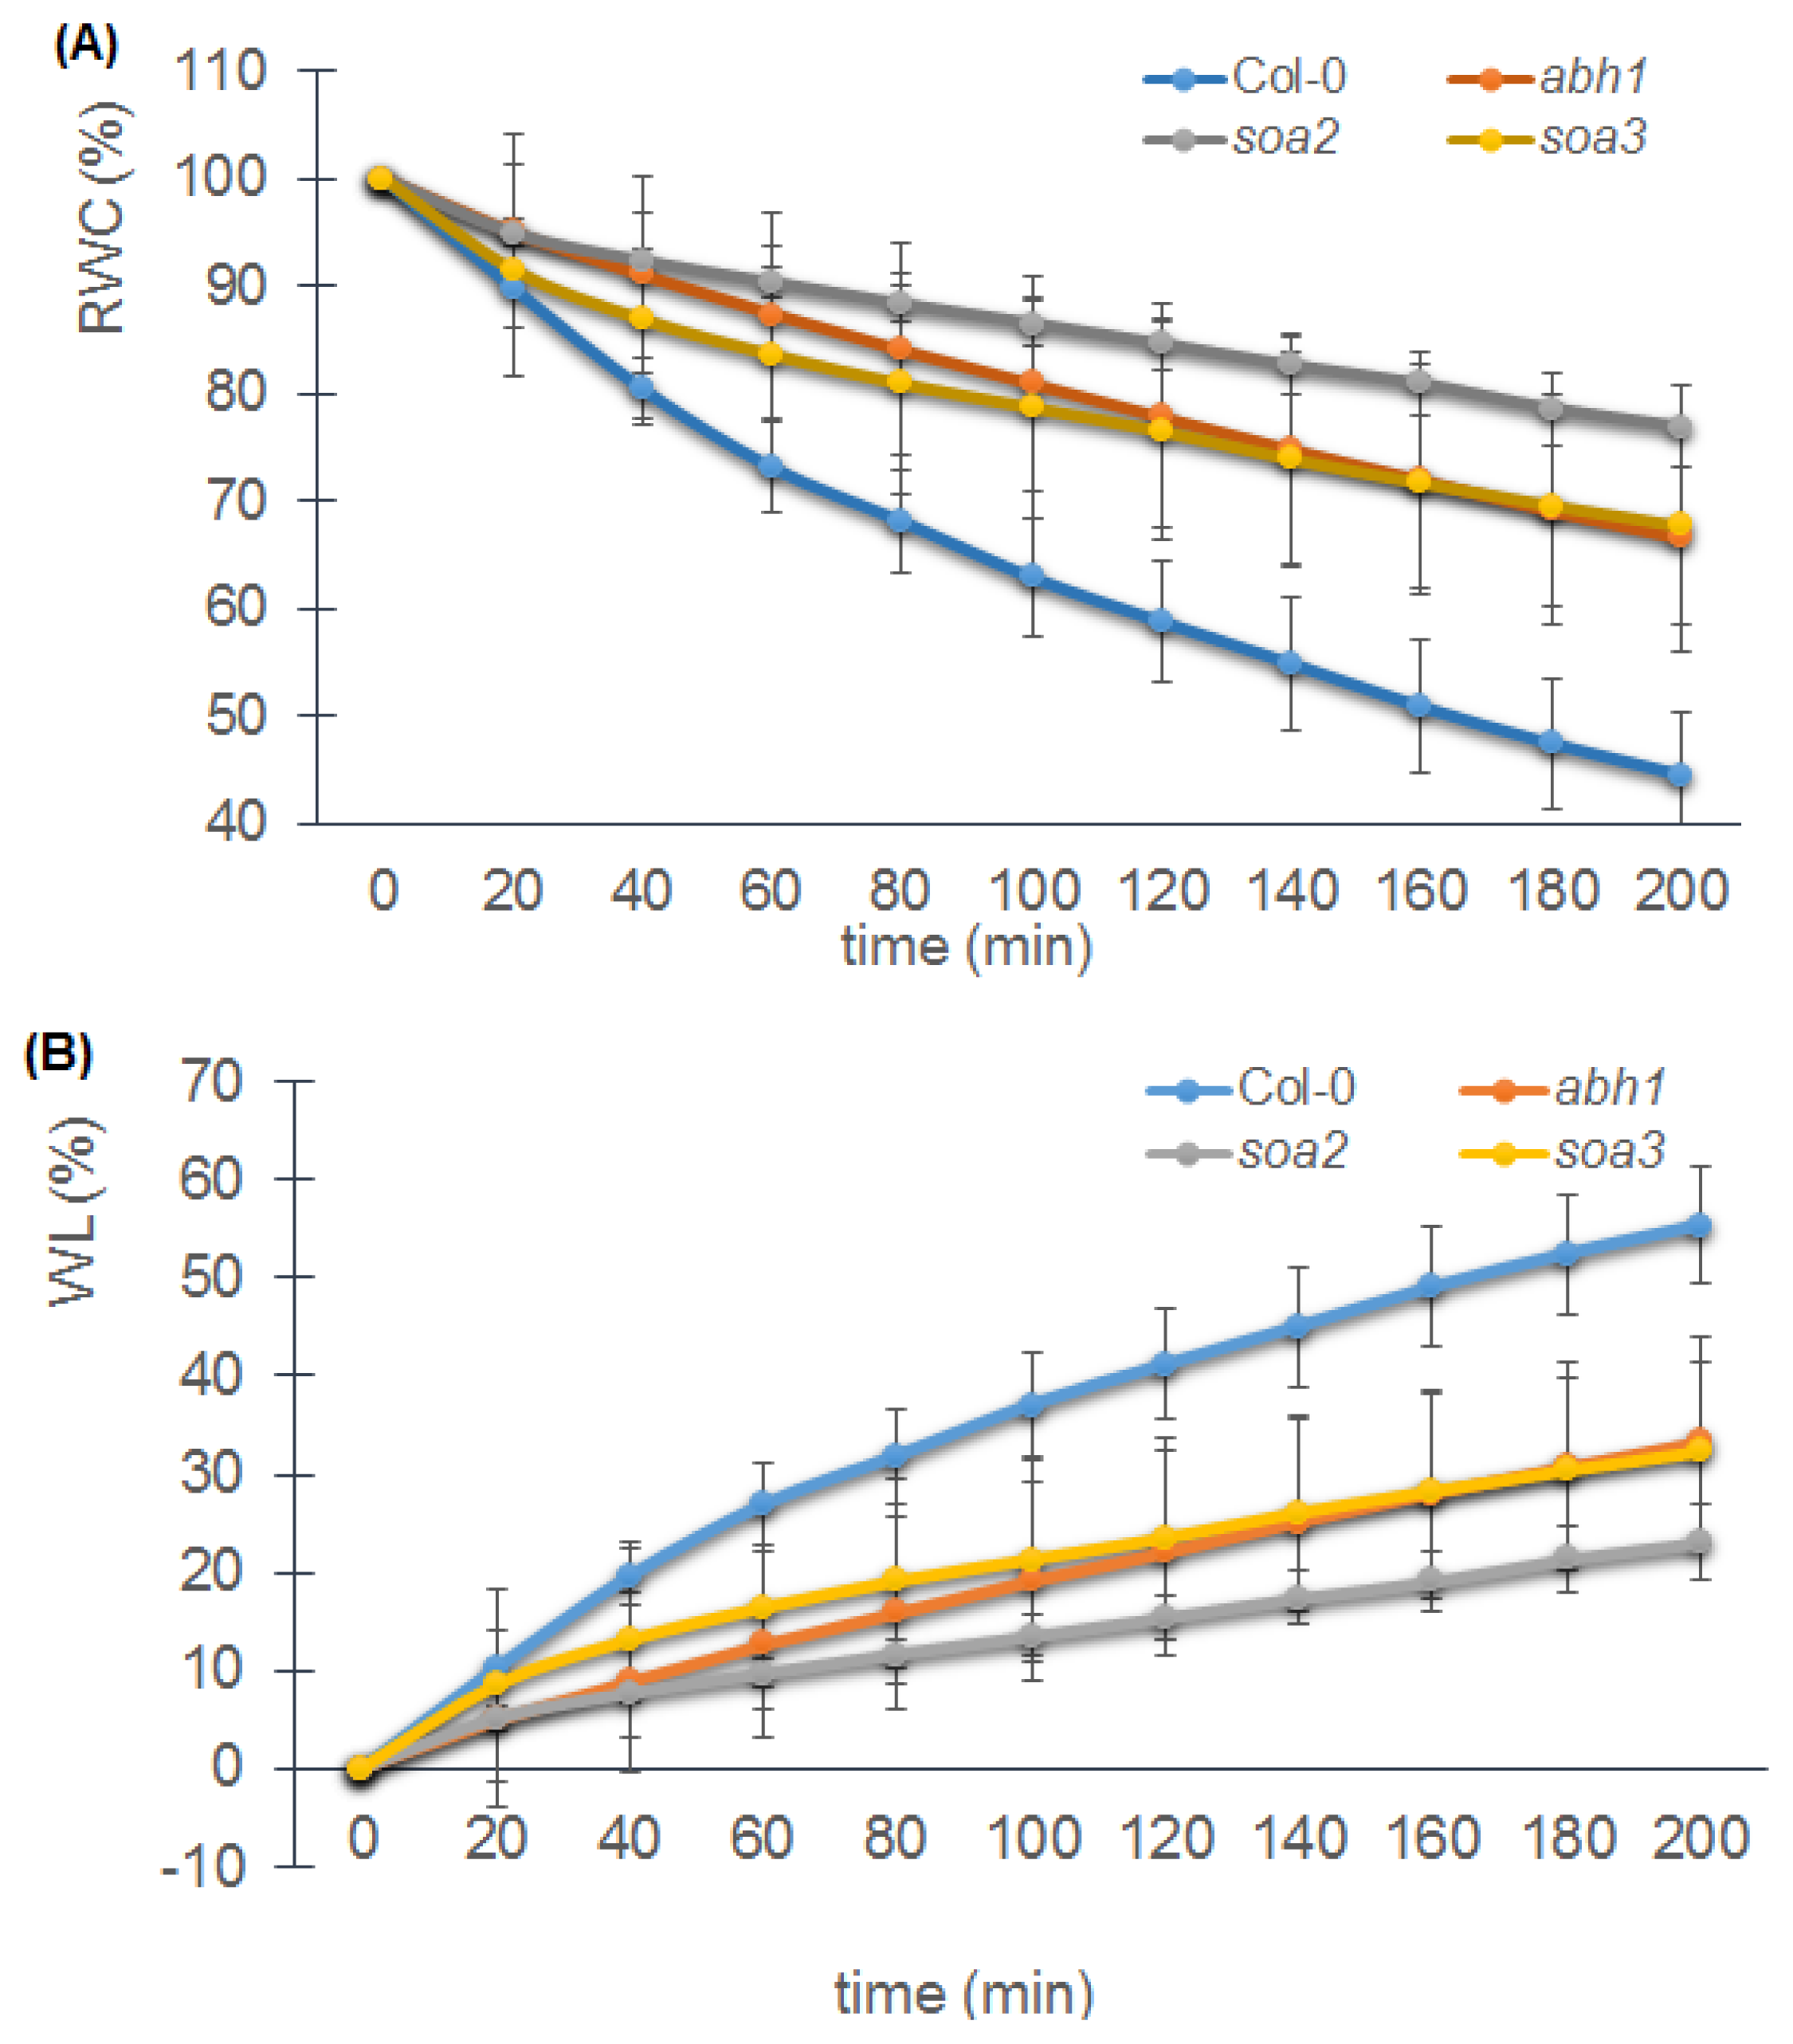
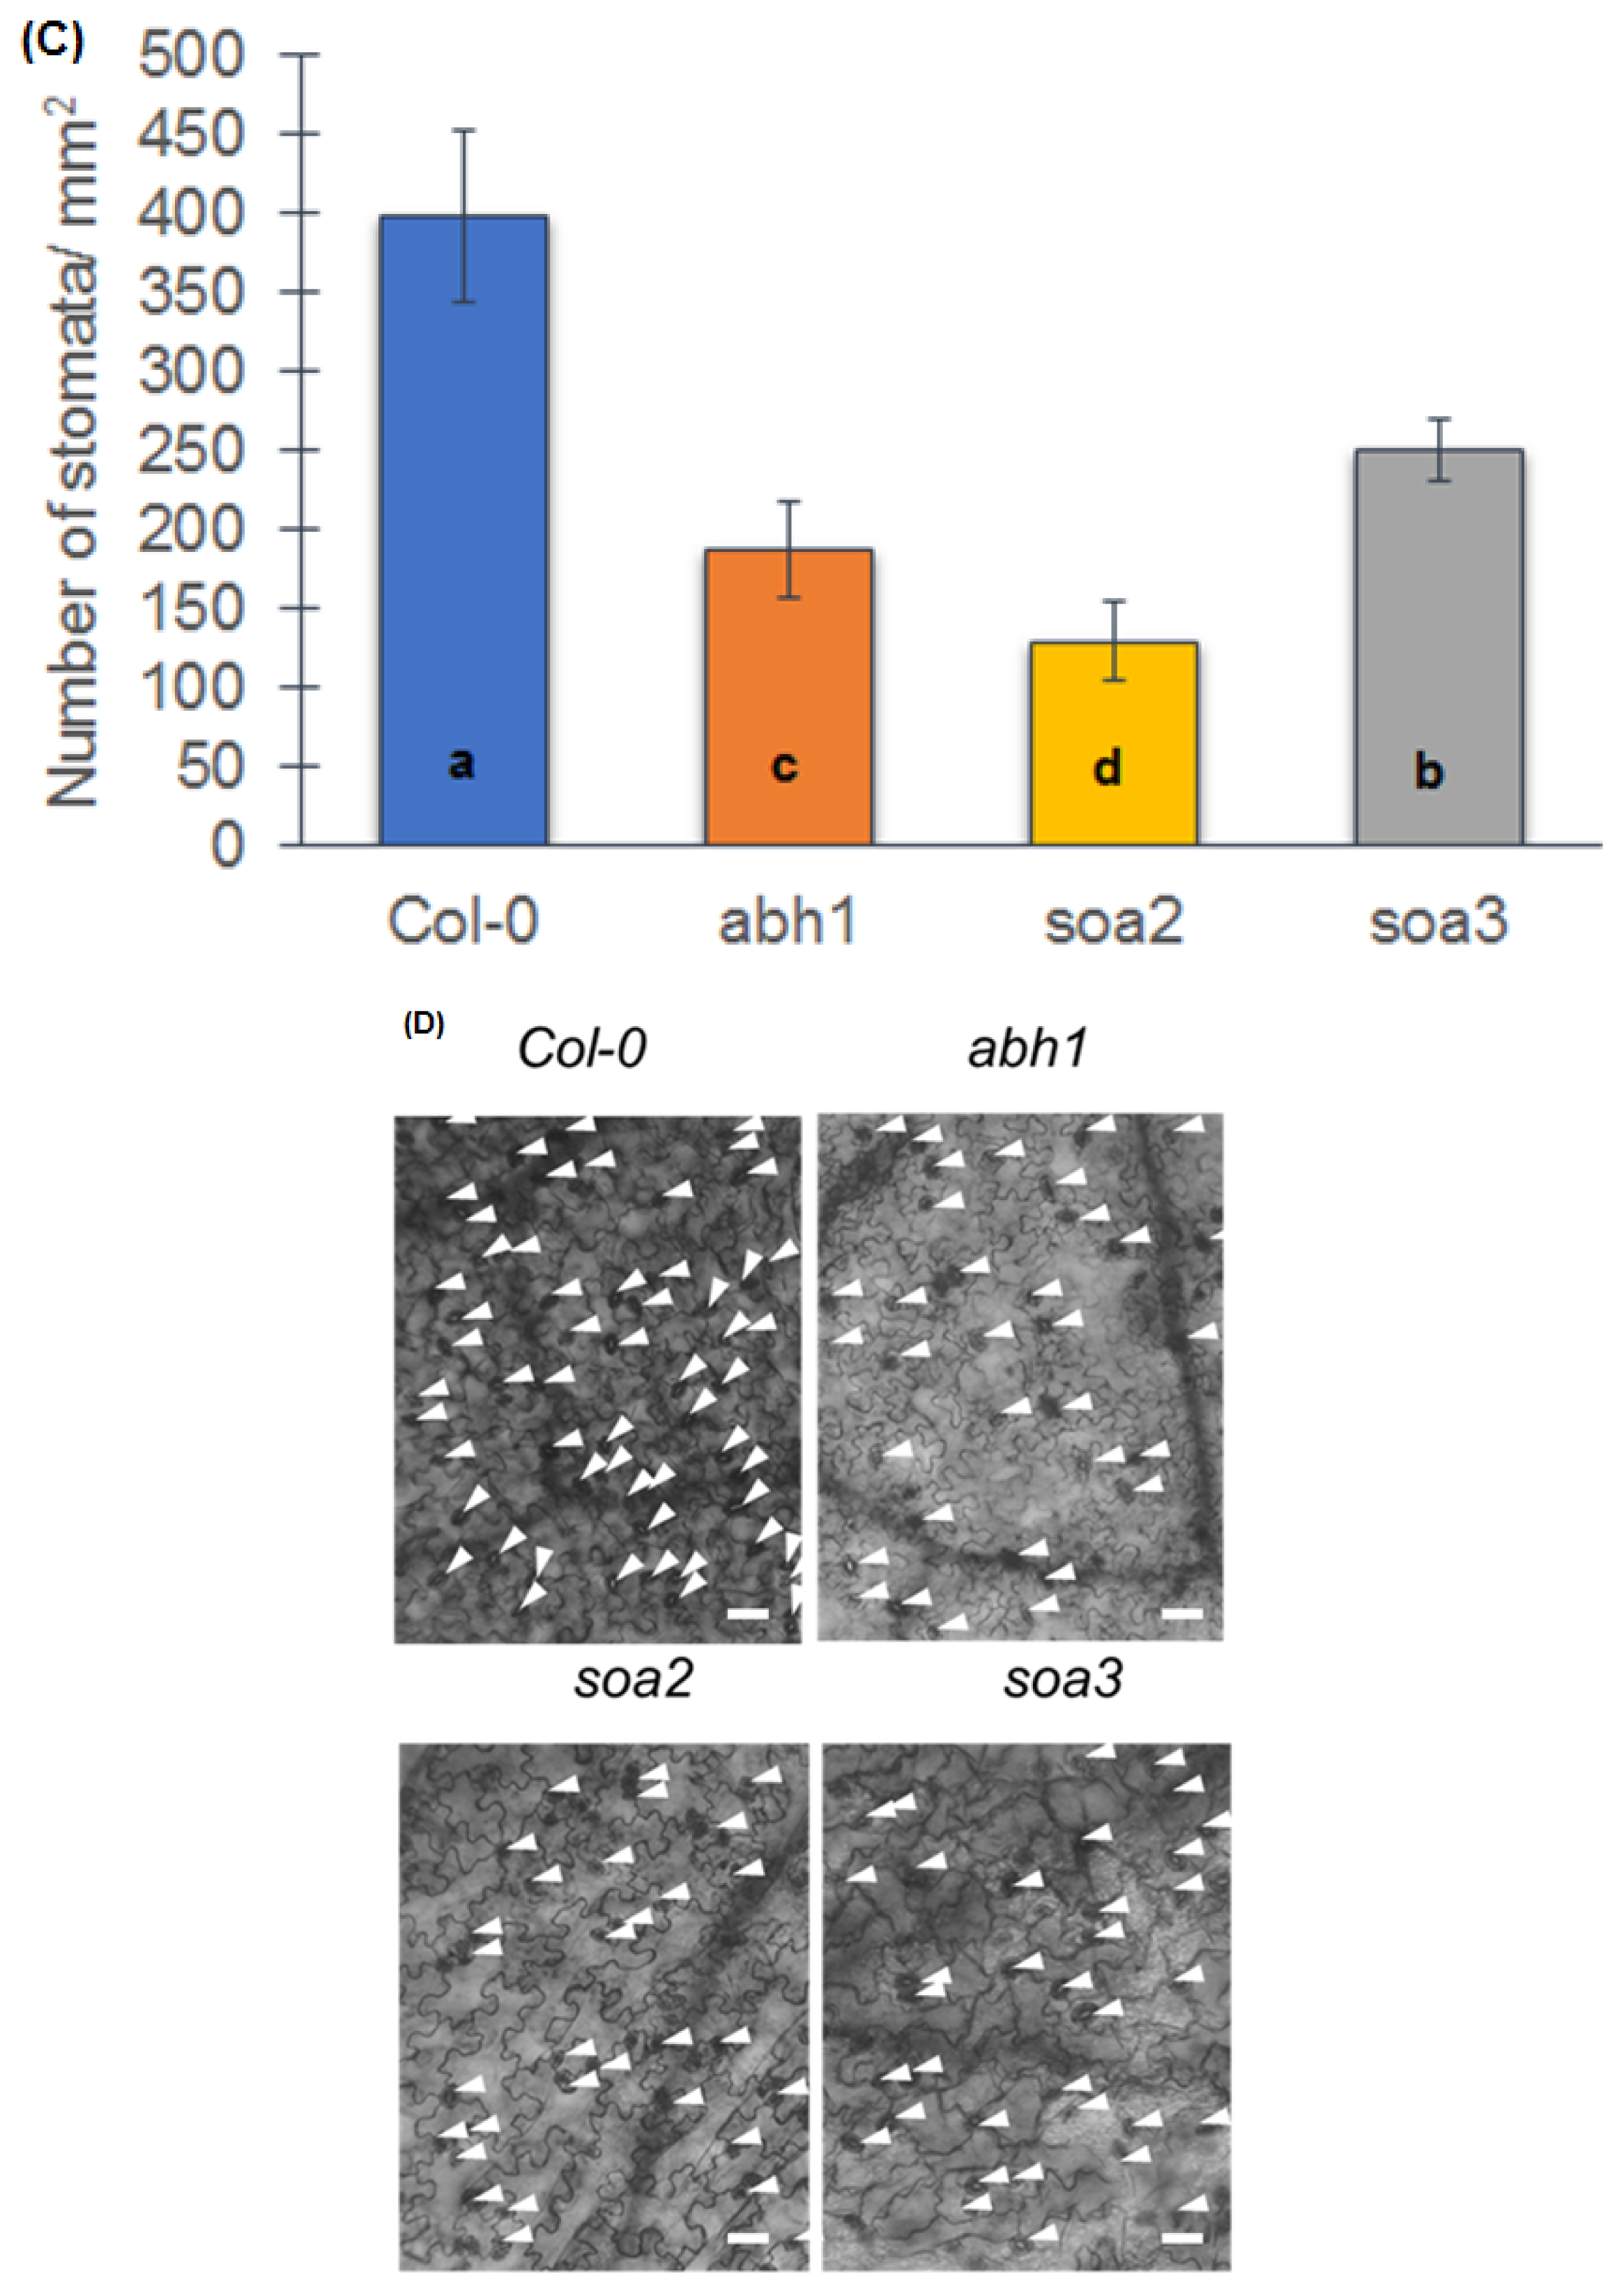
In order to check whether the drought-tolerant phenotype of soa2 and soa3 is due to the action of the stomata, like in the abh1, or whether it results from a decreased stomatal density, measurements of RWC (Relative Water Content) and WL (Water Loss) in detached leaves were carried out and stomatal density was estimated using a confocal laser scanning microscope. The RWC in detached leaves of abh1 and suppressor mutants was higher than in the wild-type after 200 min and WL was much slower (Figure 7A,B). Analysis of rosette leaves examined under the confocal microscope revealed that the abh1, soa2 and soa3 had about 50% fewer stomata per mm2 than the wild-type (Figure 7C,D).

2.9. An Attempt to Identify the Suppressor Mutations Using the Candidate Genes Approach Based on Mutants Phenotype

In order to propose candidates for suppressor genes, the information from the experiments described above was used. On the basis of the phenotype traits characterized, such as response to ABA, osmotic and salt stress during seed germination and early seedling development and drought response at the mature plant stage, data-mining using the literature and sequences repositories was performed. Seven candidate genes were chosen for further analysis (Table 4). Amplified genomic sequences of the candidate genes were sequenced and the obtained sequences were aligned between abh1 and each suppressor mutant using the CodonCode Aligner [62]. A sequence analysis revealed no mutation in any of the candidate genes analyzed.

2.10. Generation of Mapping Populations for Map-Based Cloning of Suppressor Genes

In order to identify the suppressor genes using a map-based cloning approach, two independent mapping populations were created. Taking into account that suppressor mutations as well as the mutation in their parental line (abh1) were induced in the Columbia-0 background, it was necessary to change the genetic background of abh1 to the background of another Arabidopsis ecotype, Landsberg erecta. The original abh1 mutant was backcrossed four times with Landsberg erecta. Then, both suppressors were crossed with abh1 in the Landsberg erecta background. Seeds of the obtained F1 generation were germinated in the presence of 0.4 μM ABA and then F1 plants were allowed to self-pollinate in order to generate F2 seeds. The F2 population of the cross soa3 × abh1 [Ler] was evaluated on a medium containing 0.4 μM ABA and F2 plants homozygous for soa3 gene were isolated based on their ABA insensitive phenotype (Table 5).
Thirty individuals homozygous for soa3 mutation, were used for rough mapping using 22 SSLP markers. A linkage of the soa3 gene with ciw4 and nga6 markers was observed on the long arm of chromosome 3. Future work will include analysis of more F2 individuals (minimum 300 F2 individuals exhibiting suppressor phenotype) in order to increase the resolution of the mapping and to narrow the region containing a mutation by searching for recombinants between soa3 and two flanking markers.

3. Discussion

In the presented study, we examined two suppressor mutants of abh1: soa2 and soa3. The sensitivity to ABA during seed germination was used as a physiological marker that enabled the isolation of the suppressor mutants in the presented study. Suppressors were not only insensitive to an ABA concentration of 0.4 μM that inhibited the germination of abh1, but were also able to germinate in the presence of 1 μM ABA. They were not allelic and both were recessive in relation to abh1 hypersensitivity to ABA. Further physiological and morphological analysis provided the means to distinguish between the two studied genotypes.
soa2 mutant displayed an insensitivity to ABA both during seed germination and seedling development. When ABA was applied in a concentration of 15 μM at the seedling stage, soa2 exhibited only a 30% root growth reduction compared to the control conditions, whereas root growth in soa3 Col-0 and abh1 was reduced by 70%. In addition, soa3 displayed much higher sensitivity to ABA and NaCl during seedling growth than other genotypes studied. It can be assumed that the suppressor gene in case of soa3 might not be the important regulator of ABA-dependent response to stress during seedling development.
Taking into account that ethylene-related mutants also display an insensitivity to high ABA concentrations in root growth [64], the impact of ACC on root growth in suppressor mutants was checked. Both soa2 and soa3 exhibited a 50% reduced root growth when compared to the control conditions. Together, these results suggest that the insensitivity of soa2 to ABA during seedling development is an ABA-specific response. Similar results were observed by Beaudoin et al. [65] for the ABA signaling mutant—abi1 (ABA insensitive 1). The effects of ethylene during seedling development seems to be independent of, or acts downstream of ABA effects at this stage, in contrast to their simultaneous actions during seed germination [65]. The role of ethylene during the seedling growth is inhibitory, whereas during seed germination it counteracts the role of ABA by promoting endosperm weakening [66].
Both suppressor mutants displayed an insensitivity to glucose and a reduced sensitivity to mannitol during seed germination. It is worth noting that soa2 also exhibited an insensitivity to glucose and mannitol during seedling development. Under osmotic stress, in the presence of 200 mM mannitol, roots of soa2 grew better than in control conditions, and in the presence of 400 mM mannitol, root growth was only reduced by 30%, whereas Col-0 and abh1 displayed a 50% reduction. These results correlated with observations of seedling growth in the presence of ABA and simultaneously supported the hypothesis that the suppressor gene in soa2 is a positive regulator of ABA signaling not only during seed germination but also during seedling development. The osmotic stress is able to induce ABA synthesis [67] and the level of synthetized ABA was not inhibitory for soa2 root elongation since it is resistant to ABA during root growth. It can also be assumed that this ABA concentration may stimulate soa2’s root growth in the presence of mild osmotic stress since it is known that low ABA concentrations stimulate root growth [68]. As was mentioned above, both suppressors displayed an insensitivity to high glucose concentrations during seed germination. Xing et al. [63] described a similar reaction of mkk1 (mitogen activated protein kinase kinase 1) and mpk6 (mitogen activated protein kinase 6) mutants. Both mutants were similar to soa2 and soa3 when other phenotypic traits were considered, thus MKK1 and MPK6 were chosen for candidate genes analysis. However, none of the suppressor mutants carried a mutation in the MKK1 and MPK6 genes. The attempt to identify a gene carrying the mutation responsible for the mutant phenotype using the candidate genes approach was successfully used in our previously published research [55]. In the case of soa2 and soa3, the candidate genes approach did not allow a suppressor gene to be identified and therefore the map-based cloning approach was used.
Suppression of abh1 by the mutations in soa2 and soa3 seemed to be limited to a narrow developmental window that includes germination and early seedling development. When the drought assay was performed, both suppressor mutants were found to be drought tolerant like abh1. Both abh1 and the suppressor mutants displayed the same phenotype of reduced stomata density when compared to the wild-type. It is worth noting that soa2 displayed the most reduced number of stomata per mm2 and this result was correlated with the highest relative water content in leaves and the slowest water loss in the soa2 among all of the studied genotypes. Together, these results clearly show a connection between the number of stomata and transpiration. It was demonstrated that a lower number of stomata correlates with an improved drought tolerance [69]. We can hypothesize that the ABA hypersensitivity of abh1 stomata [53] together with a reduced stomata density ensures a drought tolerant phenotype of abh1 and both suppressors.
To summarize, two suppressor mutants of abh1 hypersensitivity to ABA during seed germination were characterized in regards to their response to ABA and abiotic stresses during seed germination and young seedling development and to their drought response. All observed phenotypes suggest an important role of suppressor genes in ABA-dependent abiotic stress response during seed germination or seedling development. In this study the approach of suppressor screening enabled detailed characterization of forms that potentially carry mutations in important regulators of stress signaling pathways. The suppressor screening approach has been successfully used in identification of new components or to elucidate the role of already known components of many signaling pathways as previously mentioned here. Recently, Fernández-Arbaizar et al. [70] reported a similar study using the suppressor screening of the jasmonate (JA)-insensitive coronatine insensitive 1-16 (coi1-16) mutant and its ABA-hypersensitive phenotype during seed germination. They characterized the phenotype of several suppressor mutants in regards to abiotic stresses during seed germination, showing that the suppressor mutant screening can be successfully applied in the elucidation of the signaling pathway. Another example is the previously published soa1 mutant carrying mutations in the ABH1 and ABI4 genes [55].

4. Experimental Section

4.1. Plant Material and Growth Conditions

The plant material used in this study included: insertional mutant abh1 (ABA hypersensitive 1; accession Columbia-0; [40]). Col-0 used as a wild-type control, soa2 and soa3 (suppressor of abh1 hypersensitivity to ABA 2 and suppressor of abh1 hypersensitivity to ABA 3). Suppressor mutants, soa2 and soa3, were obtained after the chemical mutagenesis of abh1 with ethyl methanesulphonate (EMS) as was described previously [55]. The same procedure of plant cultivation was applied throughout all of the experiments. First, seeds were sterilized with chlorine gas in a dessicator jar [71]. Seeds were then plated onto 0.25× Murashige-Skoog salts supplemented with 1% sucrose and solidified with 0.8% agar in the experiments where ABA was applied, or 0.5 × MS in the experiments without ABA. After 3 days at 4 °C in the dark, plates were placed in a growth chamber at 22 °C with a 16-h-light/8-h-dark cycle, 40 μmol m-2 sec-1 illumination. Four days after stratification, plantlets were transferred to Jiffy pots (Jiffy 7 Peat Pellet 42 mm, Jiffy 7C®, Winchester, England) and grown in a growth chamber until maturity under the conditions described above.

4.2. Genetic Analysis

The soa2 and soa3 suppressor mutants were tested for the presence of a T-DNA insertion within the ABH1 gene using the BASTA resistance assay and PCR with specific primers to amplify the fragment containing the ABH1 gene and T-DNA insertion. The suppressor mutants were resistant to BASTA, similar to the abh1 mutant, whereas Col-0 did not survive the treatment. PCR amplification confirmed the presence of an insert within the CBP80 (ABH1) gene in the soa2 and soa3 mutants. An analysis led to the conclusion that the suppressor mutation is extragenic to the CBP80 (ABH1). The suppressor mutants displayed serrated leaves, similar to the leaves of the parental line abh1. An analysis of the F2 generation of a cross between abh1 and Col-0 showed that leaf serration was related to the presence of a T-DNA insert within the CBP80 (ABH1) gene [55].
In order to establish the mode of the inheritance of the suppressor gene, the soa2 and soa3 mutants were crossed with their parental line—abh1. Seeds of the F1 and F2 generations were screened on a medium containing 0.4 μM ABA for the selection of ABA insensitive (at the level of Col-0) and ABA hypersensitive forms according to the procedure described above.
The allelism test was performed in order to check whether the suppressor mutations were allelic or not. Seeds of F1 and F2 generations of the cross soa2 × soa3 and soa3 × soa2 were screened on a medium containing 0.4 μM ABA in the same manner as described above.

4.3. DNA Extraction

DNA was extracted from Arabidopsis rosette leaves using a modified C-TAB protocol [72]. Concentration and purity (A260/A280 ratio) were measured with a NanoDrop ND-1000™ spectrophotometer (ThermoScientific, Wilmington, NC, USA).

4.4. Seed Germination and Cotyledon Greening Assays

For each comparison, seeds of all genotypes were planted in the same plate containing an MS medium (0.25 × MS salts, 1% sucrose and 0.8% agar) with or without different concentrations of ABA (0.4; 0.6; 0.8; 1; 3) or other stress factors, such as NaCl (50; 150 and 200 mM), mannitol (100; 200; 300 mM) or glucose (4%; 6% and 4% with addition of 0.1 μM ABA). For each experiment, three biological replicates were performed, each with three technical replicates. Experiments carried out at different times and on seeds of different plants of the same genotype were considered to be biological replicates. Three independent plates in each biological replicate were considered to be technical replicates. Seeds used for these experiments were harvested and stored at the same time. Plates were chilled at 4 °C in the dark for 3 days (stratified) and moved to 22 °C with a 16-h-light/8-h-dark cycle. The percentage of seed germination was scored on the 4th day after the end of stratification. Germination was defined as the visible emergence of the radicle through the seed coat. Cotyledon greening was recorded on the 7th–10th day after the end of stratification, depending on the experiment. Cotyledon greening was defined as visible expansion and turning green of the cotyledon. The analyses were performed using a Stemi 2000-C stereoscopic microscope (Carl Zeiss, Vienna, Austria) with an attached camera (Canon, ōita, Japan). In order to document the results, AxioVision LE software (Carl Zeiss, Vienna, Austria) [73] was used. The average number of seeds analyzed in one biological replicate was 100–200.

4.5. Abiotic Stresses during Early Seedling Development and the Mature Plant Stage

4.5.1. Root Elongation Assay in the Presence of ABA, Mannitol and NaCl

Six days after stratification, plantlets were transferred from the control medium (0.5 × MS) on the 0.5 × MS with 1% sucrose, 0.8% agar with or without ABA (1; 5; 10; 15 μM), NaCl (100; 200 mM) and mannitol (200; 400 mM). Plates were incubated vertically at 22 °C with a 16-h-light/8-h-dark cycle for 7 days. Then, photographs of seedlings and roots were taken. The analyses of root length were performed using ImageJ software (ScionImage) [74]. The average number of the seedlings of each genotype analyzed in one biological replicate was 70–100. Each experiment was replicated three times.

4.5.2. Drought Treatment, Relative Water Content and Water Loss Measurements

4.5.2.1. Drought Treatment

Drought treatment was applied to 3-week-old plants at the vegetative stage by withholding watering. The drought treatment lasted 26 days. Thereafter, plants were re-watered for 3 days and analysis was performed 24 h later. The drought assay was replicated three times (three biological replicates). Each experiment included 15 plants of each genotype. Chlorophyll fluorescence from leaf tissue was measured using a PocketPea Fluorometer (Hansatech®, Norfolk, England). The ratio of variable fluorescence to maximal fluorescence (Fv/Fm), representing the potential quantum yield of PSII photochemistry and PSII condition PI, were measured in dark-adapted leaf tissue. Leaves on intact plants were dark adapted at 22 °C for 20 min before each measurement. Five plants of each genotype were analyzed using PocketPea (Hansatech®, Norfolk, England) in two biological replicates.

4.5.2.2. Relative Water Content and Water Loss Measurements

Relative Water Content (RWC, %) was calculated as the average of measurements done every 20 min during a period of 220 min according to the formula: (FWDW)/(TWDW) × 100% (modified) [75]. Fresh Weight (FW) was obtained by harvesting and weighing freshly detached rosette leaves every 20 min. Turgid weight (TW) was obtained by putting detached rosette leaves into an eppendorf tube with de-ionized water for 16 h at room temperature, removing excess water by wiping with absorbent paper and weighing the plant material. Dry Weight (DW) was recorded after the 24 h incubation of rosette leaves at 75 °C in a dry oven.
Water Loss (WL, %) was expressed as the percentage of the initial fresh weight of detached rosette leaves. Detached, fully expanded leaves from 4-week-old plants were incubated under the same conditions and each sample (consisting of three individual leaves) was measured in the same way as in the RWC assay. These assays were replicated three times. Each biological replicate included 5 bulks of leaves at the same developmental stage of each genotype. Three leaves are understood to comprise a bulk.

4.6. Observation of Stomatal Density and Preparation of Stomata Impressions

Observations were carried out using a confocal laser scanning microscope (Olympus FV1000, 488 nm wave length; Olympus, Tokyo, Japan); seedlings were treated with propidium iodide (1 mg/1 mL) before these observations. For each genotype, 10 separate fields, 0.12 mm2 each, of 5 leaves were observed using a 40× magnification and 10 separate fields, 0.4259 mm2 each, of 5 leaves were observed using a 20× magnification.

4.7. Chlorophyll and Carotenoids Content

Chlorophyll was extracted by boiling about 300 mg of fresh weight seedlings in 96% ethanol for 10 min at 80 °C [76]. NanoDrop Spectrophotometry (ThermoScientific, Wilmington, NC, USA) was used in the UV/VIS mode to measure the value of absorbance at 664 nm, 648.6 nm and 470 nm. Chlorophyll concentration per fresh weight was calculated as described by Lichtenthaler and Buschman [77].

4.8. Candidate Genes Approach

Based on the phenotype and physiological reactions of the soa2 and soa3 mutants to the applied stressors during germination, the candidate genes which might carry the suppressor mutation were proposed. Seven genes were chosen as candidates for sequencing and sequence analysis: ABI3, ABI5, MYB33, MYB101, MKK1, MPK6 and AREB1. Primers were designed with Jellyfish software [78]. The primers are listed in Supplementary Table S1. The PCR profile was as follows: 94 °C-5 min; 94 °C-45 s; 60 °C-30 s, 72 °C-45 s (30 cycles) and 72 °C-5 min. PCR products were sequenced (Genomed, Warsaw, Poland) and then analyzed with a CodonCode Aligner [62].

4.9. Preparation of Mapping Populations

Both suppressor mutants were derived from the same ecotype—Columbia-0. In order to create a mapping population as a F2 progeny of the cross between the suppressor mutant and its parental line abh1, it was necessary to change the genetic background of one of them. abh1 was backcrossed four times with Landsberg erecta (Ler) and then crossed with each of suppressor mutants. In the case of soa2, the creation of the mapping population is still in progress, whereas in the case of soa3, a rough mapping process has already been performed. SSLP markers were used and 30 F2 individuals displaying the suppressor mutant phenotype were screened in the rough mapping. Twenty-two markers were analyzed, an average 5 per one chromosome (markers used in this study were published in [79], http://carnegiedpb.stanford.edu/methods/ppsuppl.html).

5. Conclusions

The main objective of the presented study was to characterize the phenotypic similarities and differences between abh1 and its suppressor mutants under a wide range of abiotic stresses. On the basis of a detailed characterization of suppressor mutants, an attempt was undertaken to identify the suppressor mutations that led to ABA insensitivity during germination. The performed physiological analyses allowed several candidates to be selected as possible suppressor genes; however, it turned out that none of them carried the mutation that was responsible for the suppressor phenotype. Rough mapping was performed for the soa3 mutant with the result showing a linkage to two markers on the long arm of chromosome 3. Further analysis will be conducted in order to identify the suppressor genes and to confirm their impact on the suppressors’ phenotype. Identification of suppressor genes will also allow a mode of interaction between them and CBP80 (ABH1) to be established.

Supplementary Information

ijms-14-13403-s001.pdf

Acknowledgments

This work was supported by the Ministry of Science and Higher Education, Poland [N N301508938].

Conflict of Interest

The authors declare no conflict of interest.

References

  1. Daszkowska-Golec, A. Arabidopsis seed germination under abiotic stress as a concert of action of phytohormones. Omics 2011, 15, 763–774. [Google Scholar]
  2. Finkelstein, R.R. The role of hormones during seed development and germination. In Plant Hormones—Biosynthesis, Signal Transduction, Action; Davies, P.J., Ed.; Kluwer Academic: Dordrecht, The Netherlands, 2004; pp. 513–537. [Google Scholar]
  3. Finch-Savage, W.E.; Leubner-Metzger, G. Seed dormancy and the control of germination. New Phytol 2006, 171, 501–523. [Google Scholar]
  4. Hilhorst, H.W.M. Definition and hypotheses of seed dormancy. In Seed Development, Dormancy and Germination. Annual Plant Reviews; Bradford, K.J., Nonogaki, H., Eds.; Blackwell Publishing: Sheffield, UK, 2007; Volume 27, pp. 50–71. [Google Scholar]
  5. Finkelstein, R.R. Mutations at two new Arabidopsis ABA response loci are similar to the abi3 mutations. Plant J 1994, 5, 765–771. [Google Scholar]
  6. Meyer, K.; Leube, M.P.; Grill, E. A protein phosphatase 2c involved in aba signal transduction in arabidopsis thaliana. Science 1994, 264, 1452–1455. [Google Scholar]
  7. Carrera, E.; Prat, S. Expression of the arabidopsis abi1-1 mutant allele inhibits proteinase inhibitor wound-induction in tomato. Plant J 1998, 15, 765–771. [Google Scholar]
  8. North, H.; Baud, S.; Debeaujon, I.; Dubos, C.; Dubreucq, B.; Grappin, P.; Jullien, M.; Lepiniec, L.; Marion-Poll, A.; Miquel, M.; et al. Arabidopsis seed secrets unravelled after a decade of genetic and omics-driven research. Plant J 2010, 61, 971–981. [Google Scholar] [Green Version]
  9. Okamoto, M.; Tatematsu, K.; Matsui, A.; Morosawa, T.; Ishida, J.; Tanaka, M.; Endo, T.A.; Mochizuki, Y.; Toyoda, T.; Kamiya, Y.; et al. Genome-wide analysis of endogenous abscisic acid-mediated transcription in dry and imbibed seeds of arabidopsis using tiling arrays. Plant J 2010, 62, 39–51. [Google Scholar]
  10. Nakabayashi, K.; Okamoto, M.; Koshiba, T.; Kamiya, Y.; Nambara, E. Genome-wide profiling of stored mrna in arabidopsis thaliana seed germination: Epigenetic and genetic regulation of transcription in seed. Plant J 2005, 41, 697–709. [Google Scholar]
  11. Okamoto, M.; Kuwahara, A.; Seo, M.; Kushiro, T.; Asami, T.; Hirai, N.; Kamiya, Y.; Koshiba, T.; Nambara, E. Cyp707a1 and cyp707a2, which encode abscisic acid 8′-hydroxylases, are indispensable for proper control of seed dormancy and germination in arabidopsis. Plant Physiol 2006, 141, 97–107. [Google Scholar]
  12. Ma, Y.; Szostkiewicz, I.; Korte, A.; Moes, D.; Yang, Y.; Christmann, A.; Grill, E. Regulators of pp2c phosphatase activity function as abscisic acid sensors. Science 2009, 324, 1064–1068. [Google Scholar]
  13. Nishimura, N.; Sarkeshik, A.; Nito, K.; Park, S.Y.; Wang, A.; Carvalho, P.C.; Lee, S.; Caddell, D.F.; Cutler, S.R.; Chory, J.; et al. Pyr/pyl/rcar family members are major in-vivo abi1 protein phosphatase 2c-interacting proteins in arabidopsis. Plant J 2010, 61, 290–299. [Google Scholar]
  14. Park, S.Y.; Fung, P.; Nishimura, N.; Jensen, D.R.; Fujii, H.; Zhao, Y.; Lumba, S.; Santiago, J.; Rodrigues, A.; Chow, T.F.; et al. Abscisic acid inhibits type 2c protein phosphatases via the pyr/pyl family of start proteins. Science 2009, 324, 1068–1071. [Google Scholar]
  15. Santiago, J.; Dupeux, F.; Round, A.; Antoni, R.; Park, S.Y.; Jamin, M.; Cutler, S.R.; Rodriguez, P.L.; Marquez, J.A. The abscisic acid receptor pyr1 in complex with abscisic acid. Nature 2009, 462, 665–668. [Google Scholar]
  16. Fujii, H.; Chinnusamy, V.; Rodrigues, A.; Rubio, S.; Antoni, R.; Park, S.Y.; Cutler, S.R.; Sheen, J.; Rodriguez, P.L.; Zhu, J.K. In vitro reconstitution of an abscisic acid signalling pathway. Nature 2009, 462, 660–664. [Google Scholar]
  17. Melcher, K.; Ng, L.M.; Zhou, X.E.; Soon, F.F.; Xu, Y.; Suino-Powell, K.M.; Park, S.Y.; Weiner, J.J.; Fujii, H.; Chinnusamy, V.; et al. A gate-latch-lock mechanism for hormone signalling by abscisic acid receptors. Nature 2009, 462, 602–608. [Google Scholar]
  18. Yin, P.; Fan, H.; Hao, Q.; Yuan, X.; Wu, D.; Pang, Y.; Yan, C.; Li, W.; Wang, J.; Yan, N. Structural insights into the mechanism of abscisic acid signalling by PYL proteins. Nature Struct. Mol. Biol 2009, 16, 1230–1236. [Google Scholar]
  19. Fujii, H.; Verslues, P.E.; Zhu, J.K. Identification of two protein kinases required for abscisic acid regulation of seed germination, root growth, and gene expression in arabidopsis. Plant Cell 2007, 19, 485–494. [Google Scholar]
  20. Nakashima, K.; Fujita, Y.; Kanamori, N.; Katagiri, T.; Umezawa, T.; Kidokoro, S.; Maruyama, K.; Yoshida, T.; Ishiyama, K.; Kobayashi, M.; et al. Three arabidopsis snrk2 protein kinases, srk2d/snrk2.2, srk2e/snrk2.6/ost1 and srk2i/snrk2.3, involved in aba signaling are essential for the control of seed development and dormancy. Plant Cell Physiol 2009, 50, 1345–1363. [Google Scholar]
  21. Wasilewska, A.; Vlad, F.; Sirichandra, C.; Redko, Y.; Jammes, F.; Valon, C.; Frei dit Frey, N.; Leung, J. An update on abscisic acid signaling in plants and more. Mol. Plant 2008, 1, 198–217. [Google Scholar]
  22. Finkelstein, R.R.; Lynch, T.J. The arabidopsis abscisic acid response gene abi5 encodes a basic leucine zipper transcription factor. Plant Cell 2000, 12, 599–609. [Google Scholar]
  23. Finkelstein, R.R.; Wang, M.L.; Lynch, T.J.; Rao, S.; Goodman, H.M. The arabidopsis abscisic acid response locus abi4 encodes an apetala 2 domain protein. Plant Cell 1998, 10, 1043–1054. [Google Scholar]
  24. Giraudat, J.; Hauge, B.M.; Valon, C.; Smalle, J.; Parcy, F.; Goodman, H.M. Isolation of the arabidopsis abi3 gene by positional cloning. Plant Cell 1992, 4, 1251–1261. [Google Scholar]
  25. Lopez-Molina, L.; Mongrand, S.; McLachlin, D.T.; Chait, B.T.; Chua, N.H. Abi5 acts downstream of abi3 to execute an aba-dependent growth arrest during germination. Plant J 2002, 32, 317–328. [Google Scholar]
  26. Arenas-Huertero, F.; Arroyo, A.; Zhou, L.; Sheen, J.; Leon, P. Analysis of Arabidopsis glucose insensitive mutants, gin5 and gin6, reveals a central role of the plant hormone aba in the regulation of plant vegetative development by sugar. Genes Dev 2000, 14, 2085–2096. [Google Scholar]
  27. Brocard, I.M.; Lynch, T.J.; Finkelstein, R.R. Regulation and role of the arabidopsis abscisic acid-insensitive 5 gene in abscisic acid, sugar, and stress response. Plant Physiol 2002, 129, 1533–1543. [Google Scholar]
  28. Laby, R.J.; Kincaid, M.S.; Kim, D.; Gibson, S.I. The arabidopsis sugar-insensitive mutants sis4 and sis5 are defective in abscisic acid synthesis and response. Plant J 2000, 23, 587–596. [Google Scholar]
  29. Quesada, V.; Garcia-Martinez, S.; Piqueras, P.; Ponce, M.R.; Micol, J.L. Genetic architecture of NaCl tolerance in arabidopsis. Plant Physiol 2002, 130, 951–963. [Google Scholar]
  30. Koornneef, M.; Reuling, G.; Karssen, C.M. The isolation and characterization of abscisic acid–insensitive mutants of Arabidopsis thaliana. Physiol. Plant 1984, 61, 377–383. [Google Scholar]
  31. Leung, J.; Merlot, S.; Giraudat, J. The arabidopsis abscisic acid-insensitive2 (abi2) and abi1 genes encode homologous protein phosphatases 2c involved in abscisic acid signal transduction. Plant Cell 1997, 9, 759–771. [Google Scholar]
  32. Gosti, F.; Beaudoin, N.; Serizet, C.; Webb, A.A.; Vartanian, N.; Giraudat, J. Abi1 protein phosphatase 2c is a negative regulator of abscisic acid signaling. Plant Cell 1999, 11, 1897–1910. [Google Scholar]
  33. Yano, R.; Kanno, Y.; Jikumaru, Y.; Nakabayashi, K.; Kamiya, Y.; Nambara, E. Chotto1, a putative double apetala2 repeat transcription factor, is involved in abscisic acid-mediated repression of gibberellin biosynthesis during seed germination in arabidopsis. Plant Physiol 2009, 151, 641–654. [Google Scholar]
  34. Bu, Q.; Li, H.; Zhao, Q.; Jiang, H.; Zhai, Q.; Zhang, J.; Wu, X.; Sun, J.; Xie, Q.; Wang, D.; et al. The arabidopsis ring finger e3 ligase rha2a is a novel positive regulator of abscisic acid signaling during seed germination and early seedling development. Plant Physiol 2009, 150, 463–481. [Google Scholar]
  35. Ryu, M.Y.; Cho, S.K.; Kim, W.T. The arabidopsis c3h2c3-type ring e3 ubiquitin ligase atairp1 is a positive regulator of an abscisic acid-dependent response to drought stress. Plant Physiol 2010, 154, 1983–1997. [Google Scholar]
  36. Yoshida, T.; Nishimura, N.; Kitahata, N.; Kuromori, T.; Ito, T.; Asami, T.; Shinozaki, K.; Hirayama, T. Aba-hypersensitive germination3 encodes a protein phosphatase 2c (atpp2ca) that strongly regulates abscisic acid signaling during germination among arabidopsis protein phosphatase 2cs. Plant Physiol 2006, 140, 115–126. [Google Scholar]
  37. Nishimura, N.; Okamoto, M.; Narusaka, M.; Yasuda, M.; Nakashita, H.; Shinozaki, K.; Narusaka, Y.; Hirayama, T. Aba hypersensitive germination2-1 causes the activation of both abscisic acid and salicylic acid responses in arabidopsis. Plant Cell Physiol 2009, 50, 2112–2122. [Google Scholar]
  38. Xiong, L.; Gong, Z.; Rock, C.D.; Subramanian, S.; Guo, Y.; Xu, W.; Galbraith, D.; Zhu, J.K. Modulation of abscisic acid signal transduction and biosynthesis by an sm-like protein in arabidopsis. Dev. Cell 2001, 1, 771–781. [Google Scholar]
  39. Lu, C.; Fedoroff, N. A mutation in the arabidopsis hyl1 gene encoding a dsrna binding protein affects responses to abscisic acid, auxin, and cytokinin. Plant Cell 2000, 12, 2351–2366. [Google Scholar]
  40. Hugouvieux, V.; Kwak, J.M.; Schroeder, J.I. An mRNA cap binding protein, abh1, modulates early abscisic acid signal transduction in arabidopsis. Cell 2001, 106, 477–487. [Google Scholar]
  41. Belkhadir, Y.; Durbak, A.; Wierzba, M.; Schmitz, R.J.; Aguirre, A.; Michel, R.; Rowe, S.; Fujioka, S.; Tax, F.E. Intragenic suppression of a trafficking-defective brassinosteroid receptor mutant in Arabidopsis. Genetics 2010, 185, 1283–1296. [Google Scholar]
  42. Nie, H.; Wu, Y.; Yao, C.; Tang, D. Suppression of edr2-mediated powdery mildew resistance, cell death and ethylene-induced senescence by mutations in ald1 in arabidopsis. J. Genet. Genomics 2011, 38, 137–148. [Google Scholar]
  43. Vogel, F.; Hofius, D.; Paulus, K.E.; Jungkunz, I.; Sonnewald, U. The second face of a known player: Arabidopsis silencing suppressor atxrn4 acts organ-specifically. New Phytol 2011, 189, 484–493. [Google Scholar]
  44. Yu, F.; Liu, X.; Alsheikh, M.; Park, S.; Rodermel, S. Mutations in suppressor of variegation1, a factor required for normal chloroplast translation, suppress var2-mediated leaf variegation in arabidopsis. Plant Cell 2008, 20, 1786–1804. [Google Scholar]
  45. Strader, L.C.; Monroe-Augustus, M.; Rogers, K.C.; Lin, G.L.; Bartel, B. Arabidopsis iba response5 suppressors separate responses to various hormones. Genetics 2008, 180, 2019–2031. [Google Scholar]
  46. Yamamoto, Y.; Hirai, T.; Yamamoto, E.; Kawamura, M.; Sato, T.; Kitano, H.; Matsuoka, M.; Ueguchi-Tanaka, M. A rice gid1 suppressor mutant reveals that gibberellin is not always required for interaction between its receptor, gid1, and della proteins. Plant Cell 2010, 22, 3589–3602. [Google Scholar]
  47. Parry, G.; Ward, S.; Cernac, A.; Dharmasiri, S.; Estelle, M. The arabidopsis suppressor of auxin resistance proteins are nucleoporins with an important role in hormone signaling and development. Plant Cell 2006, 18, 1590–1603. [Google Scholar]
  48. Sugliani, M.; Brambilla, V.; Clerkx, E.J.; Koornneef, M.; Soppe, W.J. The conserved splicing factor sua controls alternative splicing of the developmental regulator abi3 in arabidopsis. Plant Cell 2010, 22, 1936–1946. [Google Scholar]
  49. Baek, D.; Pathange, P.; Chung, J.S.; Jiang, J.; Gao, L.; Oikawa, A.; Hirai, M.Y.; Saito, K.; Pare, P.W.; Shi, H. A stress-inducible sulphotransferase sulphonates salicylic acid and confers pathogen resistance in arabidopsis. Plant Cell Environ 2010, 33, 1383–1392. [Google Scholar]
  50. Barkan, L.; Vijayan, P.; Carlsson, A.S.; Mekhedov, S.; Browse, J. A suppressor of fab1 challenges hypotheses on the role of thylakoid unsaturation in photosynthetic function. Plant Physiol 2006, 141, 1012–1020. [Google Scholar]
  51. Krishnakumar, S.; Oppenheimer, D.G. Extragenic suppressors of the arabidopsis zwi-3 mutation identify new genes that function in trichome branch formation and pollen tube growth. Development 1999, 126, 3079–3088. [Google Scholar]
  52. Brady, S.M.; Sarkar, S.F.; Bonetta, D.; McCourt, P. The abscisic acid insensitive 3 (abi3) gene is modulated by farnesylation and is involved in auxin signaling and lateral root development in arabidopsis. Plant J 2003, 34, 67–75. [Google Scholar]
  53. Hugouvieux, V.; Murata, Y.; Young, J.J.; Kwak, J.M.; Mackesy, D.Z.; Schroeder, J.I. Localization, ion channel regulation, and genetic interactions during abscisic acid signaling of the nuclear mRNA cap-binding protein, ABH1. Plant Physiol 2002, 130, 1276–1287. [Google Scholar]
  54. Pieczynski, M.; Marczewski, W.; Hennig, J.; Dolata, J.; Bielewicz, D.; Piontek, P.; Wyrzykowska, A.; Krusiewicz, D.; Strzelczyk-Zyta, D.; Konopka-Postupolska, D.; et al. Down-regulation of CBP80 gene expression as a strategy to engineer a drought-tolerant potato. Plant Biotechnol. J. 2012. [Google Scholar] [CrossRef]
  55. Daszkowska-Golec, A.; Wojnar, W.; Rosikiewicz, M.; Szarejko, I.; Maluszynski, M.; Szweykowska-Kulinska, Z.; Jarmolowski, A. Arabidopsis suppressor mutant of abh1 shows a new face of the already known players: Abh1 (cbp80) and abi4-in response to aba and abiotic stresses during seed germination. Plant Mol. Boil 2013, 81, 189–209. [Google Scholar]
  56. Kuhn, J.M.; Breton, G.; Schroeder, J.I. mRNA metabolism of flowering-time regulators in wild-type Arabidopsis revealed by a nuclear cap binding protein mutant, abh1. Plant J 2007, 50, 1049–1062. [Google Scholar]
  57. Laubinger, S.; Sachsenberg, T.; Zeller, G.; Busch, W.; Lohmann, J.U.; Ra, G. Dual roles of the nuclear cap-binding complex and SERRATE in pre-mRNA splicing and microRNA processing in Arabidopsis thaliana. Proc. Natl. Acad. Sci 2008, 105, 8795–8800. [Google Scholar]
  58. Kim, S.; Yang, J.Y.; Xu, J.; Jang, I.C.; Prigge, M.J.; Chua, N.H. Two cap-binding proteins cbp20 and cbp80 are involved in processing primary micrornas. Plant Cell Physiol 2008, 49, 1634–1644. [Google Scholar]
  59. Szarzynska, B.; Sobkowiak, L.; Pant, B.D.; Balazadeh, S.; Scheible, W.R.; Mueller-Roeber, B.; Jarmolowski, A.; Szweykowska-Kulinska, Z. Gene structures and processing of Arabidopsis thaliana HYL1-dependent pri-miRNAs. Nucleic Acids Res 2009, 37, 3083–3093. [Google Scholar]
  60. Reyes, J.L.; Chua, N.H. Aba induction of mir159 controls transcript levels of two myb factors during arabidopsis seed germination. Plant J 2007, 49, 592–606. [Google Scholar]
  61. Sawczak, M.; Daszkowska, A.; Szweykowska-Kulińska, Z.; Szarejko, I.; Jarmolowski, A. Analysis of Arabidopsis thaliana mutants that suppress hypersensitivity to abscisic acid caused by disruption of the gene encoding CBP80. Proceedings of the International Congress of Genetics, Berlin, Germany, 12–17 July 2008.
  62. CodonCode Aligner, version 4.2.1. Available online: http://www.codoncode.com (on accessed 26 January 2011).
  63. Xing, Y.; Jia, W.; Zhang, J. Atmkk1 and atmpk6 are involved in abscisic acid and sugar signaling in arabidopsis seed germination. Plant Mol. Biol 2009, 70, 725–736. [Google Scholar]
  64. Ghassemian, M.; Nambara, E.; Cutler, S.; Kawaide, H.; Kamiya, Y.; McCourt, P. Regulation of abscisic acid signaling by the ethylene response pathway in arabidopsis. Plant Cell 2000, 12, 1117–1126. [Google Scholar]
  65. Beaudoin, N.; Serizet, C.; Gosti, F.; Giraudat, J. Interactions between abscisic acid and ethylene signaling cascades. Plant Cell 2000, 12, 1103–1115. [Google Scholar]
  66. Linkies, A.; Müller, K.; Morris, K.; Turecková, V.; Wenk, M.; Cadman, C.S.; Corbineau, F.; Strnad, M.; Lynn, J.R.; Finch-Savage, W.E.; et al. Ethylene interacts with abscisic acid to regulate endosperm rupture during germination: A comparative approach using Lepidium sativum and Arabidopsis thaliana. Plant Cell 2009, 12, 3803–3822. [Google Scholar]
  67. Tian, L.; DellaPenna, D.; Zeevaart, J.A.D. Effects of hydroxylated carotenoid deficiency on ABA accumulation in Arabidopsis. Physiol. Plant 2004, 122, 314–320. [Google Scholar]
  68. Zeevaart, J.A.D.; Creelman, R.A. Metabolism and physiology of abscisic acid. Annu. Rev. Plant Physiol. Plant Mol. Biol 1988, 39, 439–473. [Google Scholar]
  69. Yang, J.; Isabel Ordiz, M.; Jaworski, J.G.; Beachy, R.N. Induced accumulation of cuticular waxes enhances drought tolerance in arabidopsis by changes in development of stomata. Plant Physiol. Biochem 2011, 49, 1448–1455. [Google Scholar]
  70. Fernández-Arbaizar, A.; Regalado, J.J.; Lorenzo, O. Isolation and characterization of novel mutant loci suppressing the ABA hypersensitivity of the Arabidopsis coronatine insensitive 1–16 (coi1-16) mutant during germination and seedling growth. Plant Cell Physiol 2012, 53, 53–63. [Google Scholar]
  71. Clough, S.J.; Bent, A.F. Floral dip: A simplified method for agrobacterium-mediated transformation of arabidopsis thaliana. Plant J 1998, 16, 735–743. [Google Scholar]
  72. Doyle, J.J.; Doyle, J.L. A rapid DNA isolation procedure for small quantities of fresh leaf tissue. Phytochem. Bull 1987, 19, 11–15. [Google Scholar]
  73. Microscopes, Software and Imaging Solutions from Cark Zeiss. Available online: http://microscopy.zeiss.com/microscopy/en_us/products/microscope-software/axiovision-for-biology.html (on accessed 15 February 2011).
  74. Schneider, C.A.; Rasband, W.S.; Eliceiri, K.W. NIH Image to ImageJ: 25 years of image analysis. Nature Methods 2012, 9, 671–675. [Google Scholar]
  75. Gonzalez, L.; Gonzalez-Vilar, M. Determination of relative water content. In Handbook of Plant Ecophysiology Techniques; Roger, M.J.R., Ed.; Springer: Dordrecht, The Netherlands, 2001; pp. 207–212. [Google Scholar]
  76. Wintermans, J.F.; de Mots, A. Spectrophotometric characteristics of chlorophylls a and b and their pheophytins in ethanol. Biochim. Biophys. Acta 1965, 109, 448–453. [Google Scholar]
  77. Lichtenthaler, H.K.; Buschman, C. Chlorophylls and carotenoids: Measurement and characterization by UV-vis spectroscopy. In Current Protocols in Food Analytical Chemistry; Chanda, V., Ed.; Wiley: New York, NY, USA, 2001. [Google Scholar]
  78. Jellyfish Software, version 3.3.1. Available online: http://www.jellyfishsoftware.com (on accessed 17 March 2011).
  79. Lukowitz, W.; Gillmor, C.S.; Scheible, W.R. Positional cloning in Arabidopsis: why it feels good to have a genome initiative working for you. Plant Physiol 2000, 123, 795–805. [Google Scholar]
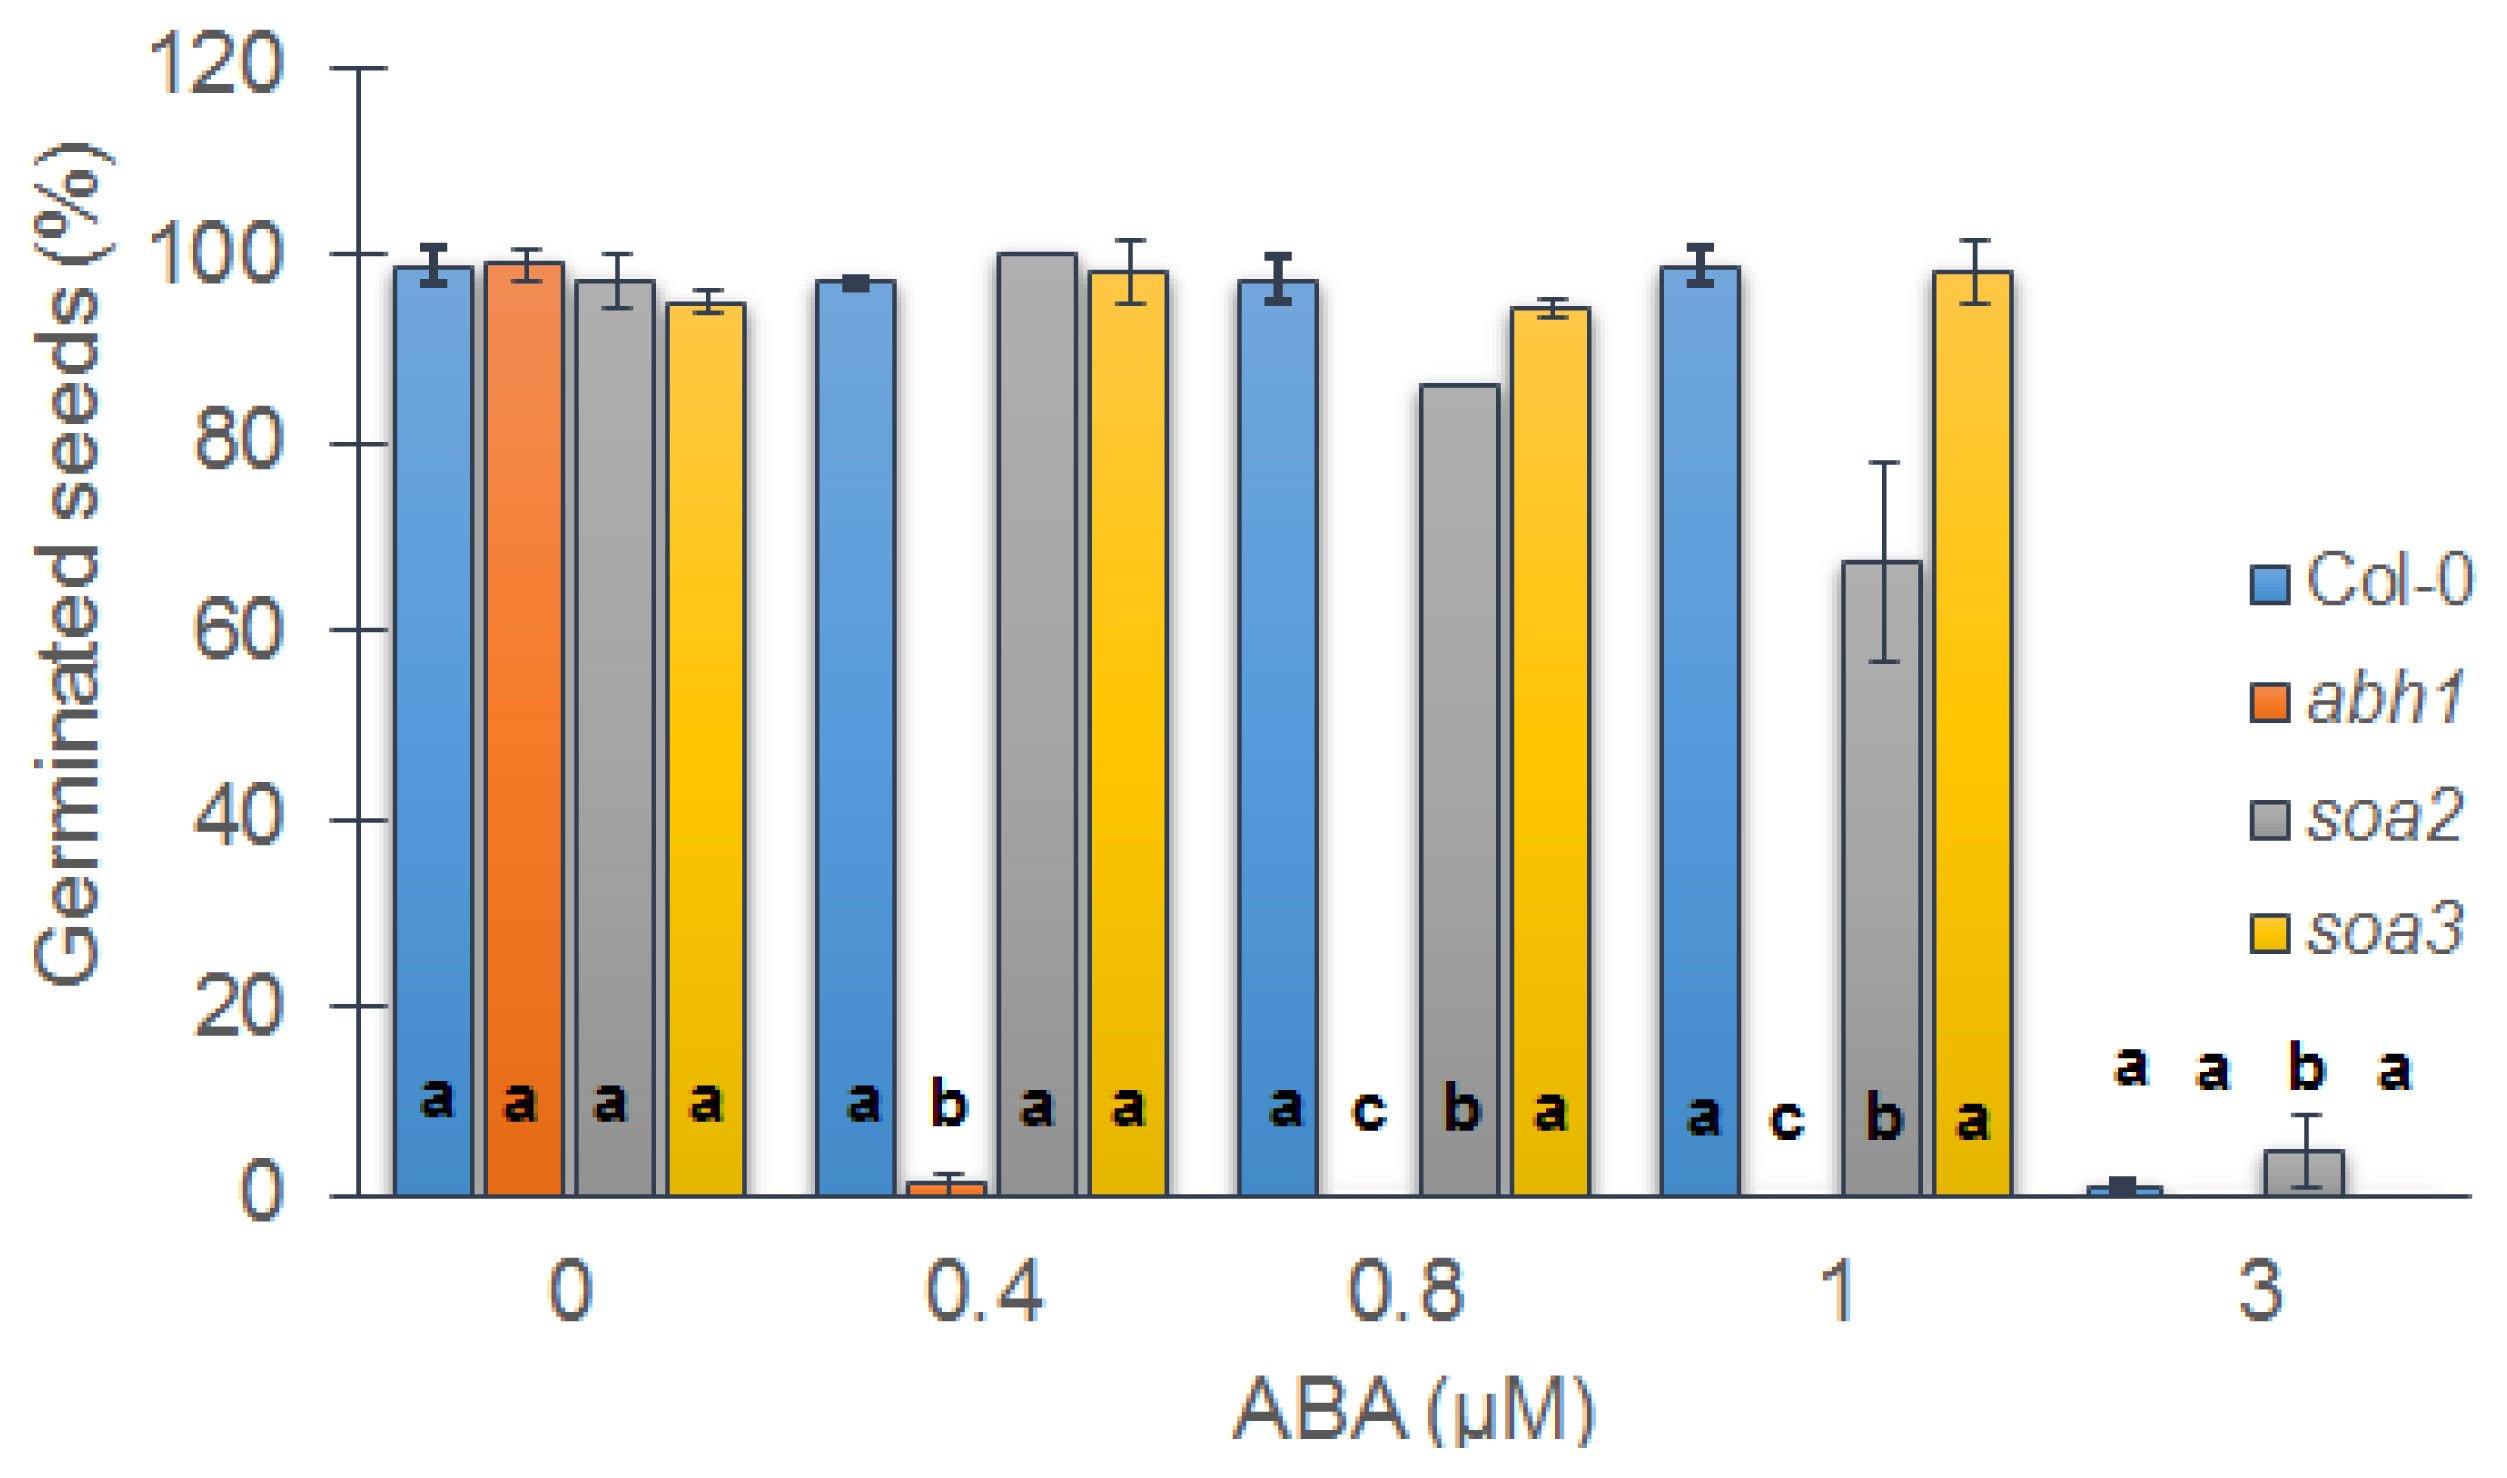
Figure 1. Response of Col-0, abh1, soa2 and soa3 to different ABA concentrations during seed germination. Values represent the mean ± SD of three biological replicates; 100–200 seeds of each genotype were analyzed in each. For each concentration means followed by the same letter do not differ significantly according to Fisher’s projected LSD (p ≤ 0.05).
Ijms 14 13403f1
Figure 2. Relative root growth in the presence of different ABA concentrations. Values represent the mean ± SD of three biological replicates; 70–100 seedlings of each genotype were analyzed in each. (A) For each concentration, means followed by the same letter do not differ significantly according to Fisher’s projected LSD (p ≤ 0.05). Relative root growth is expressed as the % of root growth on the control medium; (B) Relative root growth in the presence of ACC. Values represent the mean ± SD of three biological replicates; 70–100 seedlings of each genotype were analyzed in each. For each concentration means followed by the same letter do not differ significantly according to Fisher’s projected LSD (p ≤ 0.05). Relative root growth is expressed as the % of root growth on the control medium.
Ijms 14 13403f2aIjms 14 13403f2b
Figure 3. Response of Col-0, abh1, soa2 and soa3 to different NaCl concentrations during seed germination (A) and early seedling development (B). (A) Values represent the mean ± SD of three biological replicates; 100–200 seeds of each genotype were analyzed in each. For each concentration, means followed by the same letter do not differ significantly according to Fisher’s projected LSD (p ≤ 0.05); (B) Relative root length of Col-0, abh1, soa2 and soa3 in the presence of different salt concentrations. Values represent the mean ± SD of three biological replicates; 70–100 seedlings of each genotype were analyzed in each. For each concentration, means followed by the same letter do not differ significantly according to Fisher’s projected LSD (p ≤ 0.05). Relative root growth is expressed as the % of root growth on the control medium.
Ijms 14 13403f3
Figure 4. Response of Col-0, abh1, soa2 and soa3 to different mannitol concentrations during seed germination. (A) Values represent the mean ± SD of three biological replicates; 100–200 seeds of each genotype were analyzed in each. For each concentration, means followed by the same letter do not differ significantly according to Fisher’s projected LSD (p ≤ 0.05); (B) Response of Col-0, abh1, soa2 and soa3 to different mannitol concentrations during seedling development—greening assay. Photographs were taken at 14th day of development; (C) Relative root length of Col-0, abh1, soa2 and soa3 in the presence of different mannitol concentrations. Values represent the mean ± SD of three biological replicates; 70–100 seedlings of each genotype were analyzed in each. For each concentration, means followed by the same letter do not differ significantly according to Fisher’s projected LSD (p ≤ 0.05). Relative root growth is expressed as the % of root growth on the control medium.
Ijms 14 13403f4aIjms 14 13403f4b
Figure 5. Response of Col-0, abh1, soa2 and soa3 to different glucose concentrations during seed germination. (A) Values represent the mean ± SD of three biological replicates; 100–200 seeds of each genotype were analyzed in each. For each concentration, means followed by the same letter do not differ significantly according to Fisher’s projected LSD (p ≤ 0.05); (B) Response of Col-0, abh1, soa2 and soa3 plants to different glucose concentrations during seedling development—greening assay. Photographs were taken at 14th day of development; (C) The chlorophyll ab content in Col-0, soa2 and soa3 in the presence of different glucose concentrations. Values represent the mean ± SD of three biological replicates; 100–200 seedlings of each genotype were analyzed in each. For each concentration means followed by the same letter do not differ significantly according to Fisher’s projected LSD (p ≤ 0.05).
Ijms 14 13403f5aIjms 14 13403f5b
Figure 6. Response of Col-0, abh1, soa2 and soa3 mature plants to drought. (A) Representative plants of Col-0, abh1, soa2 and soa3; (B) Fluorimetric measurements of Fv/Fm and (C) PI parameters on the 30th day of the assay. Values represent the mean ± SD of three biological replicates. For each genotype, means followed by the same letter do not differ significantly according to Fisher’s projected LSD (p ≤ 0.05).
Ijms 14 13403f6aIjms 14 13403f6b
Figure 7. Response of Col-0, abh1, soa2 and soa3 mature plants to drought. (A) Relative Water Content and (B) Water Loss measured over 200 min; (C) Values represent the mean of three biological replicates. Stomatal density in rosette leaves. Values represent the mean ± SD of at least five leaves per experiment. Means followed by the same letter do not differ significantly according to Fisher’s projected LSD (p ≤0.05); (D) Stomatal density in rosette leaves, bar = 50 μm.
Ijms 14 13403f7aIjms 14 13403f7b
Table 1. Genetic analysis of the inheritance mode of suppressor mutations (* p ≤ 0.05).
CrossGenerationThe number of analyzed seedsχ23:1
TotalCol-0 sensitivity to ABAabh1 hypersensitivity to ABA
soa2×abh1F123023-
F210572627950.025
soa3×abh1F115015-
F25121323800.163
Table 2. Allelism test between soa2 and soa3 mutants (*p ≤ 0.05).
The number of analyzed seedsχ211:5

CrossGenerationTotalCol-0 sensitivity to ABAabh1 hypersensitivity to ABA
soa2×soa3F12525--

F212068483581.2

soa3×soa2F155--

F211008942061.1
Table 3. Detailed description of genotypes and phenotypes in the cross soa2 × soa3. a—allele responsible for the ABA insensitivity of suppressor soa2; b—allele responsible for the ABA insensitivity of suppressor soa3; d—allele responsible for the ABA hypersensitivity of the mutant abh1.
soa2 × soa3

GenerationGenotypePhenotype of ABA sensitivityFrequency
Psoa2aaBBddinsensitive
soa3AAbbddinsensitive

F1AaBbddinsensitive

F2AABBddhypersensitive as abh11/16
AABbddhypersensitive as F1 from soa3 × abh12/16
AaBBddhypersensitive as F1 from soa2 × abh12/16
AaBbddinsensitive as F1 from soa2 × soa34/16
AAbbddinsensitive as soa31/16
Aabbddinsensitive2/16
aaBBddinsensitive as soa21/16
aaBbddinsensitive2/16
aabbddinsensitive1/16

The ratio of segregation of the ABA insensitive to ABA hypersensitive F2 progeny11:5
Table 4. Candidate genes chosen on the basis of soa2 and soa3 phenotype analysis.
GeneMutantKnown phenotype of mutantReferencePhenotype of soa2Phenotype of soa3
ABI3abi3ABA insensitive, reduced sensitivity to osmotic stress and glucose during seed germination[5]ABA insensitive, reduced sensitivity to osmotic stress and glucose during seed germinationABA insensitive, reduced sensitivity to osmotic stress and glucose during seed germination
ABI5abi5ABA insensitive, reduced sensitivity to osmotic and salt stress and glucose during seed germination[5]ABA insensitive, reduced sensitivity to osmotic stress and glucose during seed germinationABA insensitive, reduced sensitivity to osmotic stress and glucose during seed germination
MYB33myb33Insensitive to 1 μM ABA during seed germination[60]Insensitive to 1 μM ABA during seed germinationInsensitive to 1 μM ABA during seed germination
MYB101myb101Insensitive to 1 μM ABA during seed germination[60]Insensitive to 1 μM ABA during seed germinationInsensitive to 1 μM ABA during seed germination
MKK1mkk1Insensitive to ABA and glucose during seed germination[63]Insensitive to ABA and glucose during seed germinationInsensitive to ABA and glucose during seed germination
35S:mkk1Hypersensitive to ABA and glucose during seed germination
MPK6mpk6Insensitive to glucose during seed germination[63]Insensitive to glucose during seed germinationInsensitive to glucose during seed germination
35S: mpk6Hypersensitive to glucose during seed germination
AREB1areb1Insensitive to glucose during seed germination and drought tolerant[36]Insensitive to glucose during seed germination and drought tolerantInsensitive to glucose during seed germination and drought tolerant
35S:areb1Hypersensitive to ABA
Table 5. Genetic analysis of the inheritance mode of suppressor mutations based on their crosses with abh1 [Ler] (p ≤ 0.05).
CrossGenerationThe number of analyzed seedsχ23:1
TotalCol-0 sensitivity to ABAabh1 hypersensitivity to ABA
soa3×abh1[Ler]F120-20
F210792957843,15