Towards Global QSAR Model Building for Acute Toxicity: Munro Database Case Study

 , and
, and
Abstract
:1. Introduction
2. Material and Methods

| Sr. | Descriptor Type | No. of Descriptors |
|---|---|---|
| 1 | Constitutional indices | 43 |
| 2 | Topological indices | 75 |
| 3 | Connectivity indices | 37 |
| 4 | 2D matrix based descriptors | 550 |
| 5 | ETA indices | 23 |
| 6 | Atom type E-state indices | 170 |
| 7 | 2D atom pairs | 1596 |
| 8 | Drug like indices | 27 |
| 9 | Ring descriptors | 32 |
| 10 | Walk and path counts | 46 |
| 11 | Information indices | 48 |
| 12 | 2D auto correlations | 213 |
| 13 | P-VSA like descriptors | 45 |
| 14 | Edge adjacency indices | 324 |
| 15 | CATS 2D | 150 |
| 16 | Atom-centered fragments | 115 |
| 17 | Molecular properties | 20 |
| 18 | Functional group counts | 154 |
| Total | All 18 types | 3668 |
2.1. Descriptor Filtering and Outlier Detection
2.2. Modelling Methods
2.2.1. Classification Scheme
- Class I: LD50 ≤ 300 mg/kg/day;
- Class II: 300 < LD50 ≤ 2000 mg/kg/day;
- Class III: LD50 > 2000 mg/kg/day;
2.2.2. k-Nearest Neighbors
2.2.3. Descriptor Selection by Means of Genetic Algorithms
2.3. Model Validation
| Class I | Class II | Class III | Total | |
|---|---|---|---|---|
| Training | 82 | 136 | 129 | 347 |
| Test | 21 | 35 | 33 | 89 |
| Total | 103 | 171 | 162 | 436 |
3. Results and Discussion
3.1. Genetic Algorithm
| Sr. | Name | Description | Type |
|---|---|---|---|
| 1 | MATS1e | Moran autocorrelation of lag 1 weighted by Sanderson electronegativity | 2D autocorrelations |
| 2 | SpMAD_B(s) | Spectral mean absolute deviation from Burden matrix weighted by I-State | 2D matrix-based descriptors |
| 3 | SpPosA_B(p) | Normalized spectral positive sum from Burden matrix weighted by polarizability | 2D matrix-based descriptors |
| 4 | MATS1v | Moran autocorrelation of lag 1 weighted by van der Waals volume | 2D autocorrelations |
| 5 | Mi | Mean first ionization potential (scaled on Carbon atom) | Constitutional indices |
| 6 | AAC | Mean information index on atomic composition | Information indices |
| 7 | SpMAD_B(m) | Spectral mean absolute deviation from Burden matrix weighted by mass | 2D matrix-based descriptors |
| 8 | GATS1p | Geary autocorrelation of lag 1 weighted by polarizability | 2D autocorrelations |
| 9 | C-026 | R--CX--R | Atom-centred fragments |
| 10 | SIC0 | Structural Information Content index (neighborhood symmetry of 0-order) | Information indices |
| 11 | nDB | Number of double bonds | Constitutional indices |
| 12 | SIC1 | Structural Information Content index (neighborhood symmetry of 1-order) | Information indices |
| 13 | ATS6e | Broto-Moreau autocorrelation of lag 6 (log function) weighted by Sanderson electronegativity | 2D autocorrelations |
| 14 | P_VSA_MR_3 | P_VSA-like on Molar Refractivity, bin 3 | P_VSA-like descriptors |
| 15 | DLS_02 | Modified drug-like score from Oprea et al., (6 rules) | Drug-like indices |
| 16 | nCL | Number of Chlorine atoms | Constitutional indices |
| 17 | J_Dz(Z) | Balaban-like index from Barysz matrix weighted by atomic number | 2D matrix-based descriptors |
| 18 | SM6_B(s) | Spectral moment of order 6 from Burden matrix weighted by I-State | 2D matrix-based descriptors |
| 19 | GATS1v | Geary autocorrelation of lag 1 weighted by van der Waals volume | 2D autocorrelations |
| 20 | JGI4 | Mean topological charge index of order 4 | 2D autocorrelations |
| 21 | P_VSA_i_4 | P_VSA-like on ionization potential, bin 4 | P_VSA-like descriptors |
| 22 | P-117 | X3-P = X (phosphate) | Atom-centred fragments |
| 23 | B01[S-P] | Presence/absence of S–P at topological distance 1 | 2D Atom Pairs |
| 24 | B03[C-S] | Presence/absence of C–S at topological distance 3 | 2D Atom Pairs |
| 25 | BLTF96 | Verhaar Fish base-line toxicity from MLOGP (mmol/L) | Molecular properties |
| NER | ER | Sensitivity | Specificity | |||||
|---|---|---|---|---|---|---|---|---|
| Class | Class | |||||||
| I | II | III | I | II | III | |||
| Fitting | 0.66 | 0.34 | 0.53 | 0.46 | 0.65 | 0.80 | 0.74 | 0.78 |
| cv | 0.67 | 0.33 | 0.54 | 0.49 | 0.65 | 0.81 | 0.76 | 0.78 |
| External | 0.57 | 0.43 | 0.39 | 0.35 | 0.55 | 0.73 | 0.68 | 0.74 |
3.2. Analysis Based on 25 Descriptors
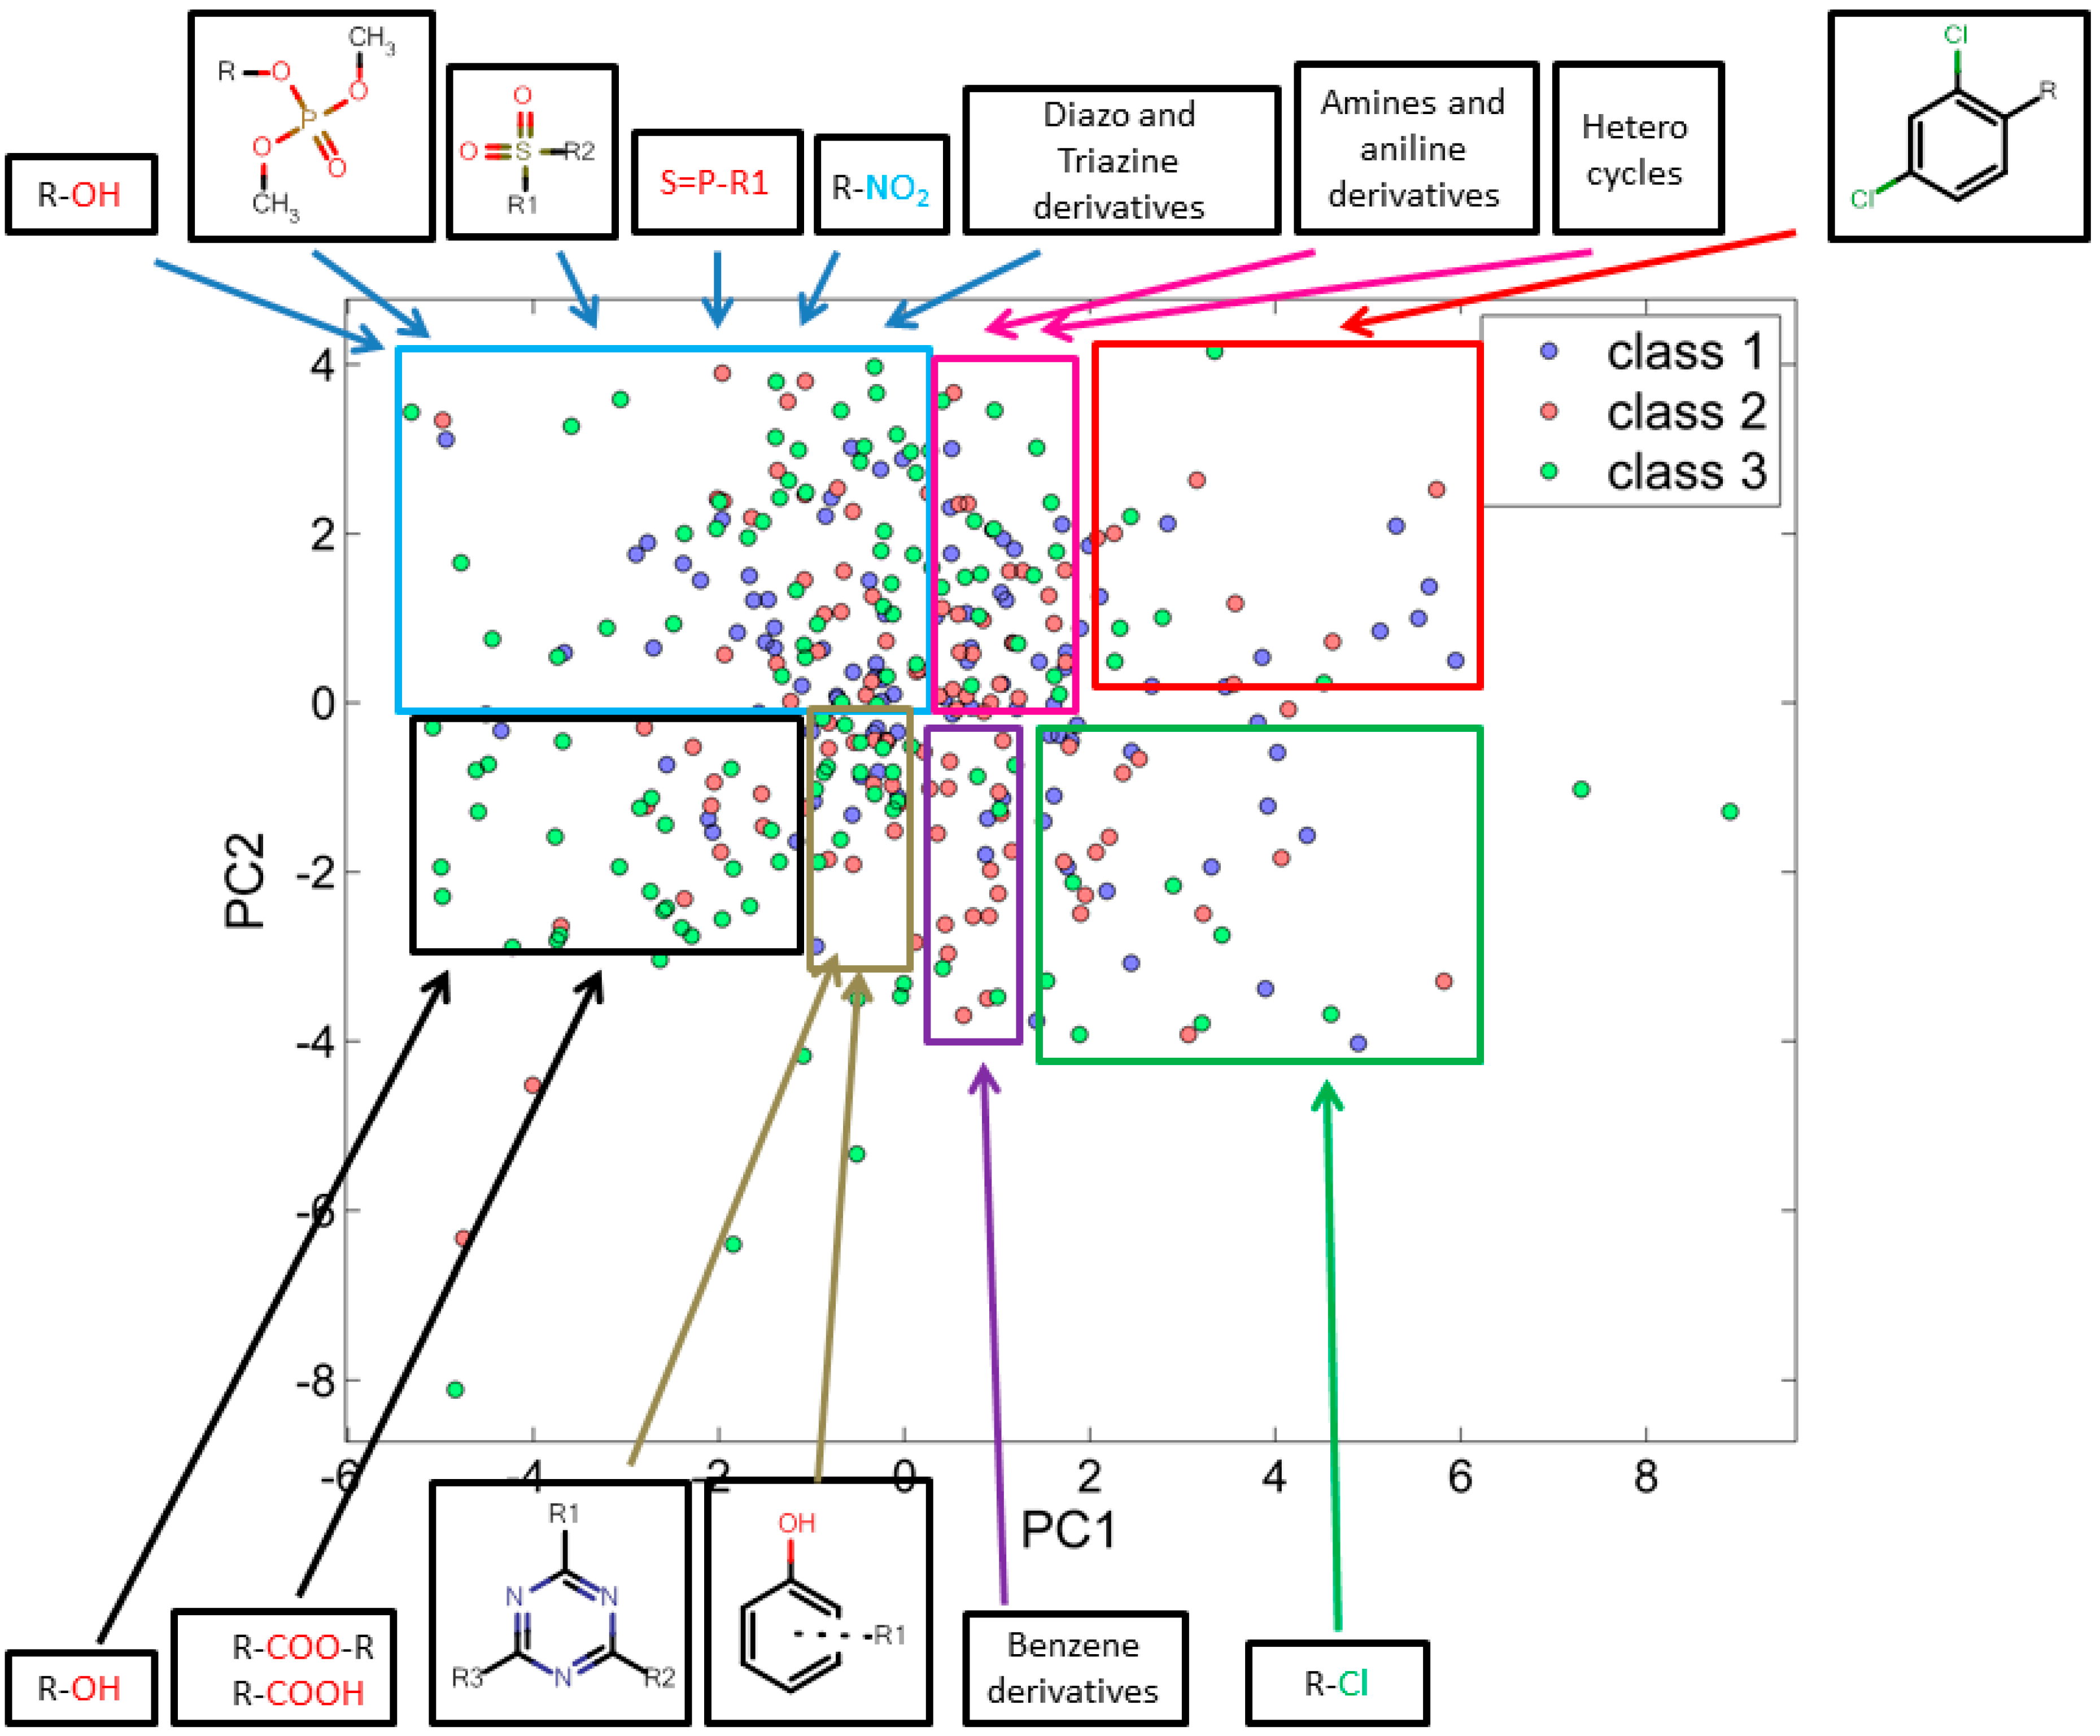
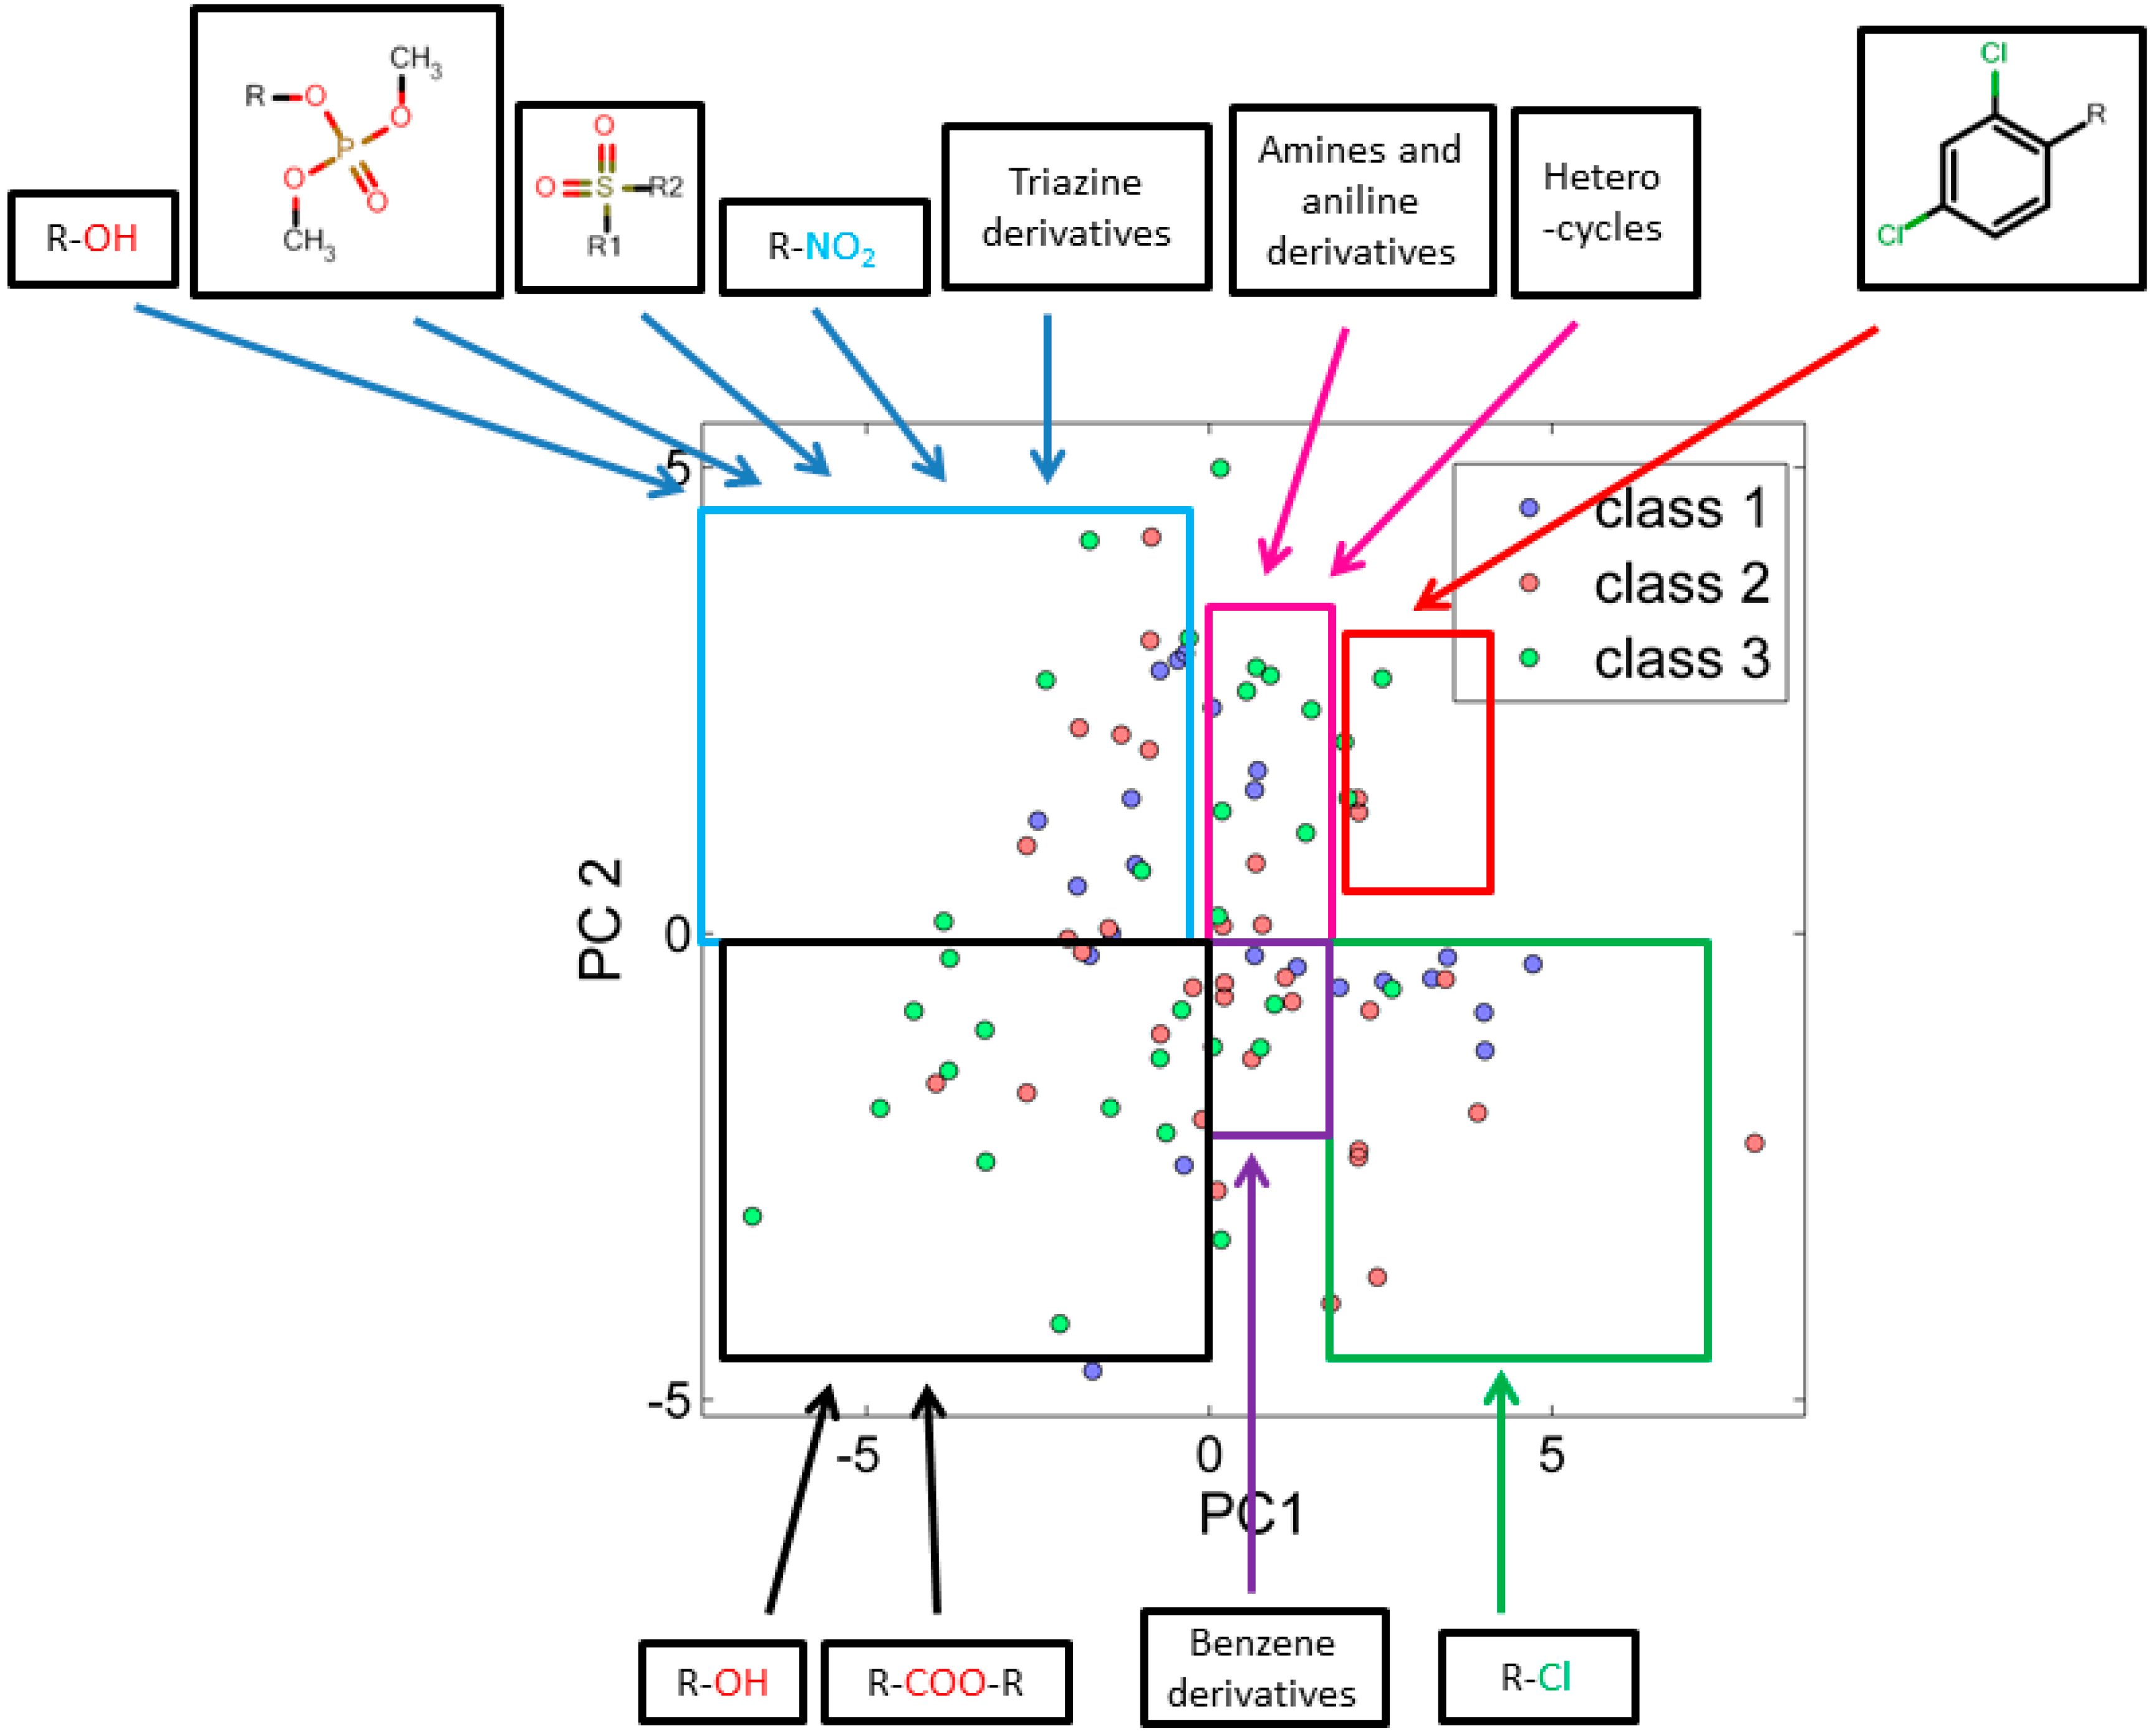
3.2.1. Score Plot


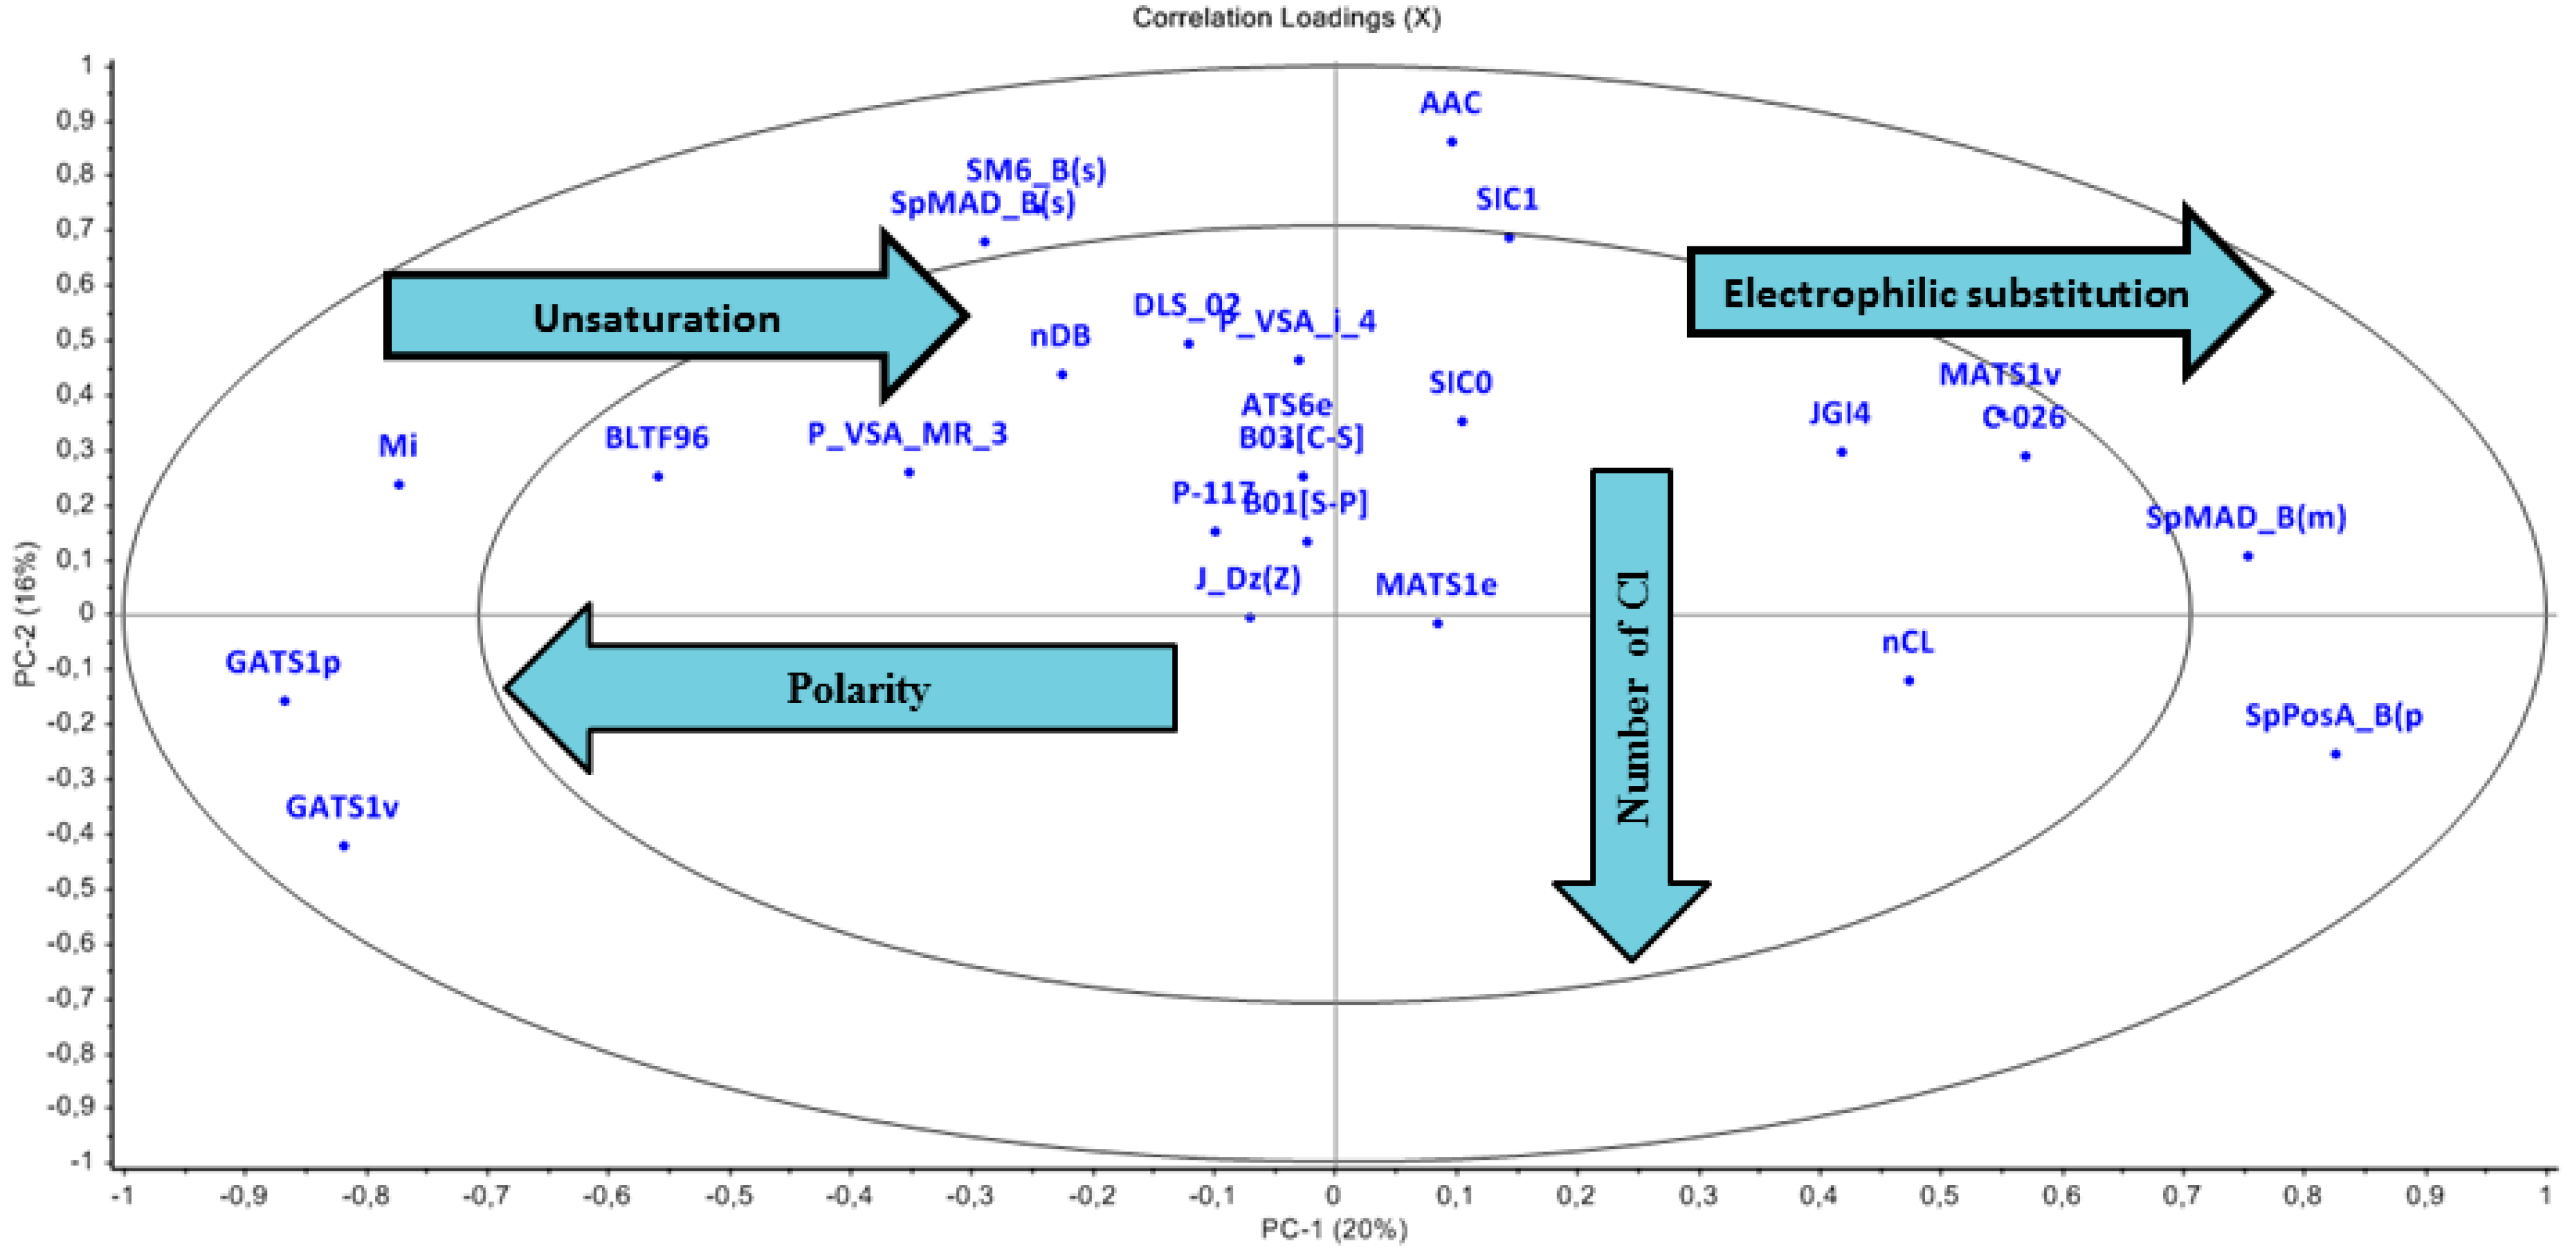
3.2.2. Loading Plot

4. Conclusions
Supplementary Materials
Supplementary Files
Supplementary File 1Acknowledgments
Author Contributions
Conflicts of Interest
References
- Munro, I.; Ford, R.; Kennepohl, E.; Sprenger, J. Correlation of structural class with no-observed-effect levels: A proposal for establishing a threshold of concern. Food Chem. Toxicol. 1996, 34, 829–867. [Google Scholar] [CrossRef]
- Rokach, L. Pattern Classification Using Ensemble Methods; World Scientific: Heckensack, NJ, USA, 2010; pp. 1–244. [Google Scholar]
- Stochero, M.; Bassan, A.; Fioravanzo, E.; Pavan, M. Applicability of Physicochemical Data, QSARs and Read-across in Threshold of Toxicological Concern Assessment; European Food Safety Authority: Parma, Italy, 2011; pp. 1–135. [Google Scholar]
- Jolliffe, I. Principal Component Analysis, 2nd ed.; Springer: Berlin, Germany, 2002; pp. 1–489. [Google Scholar]
- Trygg, J.; Wold, S. O2-PLS, a two-block (X–Y) latent variable regression (LVR) method with an integral OSC filter. J. Chemom. 2003, 17, 53–64. [Google Scholar] [CrossRef]
- Cramer, G.; Ford, R.; Hall, R. Estimation of toxic hazard—A decision tree approach. Food Cosmet. Toxicol. 1976, 16, 255–276. [Google Scholar] [CrossRef]
- Russell, W.M.S.; Burch, R.L.; Hume, C.W. The Principles of Humane Experimental Technique; Methuen: London, UK, 1959; pp. 1–238. [Google Scholar]
- Reach. Title-III: Sharing and Avoidance of Unnecessary Testing. Available online: http://www.reachonline.eu/REACH/EN/REACH_EN/article25.html (accessed on 15 January 2014).
- United Nations. Globally Harmonized System of Classification and Labelling of Chemicals (GHS). Available online: http://www.unece.org/fileadmin/DAM/trans/danger/publi/ghs/ghs_rev04/English/ST-SG-AC10–30-Rev4e.pdf (accessed on 15 January 2014).
- ChemSpider: An Online Chemical Information Resource. Available online: http://www.chemspider.com/ (accessed on 15 January 2014).
- Cactus. Available online: http://cactus.nci.nih.gov/chemical/structure (accessed on 15 January 2014).
- The Sigma-Aldrich Library of Chemical Safety Data. Available online: http://www.sigmaaldrich.com/sigma-aldrich/home.html (accessed on 15 January 2014).
- PubChem: Integrated Platform of Small Molecules and Biological Activities. Available online: https://pubchem.ncbi.nlm.nih.gov/ (accessed on 15 January 2014).
- Todeschini, R.; Consonni, V. Molecular Descriptors for Chemoinformatics, 2nd ed.; Wiley-VCH: Weinheim, Germany, 2009; pp. 1–1257. [Google Scholar]
- Mason, R.L.; Young, J.C. Multivariate tools: Principal component analysis. Qual. Prog. 2005, 38, 83–85. [Google Scholar]
- Todeschini, R. k-Naearest neighbour method: The influence of data transformations and metrics. Chemom. Intel. Lab. Syst. 1989, 6, 213–220. [Google Scholar] [CrossRef]
- Kowalski, B.R.; Bender, C. k-Nearest Neighbor Classification Rule (pattern recognition) applied to nuclear magnetic resonance spectral interpretation. Anal. Chem. 1972, 44, 1405–1411. [Google Scholar] [CrossRef]
- Leardi, R.; Lupiáñez González, A. Genetic algorithms applied to feature selection in PLS regression: how and when to use them. Chemom. Intel. Lab. Syst. 1998, 41, 195–207. [Google Scholar] [CrossRef]
- Lucasius, C.B.; Kateman, G. Understanding and using genetic algorithms Part 1. Concepts, properties and context. Chemom. Intel. Lab. Syst. 1993, 19, 1–33. [Google Scholar] [CrossRef]
- Ballabio, D.; Todeschini, R. Multivariate classification for qualitative analysis. In Infrared Spectroscopy for Food Quality Analysis and Control; Sun, D.W., Ed.; Elsevier: Burlington, MA, USA, 2009; pp. 83–104. [Google Scholar]
- Ballabio, D.; Consonni, V. Classification tools in chemistry. Part 1: Linear models. PLS-DA. Anal. Methods 2013, 5, 3790–3798. [Google Scholar] [CrossRef]
- The Matlab Classification Toolbox Module. Available online: http://michem.disat.unimib.it/chm/download/classificationinfo.htm (assessed on 24 September 2014).
- Freidig, A.; Dekkers, S.; Verwei, M.; Zvinavashe, E.; Bessems, J.; van de Sandt, J. Development of a QSAR for worst case estimates of acute toxicity of chemically reactive compounds. Toxicol. Lett. 2007, 170, 214–222. [Google Scholar] [CrossRef]
- Sazonovas, A.; Japertas, P.; Didziapetris, R. Estimation of reliability of predictions and model applicability domain evaluation in the analysis of acute toxicity (LD 50). SAR QSAR Environ. Res. 2010, 21, 127–148. [Google Scholar] [CrossRef]
© 2014 by the authors; licensee MDPI, Basel, Switzerland. This article is an open access article distributed under the terms and conditions of the Creative Commons Attribution license (http://creativecommons.org/licenses/by/4.0/).
Share and Cite
Chavan, S.; Nicholls, I.A.; Karlsson, B.C.G.; Rosengren, A.M.; Ballabio, D.; Consonni, V.; Todeschini, R. Towards Global QSAR Model Building for Acute Toxicity: Munro Database Case Study. Int. J. Mol. Sci. 2014, 15, 18162-18174. https://doi.org/10.3390/ijms151018162
Chavan S, Nicholls IA, Karlsson BCG, Rosengren AM, Ballabio D, Consonni V, Todeschini R. Towards Global QSAR Model Building for Acute Toxicity: Munro Database Case Study. International Journal of Molecular Sciences. 2014; 15(10):18162-18174. https://doi.org/10.3390/ijms151018162
Chicago/Turabian StyleChavan, Swapnil, Ian A. Nicholls, Björn C. G. Karlsson, Annika M. Rosengren, Davide Ballabio, Viviana Consonni, and Roberto Todeschini. 2014. "Towards Global QSAR Model Building for Acute Toxicity: Munro Database Case Study" International Journal of Molecular Sciences 15, no. 10: 18162-18174. https://doi.org/10.3390/ijms151018162