2.1. Characterization of the FGF-2-Apatite Composite Layers
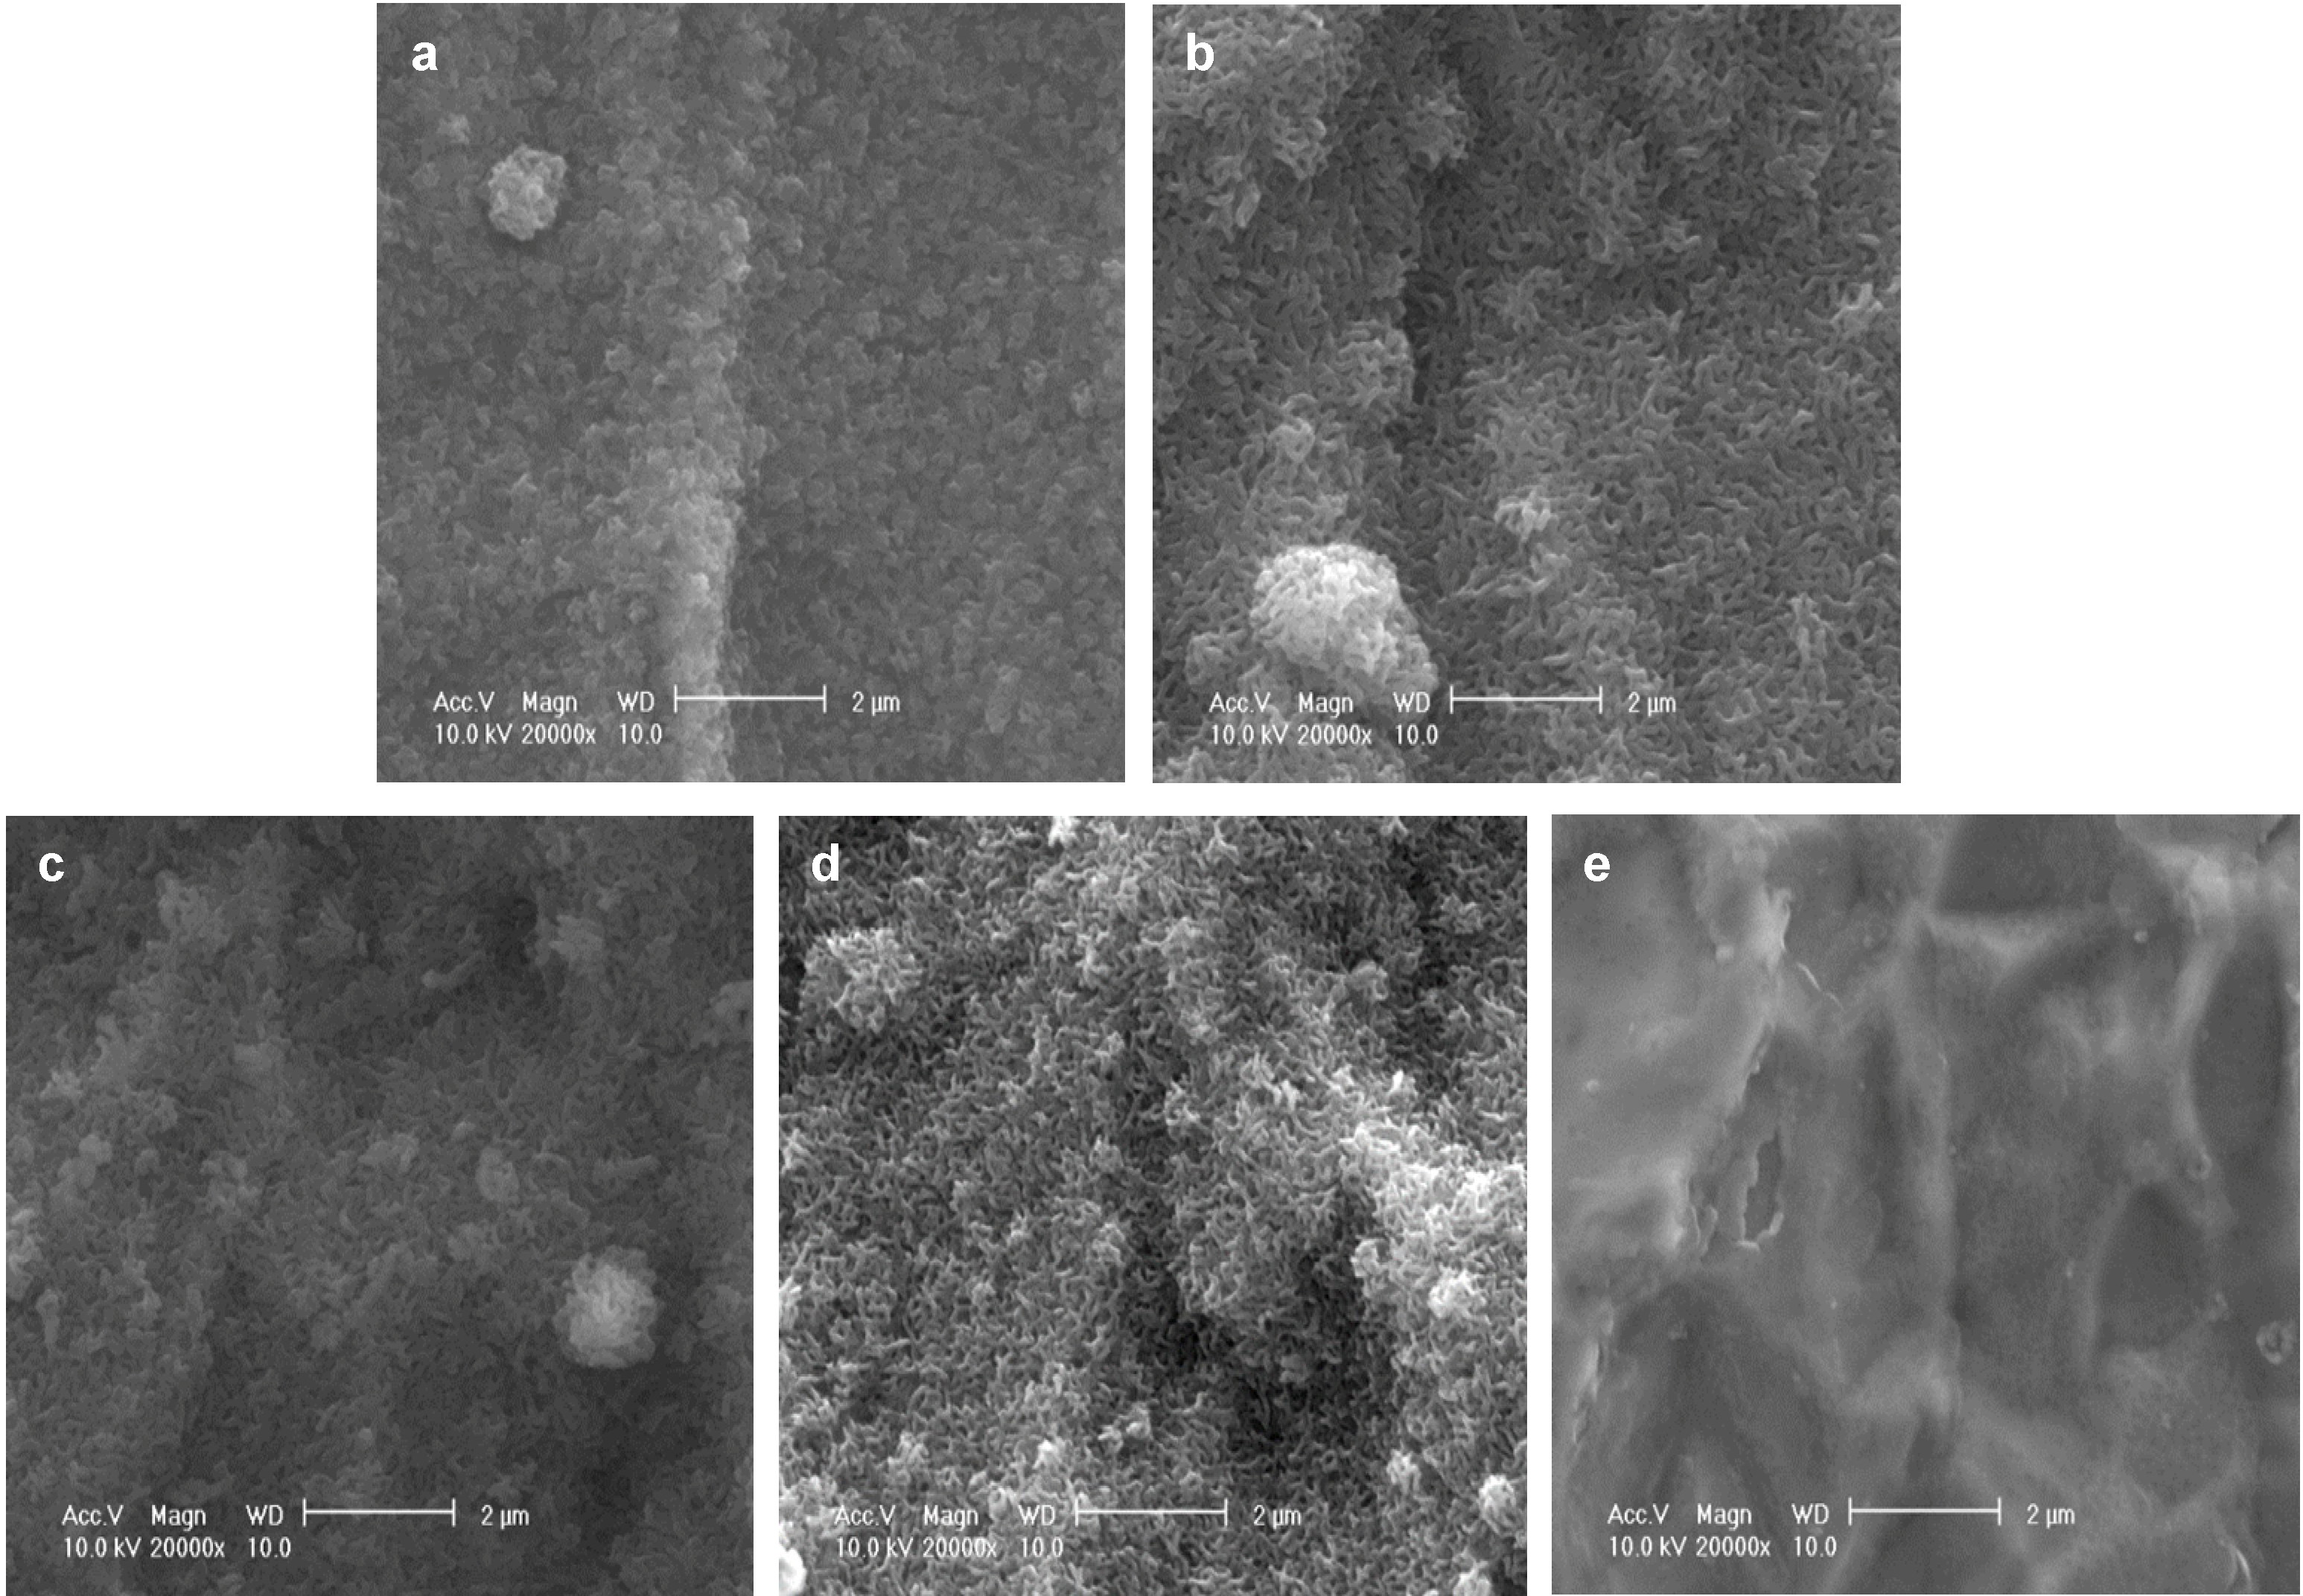
As reported previously, after immersion in a supersaturated CaP solution containing 4.0 µg/mL FGF-2 at 37 °C for 2 days (37F4.0), Ti pins were entirely and homogeneously coated with a fine-structured layer, as confirmed by scanning electron microscopy (SEM) (
Figure 1a). Similar fine-structured layers were also observed on Ti pins after immersion in a supersaturated CaP solution containing 2.43-fold higher calcium and 1.62-fold higher phosphate ion concentrations with 0.5, 1.0, or 2.0 µg/mL FGF-2 at 25 °C for 1 day (25F0.5,
Figure 1b; 25F1.0,
Figure 1c; or 25F2.0,
Figure 1d). The layer for the 37F4.0 appeared to be slightly denser than that for the 25F0.5, 25F1.0, and 25F2.0. No such layers were observed on the uncoated Ti pins (UN,
Figure 1e).
Figure 1.
SEM (scanning electron microscopy) images of the surfaces of (a) 37F4.0; (b) 25F0.5; (c) 25F1.0; (d) 25F2.0; and (e) Uncoated Ti pin.
Figure 1.
SEM (scanning electron microscopy) images of the surfaces of (a) 37F4.0; (b) 25F0.5; (c) 25F1.0; (d) 25F2.0; and (e) Uncoated Ti pin.
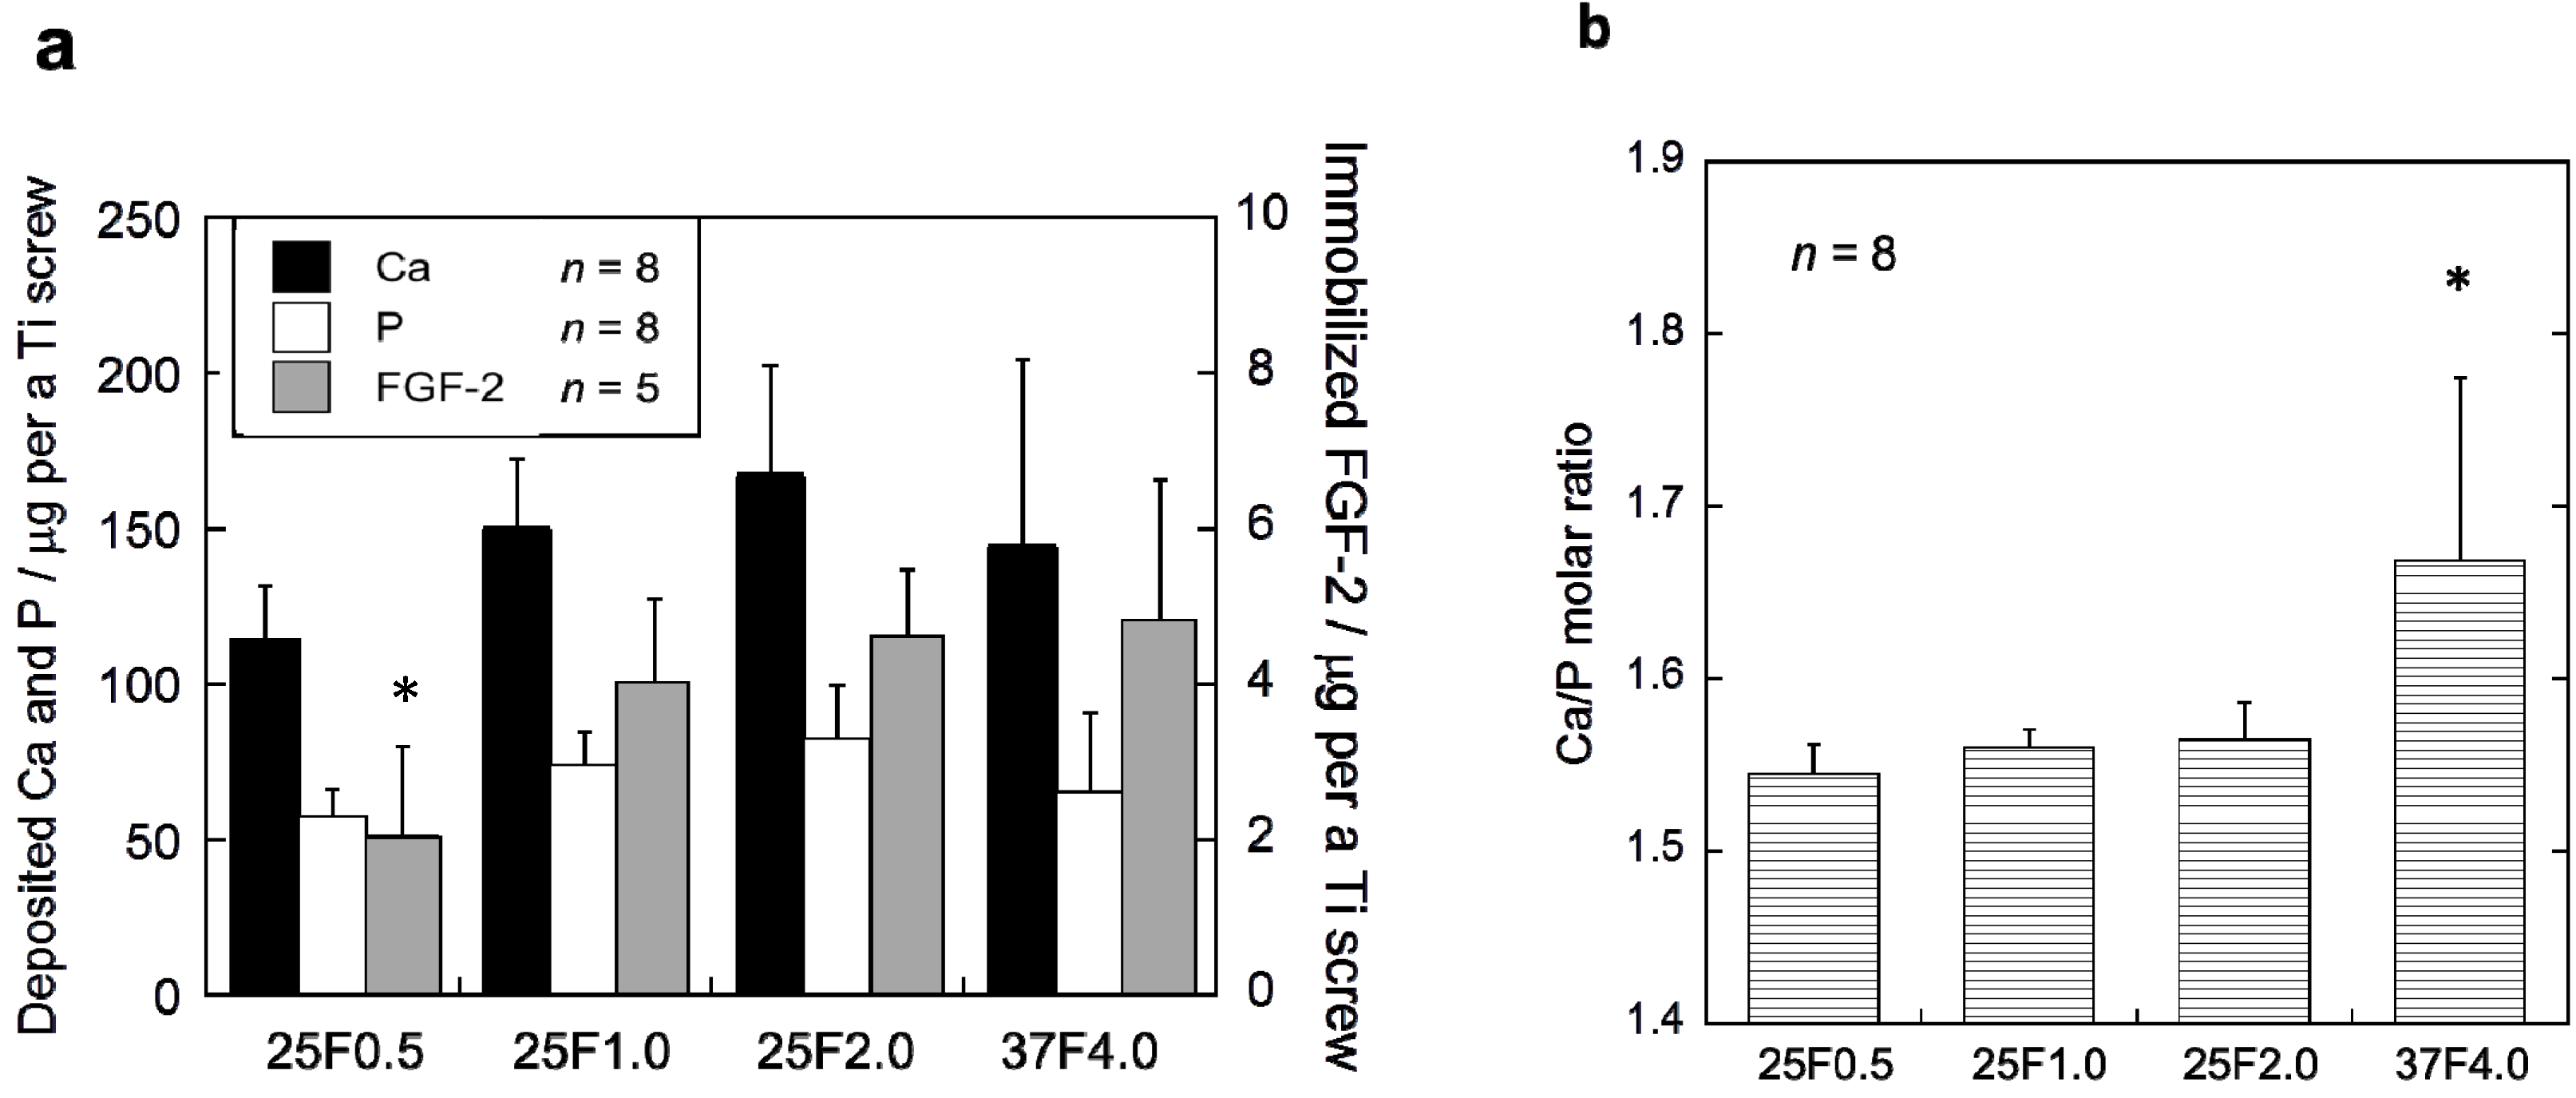
The FGF-2-apatite composite layers on the Ti pins coated at 25 °C for 1 day contained similar FGF-2, Ca, and P contents to those coated at 37 °C for 2 days, but the Ca/P molar ratios were significantly different. The FGF-2 content in the composite layers was quantified using the Bradford method (
Figure 2a). The FGF-2 content of the 37F4.0 (4.72 ± 1.91 µg), 25F2.0 (4.62 ± 0.86 µg), and 25F1.0 (3.97 ± 1.14 µg) groups were not significantly different. Only the FGF-2 content of the 25F0.5 (2.04 ± 1.18 µg) group was significantly lower than the 25F2.0 (
p = 0.0221) and 37F4.0 (
p =0.0229) groups. No significant differences were observed in Ca or P contents among all the groups. However, the layer Ca/P molar ratios of the 25F0.5 (1.55 ± 0.02,
p = 0.0008), 25F1.0 (1.56 ± 0.01,
p = 0.0024), and 25F2.0 (1.56 ± 0.02,
p = 0.0045) groups were significantly lower than that of the 37F4.0 group (1.67 ± 0.11) (
Figure 2b).
Figure 2.
(a) Ca, P and FGF-2 contents; and (b) the Ca/P molar ratios of the composite layers in the 25F0.5, 25F1.0, 25F2.0, and 37F4.0 groups. * p < 0.05 compared with 25F2.0 and 37F4.0 groups in (a); and compared with the 25F0.5, 25F1.0, and 25 F2.0 groups in (b).
Figure 2.
(a) Ca, P and FGF-2 contents; and (b) the Ca/P molar ratios of the composite layers in the 25F0.5, 25F1.0, 25F2.0, and 37F4.0 groups. * p < 0.05 compared with 25F2.0 and 37F4.0 groups in (a); and compared with the 25F0.5, 25F1.0, and 25 F2.0 groups in (b).
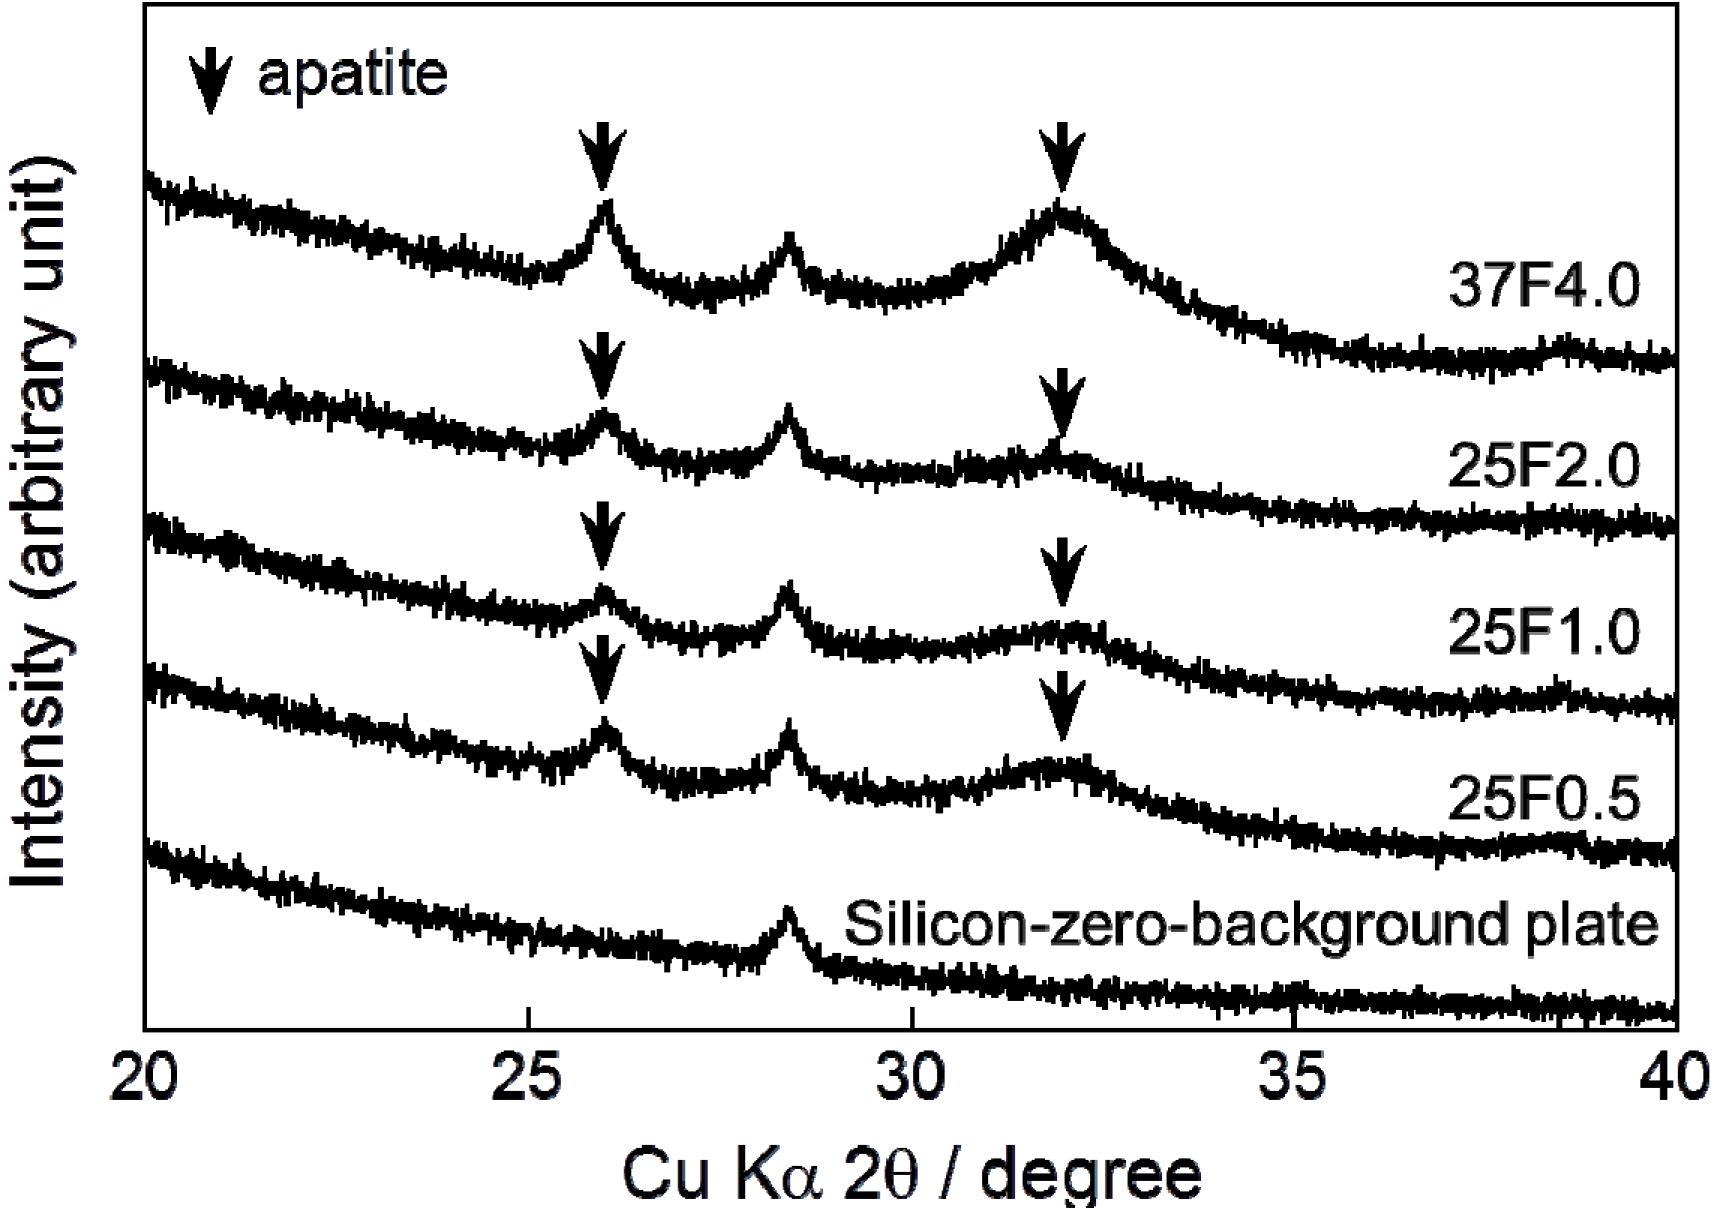
Very broad and small peaks appeared in the X-ray diffraction (XRD) patterns of all the composite layers at approximately 26° and 32° (
Figure 3). These peaks confirmed that the main crystalline phase of the layers was low-crystalline apatite.
Figure 3.
XRD (X-ray diffraction) patterns from a silicon-zero-background plate and CaP (calcium phosphate) deposited on the 25F0.5, 25F1.0, 25F2.0, and 37F4.0 groups. Arrows indicate the diffraction peaks corresponding to those for apatite.
Figure 3.
XRD (X-ray diffraction) patterns from a silicon-zero-background plate and CaP (calcium phosphate) deposited on the 25F0.5, 25F1.0, 25F2.0, and 37F4.0 groups. Arrows indicate the diffraction peaks corresponding to those for apatite.
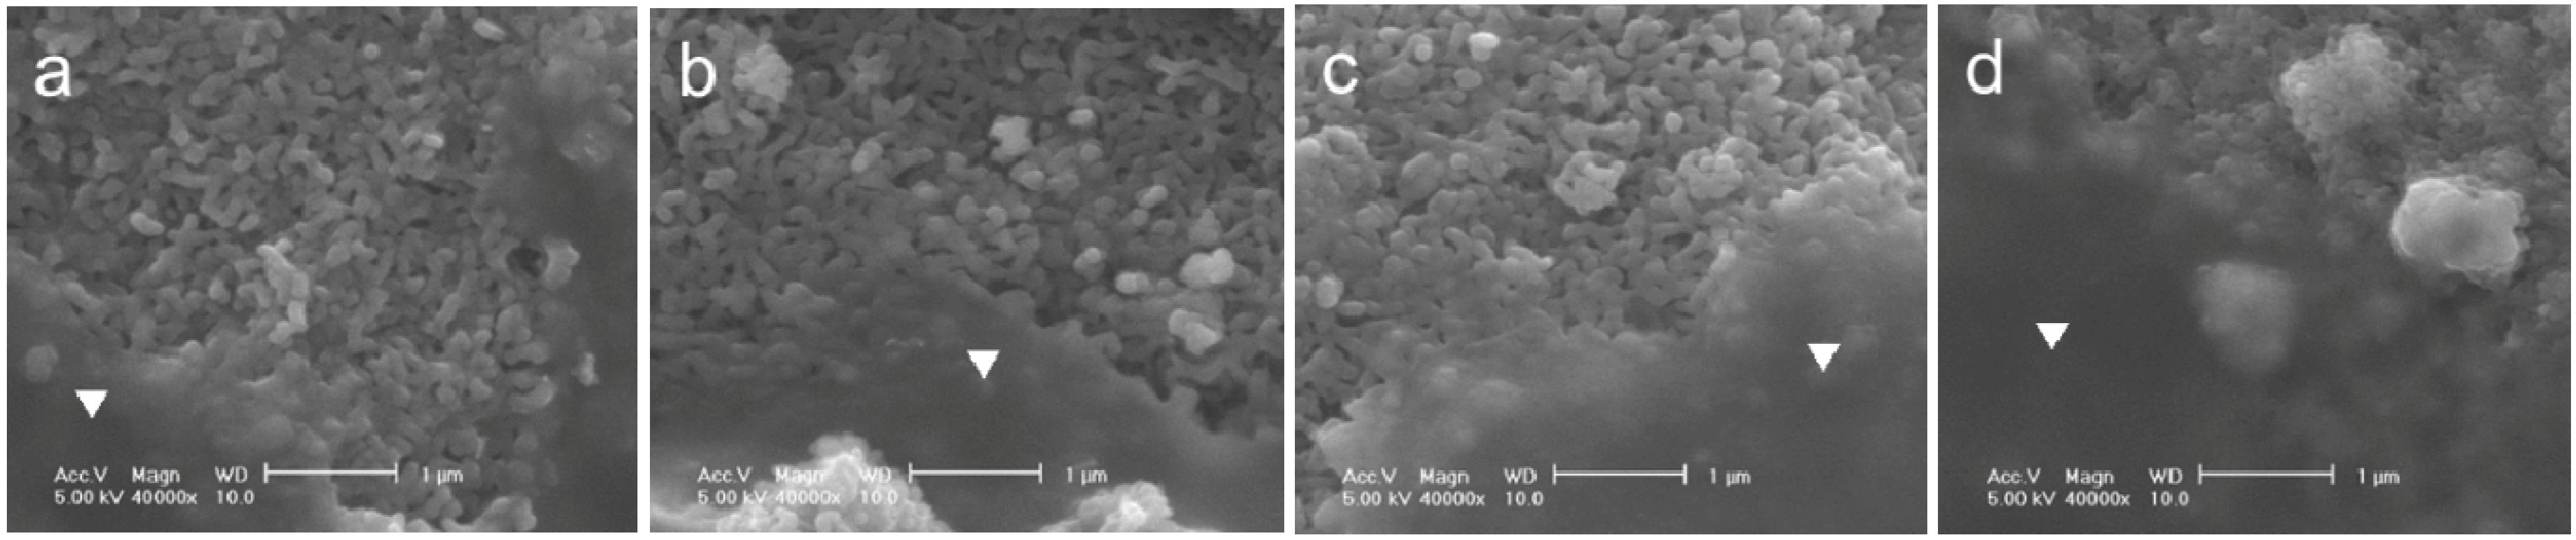
The adhesion strength of the FGF-2-apatite composite layers on Ti pins coated at 25 °C for 1 day was comparable to that of the layers coated at 37 °C for 2 days. After a Scotch
® tape detachment test, the surfaces of the 25F0.5, 25F1.0, 25F2.0, and 37F4.0 pins remained covered with the FGF-2-apatite composite layers, and glue was observed on the surfaces in all the samples (
Figure 4). Thus, the composite layers adhered to the Ti pins so strongly that glue from the Scotch
® tape remained on the composite layer without detaching the layer from the Ti pin.
Figure 4.
SEM images of the FGF-2-apatite composite layers after the Scotch® tape detachment test on (a) 25F0.5; (b) 25F1.0; (c) 25F2.0; and (d) 37F4.0. Glue on a smooth surface is marked with an inverted triangle.
Figure 4.
SEM images of the FGF-2-apatite composite layers after the Scotch® tape detachment test on (a) 25F0.5; (b) 25F1.0; (c) 25F2.0; and (d) 37F4.0. Glue on a smooth surface is marked with an inverted triangle.
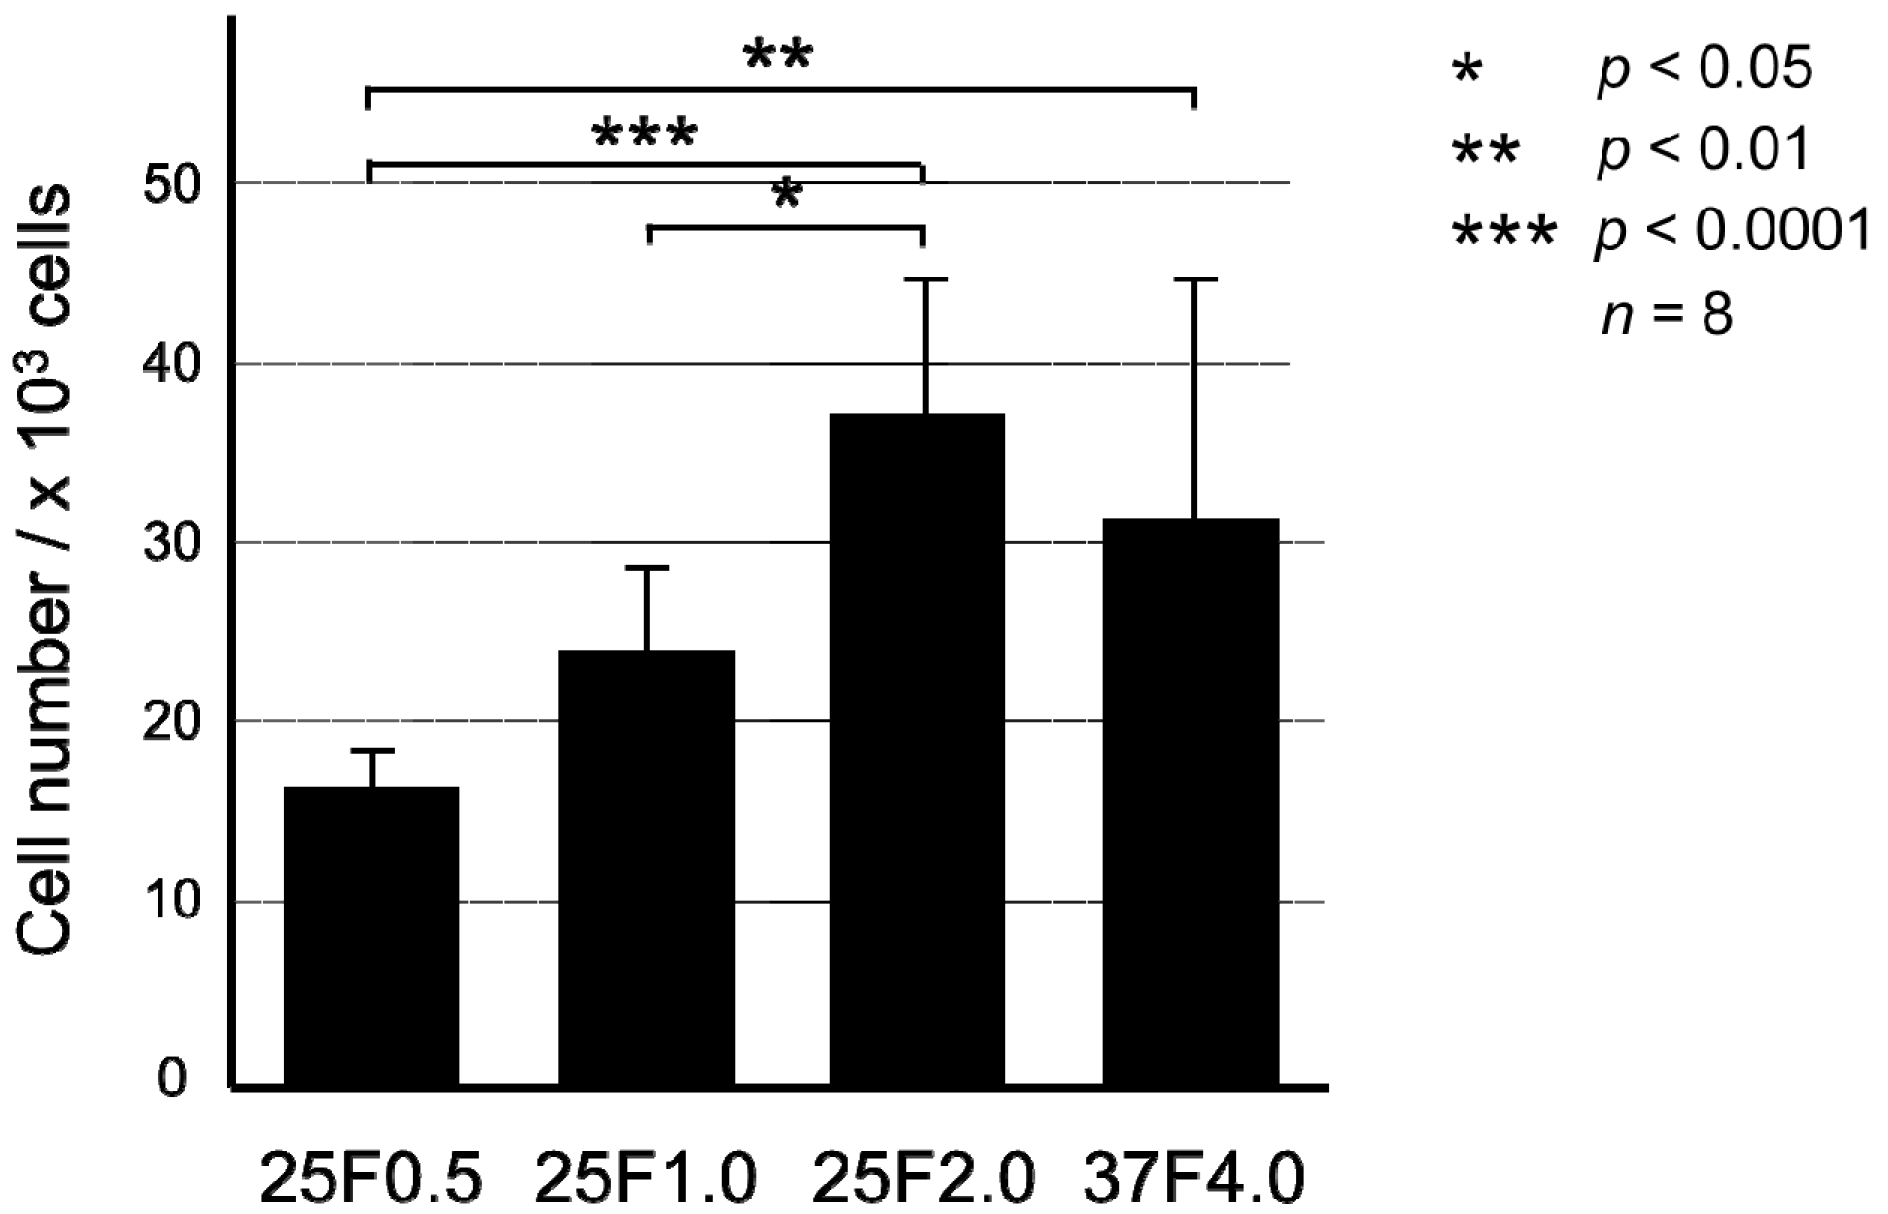
The biological activity of the FGF-2-apatite composite layers on Ti pins coated at 25 °C for 1 day was comparable to that of those coated at 37 °C for 2 days, except for the 25F0.5 group (
Figure 5). The mitogenic activity of the immobilized FGF-2, as determined by the proliferation of NIH3T3 cells cultured in serum-free medium, increased with increasing FGF-2 concentration added to the supersaturated CaP solution for the 25 °C groups. There were no significant differences in mitogenic activity between the 37F4.0 and 25F1.0 (
p = 0.2897) groups, or between the 37F4.0 and 25F2.0 (
p = 0.5373) groups.
Figure 5.
Number of NIH3T3 cells extracted with citric acid buffer after culture for 72 h in serum-free medium from the FGF-2-apatite composite layers of the 25F0.5, 25F1.0, 25F2.0, and 37F4.0 groups.
Figure 5.
Number of NIH3T3 cells extracted with citric acid buffer after culture for 72 h in serum-free medium from the FGF-2-apatite composite layers of the 25F0.5, 25F1.0, 25F2.0, and 37F4.0 groups.
2.2. Classification of Pin Tract Infections by Visual Inspection
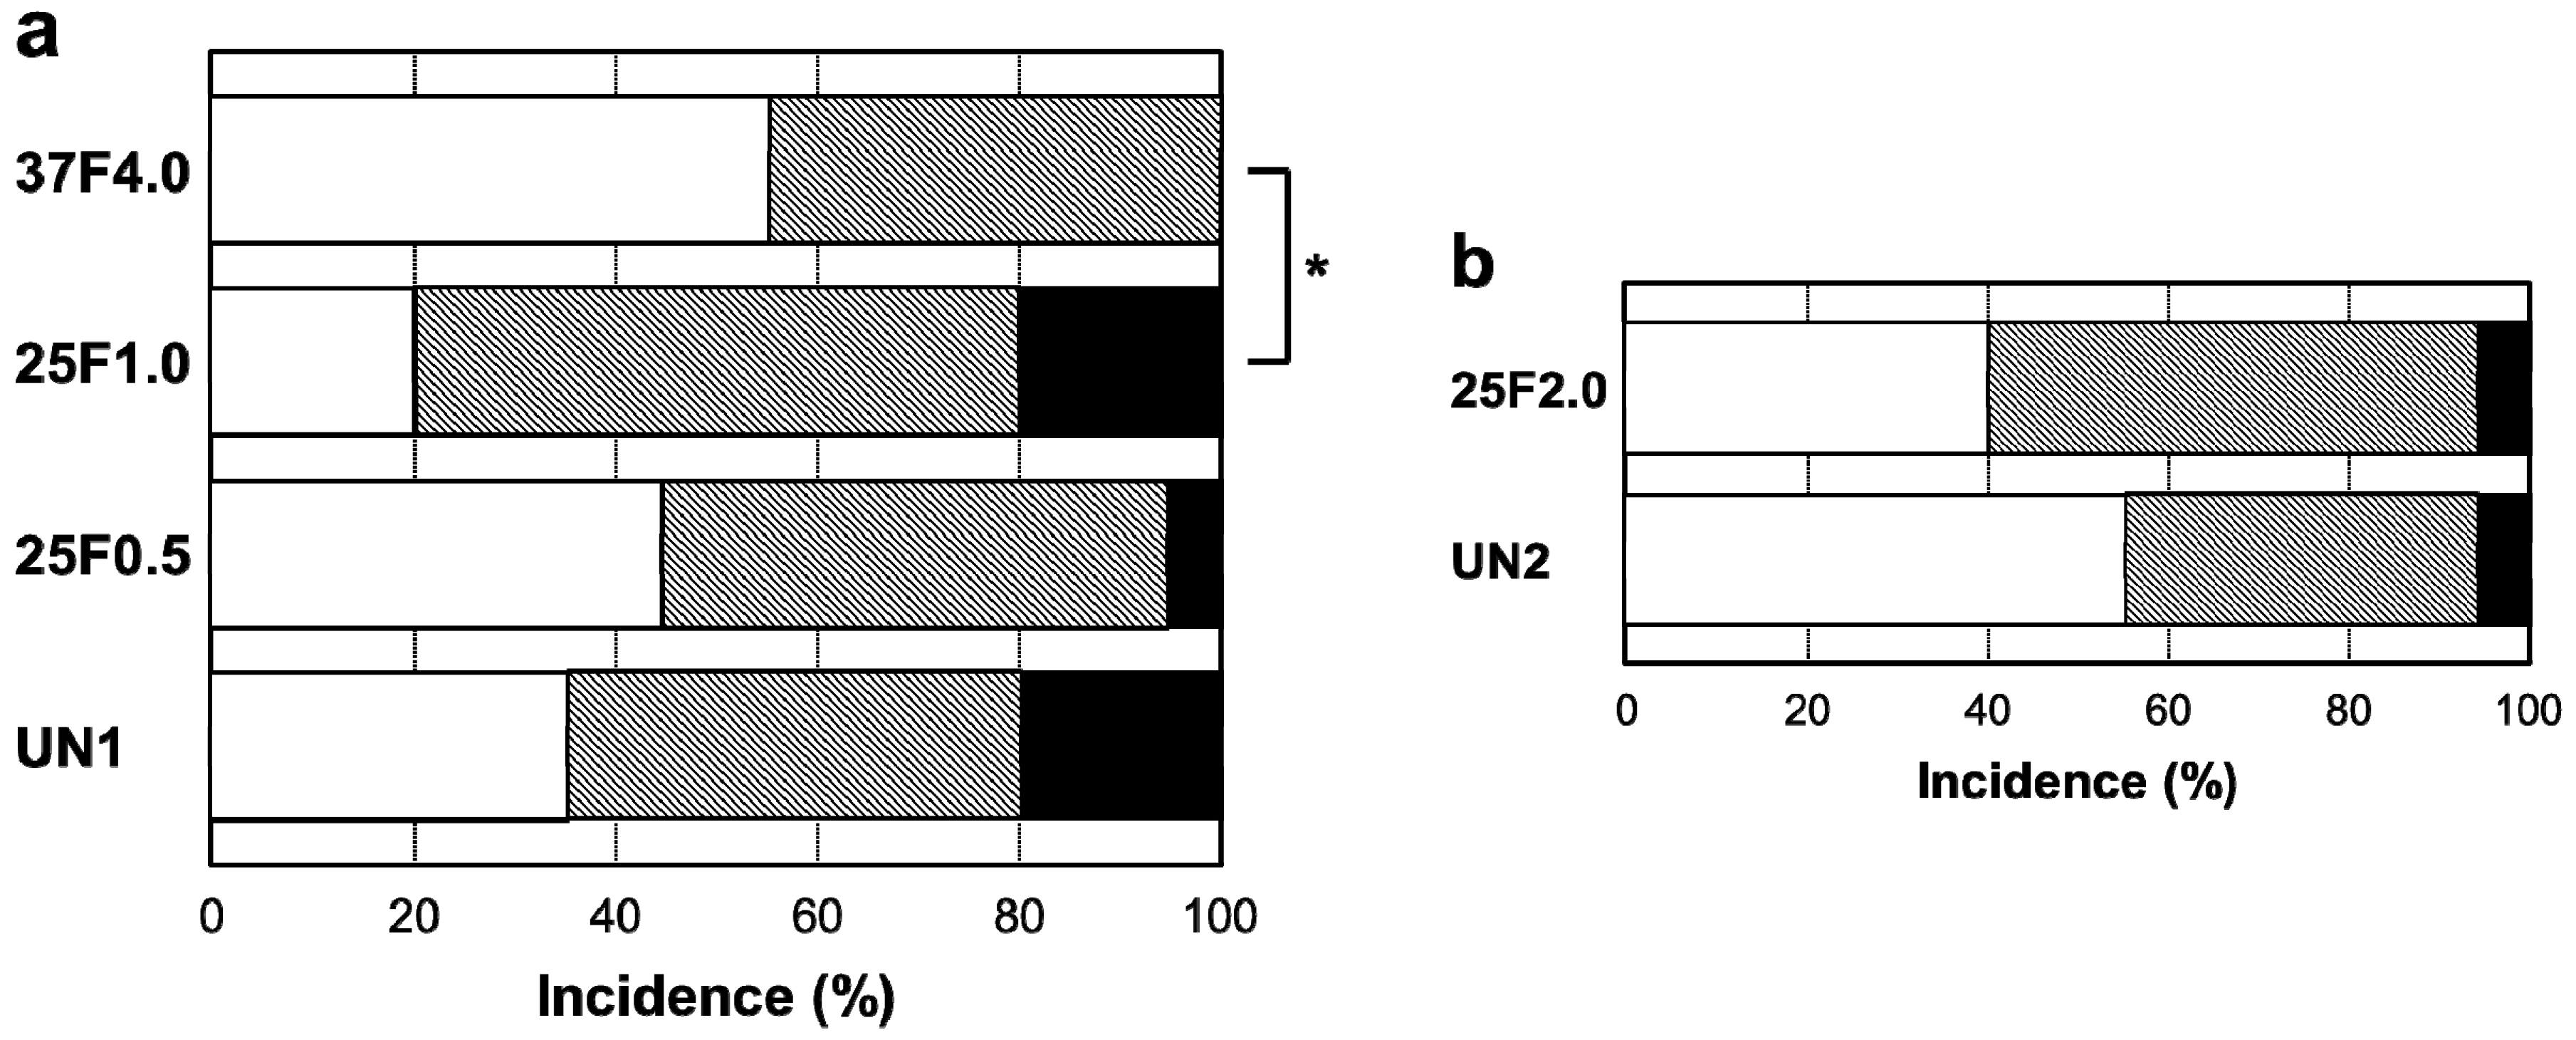
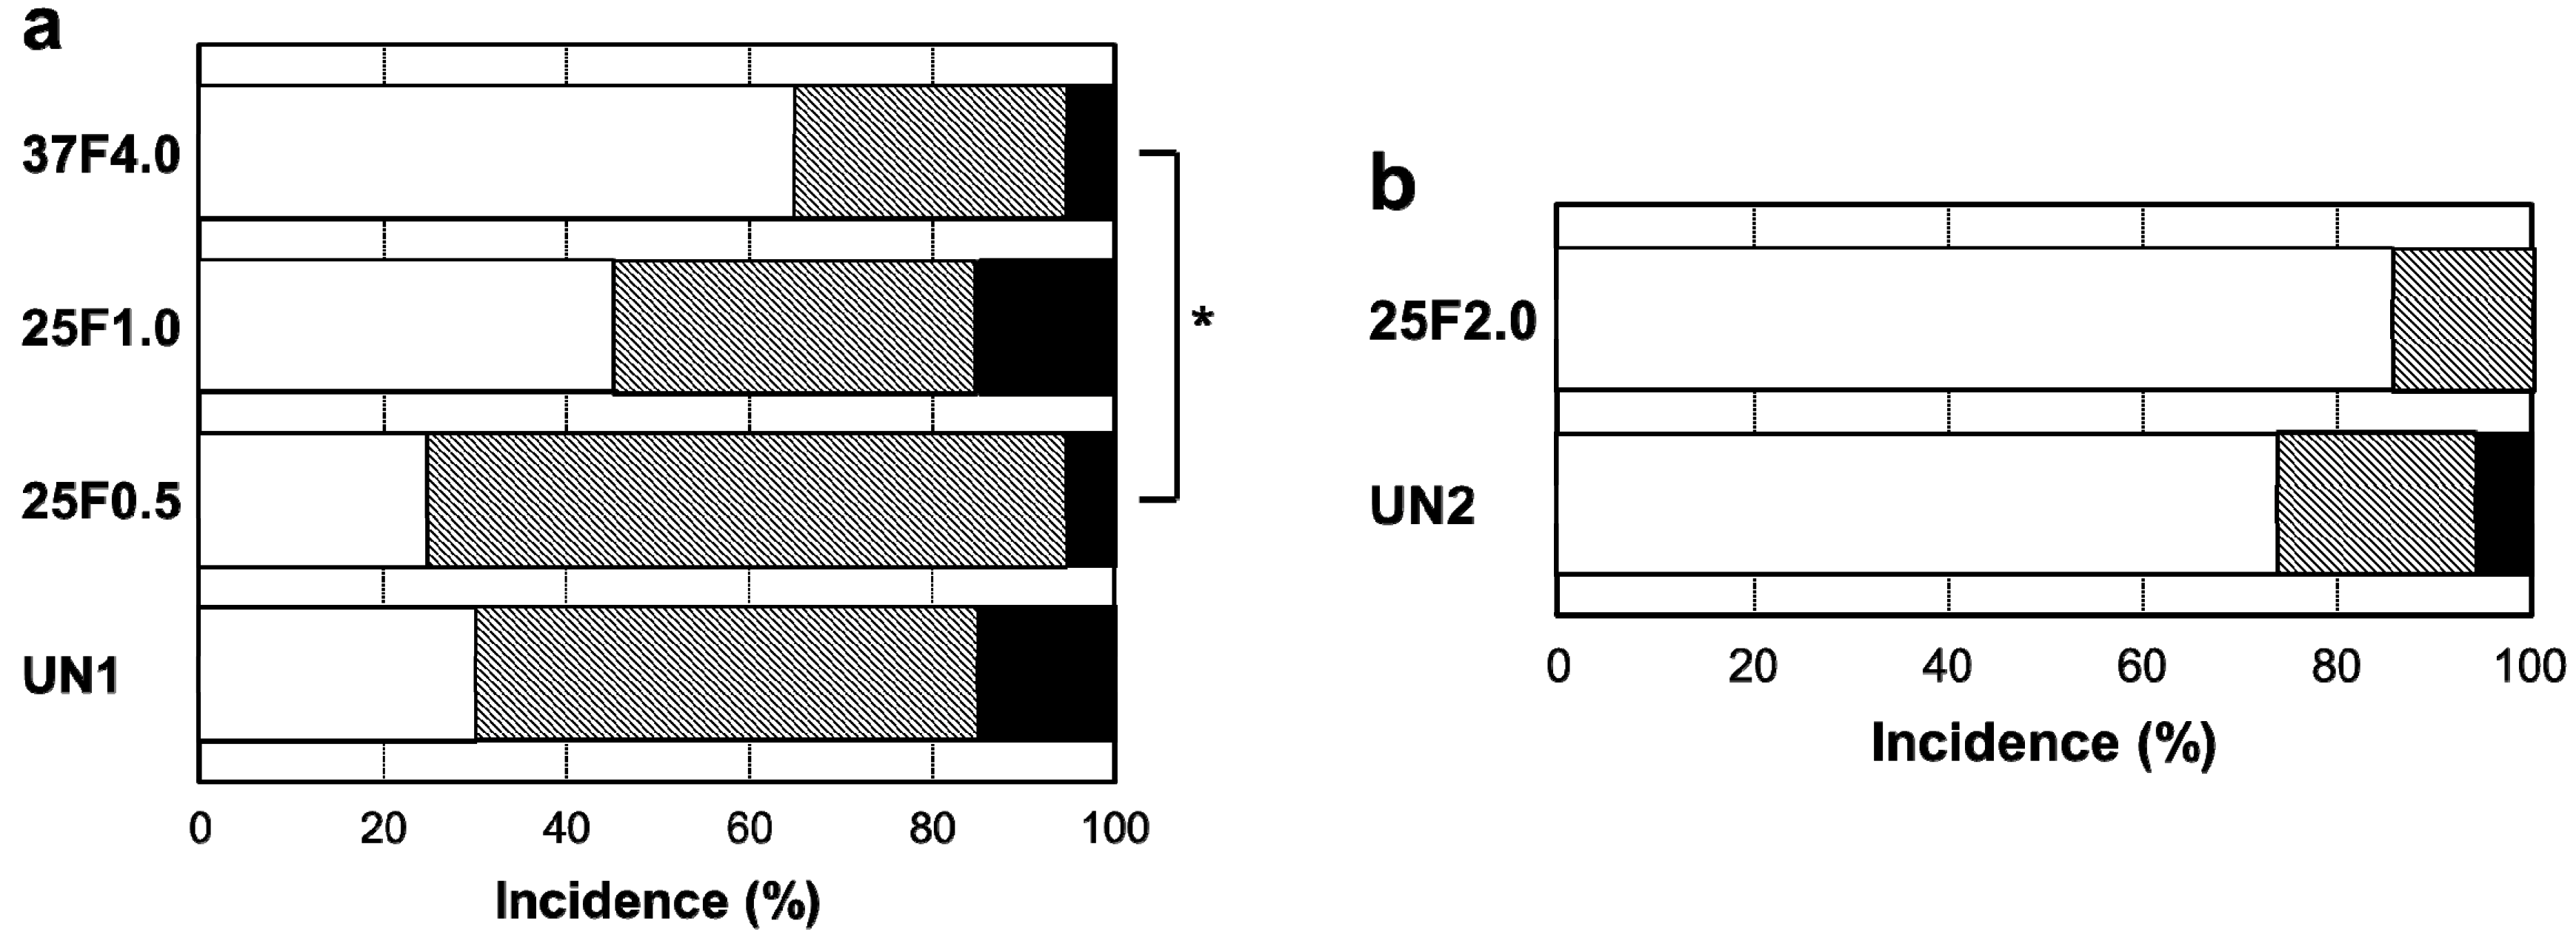
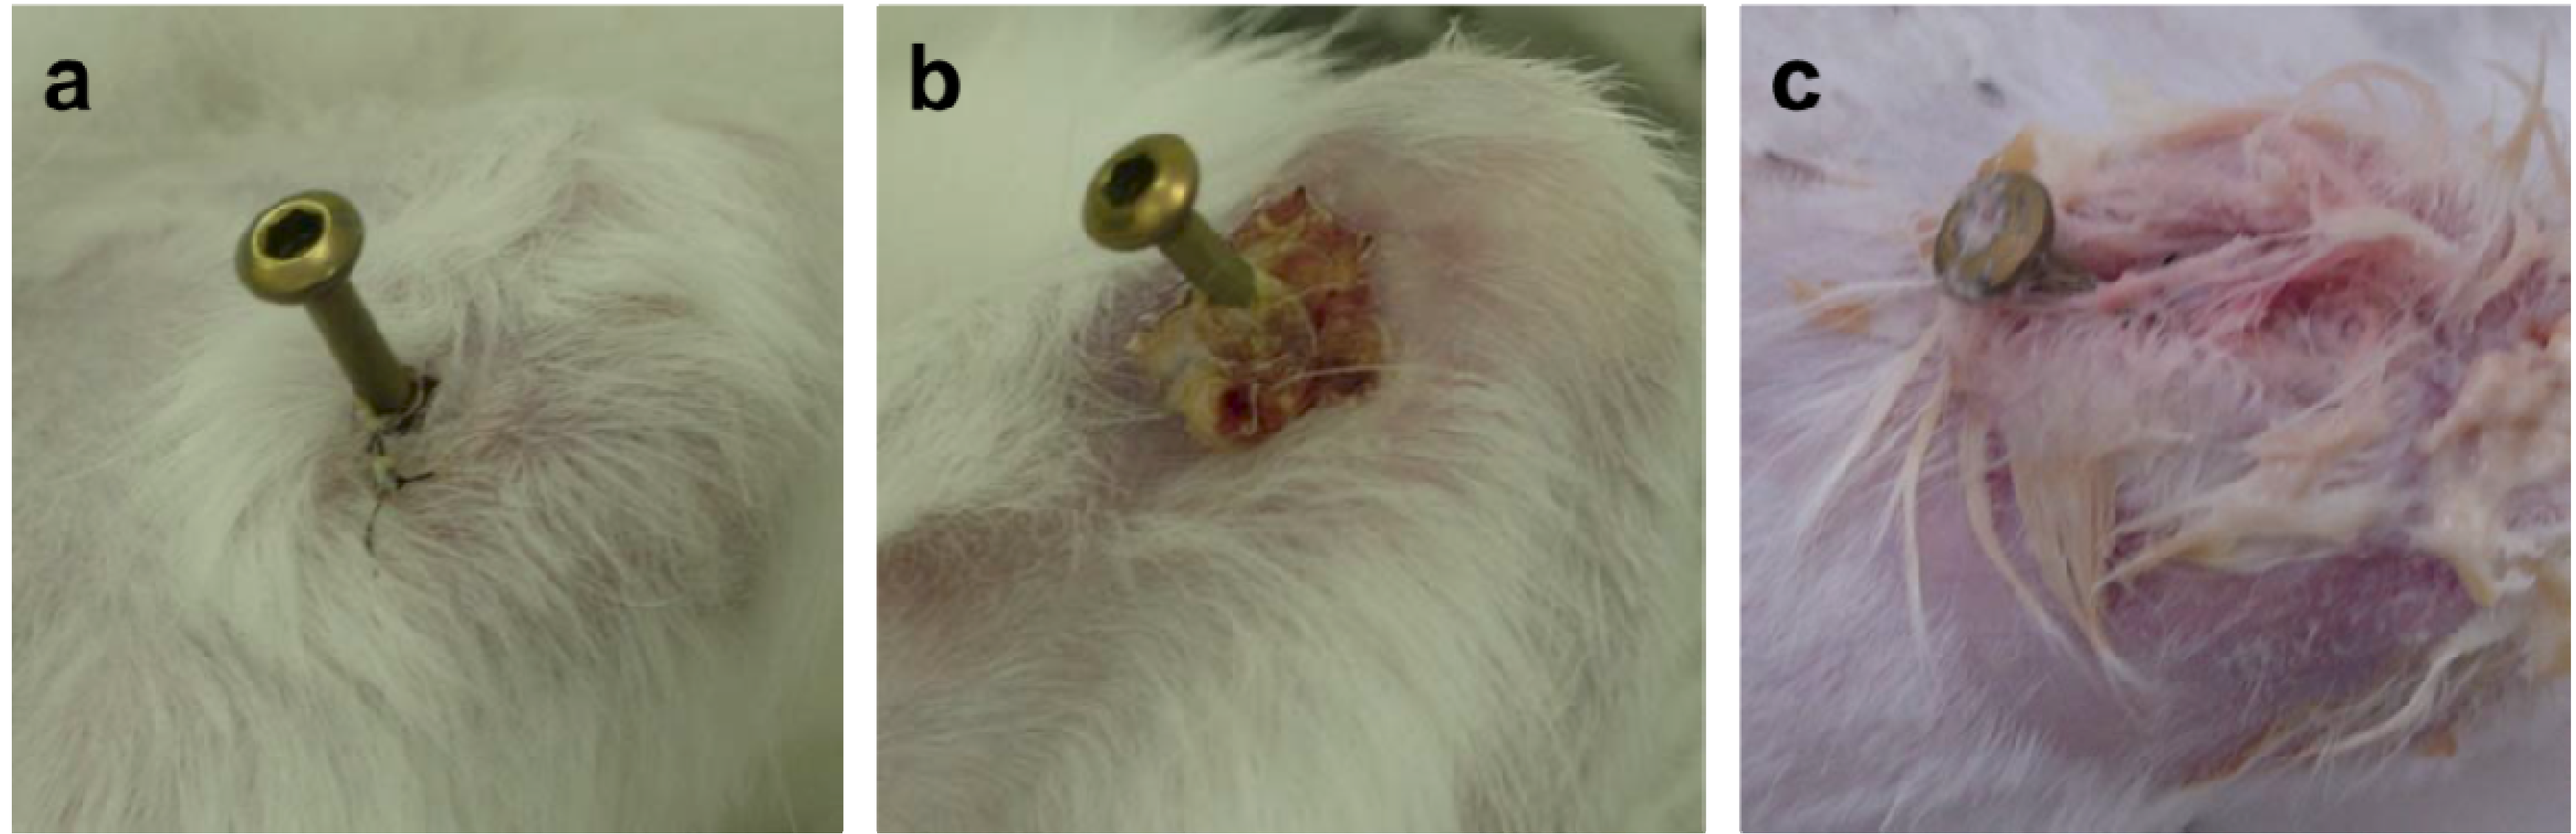
Surprisingly, the FGF-2-apatite composite layers on Ti pins fabricated at 25 °C for 1 day failed to show an improved resistance to pin tract infections compared with those fabricated at 37 °C for 2 days. The typical appearances of Grades 0v (no redness), 1v (skin infection without pin loosening), and 2v (infection with pin loosening) after visual inspection of pin tract infections are shown in
Figure 6. The incidence rates of Grade 0v were 55% (37F4.0,
n = 11/20), 20% (25F1.0,
n = 4/20), 45% (25F0.5,
n = 9/20), and 35% (UN1,
n = 7/20) (
Figure 7a). The rates of Grade 1v were similar among all the groups, ranging from 45% to 60%. The rates of Grade 2v were 0% (37F4.0,
n = 0/20), 20% (25F1.0,
n = 4/20), 5% (25F0.5,
n = 1/20), and 20% (UN1,
n = 4/20). The resistance to pin tract infection (Grade 0v:1v:2v ratio) for the 25F1.0 group was significantly lower than that of the 37F4.0 group (
p = 0.0213). It is worth noting that the
p value for the difference in Grade 0v:1v:2v ratio between the 37F4.0 and UN1 groups was markedly lower (
p = 0.0868) than that between the 25F1.0 and UN groups (
p = 0.5361), and between 25F0.5 and UN groups (
p = 0.3494). This suggests that there was no improvement in resistance to pin tract infection for the 25 °C groups compared with the UN1 group (uncoated Ti pins). We carried out another set of animal experiments to compare the 25F2.0 and UN2 groups. The 25F2.0 group showed no improvement in resistance to pin tract infection compared with UN2 group (another uncoated Ti pins) (
Figure 7b).
Figure 6.
Typical appearances of pin tract infections 4 weeks after the operation. (a) Grade 0v: No redness, discharge, or pin loosening; (b) Grade 1v: Redness and discharge around the pin, but no pin loosening; and (c) Grade 2v: Redness and discharge around the pin with pin loosening due to osteomyelitis.
Figure 7.
Percent incidence of Grades 0v, 1v, and 2v pin tract infections determined by visual inspection of the (
a) UN1, 25F0.5, 25F1.0, and 37F4.0 groups; and for the (
b) UN2 and 25F2.0 groups.
![Ijms 15 10252 i001]()
: Grade 0v,
![Ijms 15 10252 i002]()
: Grade 1v,
![Ijms 15 10252 i003]()
: Grade 2v.
* p < 0.05.
2.3. Classification of Inflammation Grade by Histological Observation
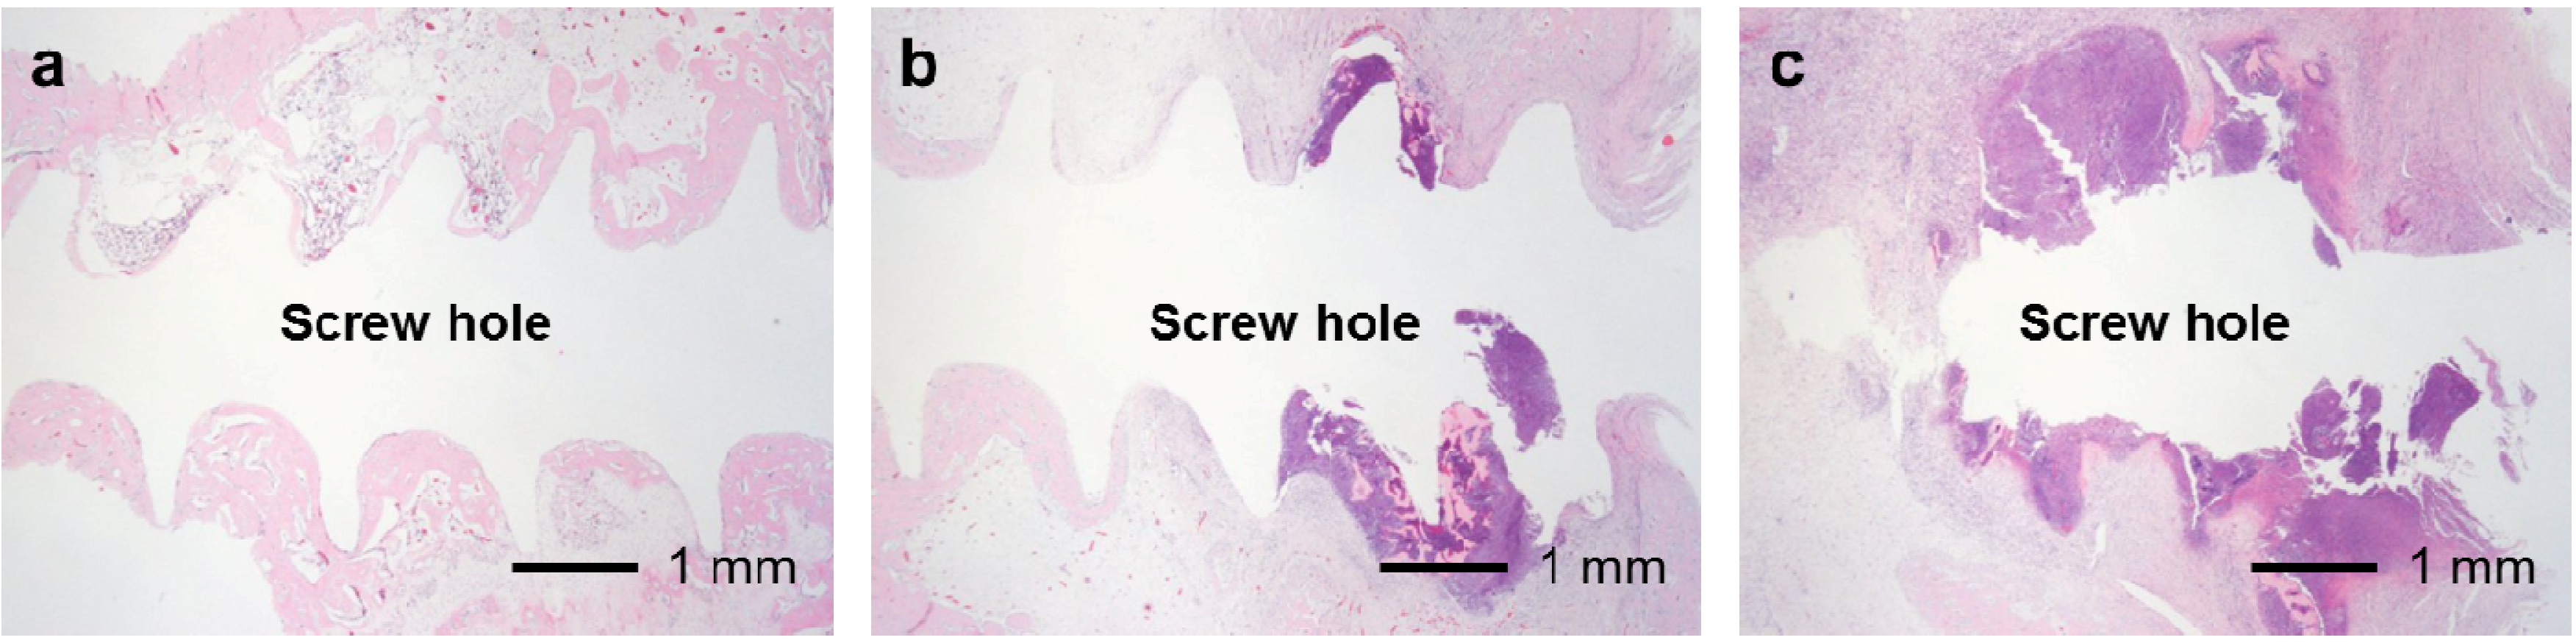
The FGF-2-apatite composite layers on Ti pins fabricated at 25 °C for 1 day showed similar levels of soft tissue inflammation as those fabricated at 37 °C for 2 days. The typical histological appearances for Grades 0s (no inflammation), 1s (partial inflammation), and 2s (severe inflammation) soft tissue inflammation along the pin tract are shown in
Figure 8. The percent incidence of inflammation in the UN1, 25F0.5, 25F1.0, and 37F4.0 groups ranged from 10% to 20% (Grade 0s), 40% to 65% (Grade 1s), and 20% to 45% (Grade 2s). No significant differences were found in the Grade 0s:1s:2s ratios between any pair of the UN1, 25F0.5, 25F1.0, and 37F4.0 groups (
p = 0.2405–0.7962) (
Figure 9a). Similarly, no significant difference was found in the Grade 0s:1s:2s ratio between the UN2 and 25F2.0 groups (
p = 0.5957) (
Figure 9b).
Figure 8.
Typical histological appearances of soft tissue inflammation along the pin tract 4 weeks after the operation. (a) Grade 0s: No inflammation; (b) Grade 1s: Partial inflammation; and (c) Grade 2s: Severe inflammation.
Figure 8.
Typical histological appearances of soft tissue inflammation along the pin tract 4 weeks after the operation. (a) Grade 0s: No inflammation; (b) Grade 1s: Partial inflammation; and (c) Grade 2s: Severe inflammation.
Figure 9.
Percent incidence of Grades 0s, 1s, and 2s pin tract infections determined by histological observation of (
a) the UN1, 25F0.5, 25F1.0, and 37F4.0 groups; (
b) the UN2 and 25F2.0 groups.
![Ijms 15 10252 i001]()
: Grade 0s,
![Ijms 15 10252 i002]()
: Grade 1s,
![Ijms 15 10252 i003]()
: Grade 2s.
The FGF-2-apatite composite layers on Ti pins coated at 25 °C for 1 day failed to reduce inflammation in the bone tissue compared with those coated at 37 °C for 2 days. The typical histological appearances for Grades 0b (no osteomyelitis), 1b (partial osteomyelitis), and 2b (severe osteomyelitis) inflammation in bone tissue along the pin tract are shown in
Figure 10. The incidence rates of Grade 0b were 65% (37F4.0,
n = 13/20), 45% (25F1.0,
n = 9/20), 25% (25F0.5,
n = 5/20), and 30% (UN1,
n = 6/20) (
Figure 11a). The incidence rates of Grade 1b were 30% (37F4.0,
n = 6/20), 40% (25F1.0,
n = 8/20), 70% (25F0.5,
n = 14/20), and 55% (UN1,
n = 11). The rates of Grade 2b were nearly the same among all groups, varying from 5% to 15%. The resistance to pin tract infection in bone tissue (Grade 0b:1b:2b ratio) of the 25F0.5 group was significantly lower than that of the 37F4.0 group (
p = 0.0341). It is worth noting that the
p value for the difference in Grade 0b:1b:2b ratios between the 37F4.0 and UN1 groups was markedly lower (
p = 0.0801) than that between the 25F1.0 and UN1 groups (
p = 0.5846), and between the 25F0.5 and UN1 groups (
p = 0.4841), which suggests that there was no improvement in resistance to pin tract infection in bone tissue for the 25 °C groups compared with the UN1 group. In the second set of animal experiments, the 25F2.0 group showed no improvement in resistance to pin tract infection in bone tissue (Grade 0b:1b:2b ratio) compared with the UN2 group (
p = 0.6225) (
Figure 11b).
Figure 10.
Typical histological appearances of inflammation in the bone tissue along the pin tract 4 weeks after the operation. (a) Grade 0b: No osteomyelitis; (b) Grade 1b: Partial osteomyelitis; and (c) Grade 2b: Severe osteomyelitis.
Figure 10.
Typical histological appearances of inflammation in the bone tissue along the pin tract 4 weeks after the operation. (a) Grade 0b: No osteomyelitis; (b) Grade 1b: Partial osteomyelitis; and (c) Grade 2b: Severe osteomyelitis.
Figure 11.
Percent incidence of Grades 0b, 1b, and 2b osteomyelitis determined by histological observation of (
a) the UN1, 25F0.5, 25F1.0, and 37F4.0 groups; (
b) the UN2 and 25F2.0 groups.
![Ijms 15 10252 i001]()
: Grade 0b,
![Ijms 15 10252 i002]()
: Grade 1b,
![Ijms 15 10252 i003]()
: Grade 2b.
* p < 0.05.
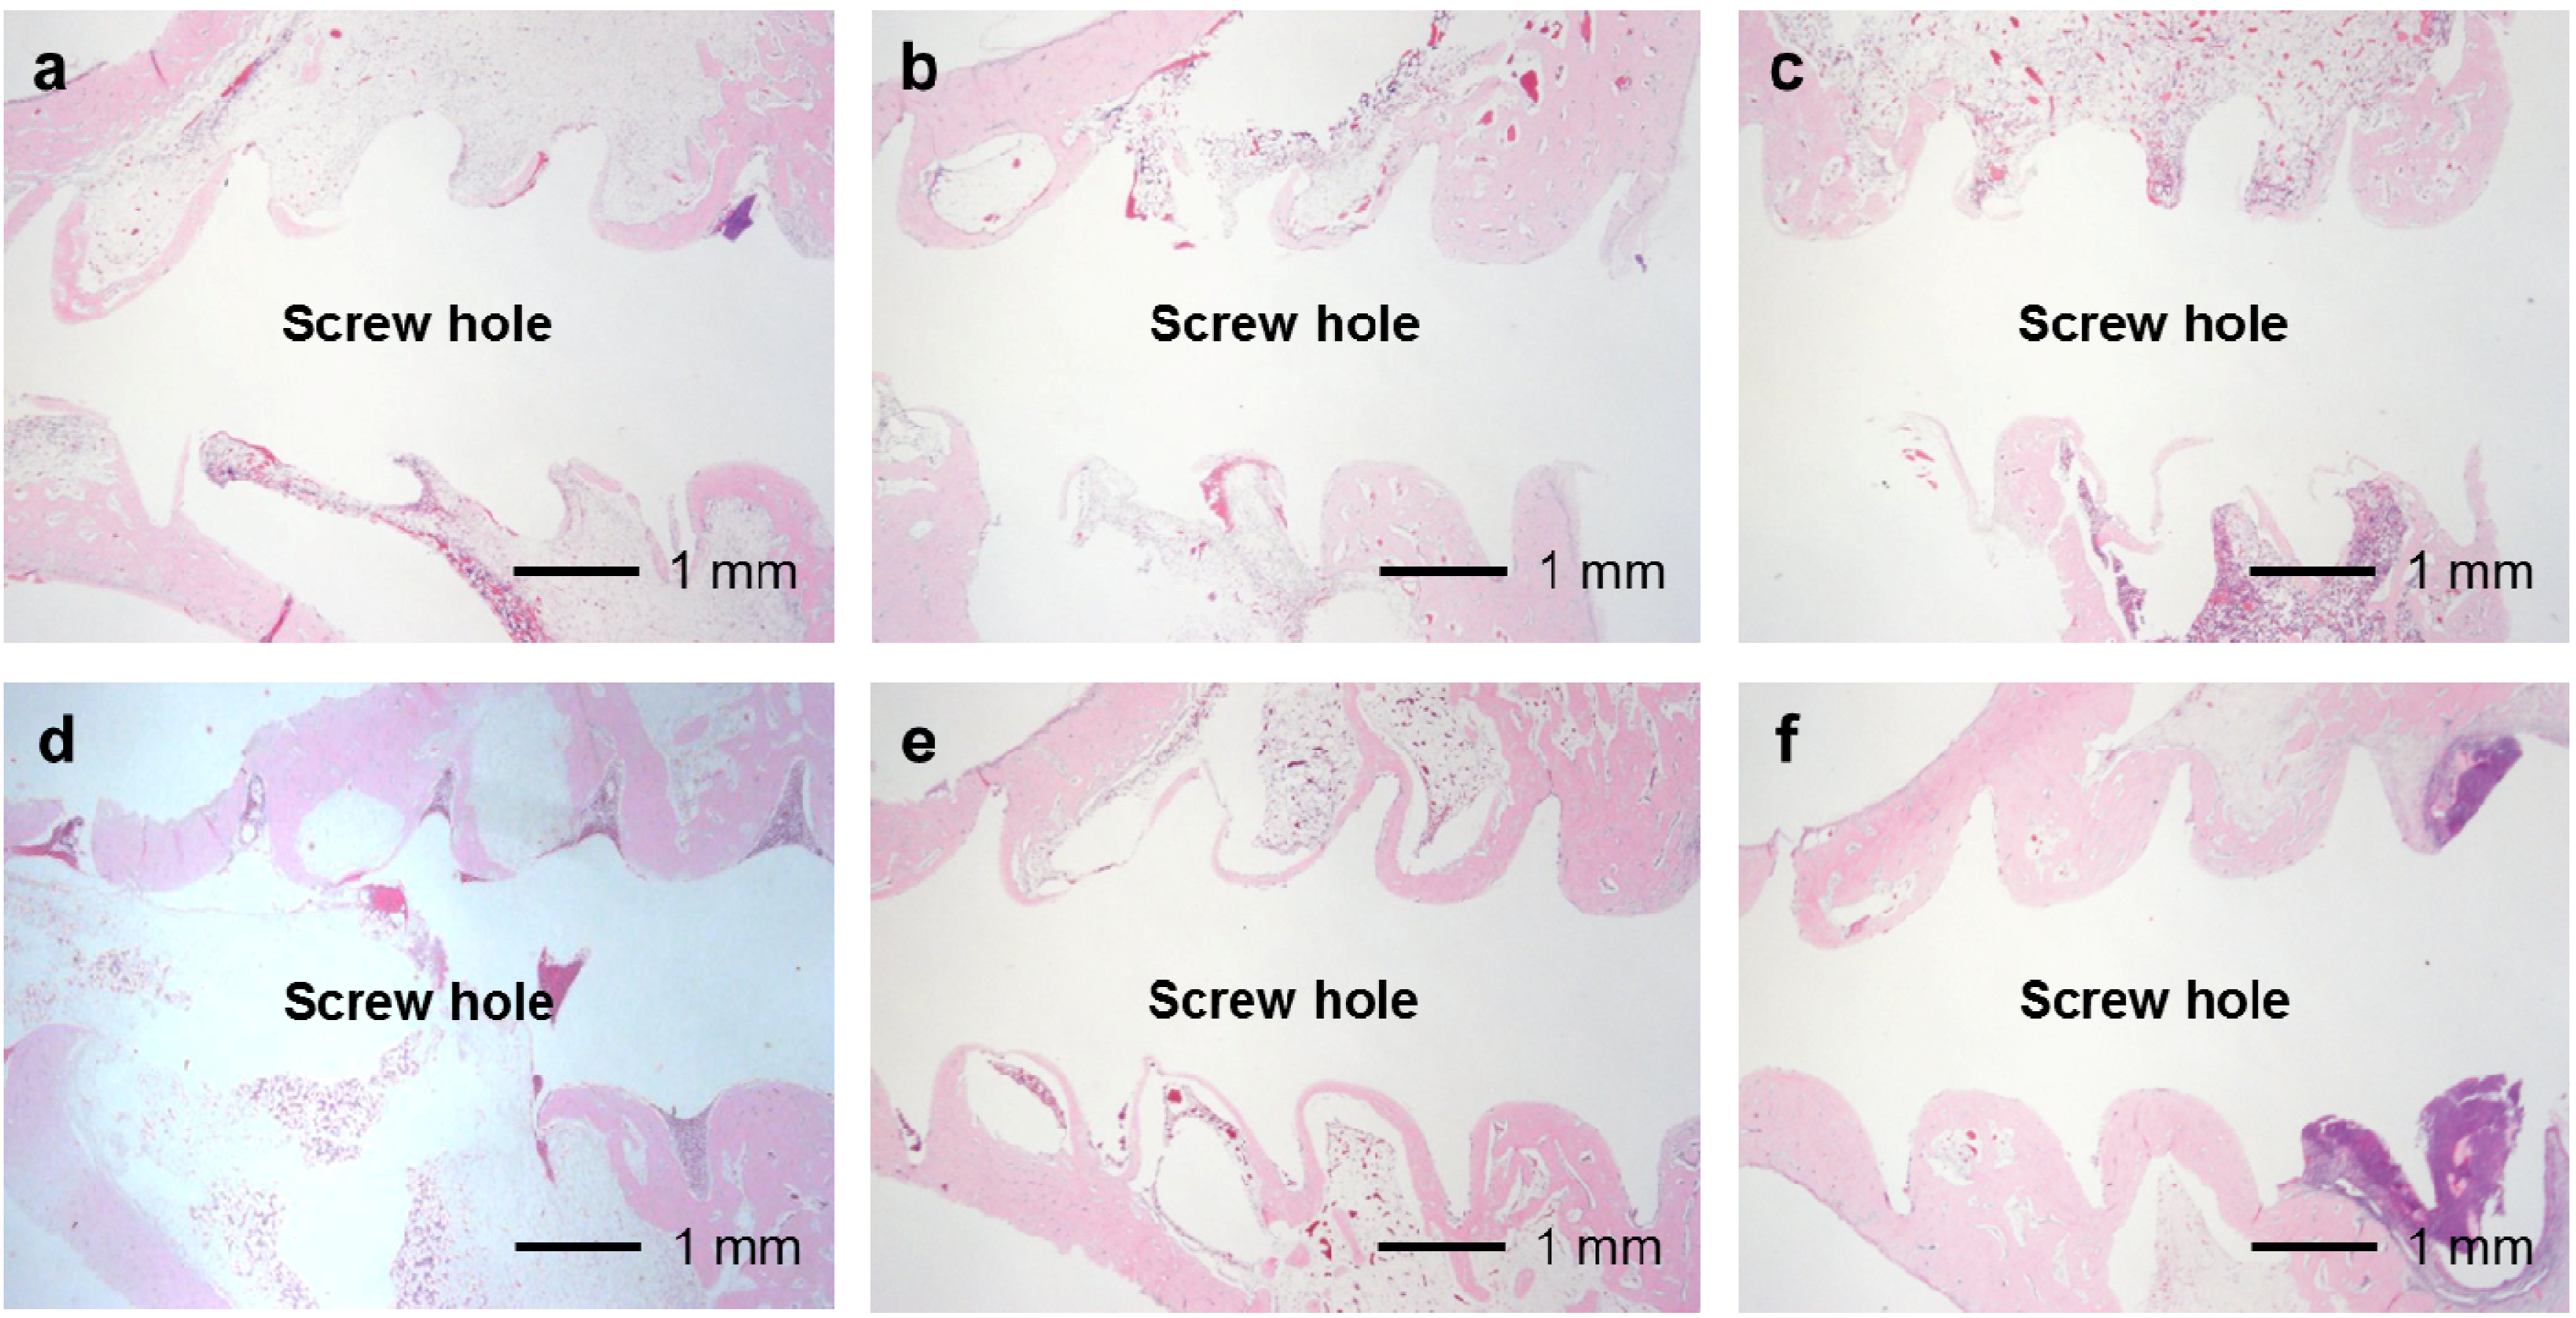
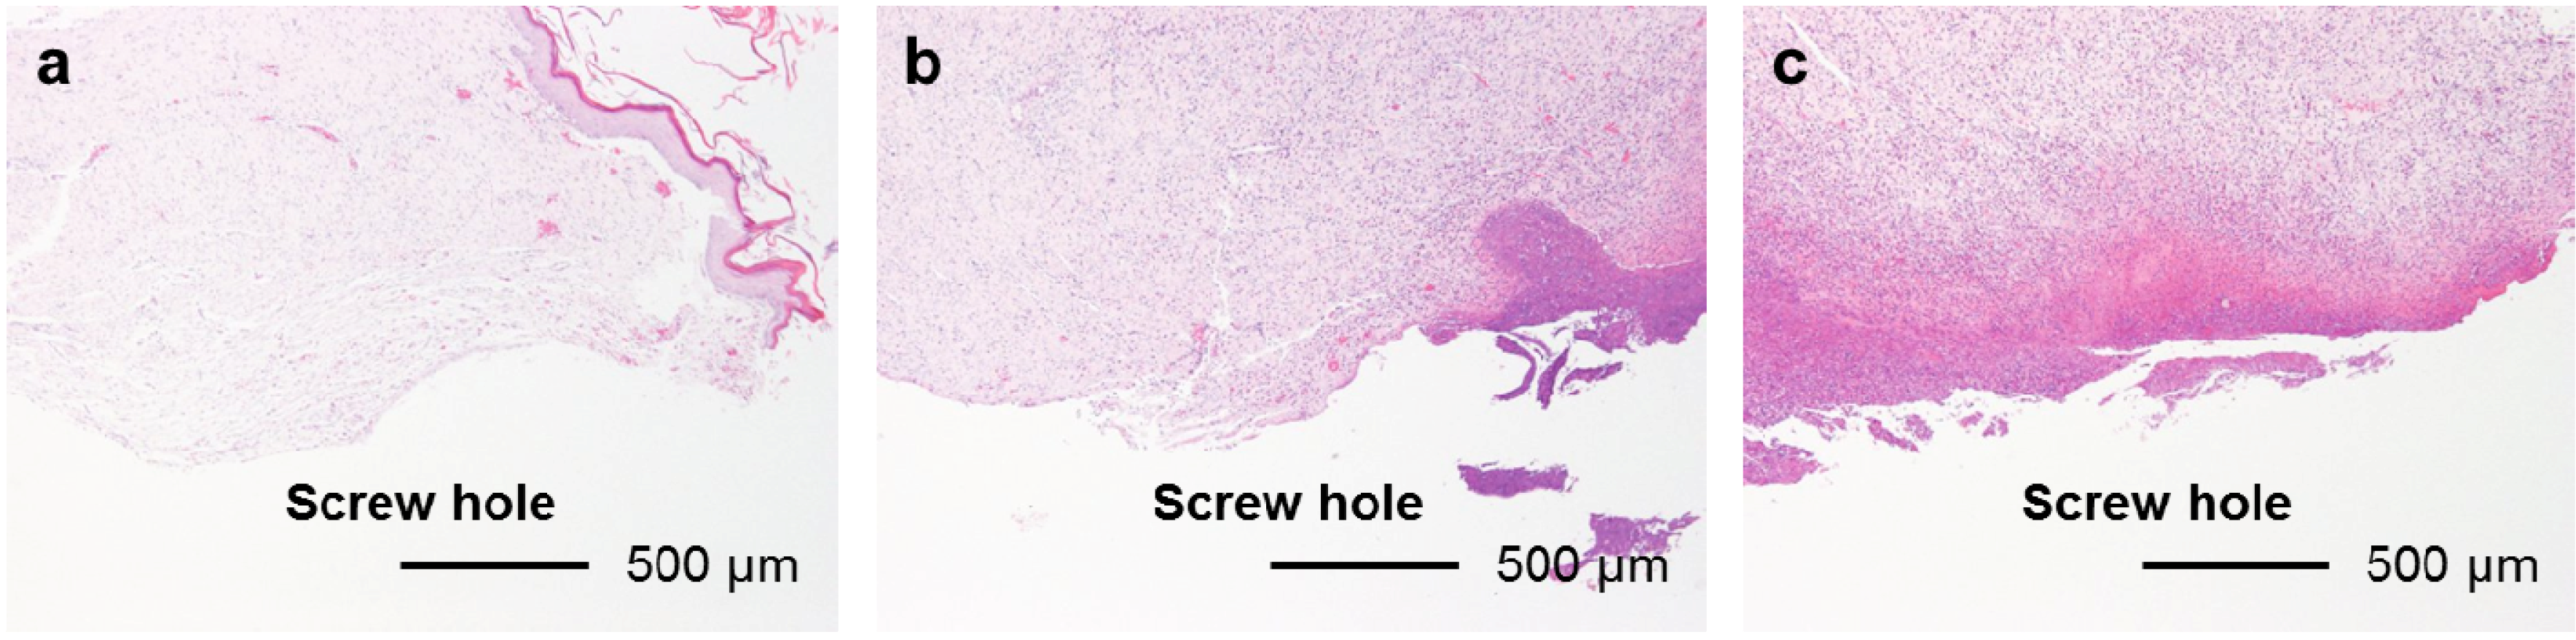
In the UN, 25F0.5, 25F1.0, and 25F2.0 groups, no or very little bone formed in the medullary cavity region in the Grades 0b and 1b osteomyelitis samples. However, in the 37F4.0 group, a considerable amount of dense bone formed in the cortical and medullary cavity regions in the Grades 0b and 1b osteomyelitis samples (
Figure 12).
Figure 12.
Histological sections showing bone formation in the cortical and medullary cavity regions. No or very little bone formed in the medullary cavity regions in the (a) UN1; (b) 25F0.5; (c) 25F1.0; and (d) 25F2.0 groups in the Grade 0b (no osteomyelitis) samples. On the contrary, dense bone formed in the medullary cavity regions in the 37F4.0 group in (e) the Grade 0b and in (f) the Grade 1b (partial osteomyelitis) samples.
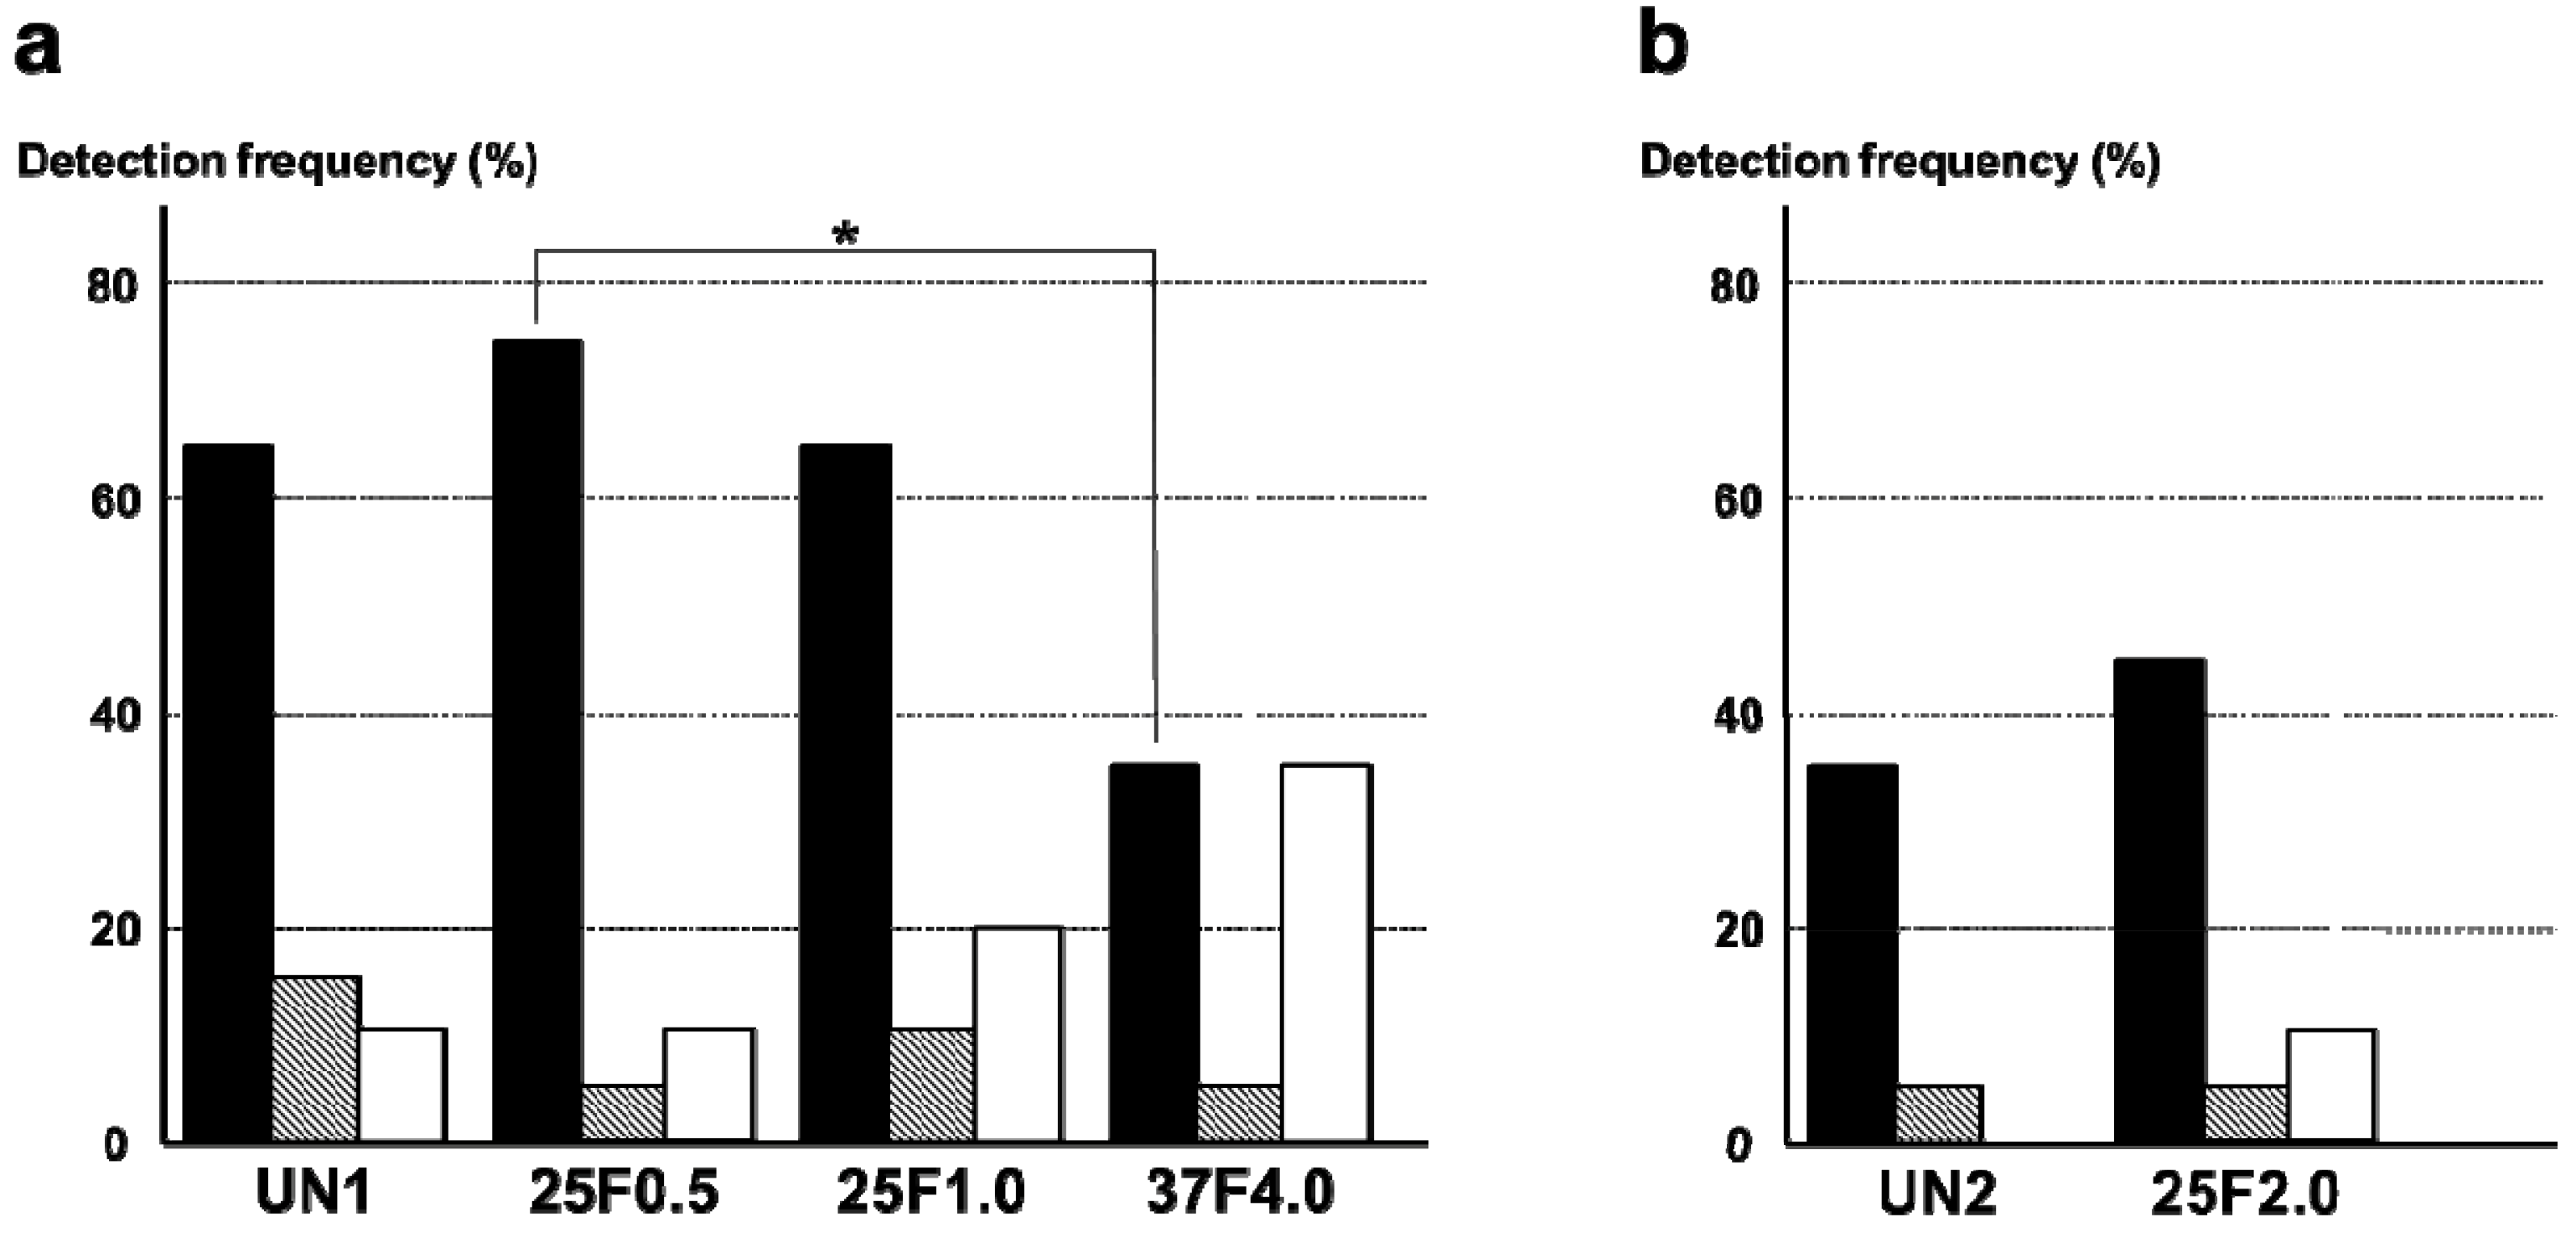
2.4. Bacterial Identification in Pin Tracts
The FGF-2-apatite composite layers on Ti pins fabricated at 25 °C for 1 day were associated with higher frequencies of
S. aureus detected around the pin tract than the FGF-2-apatite composite layers fabricated at 37 °C for 2 days. The most frequently detected bacterium around the pin tracts was
S. aureus. The detection frequency of
S. aureus was significantly lower in the 37F4.0 group (35%) than in the 25F0.5 group (75%,
p = 0.0110). Although no significant difference was detected, the detection frequency of
S. aureus in the 37F4.0 group (35%) was also lower than in the UN1 (65%,
p = 0.0578) and 25F1.0 (65%,
p = 0.0578) groups.
E. coli were also detected in all groups. Their detection frequencies ranged from 5% to 15%, and no significant differences were detected among the UN1, 25F0.5, 25F1.0, and 37F4.0 groups (
p = 0.1489–0.5). The frequency of no bacterial detection tended to be higher for the 37F4.0 group (35%) than the UN1 group (10%,
p = 0.0583) and 25F0.5 group (10%,
p = 0.0583), though no significant differences were detected (
Figure 13a). In the second set of animal experiments, no clear differences were found in the frequency of bacterial detection around the pin tract in the 25F2.0 group compared with the UN2 group (
p = 0.1468–1.0) (
Figure 13b).
Figure 13.
Detection frequencies of
S. aureus and
E. coli around the pin tracts of (
a) the UN1, 25F0.5, 25F1.0, and 37F4.0 groups; (
b) the UN2 and 25F2.0 groups.
![Ijms 15 10252 i001]()
: No bacteria,
![Ijms 15 10252 i002]()
:
E. coli,
![Ijms 15 10252 i003]()
:
S. aureus.
* p < 0.05.
Figure 13.
Detection frequencies of
S. aureus and
E. coli around the pin tracts of (
a) the UN1, 25F0.5, 25F1.0, and 37F4.0 groups; (
b) the UN2 and 25F2.0 groups.
![Ijms 15 10252 i001]()
: No bacteria,
![Ijms 15 10252 i002]()
:
E. coli,
![Ijms 15 10252 i003]()
:
S. aureus.
* p < 0.05.
2.6. Discussion
FGF-2-apatite composite layers were successfully fabricated on Ti pins in one step at 25 °C for 1 day using an infusion fluid-based supersaturated CaP solution containing FGF-2. FGF-2 molecule, and CaP crystals and their precursors including CaP clusters can have a positive or a negative surface charge depending on solution chemistry and pH [
25,
26]. It is expected that FGF-2 interacts with these CaPs when a solution gives opposite electrical charges to FGF-2 and CaPs. Some interaction is also required between Ti and either FGF-2 or the CaPs, or both. The next step would be incorporation of the molecule into the layer by coprecipitation of the molecule and CaPs. Currently, two different mechanisms have been proposed for the process of coprecipitation: one is molecular adsorption followed by crystal nucleation [
27], and the other is molecular incorporation into ACP (amorphous calcium phosphate) followed by amorphous-crystalline transformation [
28]. As a result, FGF-2-apatite composite layers grow on Ti pins gradually. Previously, one-step fabrication of FGF-2-apatite composite layers was only successful at 37 °C. The reductions in fabrication temperature (from 37 to 25 °C) and time (from 2 days to 1 day) in the present study are significant improvements from the viewpoint of clinical application of external fixation. Kinetics of growth of FGF-2-apatite composite layers on Ti pins at 25 °C is yet to be clarified. As for kinetics of growth of FGF-2-free apatite layers on Ti pins under the same condition, growth and evolution of FGF-2-free apatite layers completes between 12 and 24 h, which was revealed by SEM, XRD, energy dispersive X-ray analysis and chemical analysis by inductively coupled plasma (ICP) spectroscopy (data not shown).
Although a correlation is estimated between the FGF-2 concentration of supersaturated CaP solution, and the amounts of FGF-2, Ca and P deposited in the case of 25 °C groups (
Figure 1), the correlation was not statistically significant in the present study; on the contrary, an increased FGF-2 concentration of supersaturated CaP solution even inhibited deposition of Ca and P at 37 °C in the previous study [
17]. It is expected that FGF-2, CaP crystals and/or its precursors can have a positive or a negative surface charge in a solution depending on solution composition and pH.
On the whole, however, the FGF-2-apatite composite layers fabricated at 25 °C for 1 day (groups 25F0.5, 25F1.0, and 25F2.0) were less effective at preventing pin tract infections and loose anchorages than those fabricated at 37 °C for 2 days (37F4.0 group), though these two types of layers had similar microstructure, FGF-2 content, adhesion strength, and characteristics of biological activity of FGF-2. The FGF-2-apatite composite layers fabricated at 37 °C for 2 days demonstrated a preventive effect on pin tract infections, as reported previously [
17]. We intended for the FGF-2-apatite composite layers fabricated at 25 °C to contain a similar amount of FGF-2 as those fabricated at 37 °C because FGF-2 shows a bell-shaped dose response curve in which both deficient and excessive doses elicit a lower response [
29,
30]. While the FGF-2 content (
Figure 2a) and biological activity of the layers fabricated at 25 and 37 °C (
Figure 5) were indeed similar, the composite layers fabricated at 25 °C were less effective at preventing pin tract infections and loose anchorages than those fabricated at 37 °C. This decreased prevention of pin tract infections was evidenced by visual inspection (
Figure 7), histological inspection at the bone tissue (
Figure 11), and bacterial identification (
Figure 13).
The differences in pin tract infection prevention between the FGF-2-apatite composite layers fabricated at 25 and 37 °C may be attributed to differences in the CaP matrix that embeds the FGF-2. In general, CaP matrices of signal molecule-CaP composite layers fabricated by similar processes include low-crystalline apatite [
17,
31,
32], amorphous calcium phosphate (ACP) [
33], octacalcium phosphate (OCP), and/or an OCP-like phase [
34]. The theoretical Ca/P molar ratios are 1.67 for apatite, 1.50 for ACP, and 1.33 for OCP. In the present study, the Ca/P molar ratio of the FGF-2-apatite composite layers fabricated at 25 °C was 1.55–1.56 and at 37 °C was 1.67 ± 0.11 (
Figure 2b). Thus, the molar ratio of the FGF-2-apatite composite layers fabricated at 25 °C corresponds more or less to ACP or contains ACP, while that of those fabricated at 37 °C corresponds to apatite. Because ACP is an amorphous phase that is only weakly detected by XRD, the XRD study (
Figure 3) does not rule out the presence of ACP in the layer. ACP is more soluble and less stable than apatite in the physiological environment. This difference in CaP matrix stability may affect the release rate of FGF-2, leading to differences in tissue regeneration due to the dose-dependent FGF-2 response, and eventually altering the prevention of pin tract infections. In other words, the change in Ca/P molar ratio caused a change in optimum FGF-2 content of the layer. It is known that elevated doses of FGF-2 can inhibit bone formation [
29]. The differences in CaP matrix stability also can affect bone apposition through differences in the matrix resorption rate. No matter what the controlling mechanism is, the difference in CaP matrix stability may explain the observed result that while some amount of dense bone formed in the cortical and medullary cavity regions in the 37F4.0 group even in the presence of partial osteomyelitis, no or very little bone formed in the medullary cavity regions in the 25F0.5 and 25F1.0 groups (
Figure 12). The less bone that forms, the higher the risk of infection, caused by loose anchorages, becomes.
Two limitations of the present study are that the animal experiments were performed in two sets and different analytical methods were used to determine the Ca/P molar ratios in the present and previously reported 37F4.0 groups. The two different sets of animal experiments make direct comparisons between the 25F2.0 group and other groups difficult. The previously reported method for determining Ca/P molar ratios was X-ray photoelectron spectrometry (XPS) [
17], which is different than the ICP spectroscopy used in the present study. Because the ICP technique is more accurate than the XPS technique, ICP was used here. The previously reported Ca/P molar ratio for the 37F4.0 group measured by XPS was 1.54 ± 0.11 (
n = 3) [
17], while a value of 1.67 ± 0.11 (
n = 8) was obtained by the ICP technique in the present study.
Further optimization of the fabrication parameters is needed to reduce the bacterial infection rate and improve the fixation strength at the bone-pin interface for the FGF-2-apatite composite layers prepared at 25 °C. We plan to explore for another fabrication condition under which FGF-2-apatite composite layers with a Ca/P molar ratio at around 1.67 and having higher chemical stability is fabricated at 25 °C, and to carry out comparative studies on FGF-2 release, biological activity of FGF-2,
in vivo efficacy in preventing pin tract infection, and dissolution and resorption of the layers in order to unambiguously clarify the effect of CaP matrix stability. The fabrication conditions to be optimized include solution compositions, and the FGF-2 content of the supersaturated CaP solution. Theoretically, solution compositions that have a higher Ca/P molar ratio and a lower supersaturation can accelerate the crystallization of ACP into apatite [
35,
36,
37]. The addition of FGF-2 to the supersaturated CaP solution in the present study increased the Ca/P molar ratio of the layer compared with the layer fabricated in the supersaturated CaP solution containing no FGF-2 [
24], which indicates that the FGF-2 content of the supersaturated CaP solution itself affects the stability of the layer, but further study of this phenomenon is needed.


 : Grade 0v,
  : Grade 1v,
  : Grade 2v. * p < 0.05.


