Communication

Association of TNFRSF10D DNA-Methylation with the Survival of Melanoma Patients

1
Department of Dermatology and Venereology, Innsbruck Medical University, Innsbruck 6020, Austria
2
Department of Obstetrics and Gynecology, Innsbruck Medical University, Innsbruck 6020, Austria
3
Department of Medical Statistics, Informatics and Health Economics, Innsbruck Medical University, Innsbruck 6020, Austria
4
Oncotyrol, Center for Personalized Cancer Medicine, Innsbruck 6020, Austria
*
Authors to whom correspondence should be addressed.
These authors contributed equally to this work.
Int. J. Mol. Sci. 2014, 15(7), 11984-11995; https://doi.org/10.3390/ijms150711984
Submission received: 1 May 2014 / Revised: 30 June 2014 / Accepted: 1 July 2014 / Published: 7 July 2014
(This article belongs to the Section Molecular Pathology, Diagnostics, and Therapeutics)

Abstract

:
In this retrospective pilot study, the DNA-methylation status of genes that have been demonstrated to be involved in melanoma carcinogenesis was analyzed in order to identify novel biomarkers for the risk assessment of melanoma patients. We analyzed DNA extracted from punch-biopsies from 68 formalin-fixed paraffin-embedded (FFPE) melanoma specimens. Using MethyLight PCR, we examined 20 genes in specimens from a training set comprising 36 melanoma patients. Selected candidate genes were validated in a test set using FFPE tissue samples from 32 melanoma patients. First, we identified the TNFRSF10D DNA-methylation status (TNFRSF10D methylated vs. unmethylated) as a prognostic marker for overall (p = 0.001) and for relapse-free survival (p = 0.008) in the training set. This finding was confirmed in the independent test set (n = 32; overall survival p = 0.041; relapse-free survival p = 0.012). In a multivariate Cox-regression analysis including all patients, the TNFRSF10D DNA-methylation status remained as the most significant prognostic parameter for overall and relapse-free survival (relative-risk (RR) of death, 4.6 (95% CI: 2.0–11.0; p < 0.001), RR of relapse, 7.2 (95% CI: 2.8–18.3; p < 0.001)). In this study, we demonstrate that TNFRSF10D DNA-methylation analysis of a small tissue-punch from archival FFPE melanoma tissue is a promising approach to provide prognostic information in patients with melanoma.

1. Introduction

The incidence of melanoma is increasing in white populations worldwide [1]. In advanced disease, median survival is very poor. Melanomas account for 90% of the deaths associated with cutaneous neoplasms [1]. The five-year risk of death of patients with advanced (Stage IV) disease is about 80% [2]. Thus, the recognition of patients at risk for progression is crucial. The most relevant prognostic factors for primary melanoma without metastases are vertical tumor thickness (Breslow’s depth) and the presence or absence of histological ulceration; to a lesser extent, also mitotic activity and invasion level (Clark’s level). However, clinical experience demonstrates that some patients with thin neoplasms face recurrence, metastases and death after surgical excision, while others with thick melanomas do not. New prognostic markers, such as metallothionines or genetic subtypes defined by gene expression profiling, have been established; however, additional reliable markers to select patients for early therapy are still lacking [3,4]. Besides genetic alterations, changes in the status of DNA-methylation, a type of epigenetic alteration, are among the most common molecular alterations in human neoplasia, including melanoma [5,6,7,8,9]. Irreversible silencing of certain genes by DNA-methylation might enable cells to acquire new capabilities that may drive tumorigenesis. Here, we analyzed the DNA-methylation status of the 5' regions of 20 different genes that are involved in melanoma carcinogenesis and that have previously been shown to be aberrantly methylated in melanoma [7,9,10,11,12,13,14,15,16,17] or other human cancers [18].
In the present pilot study, we aimed to explore whether differences in the DNA-methylation pattern from formalin-fixed paraffin-embedded (FFPE) tissues may be useful as a prognostic marker for the further outcome of non-metastatic melanoma patients.

2. Results and Discussion

2.1. Training Set for Selection of Relevant Genes

Using MethyLight PCR, we analyzed 20 genes that have been demonstrated to be involved in melanoma tumorigenesis (APC, CDH13, CDKN2A, CYP1B1, ENC1, ESR1, LOX, MAGEA1, MIR34A, PPP1R3C, PYCARD, RARB, RARRES1, RASSF1, SFN, SOCS1, TIMP3, TNFRSF10C, TNFRSF10D and TP73) [7,9,10,11,12,13,14,15,16,17,18] from FFPE tissue punches of 36 patients (training set). Association analysis between clinicopathological features, sex, age and methylation status of the analyzed genes revealed no significant differences. Only MAGE1A showed higher DNA-methylation values (the percentage of fully methylated reference, PMR) in women (p = 0.001). In this set, we identified age, the Clark level, ulceration, tumor thickness, mitotic rate and TNFRSF10D DNA-methylation status (TNFRSF10D methylated vs. unmethylated) as univariate prognostic markers for overall survival (p = 0.049, 0.001, 0.015, 0.008, 0.026 and 0.001). The Clark level, ulceration, tumor thickness and TNFRSF10D methylation status were found as univariate prognostic markers for relapse-free survival (p < 0.001, 0.046, 0.008, 0.008; Table 1A).

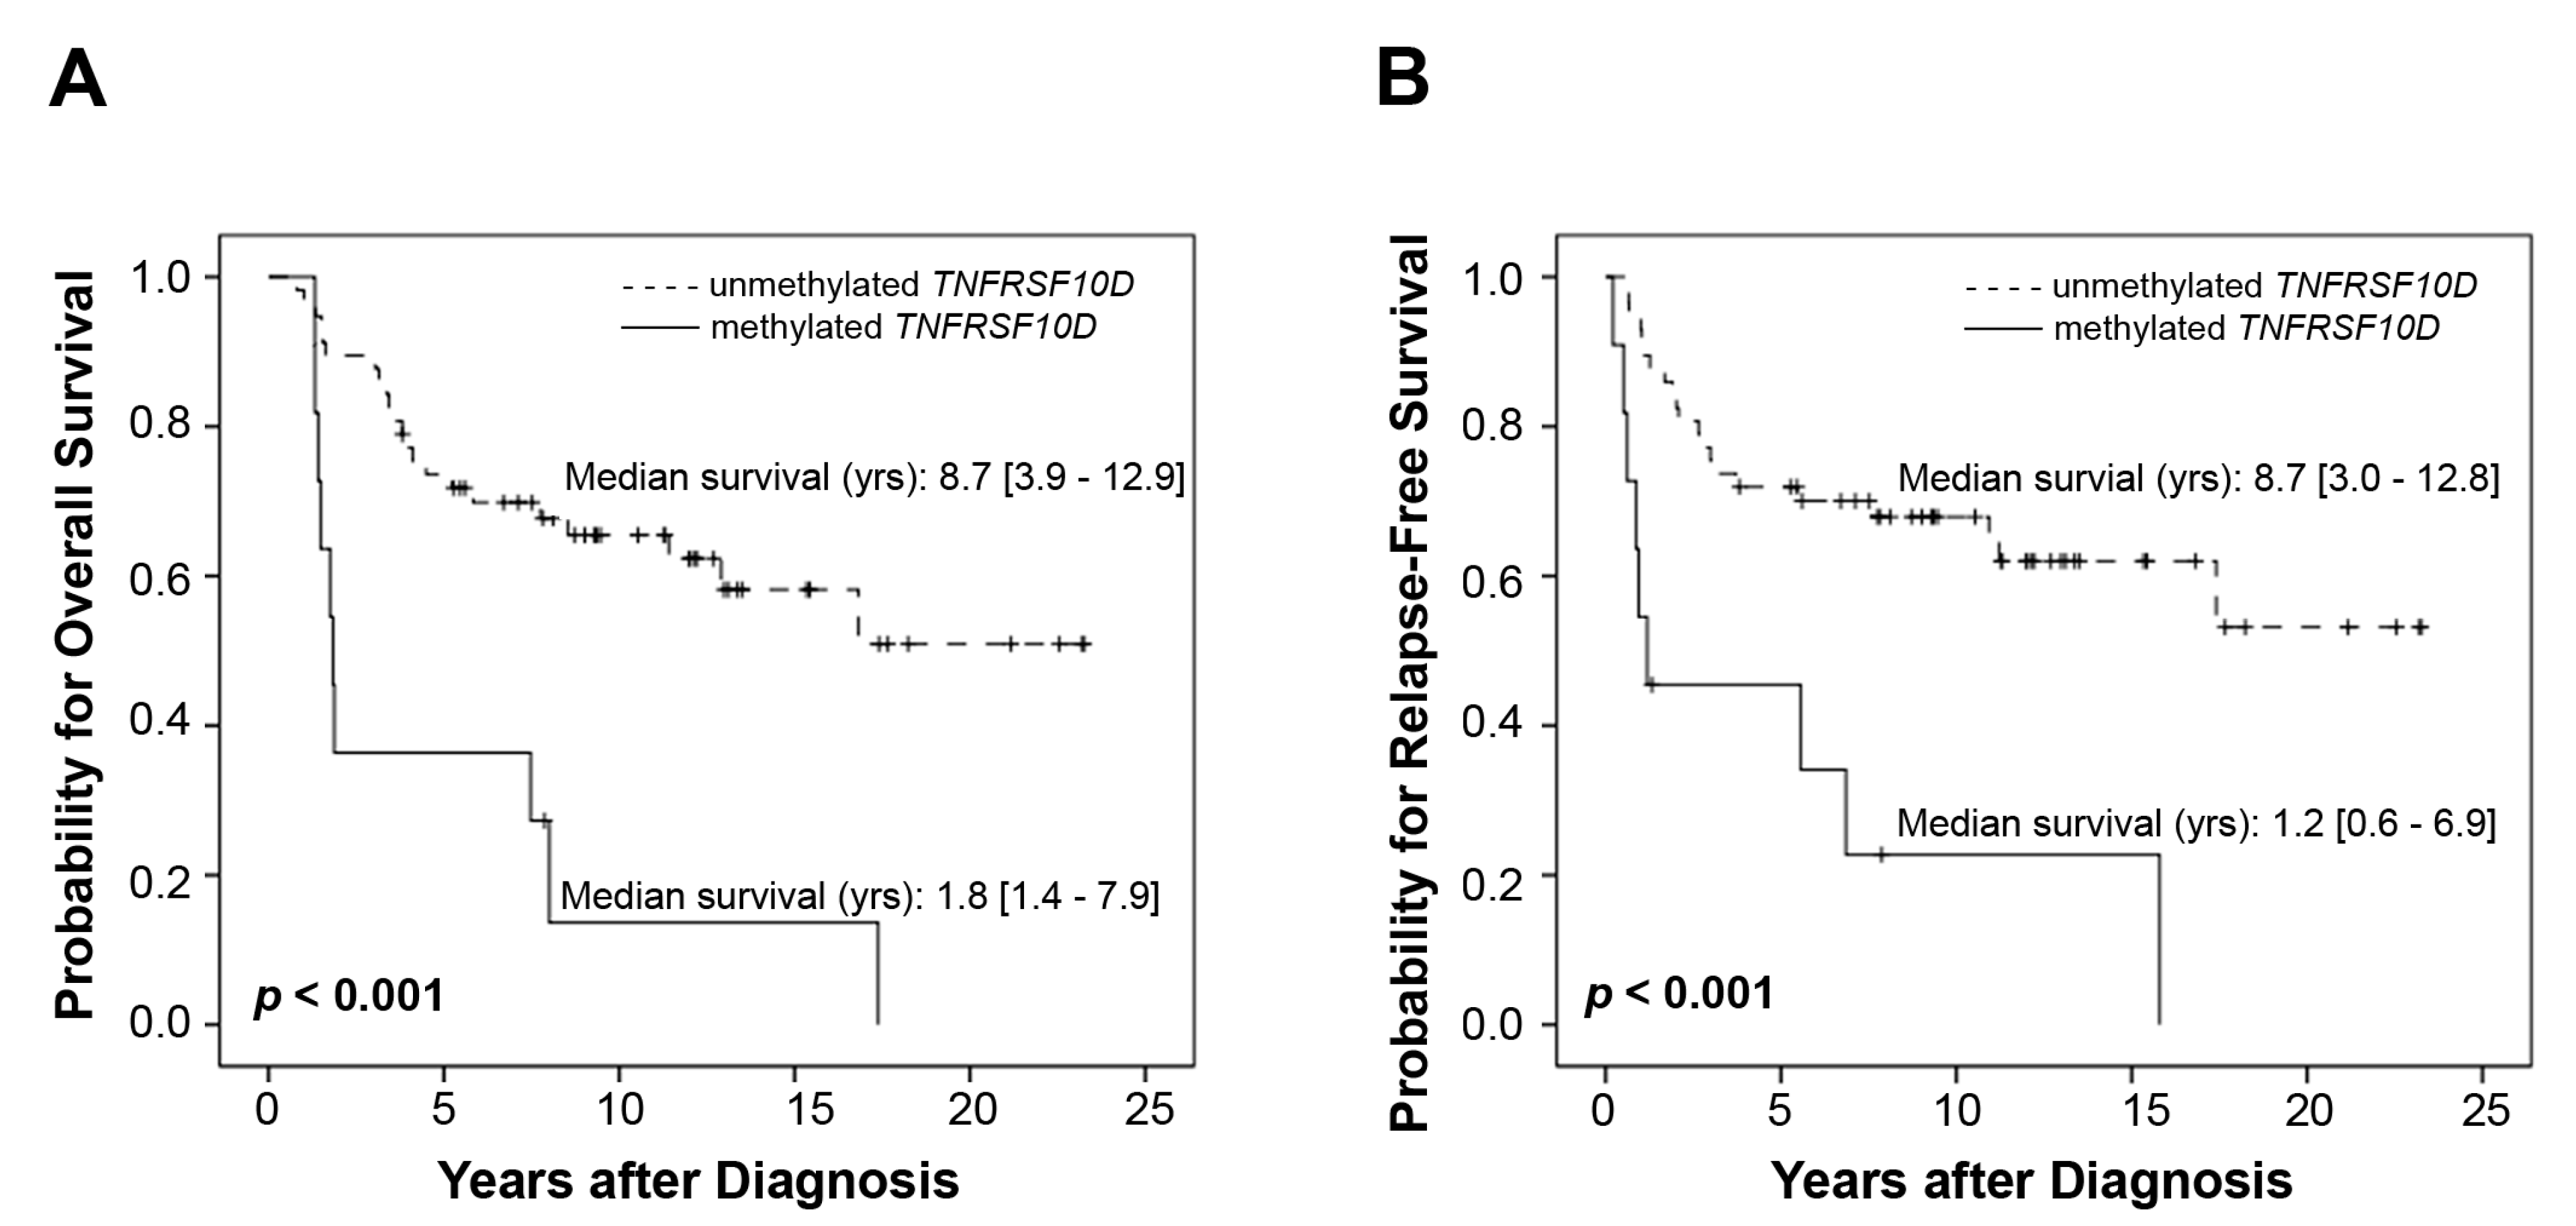
2.2. Test Set for the Validation of Relevant Genes

For validation of the results obtained with the training set, we analyzed the TNFRSF10D DNA-methylation status in an independent test set consisting of FFPE tissues of 32 melanoma patients. Furthermore, in this analysis, TNFRSF10D DNA-methylation was confirmatively shown to be highly significantly associated with a poor overall and relapse-free survival (p = 0.041 and p = 0.012, respectively; Table 1B).
Table 1. Univariate survival analysis in melanoma patients. (A) Training set; (B) Test set; (C) Overall samples. Significant p-values in bold.
(A) Training Set
VariableOverall SurvivalRelapse-Free Survival
No. Patients (Died/Total)p-Value (Log-Rank-Test)No. Patients (Relapsed/Total)p-Value (Log-Rank-Test)
Sex
 Male12/240.71211/240.717
 Female5/12 5/12
Age
 <609/240.04910/240.239
 ≥608/12 6/12
Clark level
 2/34/110.0013/11<0.001
 49/21 9/21
 54/4 4/4
Ulceration
 No7/220.0157/220.046
 Yes10/14 9/14
Tumor thickness
 ≤2 mm (T1/T2)5/130.0086/130.008
 2.01–4 mm (T3)2/8 1/8
 ≥4.01 mm (T4)10/15 9/15
Mitotic rate
 ≤1/mm23/120.0263/120.052
 >1/mm214/24 13/24
Interferon alpha therapy
 No15/280.30214/280.374
 Yes2/8 2/8
TNFRSF10D
 Unmethylated11/290.00111/290.008
 Methylated6/7 5/7
(B) Test Set
Sex
 Male5/120.9295/120.98
 Female10/20 9/20
Age
 <607/220.0037/220.031
 ≥608/10 7/10
Clark level
 2/33/7<0.0013/7<0.001
 46/18 5/18
 56/6 6/6
Ulceration
 No11/230.88710/230.942
 Yes4/9 4/9
Tumor thickness
 ≤2 mm (T1/T2)5/120.9195/120.992
 2.01–4 mm (T3)7/13 6/13
 ≥4.01 mm (T4)2/5 2/5
Mitotic rate
 ≤1/mm26/180.0776/180.141
 >1/mm29/14 8/14
Interferon alpha therapy
 No9/240.0038/240.002
 Yes6/8 6/8
TNFRSF10D
 Unmethylated11/280.04110/280.012
 Methylated4/4 4/4
Sex
 Male17/360.68316/360.734
 Female15/32 14/32
Age
 <6016/46<0.00113/220.013
 ≥6016/22 23/74
Clark level
 2/37/18<0.0016/180.011
 415/39 14/39
 510/10 10/10
Ulceration
 No18/450.08517/450.116
 Yes14/23 13/23
Tumor thickness
 ≤2 mm (T1/T2)10/250.08411/250.113
 2.01–4 mm (T3)9/21 7/21
 ≥4.01 mm (T4)12/20 11/20
Mitotic rate
 ≤1/mm29/300.0059/300.012
 >1/mm223/38 21/38
Interferon alpha therapy
 No24/520.26122/520.24
 Yes8/16 8/16
TNFRSF10D
 Unmethylated22/57<0.00121/57<0.001
 Methylated10/11 9/11

2.3. Overall Prognostic Significance Merging the Training and the Test Set

The comprehensive univariate analysis of all 68 patients together identified age (<60 vs. ≥60), the Clark level, mitotic rate and TNFRSF10D DNA-methylation status as prognostic parameters for poor overall survival (p < 0.001, <0.001, 0.005, <0.001; Table 1C), as well as for poor relapse-free survival (p = 0.013, 0.011, 0.012, <0.001; Table 1C). The Kaplan–Meier survival analysis for TNFRSF10D DNA-methylation is depicted in Figure 1.
Figure 1. Kaplan–Meier survival analysis: (A) the overall survival and (B) relapse-free survival of 68 melanoma patients.
Ijms 15 11984 g001
Finally, we analyzed all patients, including the variables, sex, age, Clark level, presence of ulceration, tumor thickness, interferon alpha therapy and TNFRSF10D DNA-methylation status, using a multivariate Cox regression model. The TNFRSF10D DNA-methylation status remained the most significant prognostic parameter for overall and relapse-free survival. Patients with methylated TNFRSF10D showed a 4.6-fold higher risk of death (95% CI: 2.0–11.0; p < 0.001) and a 7.2-fold higher risk of relapse (95% CI: 2.8–18.3; p < 0.001) than patients with unmethylated TNFRSF10D (Table 2). After exclusion of a subgroup of 16 patients, who received an adjuvant interferon alpha therapy, TNFRSF10D DNA-methylation still remained the highest significant prognostic parameter in the multivariate analysis for overall (p = 0.004) and relapse-free survival (p = 0.001).
Table 2. Multivariate survival analysis of 68 melanoma patients. RR, relative-risk. Significant p-values in bold.
VariableOverall SurvivalRelapse-Free Survival
RR of Death (95% CI)p-ValueRR of Relapse or Progression (95% CI)p-Value
Sex
 Male0.5 (0.2–1.6)0.110.4 (0.2–0.9)0.03
 Female
Age
 <602.1 (0.9–4.6)0.071.6 (0.75–4.1)0.20
 ≥60
Clark level
 2/33.0 (1.6–5.9)0.0014.9 (2.4–10.1)<0.001
 4
 5
Ulceration
 No1.4 (0.6–3.5)0.471.1 (0.5–2.8)0.78
 Yes
Tumor thickness
 ≤2 mm (T1/T2)0.9 (0.6–1.6)0.820.8 (0.5–1.3)0.39
 2.01–4 mm (T3)
 ≥4.01 mm (T4)
Mitotic rate
 ≤1/mm21.4 (0.5–3.9)0.491.6 (0.6–4.5)0.37
 >1/mm2
Interferon alpha therapy
 No2.2 (0.8–5.9)0.112.7 (1.1–7.5)0.03
 Yes
TNFRSF10D
 Unmethylated4.6 (2.0–11.0)<0.0017.2 (2.8–18.3)<0.001
 Methylated

2.4. Discussion

The prognostic biomarkers currently used in melanoma do not adequately predict disease recurrence and overall survival in a significant subset of patients. Therefore, novel biomarkers are highly required to overcome these problems.
In this pilot study, we identified TNFRSF10D DNA methylation status in paraffin-embedded melanoma tissues to be an independent prognostic biomarker for relapse-free survival and overall mortality in non-metastatic melanoma patients. Surprisingly, ulceration and tumor thickness were significantly associated with survival only in the training set, whereas the invasion level (Clark’s level) was a significant, prognostic feature consistently in all analyses performed in this work. Due to the small sample size of this pilot study, a subsequent validation study in a larger, independent patient cohort must be performed. In our study, the prognostic value of TNFRSF10D concerns mainly the group of patients with methylated TNFRSF10D in the tumors. Recently, TNFRSF10D DNA-methylation has also been shown to be an independent prognostic and predictive marker in the serum of patients with MYCN nonamplified neuroblastoma [19]. Interestingly, recently published data indicated that TNFRSF10D is epigenetically silenced in human melanoma [9,16], as well as in cancers of breast, lung, mesothelioma, prostate, bladder, cervix, ovary, brain and in hematopoietic malignancies [20]. Bonazzi et al. found that 72% of the analyzed melanoma cell lines had no TNFRSF10D mRNA expression and that the transcript level of TNFRSF10D was correlated inversely with promoter methylation [16]. They identified that 66% of the analyzed cell lines and 30% of the analyzed fresh frozen melanoma samples showed a high degree of methylation. In our study, we identified TNFRSF10D DNA-methylation in only 16% of all analyzed specimens. This discrepancy probably reflects the different levels of TNFRSF10D DNA-methylation in melanoma cell lines, metastatic tumor tissues and primary tissues. Bonazzi et al. observed a five-fold average increase in TNFRSF10D mRNA expression in five melanoma cell lines after treatment with the DNA-demethylating agent, 5-aza-2'-deoxycytidine [16]. TNFRSF10D belongs to the tumor necrosis factor (TNF) receptor superfamily. This receptor contains an extracellular tumor necrosis factor-related apoptosis-inducing ligand (TRAIL) binding domain, a transmembrane domain and a truncated cytoplasmic death domain. The second known TRAIL decoy receptor, TNFRSF10C, lacks this intracellular death domain completely. Therefore, both receptors appear unable to induce apoptosis. Considering that TNFRSF10D, as well as TNFRSF10C have been presumed to function as oncogenes, because of their postulated anti-apoptotic effect [20], our data seem to be controversial at first sight. However, recently, Venza et al. have shown that an ectopic overexpression of TNFRSF10C and/or TNFRSF10D in melanoma cell lines led to a significant reduced growth rate and a clear increased apoptotic response [21]. In the context of our data, it seems that the methylation and silencing of TNFRSF10D may represent a special feature of more aggressive cancer cells.

3. Experimental Section

3.1. The Patient Study Cohort and Study Design

We retrospectively analyzed prospectively collected melanoma specimens (FFPE tissues) from melanoma patients treated at the Department of Dermatology and Venereology, Innsbruck Medical University, Innsbruck, Austria. Samples have been collected during primary surgery. Sixty-eight patients (32 women and 36 men) diagnosed between 1983 and 2004 with primary, invasive, non-metastasized melanoma were included in this study (T1–T4, tumor-node-metastasis (TNM) classification American Joint Committee of Cancer 2001). Patients had no metastases at the time of diagnosis or surgery, respectively. Thirty-four melanomas were located on the trunk, 34 on the limbs. The tumor thickness was 0.5–2 mm (T1/T2), 2.01–4 mm (T3) and >4 mm (T4) in 25, 23 and 18 patients, respectively; tumor thickness was unknown in two patients. Twenty-three patients showed ulcerated melanomas. All patients underwent surgery with 1–2 cm excision margins, according to standard guidelines, and 16 patients received adjuvant interferon alpha. The median age was 53.4 years (21.9–90.7 years). Thirty and 32 patients relapsed/died, respectively, due to the consequences of the melanoma after a median follow up period of 2.0 (interquartile (IQ)-range 6.2) and 3.4 (IQ-range 5.5) years, respectively. The patient study cohort was a priori randomly split into a training and a test set, consisting of 36 and 32 patients, respectively. The study was approved by the local medical research ethics committee (Reference Number UN3856, 26 January 2010) and conducted in accordance with the Declaration of Helsinki. Reporting Recommendations for Tumor Marker Prognostic Studies (REMARK) were adhered to where applicable [22,23].

3.2. DNA Extraction and Bisulfite Conversion from Formalin-Fixed Paraffin-Embedded (FFPE) Tissues

DNA was isolated from punches gained from FFPE melanoma specimens using the DNeasy Tissue Kit (Qiagen, Hilden, Germany) in order to assure that mainly melanoma tissue was collected.
Sodium bisulfite-modification of genomic DNA (700 ng) was performed using the EZ DNA Methylation-Gold Kit (Zymo Research, Orange, CA, USA), according to the manufacturer’s instructions.

3.3. DNA Methylation Analysis

Thirty nanograms of bisulfite-modified DNA were analyzed by means of MethyLight analysis, as described previously [24]. Briefly, two sets of primers and probes, designed specifically for bisulfite-converted DNA, were used: a set representing fully methylated DNA for the gene of interest and a reference set, collagen, type II, alpha 1 (COL2A1), to normalize for input DNA. Primers and probes for APC, COL2A1, CDH13, CDKN2A, CYP1B1, ENC1, ESR1, LOX, MAGEA1, MIR34A, PYCARD, PPP1R3C, RARB, RARRES1, RASSF1, SFN, SOCS1, TIMP3, TNFRSF10C, TNFRSF10D and TP73 are listed in Tables S1 [25,26].
To control for the amount of input bisulfite-modified DNA, this value was normalized to the extent of amplification of a COL2A1 DNA sequence lacking CpG dinucleotides. The specificity of the reactions for methylated DNA was confirmed separately using SssI (New England Biolabs, Ipswich, MA, USA)-treated human white blood cell DNA (heavily methylated). The SssI treated DNA was additionally used for the standard curve preparation, which is required for the quantification. The percentage of fully methylated molecules at a specific locus was calculated by dividing the GENE:COL2A1 ratio of a sample by the GENE:COL2A1 ratio of SssI-treated white blood cell DNA and multiplying by 100 (the percentage of fully-methylated reference, PMR). PMR values have been calculated for all analyzed genes. If less than 50% of the samples were methylated for a specific gene (a gene was deemed methylated if the PMR value was >0), we categorized the samples in “unmethylated” and “methylated” and performed the analyses with these dichotomized variables. Only in 3 genes were more than 50% of the samples methylated (ESR1, SFN and MAGE1). For these genes we used the PMR values for the following statistical analysis.

3.4. Mitotic Rate

The mitotic rate per square millimeter of tumor tissue was evaluated by counting mitotic figures on hematoxylin and eosin (H&E)-stained tissue sections.

3.5. Statistical Analysis

Disease-free and overall survival were calculated from the date of diagnosis to the date of relapse, death or last follow-up. Disease-free and overall survival curves were calculated with the Kaplan–Meier method. Univariate analysis of overall survival according to clinicopathological factors (age, Clark-level, tumor thickness, presence of ulcerations, etc.) or DNA-methylation status was performed using a two-sided log rank test. A multivariate Cox proportional hazards model was applied to estimate the prognostic effect of TNFRSF10D DNA-methylation. A p-value <0.05 was considered statistically significant. SPSS 19.0 was used for all statistical analyses (SPSS Inc., Chicago, IL, USA).

4. Conclusions

Our data demonstrate that DNA-methylation analysis of the TNFRSF10D promoter from a small tissue punch from archival paraffin-embedded melanoma tissue is able to provide independent prognostic information in order to identify patients with a higher risk for aggressive progress.
Further studies are needed to elucidate how TNFRSF10D promoter hypermethylation is associated with poor prognosis and aggressive proliferation in melanoma. Additionally, further research needs to be conducted to assess if TNFRSF10D hypermethylation in serum samples from melanoma patients could be an indicator of poor prognosis in melanoma, as has been shown in neuroblastoma patients [19].

Supplementary Files

Supplementary File 1

Acknowledgments

This work was supported by the Austrian National Bank (Jubiläumsfondsprojekt No. 13062). We thank Inge Gaugg and Martina Fleischer for their excellent technical assistance.

Author Contributions

G.R., S.M., R.B., B.Z., G.W., P.F., G.G. and H.F. were responsible for the study design. H.F. and S.M. performed the sample preparation. G.G., B.W., R.B. and H.F. performed the data analysis, and G.G., S.M., B.W., R.B., B.Z., G.W., P.F., G.R. and H.F. drafted the manuscript. P.F. oversaw the interpretation of data. G.R., S.M., B.Z., G.W. and P.F. were responsible for the acquisition of samples and clinical data and provided interpretation in the context of dermatology. H.F. and G.R. provided funding. R.B. performed the locus-specific methylation analysis. All authors critically revised the manuscript and have read and approved the manuscript for publication.

Conflicts of Interest

The authors declare no conflict of interest.

References

  1. Garbe, C.; Peris, K.; Hauschild, A.; Saiag, P.; Middleton, M.; Spatz, A.; Grob, J.J.; Malvehy, J.; Newton-Bishop, J.; Stratigos, A.; et al. Diagnosis and treatment of melanoma. European consensus-based interdisciplinary guideline—Update 2012. Eur. J. Cancer 2012, 48, 2375–2390. [Google Scholar] [CrossRef]
  2. Balch, C.M.; Gershenwald, J.E.; Soong, S.J.; Thompson, J.F.; Atkins, M.B.; Byrd, D.R.; Buzaid, A.C.; Cochran, A.J.; Coit, D.G.; Ding, S.; et al. Final version of 2009 AJCC melanoma staging and classification. J. Clin. Oncol. 2009, 27, 6199–6206. [Google Scholar]
  3. Weinlich, G.; Eisendle, K.; Hassler, E.; Baltaci, M.; Fritsch, P.O.; Zelger, B. Metallothionein—Overexpression as a highly significant prognostic factor in melanoma: A prospective study on 1270 patients. Br. J. Cancer 2006, 94, 835–841. [Google Scholar]
  4. Jönsson, G.; Busch, C.; Knappskog, S.; Geisler, J.; Miletic, H.; Ringnér, M.; Lillehaug, J.R.; Borg, A.; Lønning, P.E. Gene expression profiling-based identification of molecular subtypes in stage IV melanomas with different clinical outcome. Clin. Cancer Res. 2010, 16, 3356–3367. [Google Scholar]
  5. Jones, P.A.; Baylin, S.B. The fundamental role of epigenetic events in cancer. Nat. Rev. Genet. 2002, 3, 415–428. [Google Scholar]
  6. Laird, P.W. The power and the promise of DNA methylation markers. Nat. Rev. Cancer 2003, 3, 253–266. [Google Scholar] [CrossRef]
  7. Spugnardi, M.; Tommasi, S.; Dammann, R.; Pfeifer, G.P.; Hoon, D.S. Epigenetic inactivation of RAS association domain family protein 1 (RASSF1A) in malignant cutaneous melanoma. Cancer Res. 2003, 63, 1639–1643. [Google Scholar]
  8. Hoon, D.S.; Spugnardi, M.; Kuo, C.; Huang, S.K.; Morton, D.L.; Taback, B. Profiling epigenetic inactivation of tumor suppressor genes in tumors and plasma from cutaneous melanoma patients. Oncogene 2004, 23, 4014–4022. [Google Scholar]
  9. Liu, S.; Ren, S.; Howell, P.; Fodstad, O.; Riker, A.I. Identification of novel epigenetically modified genes in human melanoma via promoter methylation gene profiling. Pigment Cell Melanoma Res. 2008, 21, 545–558. [Google Scholar] [CrossRef]
  10. Kuphal, S.; Martyn, A.C.; Pedley, J.; Crowther, L.M.; Bonazzi, V.F.; Parsons, P.G.; Bosserhoff, A.K.; Hayward, N.K.; Boyle, G.M. H-cadherin expression reduces invasion of malignant melanoma. Pigment Cell Melanoma Res. 2009, 22, 296–306. [Google Scholar]
  11. Muthusamy, V.; Duraisamy, S.; Bradbury, C.M.; Hobbs, C.; Curley, D.P.; Nelson, B.; Bosenberg, M. Epigenetic silencing of novel tumor suppressors in malignant melanoma. Cancer Res. 2006, 66, 11187–11193. [Google Scholar]
  12. Bonazzi, V.F.; Irwin, D.; Hayward, N.K. Identification of candidate tumor suppressor genes inactivated by promoter methylation in melanoma. Genes Chromosomes Cancer 2009, 48, 10–21. [Google Scholar] [CrossRef]
  13. Mori, T.; Martinez, S.R.; O’Day, S.J.; Morton, D.L.; Umetani, N.; Kitago, M.; Tanemura, A.; Nguyen, S.L.; Tran, A.N.; Wang, H.J.; et al. Estrogen receptor-α methylation predicts melanoma progression. Cancer Res. 2006, 66, 6692–6698. [Google Scholar] [CrossRef]
  14. Lodygin, D.; Tarasov, V.; Epanchintsev, A.; Berking, C.; Knyazeva, T.; Körner, H.; Knyazev, P.; Diebold, J.; Hermeking, H. Inactivation of miR-34a by aberrant CpG methylation in multiple types of cancer. Cell Cycle 2008, 7, 2591–2600. [Google Scholar] [CrossRef]
  15. Schultz, J.; Ibrahim, S.M.; Vera, J.; Kunz, M. 14-3-3σ gene silencing during melanoma progression and its role in cell cycle control and cellular senescence. Mol. Cancer 2009, 8, 53. [Google Scholar] [CrossRef]
  16. Bonazzi, V.F.; Nancarrow, D.J.; Stark, M.S.; Moser, R.J.; Boyle, G.M.; Aoude, L.G.; Schmidt, C.; Hayward, N.K. oss-platform array screening identifies COL1A2; THBS1; TNFRSF10D and UCHL1 as genes frequently silenced by methylation in melanoma. PLoS One 2011, 6, e26121. [Google Scholar]
  17. Shen, L.; Kondo, Y.; Ahmed, S.; Boumber, Y.; Konishi, K.; Guo, Y.; Chen, X.; Vilaythong, J.N.; Issa, J.P. Drug sensitivity prediction by CpG island methylation profile in the NCI-60 cancer cell line panel. Cancer Res. 2007, 67, 11335–11343. [Google Scholar] [CrossRef]
  18. Wischnewski, F.; Pantel, K.; Schwarzenbach, H. Promoter demethylation and histone acetylation mediate gene expression of MAGE-A1; -A2; -A3; and -A12 in human cancer cells. Mol. Cancer Res. 2006, 4, 339–349. [Google Scholar] [CrossRef]
  19. Yagyu, S.; Gotoh, T.; Iehara, T.; Miyachi, M.; Katsumi, Y.; Tsubai-Shimizu, S.; Kikuchi, K.; Tamura, S.; Tsuchiya, K.; Imamura, T.; et al. Circulating methylated-DCR2 gene in serum as an indicator of prognosis and therapeutic efficacy in patients with MYCN nonamplified neuroblastoma. Clin. Cancer Res. 2008, 21, 7011–7019. [Google Scholar]
  20. Shivapurkar, N.; Toyooka, S.; Toyooka, K.O.; Reddy, J.; Miyajima, K.; Suzuki, M.; Shigematsu, H.; Takahashi, T.; Parikh, G.; Pass, H.I.; et al. Aberrant methylation of trail decoy receptor genes is frequent in multiple tumor types. Int. J. Cancer 2004, 109, 786–792. [Google Scholar] [CrossRef]
  21. Venza, M.; Visalli, M.; Catalano, T.; Fortunato, C.; Oteri, R.; Teti, D.; Venza, I. Impact of DNA methyltransferases on the epigenetic regulation of tumor necrosis factor-related apoptosis-inducing ligand (TRAIL) receptor expression in malignant melanoma. Biochem. Biophys. Res. Commun. 2013, 441, 743–750. [Google Scholar] [CrossRef]
  22. McShane, L.M.; Altman, D.G.; Sauerbrei, W.; Taube, S.E.; Gion, M.; Clark, G.M. Statistics subcommittee of the NCI–EORTC working group on cancer diagnostics: Reporting recommendations for tumour marker prognostic studies (REMARK). J. Natl. Cancer Inst. 2005, 97, 1180–1184. [Google Scholar] [CrossRef]
  23. Altman, D.G.; McShane, L.M.; Sauerbrei, W.; Taube, S.E. Reporting recommendations for tumor marker prognostic studies (REMARK): Explanation and elaboration. BMC Med. 2012, 10, 51. [Google Scholar] [CrossRef]
  24. Ehrlich, M.; Jiang, G.; Fiala, E.; Dome, J.S.; Yu, M.C.; Long, T.I.; Youn, B.; Sohn, O.S.; Widschwendter, M.; Tomlinson, G.E.; et al. Hypomethylation and hypermethylation of DNA in Wilms tumors. Oncogene 2002, 21, 6694–6702. [Google Scholar] [CrossRef]
  25. Weisenberger, D.J.; Siegmund, K.D.; Campan, M.; Young, J.; Long, T.I.; Faasse, M.A.; Kang, G.H.; Widschwendter, M.; Weener, D.; Buchanan, D.; et al. CpG island methylator phenotype underlies sporadic microsatellite instability and is tightly associated with BRAF mutation in colorectal cancer. Nat. Genet. 2006, 38, 787–793. [Google Scholar] [CrossRef]
  26. Eads, C.A.; Danenberg, K.D.; Kawakami, K.; Saltz, L.B.; Blake, C.; Shibata, D.; Danenberg, P.V.; Laird, P.W. MethyLight: A high-throughput assay to measure DNA methylation. Nucleic Acids Res. 2000, 28, E32. [Google Scholar] [CrossRef]

