Article

Genome-Wide Characterization and Expression Analysis of the Germin-Like Protein Family in Rice and Arabidopsis

College of Life Sciences, Nanjing Agricultural University, Nanjing 210095, China
*
Author to whom correspondence should be addressed.
Int. J. Mol. Sci. 2016, 17(10), 1622; https://doi.org/10.3390/ijms17101622
Submission received: 6 July 2016 / Revised: 9 September 2016 / Accepted: 15 September 2016 / Published: 23 September 2016
(This article belongs to the Section Molecular Plant Sciences)

Abstract

:
Previous studies have shown that germin-like proteins (GLPs) are present ubiquitously in rice and Arabidopsis. However, the understanding regarding their role in development and abiotic/biotic stress resistance remains limited. In the present study, we report genome-wide identification, characterisation, subcellular localization, enzyme activity, and expression analysis of the GLP gene family in rice and Arabidopsis to study their functions. In total, 43 and 32 GLPs in the rice and Arabidopsis genome were identified based on a systematic analysis, respectively. The GLP genes were clustered into six clades based on phylogenetic analysis, and many stress and developmental-related cis-elements were detected in promoters of GLP genes. In addition, subcellular location and superoxide dismutase (SOD) analysis demonstrated that the random selected OsGLP genes on chromosomes 8 and 4 of rice were expressed in the cell wall with SOD activity. Overall, our results showed that tandem duplication events, especially the clusters of tandem duplication genes on chromosome 8 in rice, play a major role in expansion of the GLP family and thus increase our understanding of the role of the GLP family in abiotic/biotic stress and development.

1. Introduction

Germin and germin-like proteins (GLPs) were first discovered in wheat seeds as specific markers of germination [1,2], after which they were widely found in monocotyledons, dicotyledons, and gymnosperms [3]. The germin family belongs to the functionally diverse cupin superfamily, and generally codes two exons, and contains a “cupin” (PF00190) at its C-terminus [4]. It is a challenging work to classify germins and GLPs, due to their high conserved sequence and the similarity of structural characteristics [5]. In general, the “true germins” belong to a well-conserved homogeneous group and are almost uniquely found within cereal plant species [6,7,8], while GLP proteins belong to a heterogeneous group and have a wider taxonomic coverage in plants [2,9].
Most GLPs are reported to have enzyme activities only in the polymeric form [10,11,12], but one GLP protein in Capsicum chinense showed superoxide dismutase (SOD) activity without forming polymers [13]. In barley, six germin proteins that each combines a single manganese-ion, form an extremely stable hexamer protein structure [9]. In addition, GLPs have been reported to possess other enzyme activities, such as functioning as an auxin receptor [14], oxalate oxidase (OXO) activity [12], as well as polyphenol oxidase [11] and serine protease inhibitors [15].
GLP genes are expressed in all types of organs including leaves, cotyledons, stems, roots, embryos, flowers, and seeds, and are involved in developmental processes [3,16]. The overexpression of GLP genes in Arabidopsis and rice influenced the normal growth and development of plants [17,18]. Besides, GLP genes have different spatial and temporal expression characteristics in a variety of plants, which could affect the enzyme activities [3]. For example, GLP genes are expressed in the apoplast and cell wall of embryonic cells compared with OXO activity during germination, and those genes were considered to be plant cell defenders [19]. The quaternary structure of GLPs is highly resistant to heat, extreme pH, proteases, and sodium dodecyl sulfonate (SDS) [10,20]. High GLP gene expressions have been observed under different abiotic stresses, such as salt stress [16], drought stress [16], heavy metal stress [19,21] and wound stress [16]. The GLP genes are also expressed under many biotic stresses, such as in the presence of fugal pathogens [10,22], bacteria [23], and viruses [13]. Expressions of GLP genes have also been shown to be increased within the plant cell wall after infection, and the mechanism by which GLPs influence plant defence is likely related to ROS (reactive oxygen species) production and formation of an “oxidative burst” response [23,24]. Recent studies revealed a close connection between both GLP gene clusters and disease resistance phenotypes [25,26]. However, the functions of many GLP genes are still largely unknown, and the response of GLP gene tandem clusters or single GLP genes to biotic/abiotic stresses needs to be identified.
Although the functions of some GLP genes have been characterised in barley [27], wheat [28], soybean [3], and moss [29], a comparison of the GLP family between monocotyledon and dicotyledon has never been performed. In this study, members of the GLP family in rice and Arabidopsis were reanalysed based on complete genome sequences and annotation. We proposed nomenclature, provided chromosomal distribution, identified tandem duplications, and performed phylogenetic analyses of GLP genes in Arabidopsis and rice. The expressions of GLP genes during development and under biotic/abiotic stress conditions were evaluated based on bioinformatics analysis, and the “hotspot” genes for biotic/abiotic stress were identified. In addition, quantitative real time PCR (qRT-PCR) analyses of rice GLP genes under four different abiotic stresses were performed and the subcellular localisation of three GLPs in rice were analysed. Our study will provide a reference for further functional analyses of members of the GLP family in rice and Arabidopsis.

2. Results and Discussion

2.1. Identification and Nomenclature of GLP Genes in Arabidopsis and Rice Genomes

A total of 32 distinct chromosomal loci encoding for 37 GLP genes in Arabidopsis and 43 chromosomal loci encoding for 48 GLP genes in rice were identified (Table S1). Previous studies reported 29 AtGLP genes in Arabidopsis [18] and 41 OsGLP genes in rice [25]. We found three new GLP genes (AT1G74820, AT5G39100, AT5G61750) in Arabidopsis and two new GLP genes (Os01g14670, Os03g58990) in rice. Manosalva et al. divided GLP genes in rice into six groups (from OsGER1 to OsGER6) according to the barley nomenclature [25], while GLP genes in Arabidopsis have not been systematically denominated. To maintain uniformity and avoid ambiguity, we proposed new nomenclature for GLP family members in this study (Table S1). We numbered the GLP genes according to their 1–5 chromosomal location for Arabidopsis, and 1–12 chromosomal location for rice, and from top to bottom. Details of each GLP member, including the locus ID, open reading frame length, protein length, and chromosomal location of all GLP genes, are shown in Table S1.

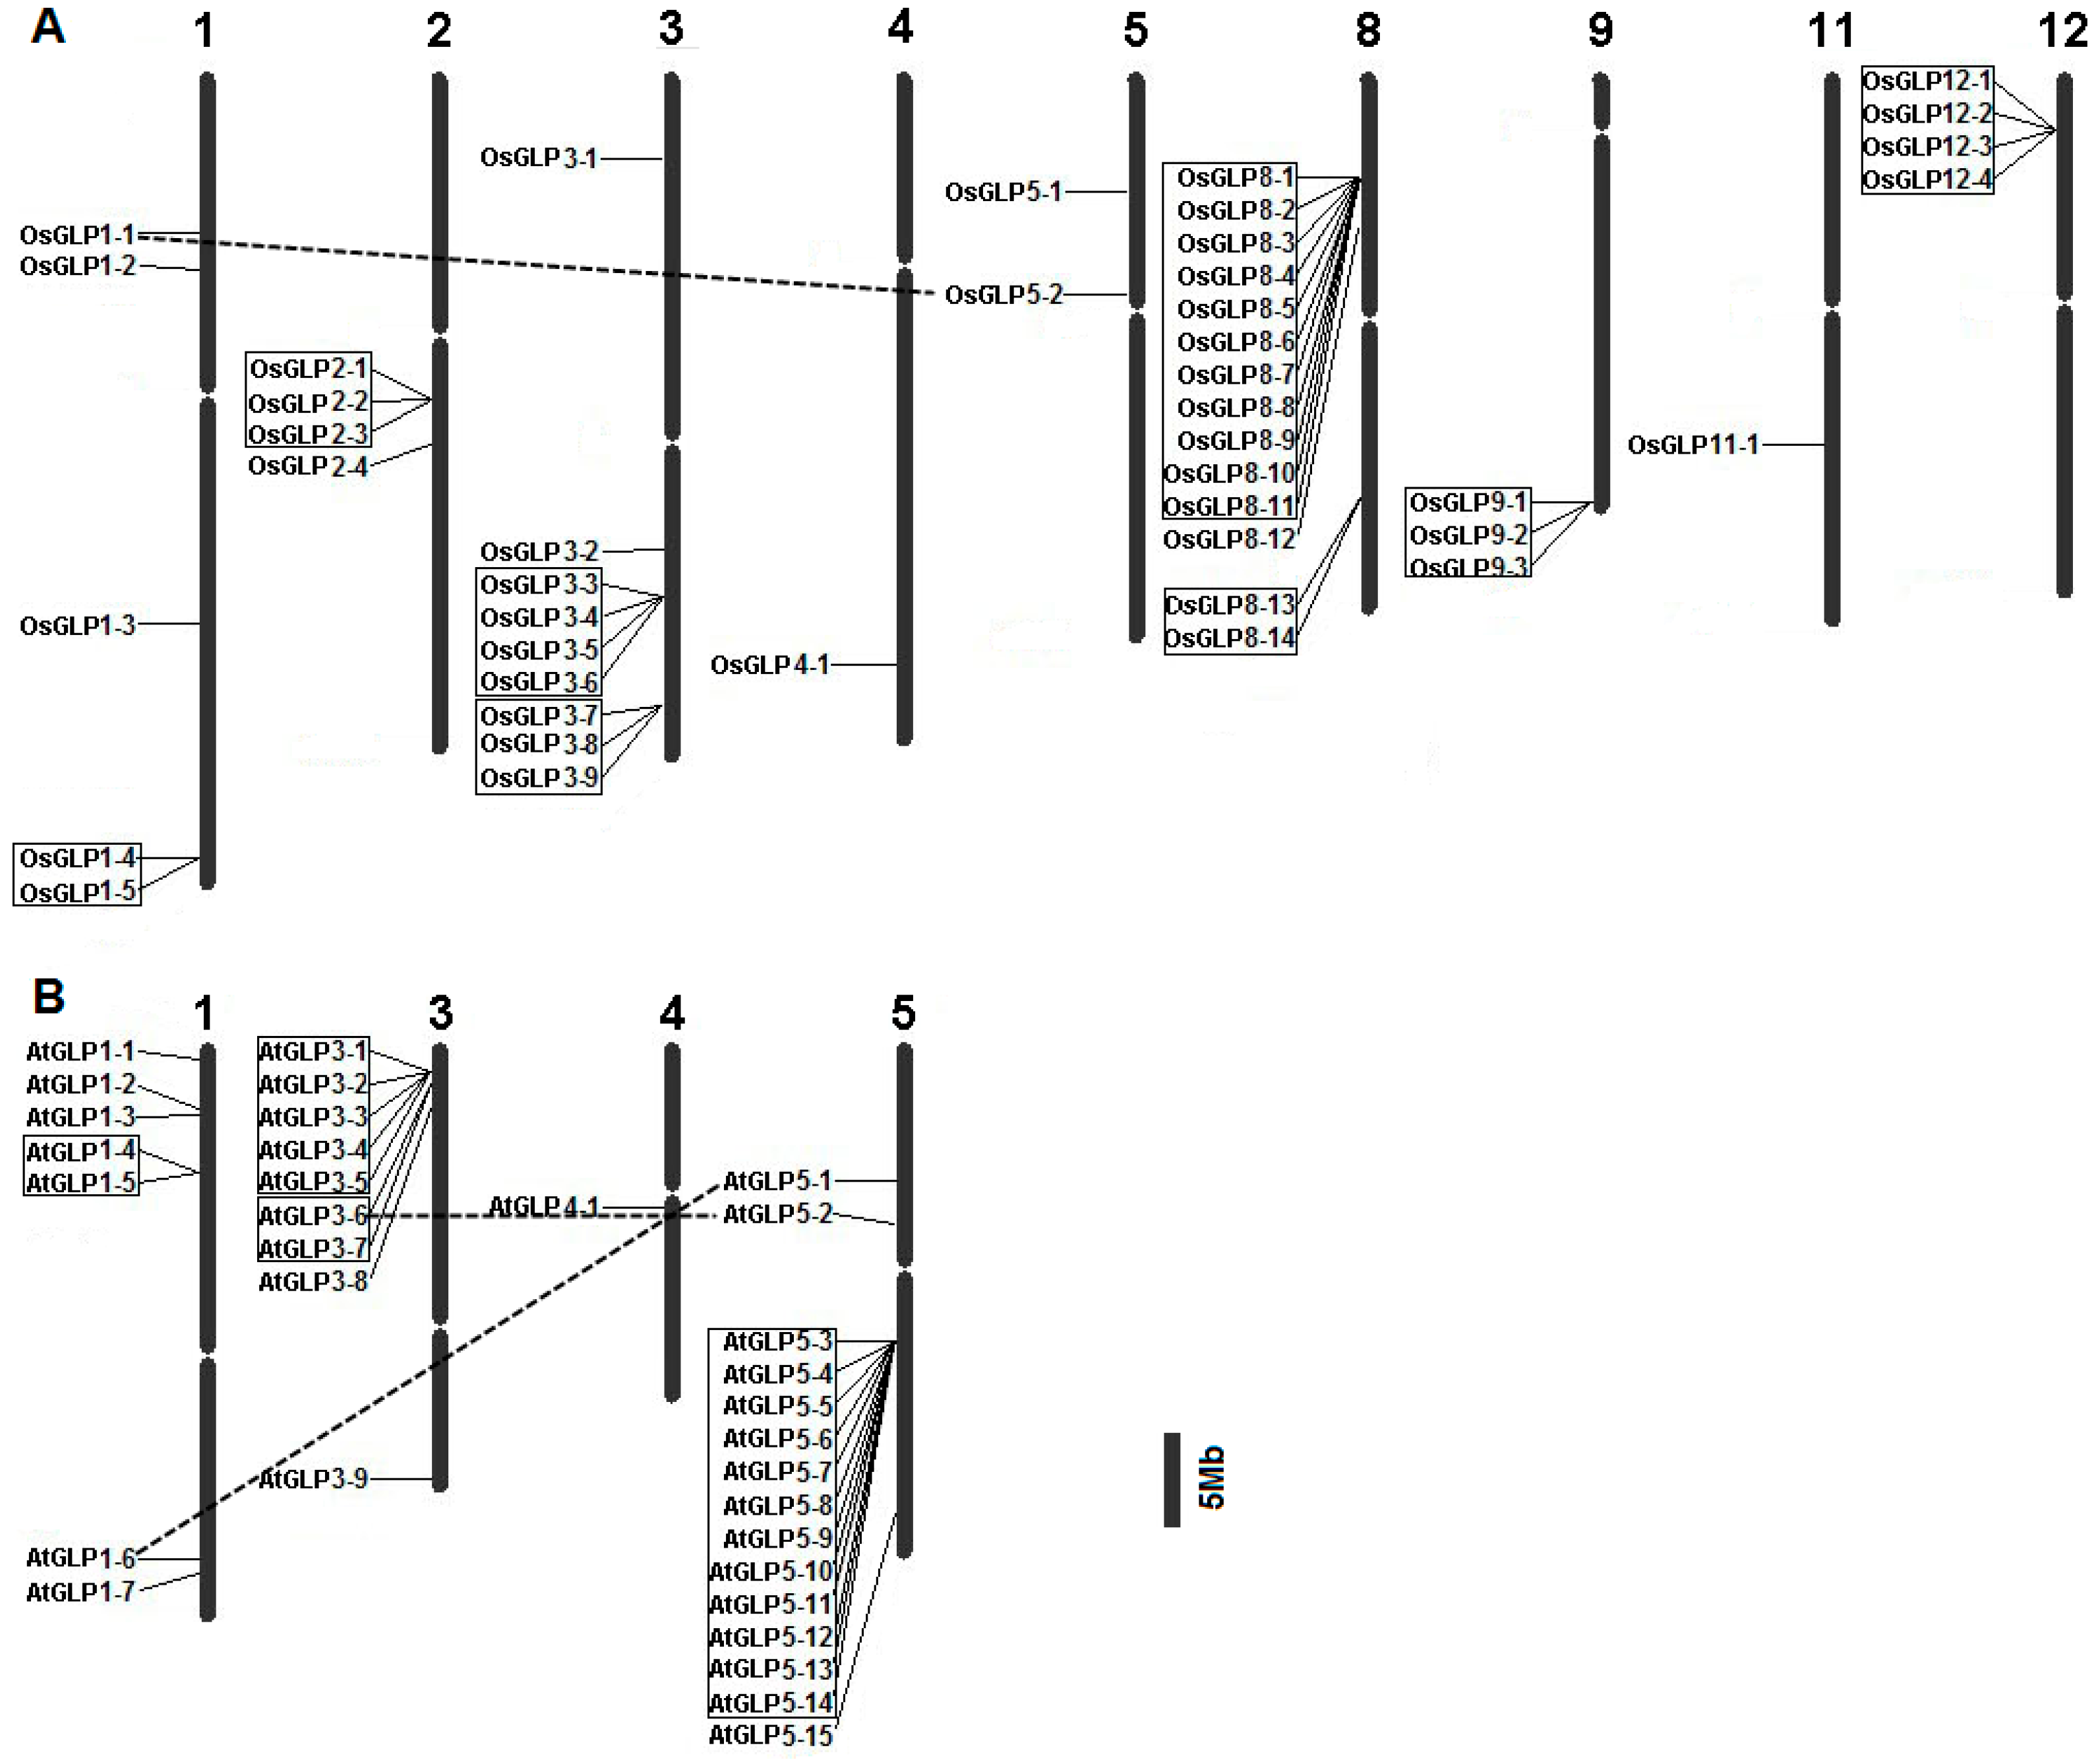
2.2. Chromosomal Distribution of GLP Genes

To determine the chromosomal distribution of GLP genes in rice and Arabidopsis, chromosomal maps were constructed (Figure 1). In rice, the OsGLP genes are distributed on nine of 12 chromosomes, excluding chromosomes 6, 7, and 10 (Figure 1A). Chromosome 8 encoded the highest number (14 of 43, 32.6%) of OsGLP genes, followed by chromosome 3 (9 of 43, 20.9%) and chromosome 1 (5 of 43, 11.6%). Tandem duplications were observed among 32 genes forming eight clusters on chromosomes 1, 2, 3, 8, 9, and 12. Maximum tandem duplicated genes were found on chromosome 8 (11 members), which also harboured another cluster with two OsGLP genes. In Arabidopsis, chromosome 5 encoded the maximum 15 AtGLP genes (Figure 1B), and tandem duplications were also observed among 21 genes forming four clusters. The largest cluster localised on chromosome 5 contains 12 GLP genes presenting in tandem at a single locus. Besides, two pairs of GLP genes were found to be segmentally duplicated in Arabidopsis, whereas only one pair of GLP genes was segmentally duplicated in rice. Tandem duplications of genes from rice oxalate oxidase cupin subclasses have also been reported [7]. Tandem duplication was common among chromosomes of rice and Arabidopsis, which may contribute to the plant evolution of the GLP family [30] and function under “abiotic and biotic stress”. For both Arabidopsis and rice, the number of GLP genes present in tandem is much larger than those located on the segmentally duplicated region. Thus, tandem duplications appear to play an important role in expansion of the GLP family in rice and Arabidopsis.

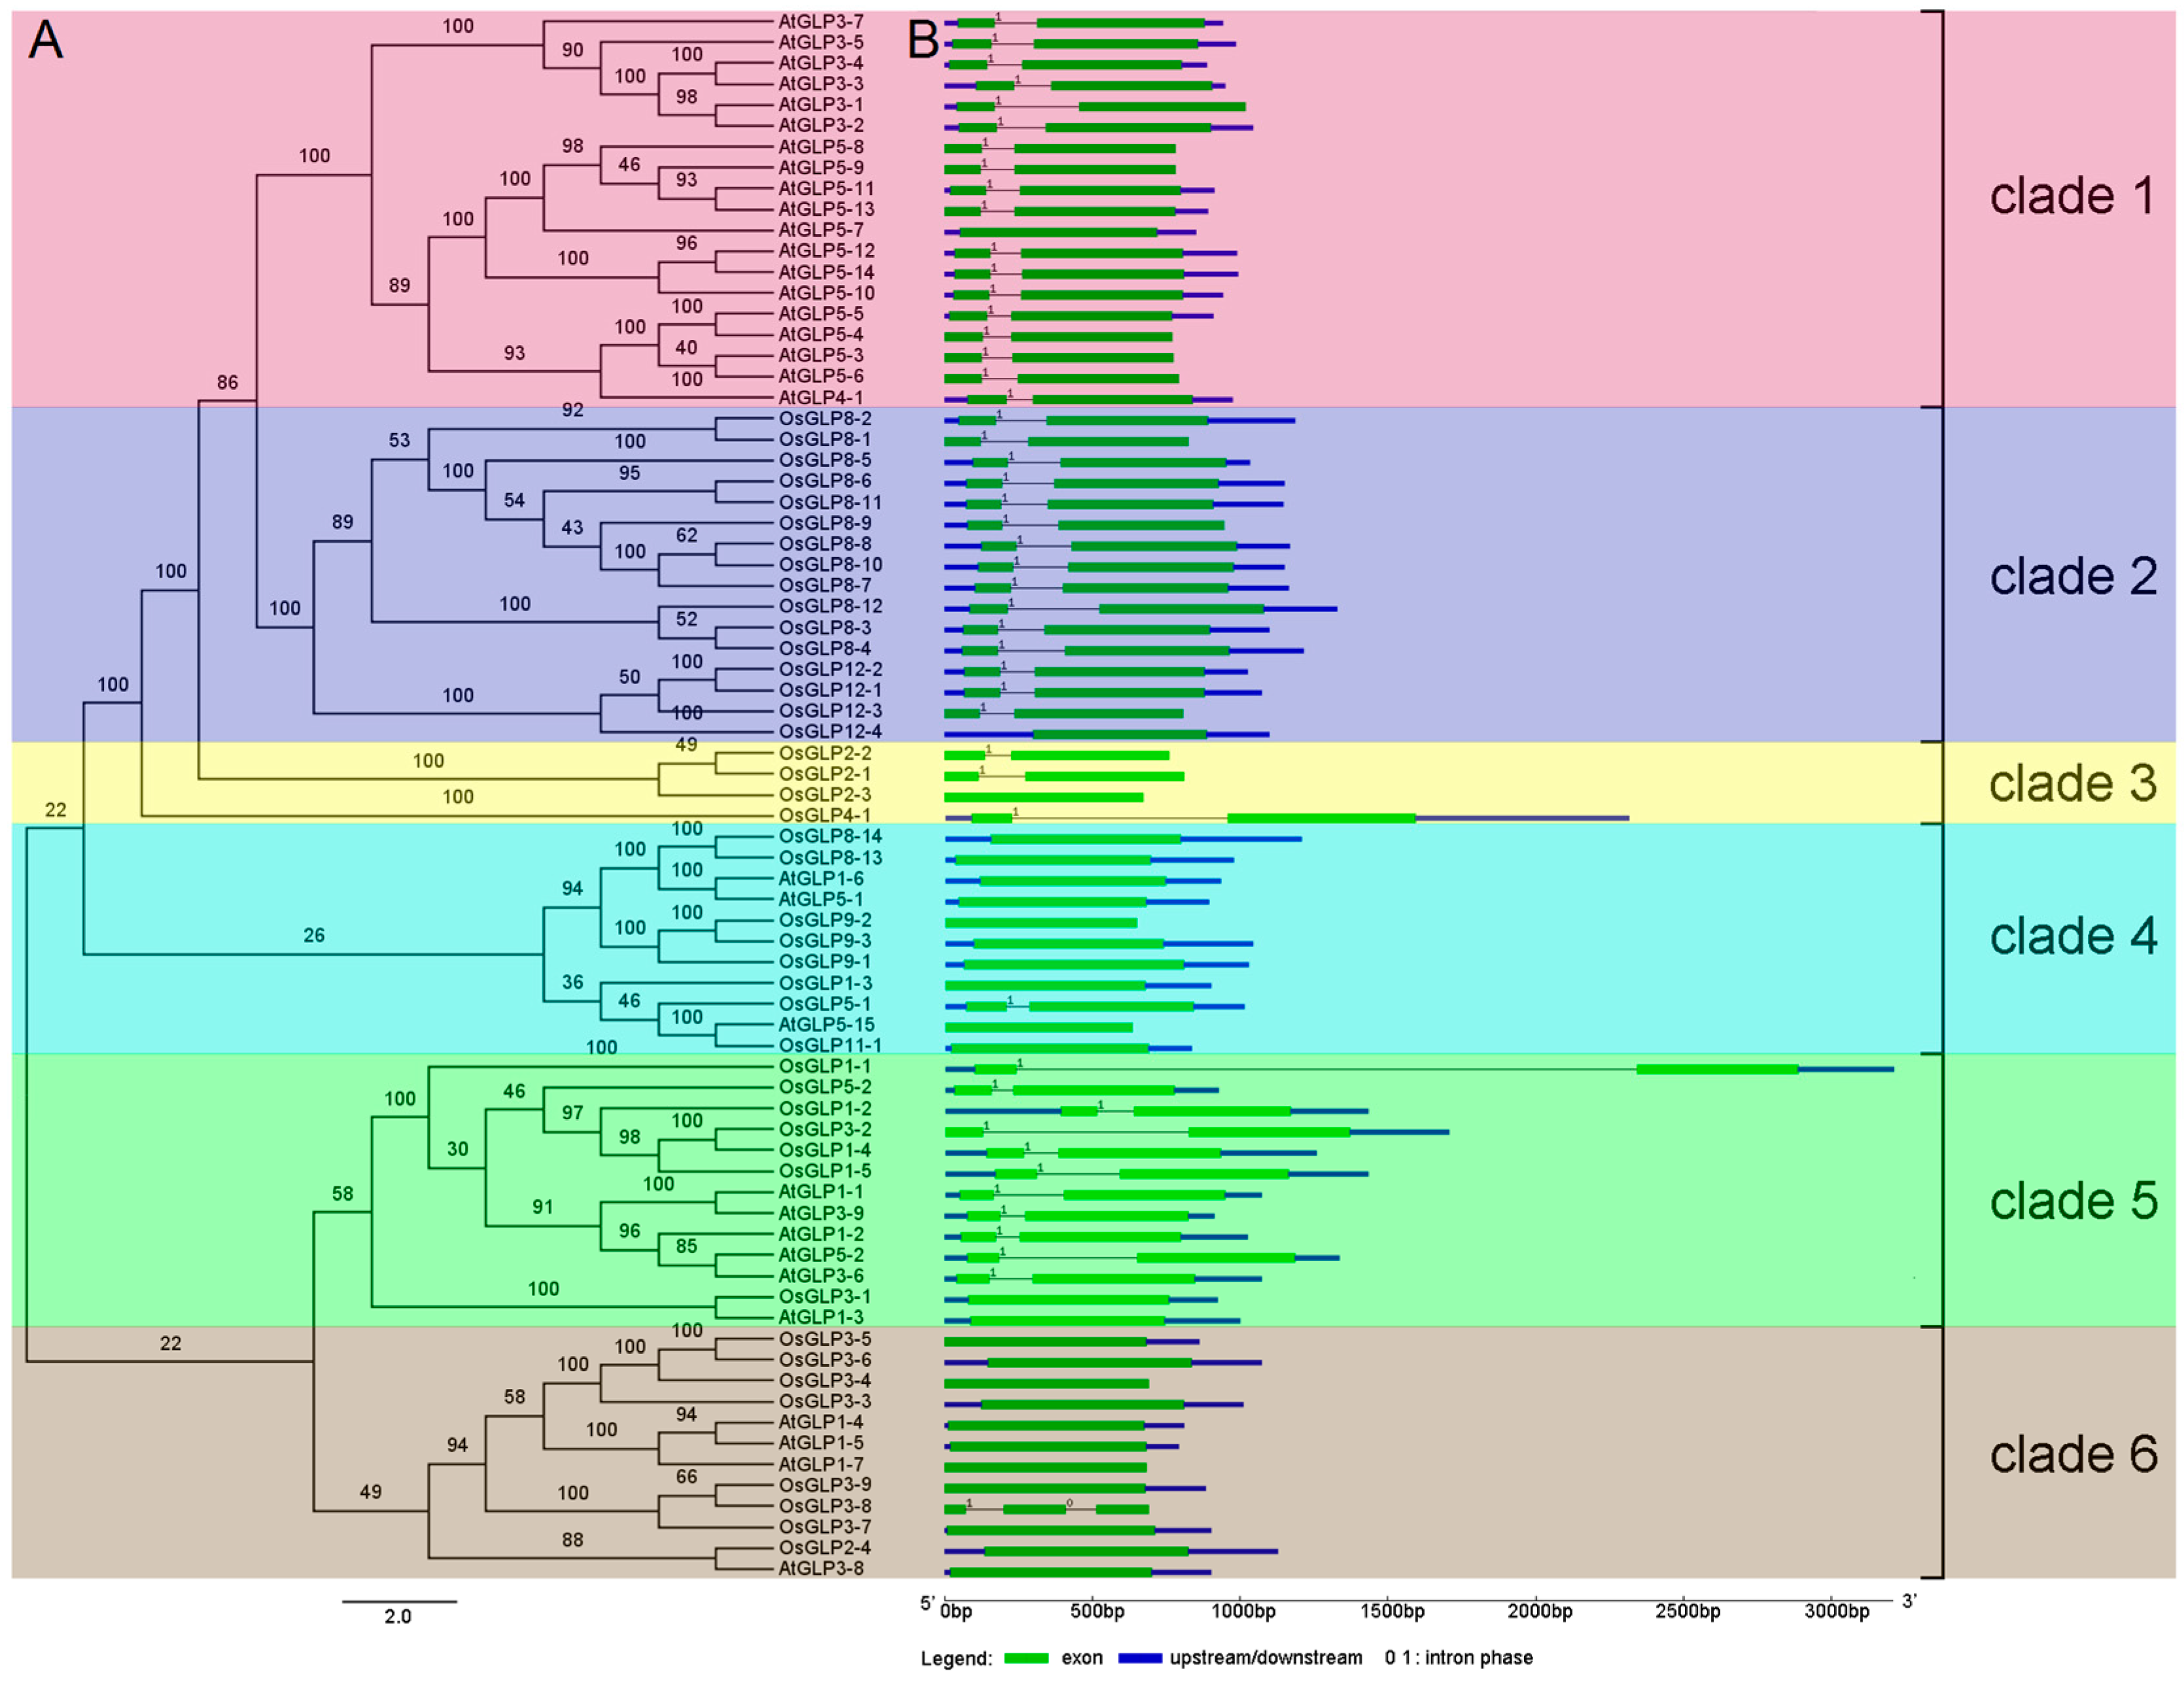
2.3. Phylogeny and Structure Analysis of GLP genes

To elucidate the evolutionary significance of GLP genes across Arabidopsis and rice, phylogenetic analysis was performed using conserved regions of OsGLP and AtGLP sequences (Figure 2). The rice genome encodes a significantly higher number of GLP genes (43 genes) compared to Arabidopsis (32 genes), indicating a more rapid evolutionary rate in rice than Arabidopsis. According to the phylogenetic tree, all GLP genes of Arabidopsis and rice could be divided into six major clades. All GLP genes from clade 1 belong to Arabidopsis, which are mainly comprised of two tandem clusters from chromosomes 3 and 5. GLP genes from two tandem clusters on rice chromosomes 8 and 12 constitute clade 2. Clade 3 is comprised of GLP genes in rice, with one tandem cluster from chromosome 2 and one GLP gene from chromosome 4 (OsGLP4-1). Besides, other GLP genes from Arabidopsis and rice were clustered together (clades 4, 5, and 6). These results indicated that GLP genes existed before the divergence of monocots and dicots, and some GLP genes expanded independently in a species-specific manner. This species-specific expansion pattern has been reported in other gene families, such as the VQ motif-containing protein family [31] and zinc finger-homeodomain gene family [32].
Many studies proved that gene structural diversity is a possible mechanism for the evolution of multi-gene families [33,34]. To increase the understanding of the structural diversity of GLP genes, we compared the exon/intron organisation in the coding sequences of individual GLP genes in rice and Arabidopsis (Figure 2B). In general, we found that most closely related members in the same clade shared a similar exon/intron structure in terms of intron number and exon length. For example, no intron is present in GLP members of clade 4, except OsGLP5-1, and clade 6 contains no introns except OsGLP3-8. All GLP genes in clades 1, 2, and 3 contained one intron, excluding AtGLP5-7, OsGLP12-4, and OsGLP2-3, which do not possess an intron.

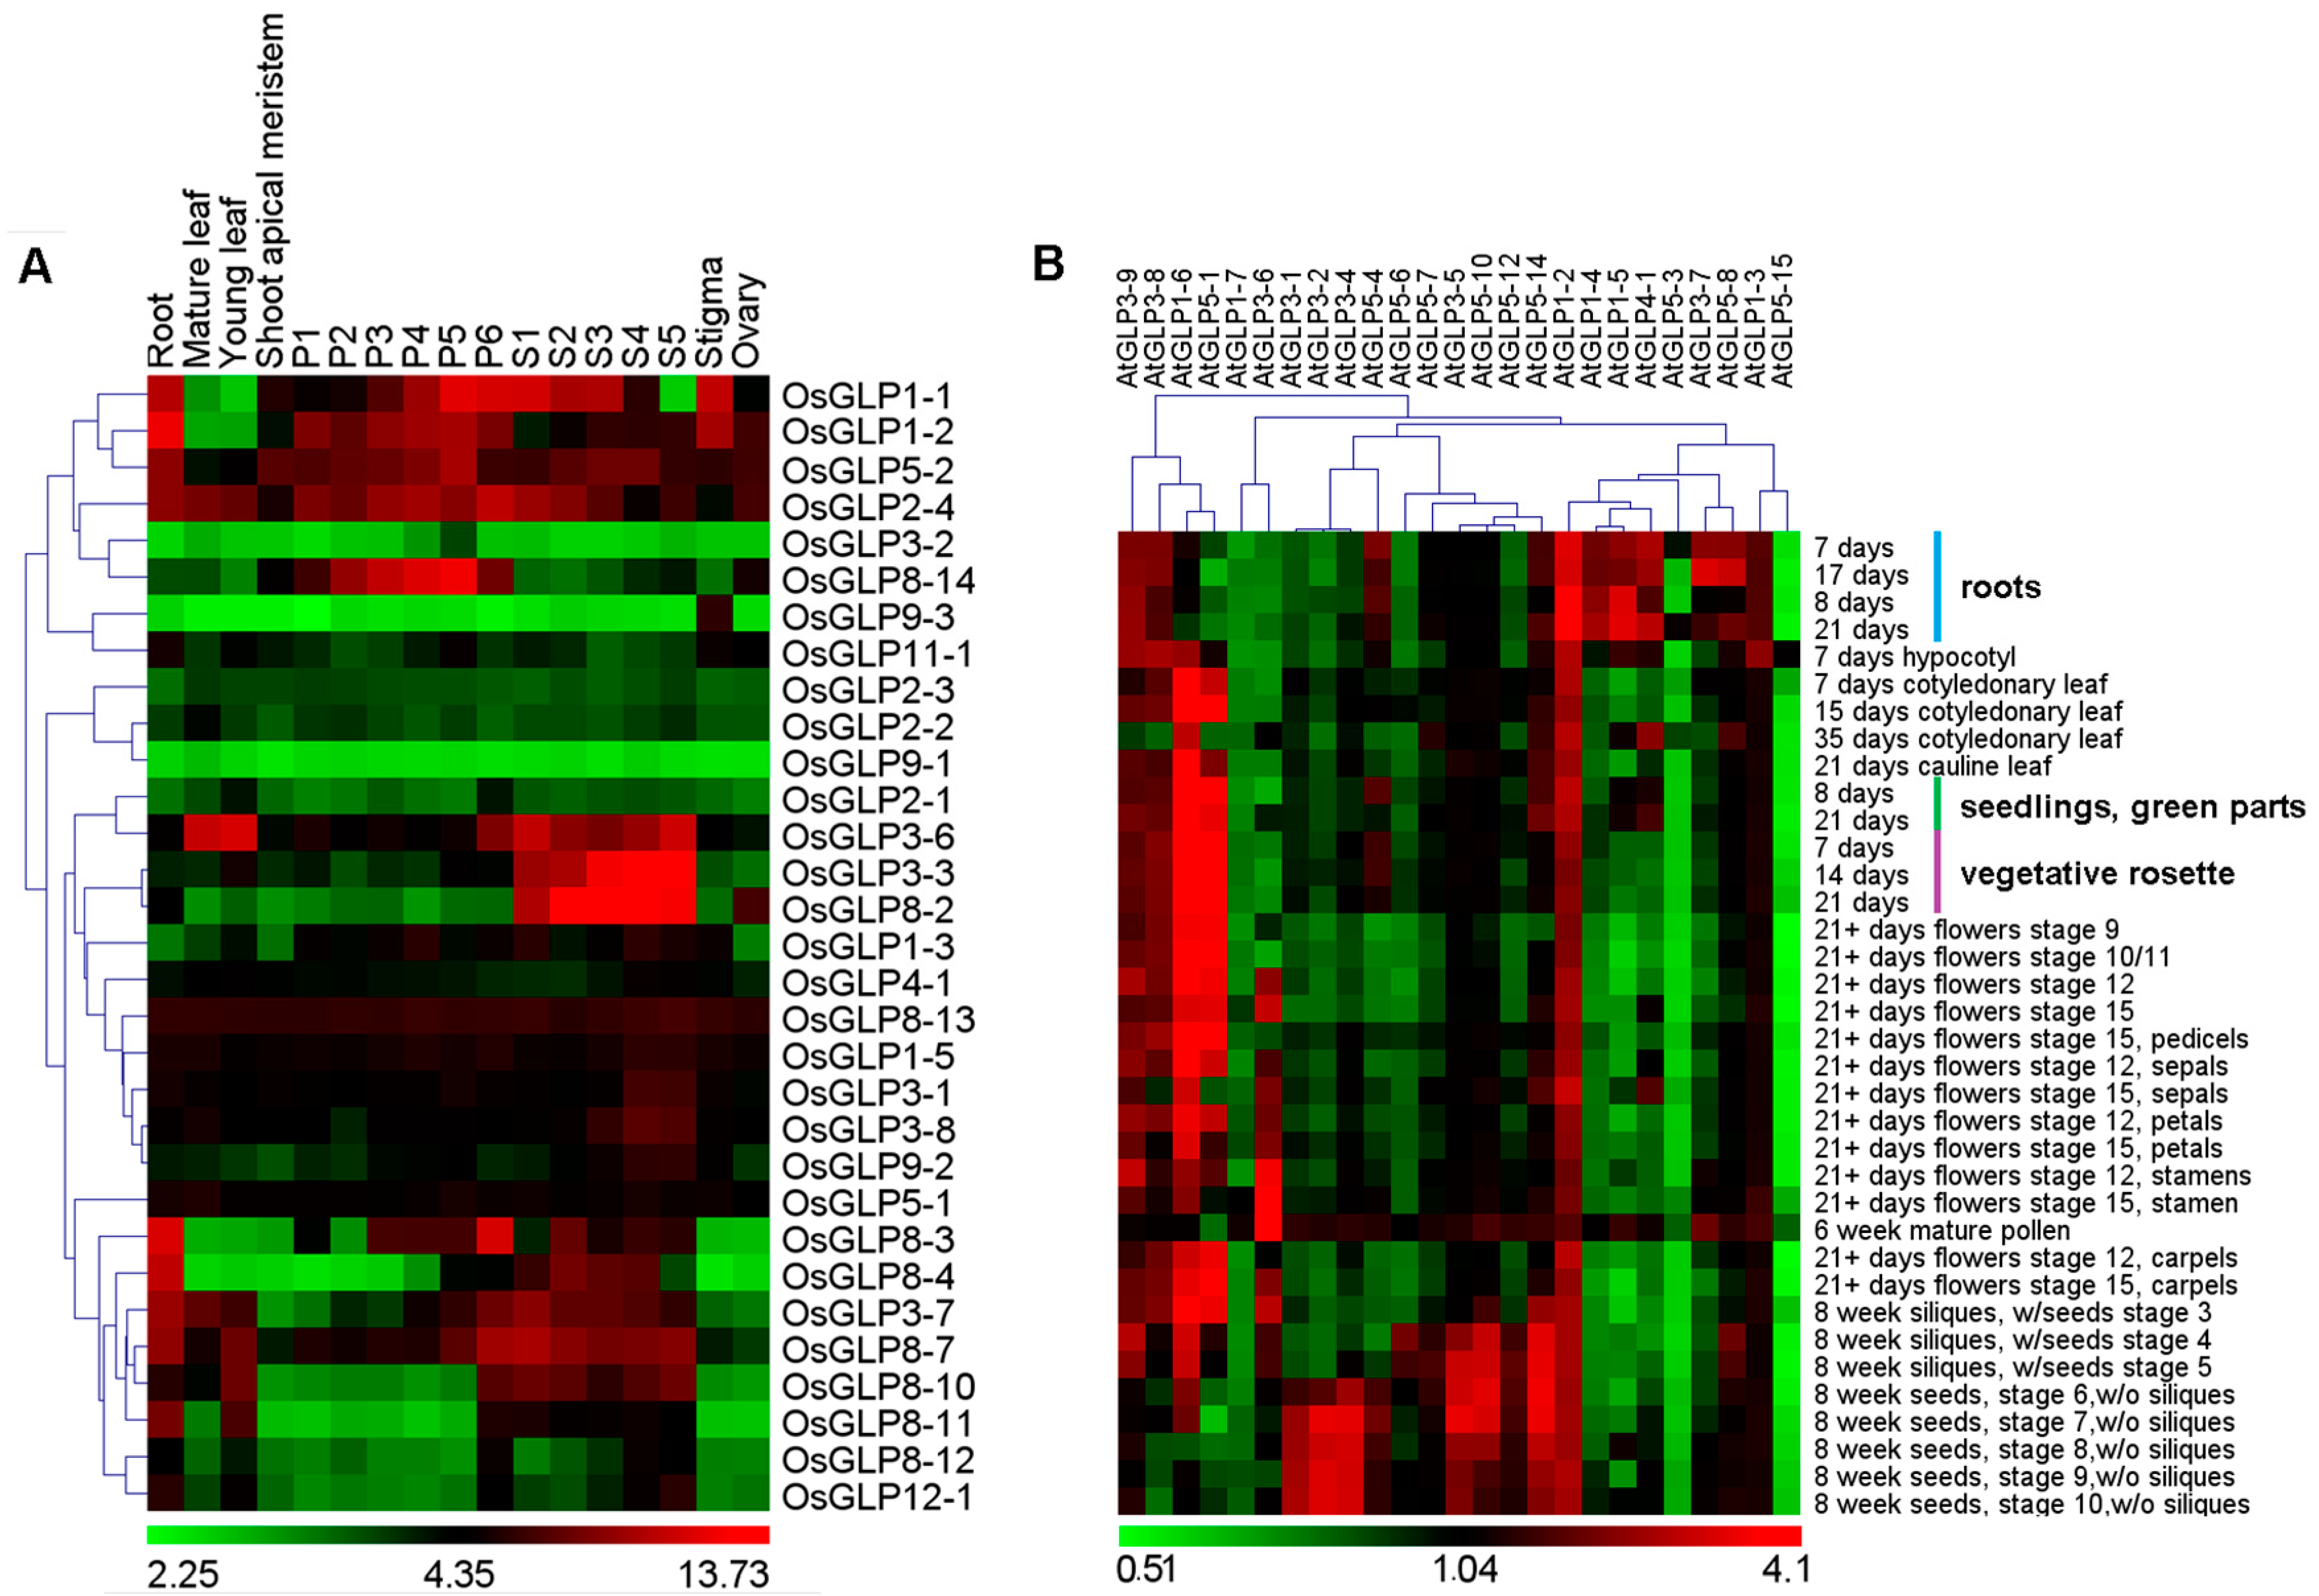
2.4. Differential Expression of GLP Genes during Development

To gain insight into the possible function of GLP genes during development, we analysed the expression pattern of OsGLP and AtGLP genes in various tissues/organs and developmental stages using microarray data (Tables S2 and S3). For rice GLP genes, Affymetrix GeneChip rice genome arrays (GSE6893 and GSE7951) were used, and 31 OsGLP genes were represented (Figure 3A).
In general, some OsGLP genes only expressed in certain tissues or developmental stages while others showed high expressions during all developmental stages and in different tissues. For example, the expressions of OsGLP3-3 and OsGLP8-2 were restricted to seed development stages (S1–S5). OsGLP8-14 was preferentially expressed during panicle development stages P1 to P6, while the expression of OsGLP9-3 was restricted to stigma. The expressions of OsGLP3-6, OsGLP3-7 and OsGLP8-10 were exhibited preferentially in vegetative tissues and the stages of panicle and seed development. These genes may perform specific roles in these tissues/organs or developmental stages. It should be noted that some GLP genes including OsGLP5-2, OsGLP2-4, and OsGLP8-13, were expressed at high levels in almost all developmental stages, suggestive of their broad role in plant development. Similar analysis was performed for AtGLP genes (Figure 3B). Additionally, some of the GLP genes, such as AtGLP3-9, AtGLP3-8, and AtGLP1-2, were highly expressed during all developmental stages, while the expressions of AtGLP5-3, AtGLP5-15, and AtGLP1-7 were lower during almost all developmental stages. The high expressions of AtGLP3-5 and AtGLP5-10 in stages 8, 9, and 10 of seed development supported their role in seed development. Interestingly, a close relationship between gene expression profiles and their clustering in the chromosomes was found. For example, the tandem duplicated gene such as OsGLP2-1 to OsGLP2-3 from chromosome 2 expressed at low level, while most OsGLP genes from one cluster of chromosome 8 such as OsGLP8-2, OsGLP8-3, OsGLP8-4, OsGLP8-7, OsGLP8-10, and OsGLP8-11 showed high expression in seed. The AtGLP cluster from chromosome 1 showed high expression in root, while most of the AtGLP genes from one cluster of chromosome 3 expressed mainly in seed. In addition, the segmentally duplicated genes AtGLP1-6 and AtGLP5-1 showed similar expression during the studied Arabidopsis developmental stage.
Moreover, massively parallel signature sequencing (MPSS) data was analysed to quantify the expression of GLP genes in rice (Table S4) and Arabidopsis (Table S5). Signature tags were found for 22 GLP genes in rice, while there were only 15 identified in Arabidopsis. The expression profiles of GLP genes obtained from MPSS data agreed largely with microarray data.

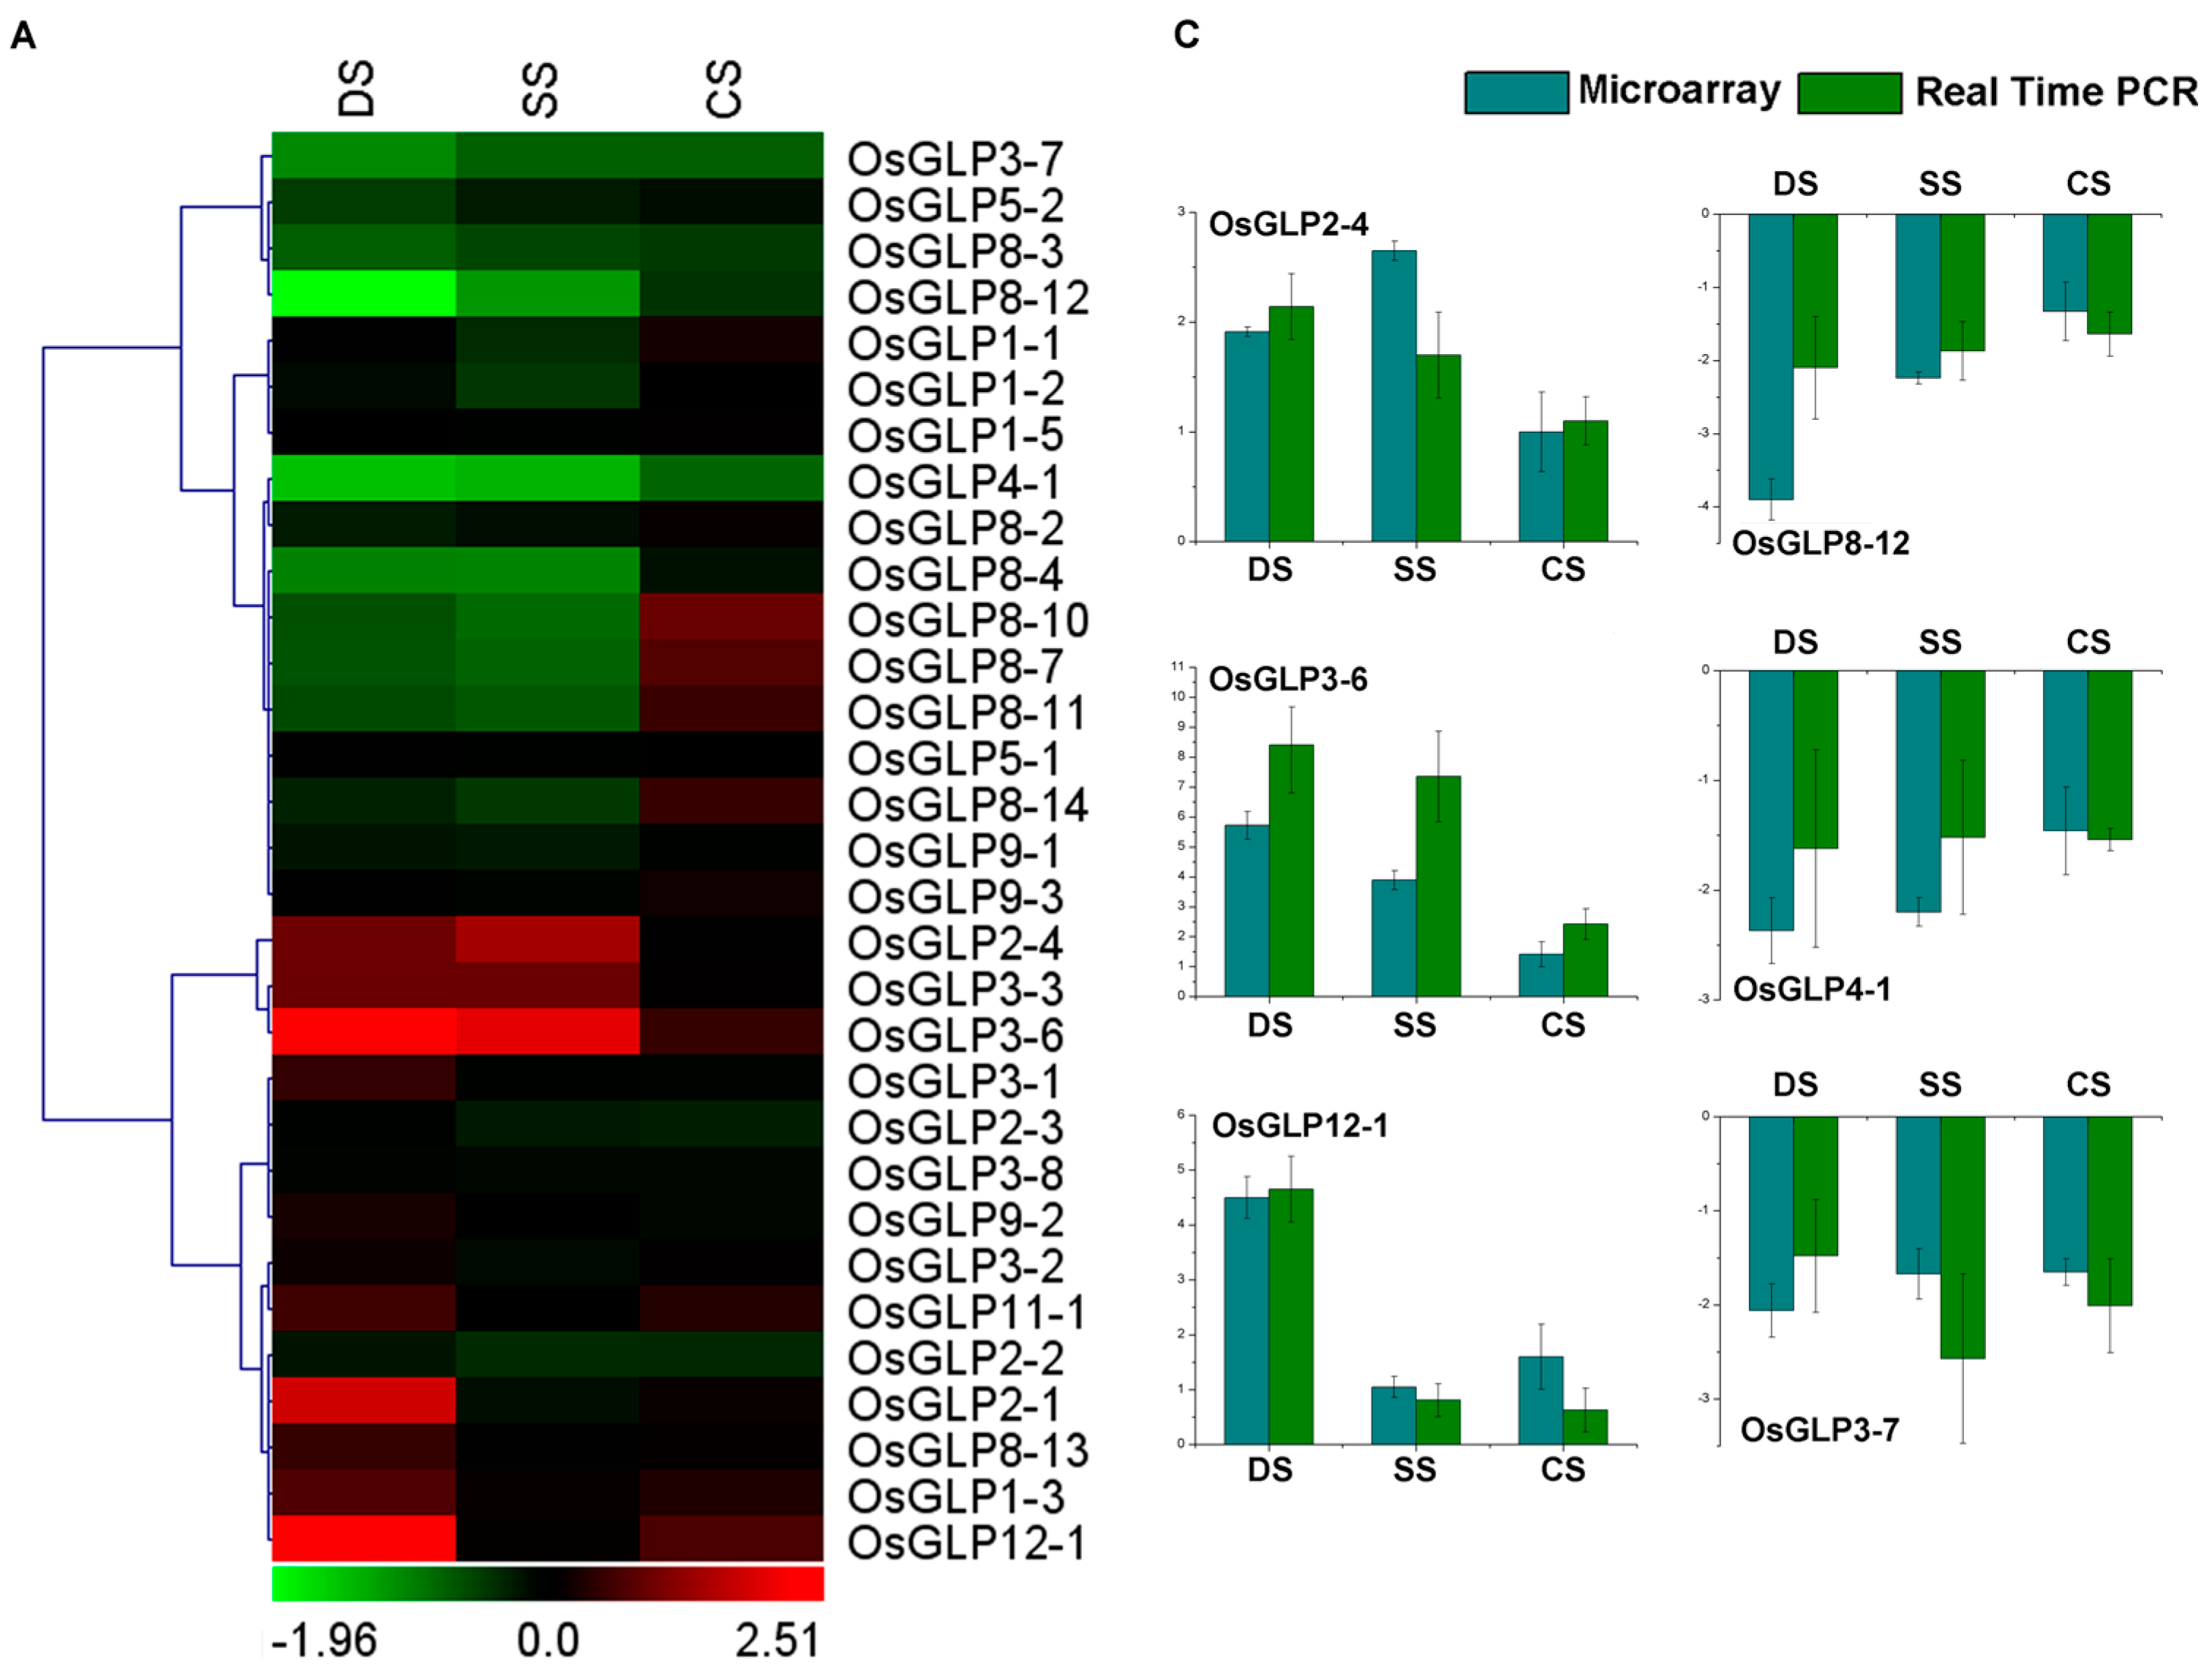
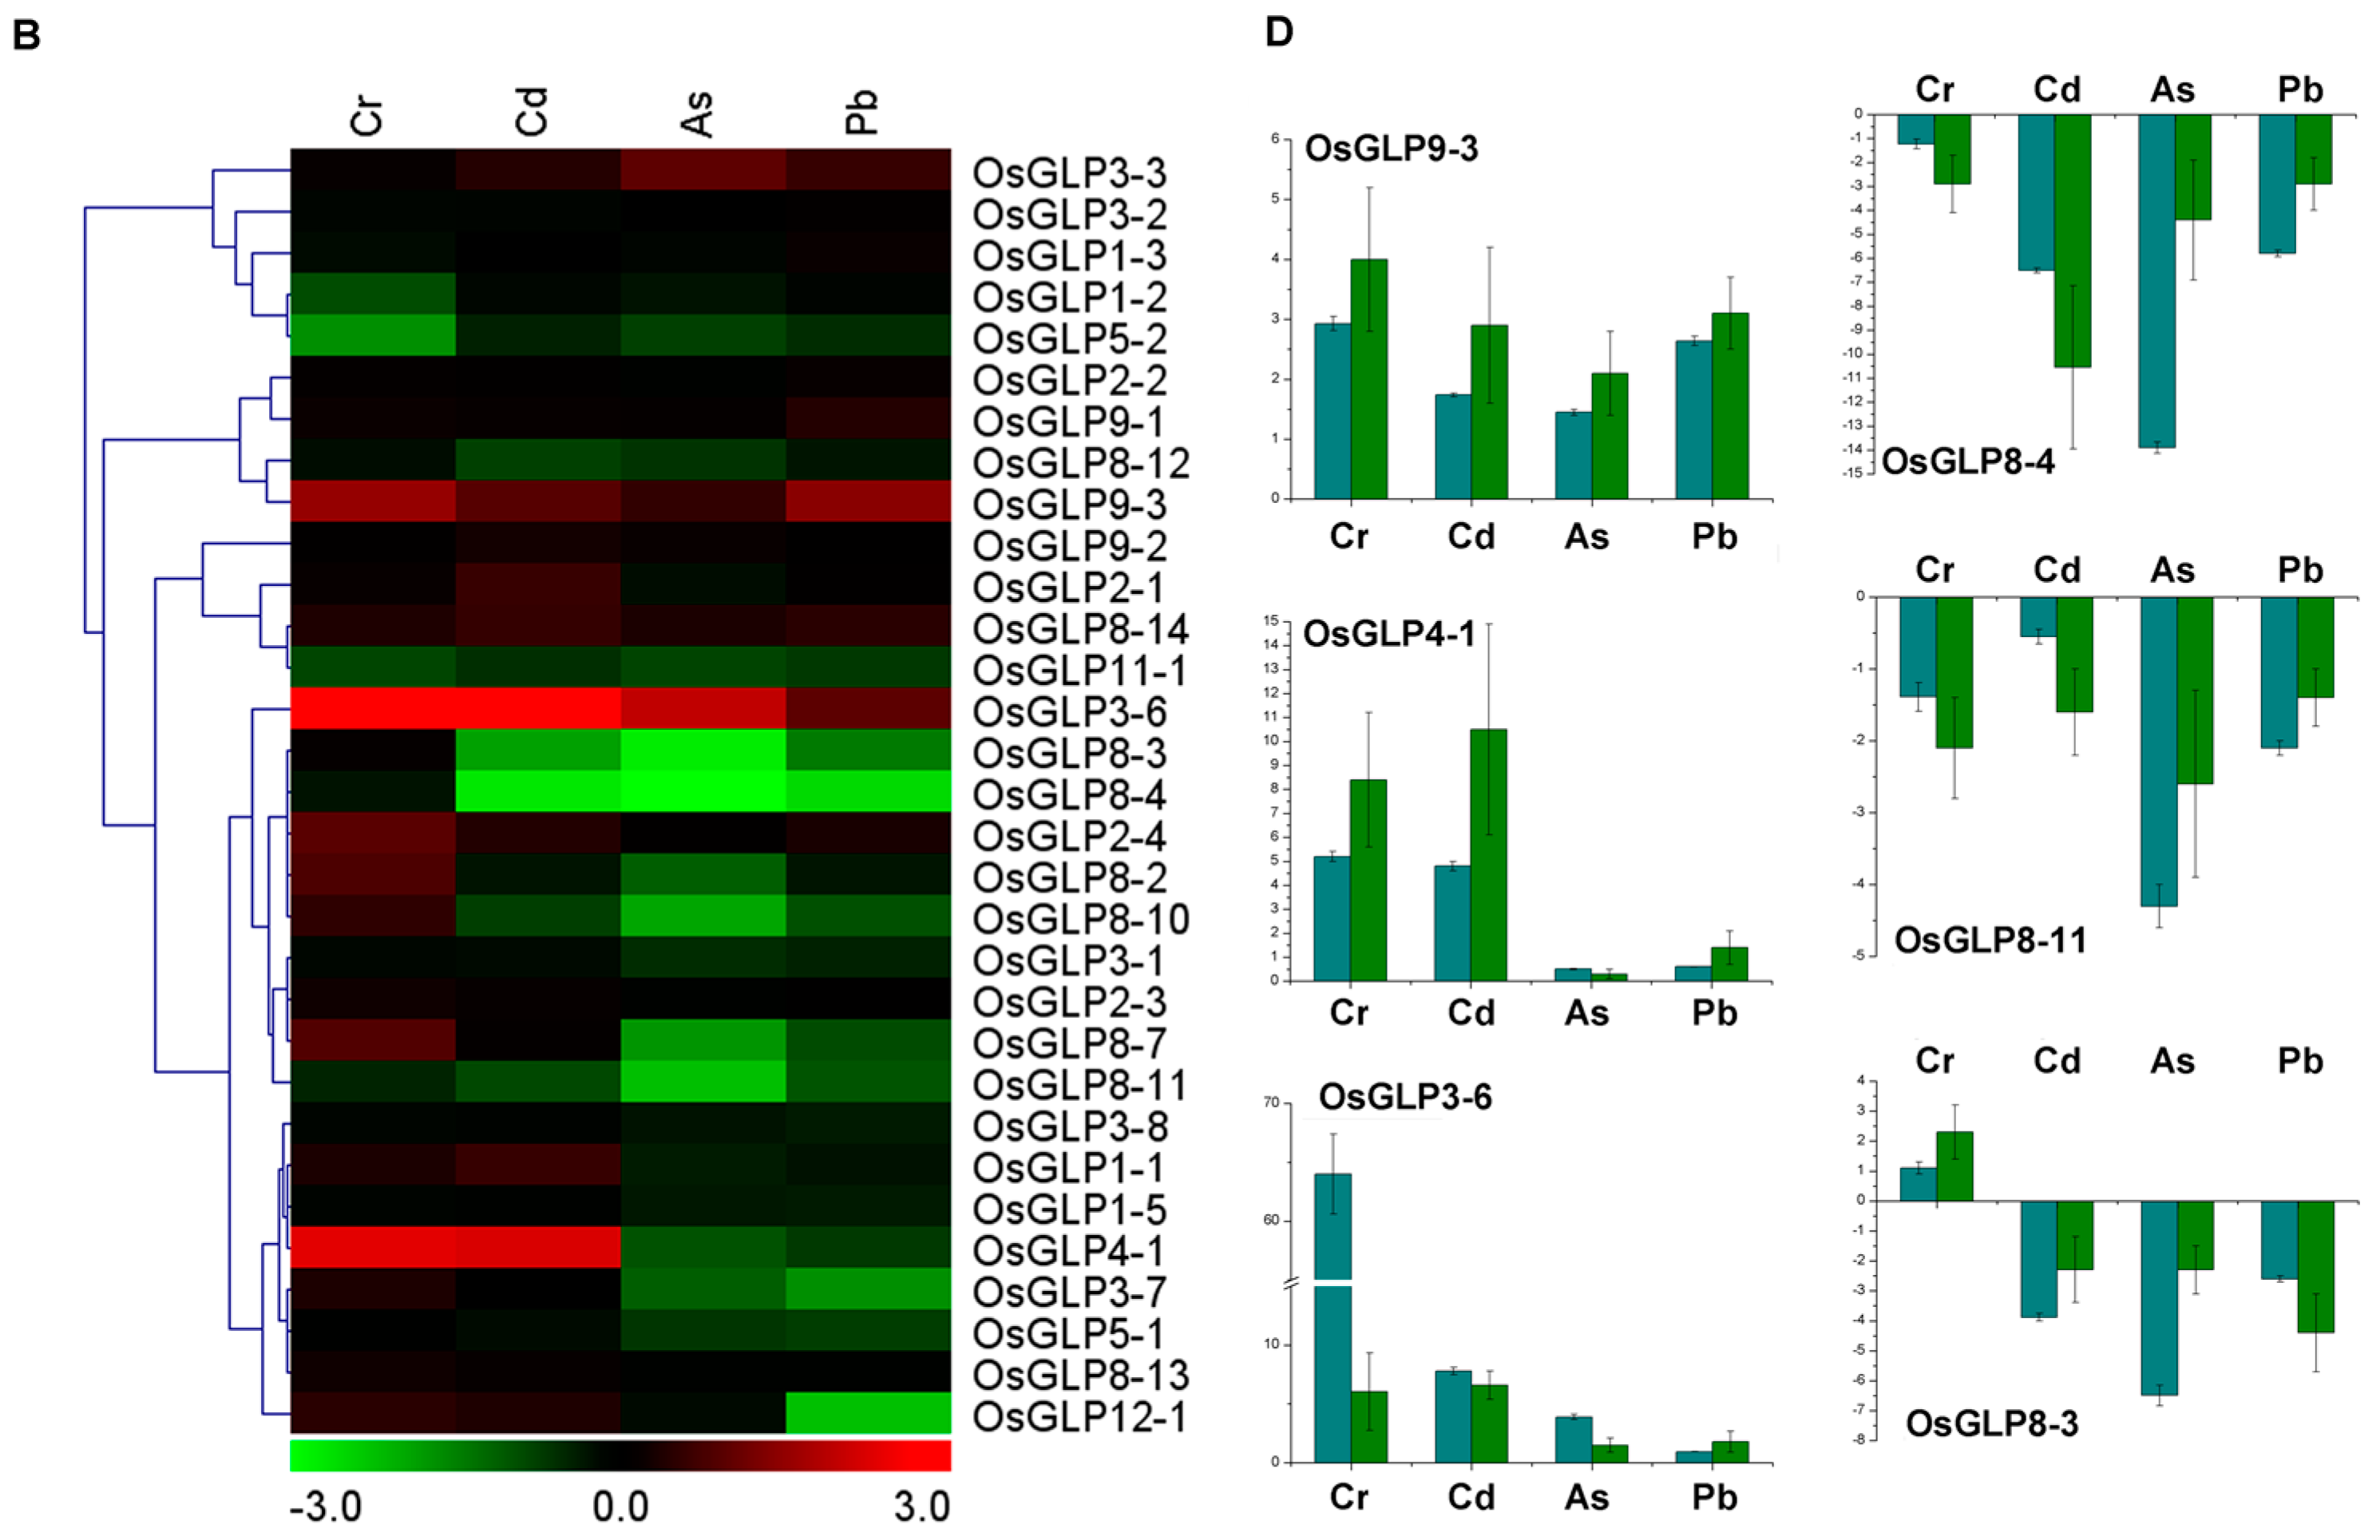
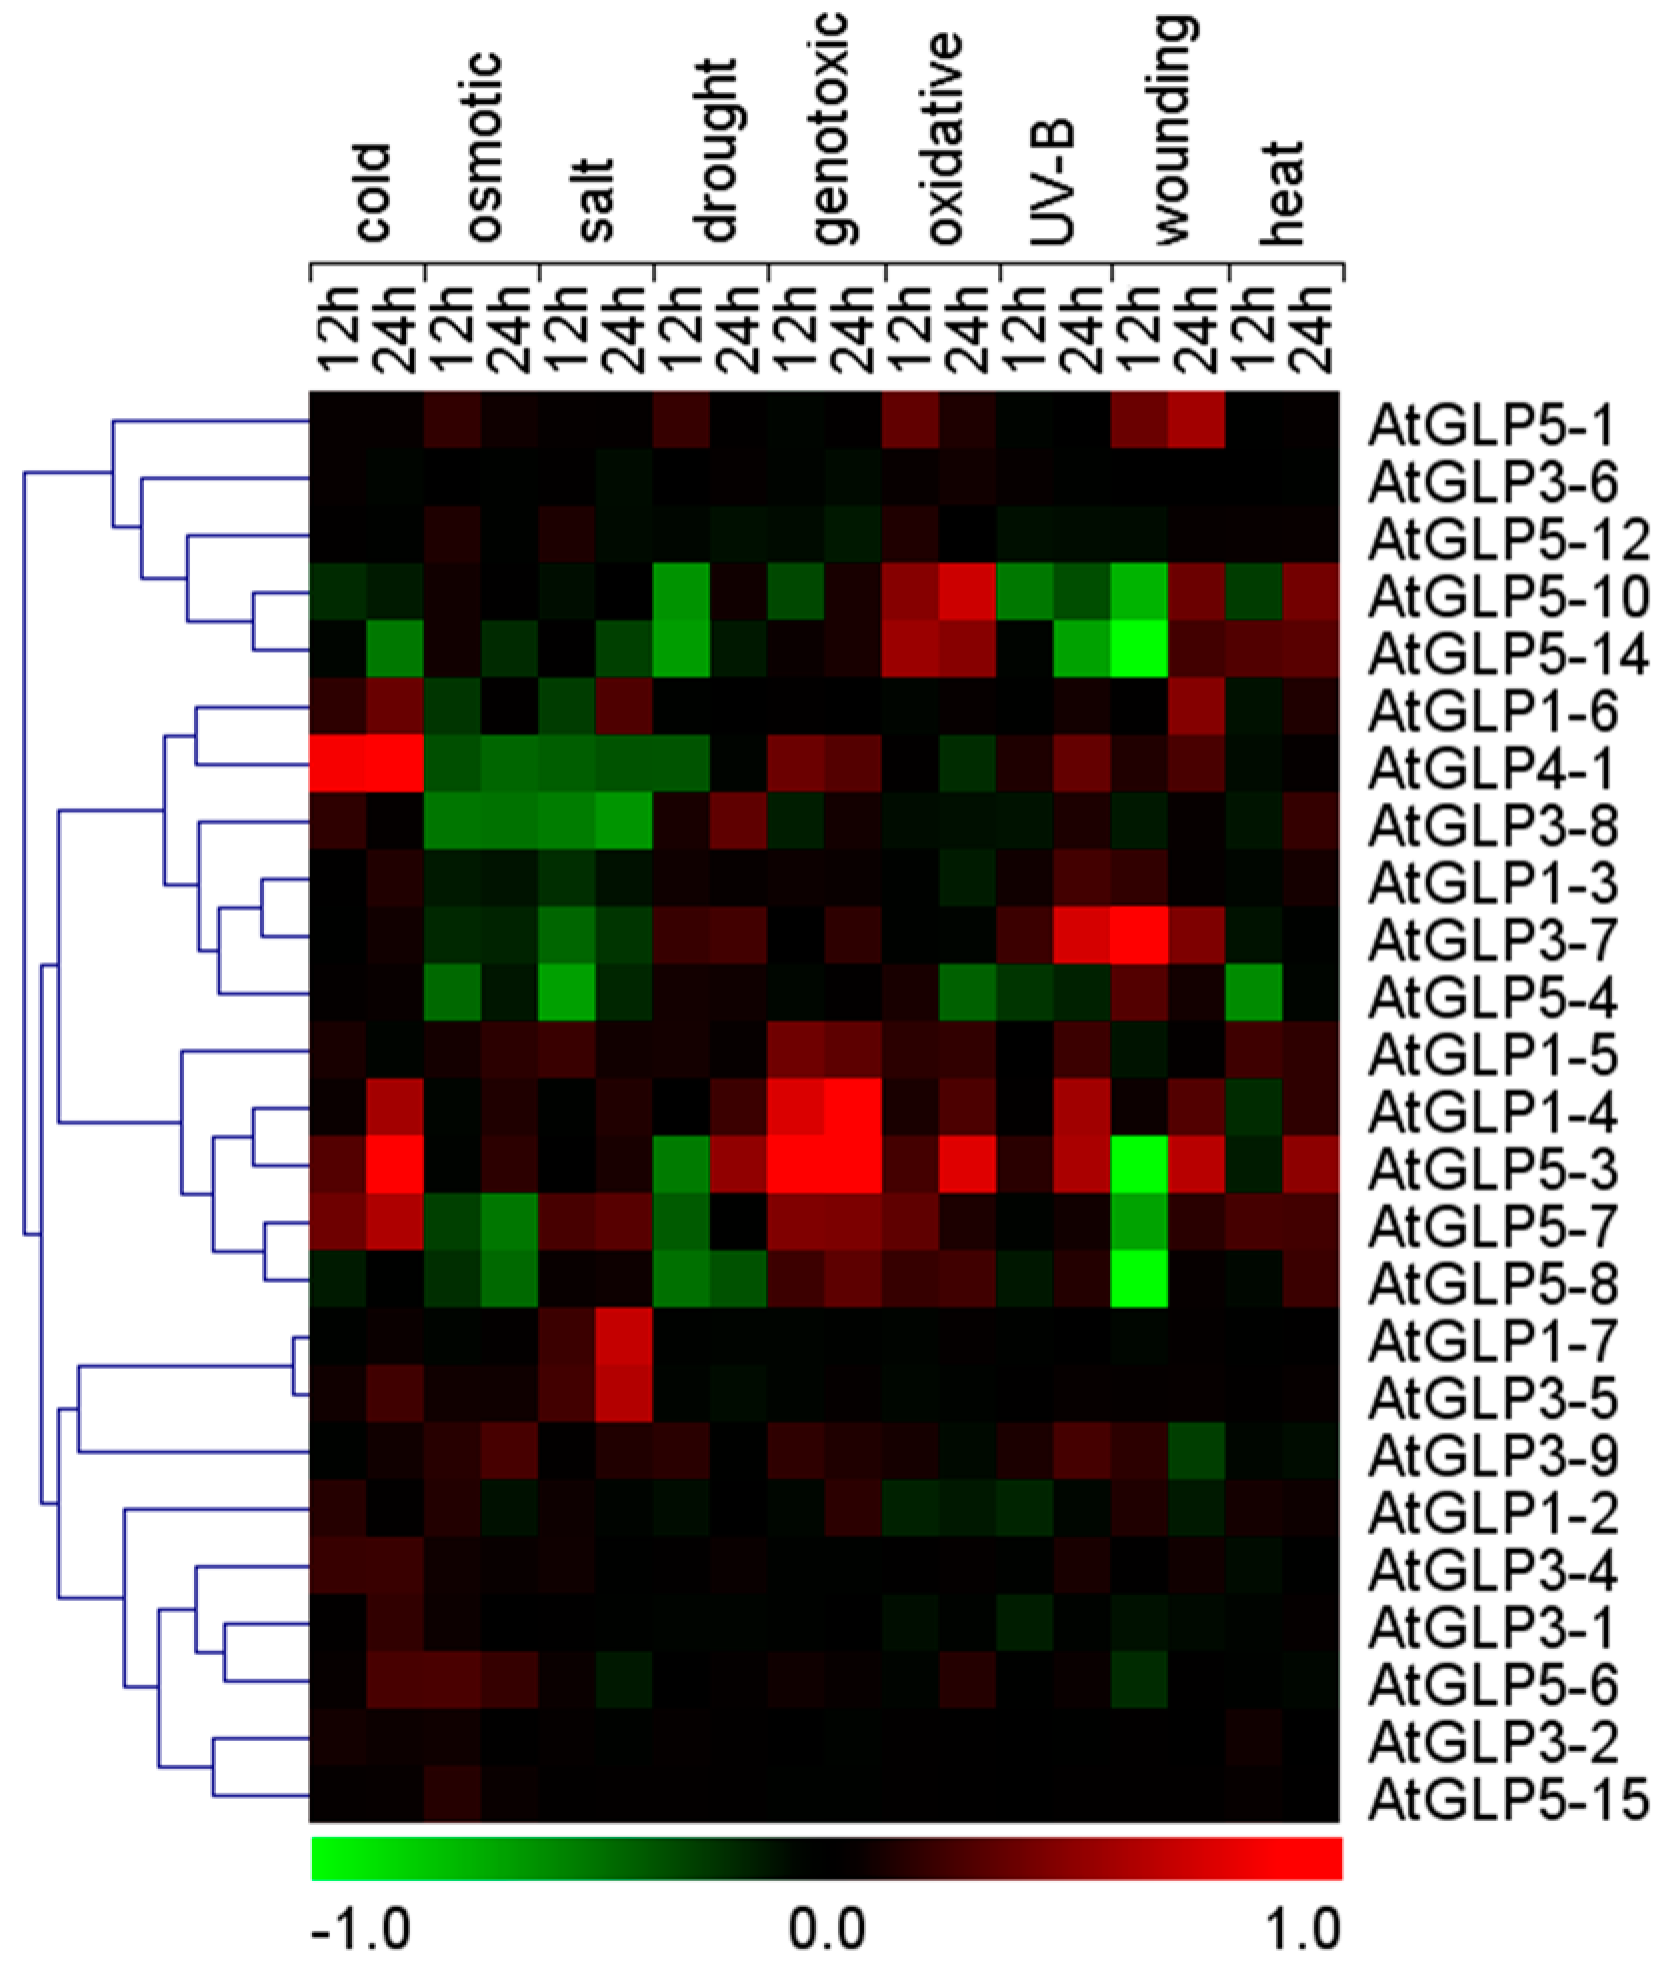
2.5. Differential Expression of GLP Genes during Abiotic Stress

We analysed the differential expression of GLP genes of rice seedlings under different abiotic stresses (desiccation, salt, cold, and heavy metals) with microarray data of GSE6901 [35] and GSE25206 [36] (Figure 4; Table S6). OsGLP3-7, OsGLP4-1, and OsGLP8-12 were down-regulated under desiccation, salt and cold stress, while OsGLP3-6 was up-regulated during these three stresses (Figure 4A). OsGLP8-4, OsGLP8-10, OsGLP8-7, and OsGLP8-11 were down-regulated under desiccation and salt stress, but up-regulated or unchanged under cold stress. Similarly, OsGLP2-4, OsGLP3-3, and OsGLP3-6 were up-regulated under desiccation and salt stress and nearly unchanged under cold stress. These results showed that cold stress did not affect the expression of OsGLP genes significantly. Besides, 11 OsGLP genes were differentially expressed by more than 2-fold under at least one of heavy metal stresses (Figure 4B). Overall, the expressions of the OsGLP genes in the largest cluster on chromosome 8 and that of OsGLP4-1 on chromosome 4, were significantly regulated under various abiotic stresses (desiccation, salt, cold, and heavy metals) in rice. The differential expressions of representative GLP genes was also confirmed by qRT-PCR analysis (Figure 4C,D). Although the accurate fold changes of some genes obtained by microarray or qRT-PCR were slightly different, the variation tendencies of all the examined genes were identical. These results indicated that minimal variation in the expression data and high consistency between the results were obtained using these two techniques.Similarly, Arabidopsis microarray data in response to different abiotic stresses (cold, osmotic stress, salt, drought, genotoxic, oxidative, UV-B, wound, and heat) in root was retrieved from AtGenExpress (Figure 5, Table S7). Seven members in the tandem cluster of chromosome 5 might be involved in response to abiotic stresses (AtGLP5-3, AtGLP5-4, AtGLP5-7, AtGLP5-8, AtGLP5-6, AtGLP5-10, and AtGLP5-14), which were differently regulated under various abiotic stresses. Besides, the genes in tandem cluster on chromosome 1 (AtGLP1-4 and AtGLP1-5) were up-regulated under certain abiotic stress. AtGLP4-1 was up-regulated under cold stress, but down-regulated under osmotic and salt stresses. AtGLP3-7 and AtGLP3-8 were also down-regulated under osmotic and salt stresses, and AtGLP3-7 was up-regulated under UV-B and wound stresses.
Some GLP genes have been implicated in various abiotic stress responses in plants [3,16,21]. For example, different expressions of GLP genes in response to salt in barley [37], cold in Arabidopsis [38], and heavy metals in rice [39] have been reported. It has been shown that GLPs possess SOD activity, this generates H2O2, which plays an important role in defending against various stresses [40]. For example, the overexpression of rice germin-like protein1 in tobacco hyper-accumulates H2O2 and reinforces the cell wall components, and consequently increased tolerance against biotic and abiotic stresses [41]. Some GLPs involved in antioxidant defence and detoxification were identified as Cu-IMAC-binding proteins [39], and Cu stress could decrease the expression of certain GLP genes, such as a GLP subfamily with a three member precursor in the Cu-tolerant plant Elsholtzia splendens [42]. The present study showed that the larger cluster of OsGLP genes on chromosome 8 and the single OsGLP gene on chromosome 4 in rice may be involved in abiotic stresses, similar to the cluster of AtGLP genes on chromosome 5. Arabidopsis has lost large amounts of sequence through deletion [43], while the tandem duplicates expanded in response to environmental stresses [44]. These “hotspot” OsGLP genes related to abiotic stress may be kept by Arabidopsis during natural selection. These genes have also been shown to be involved to biotic stress, which will be discussed below.

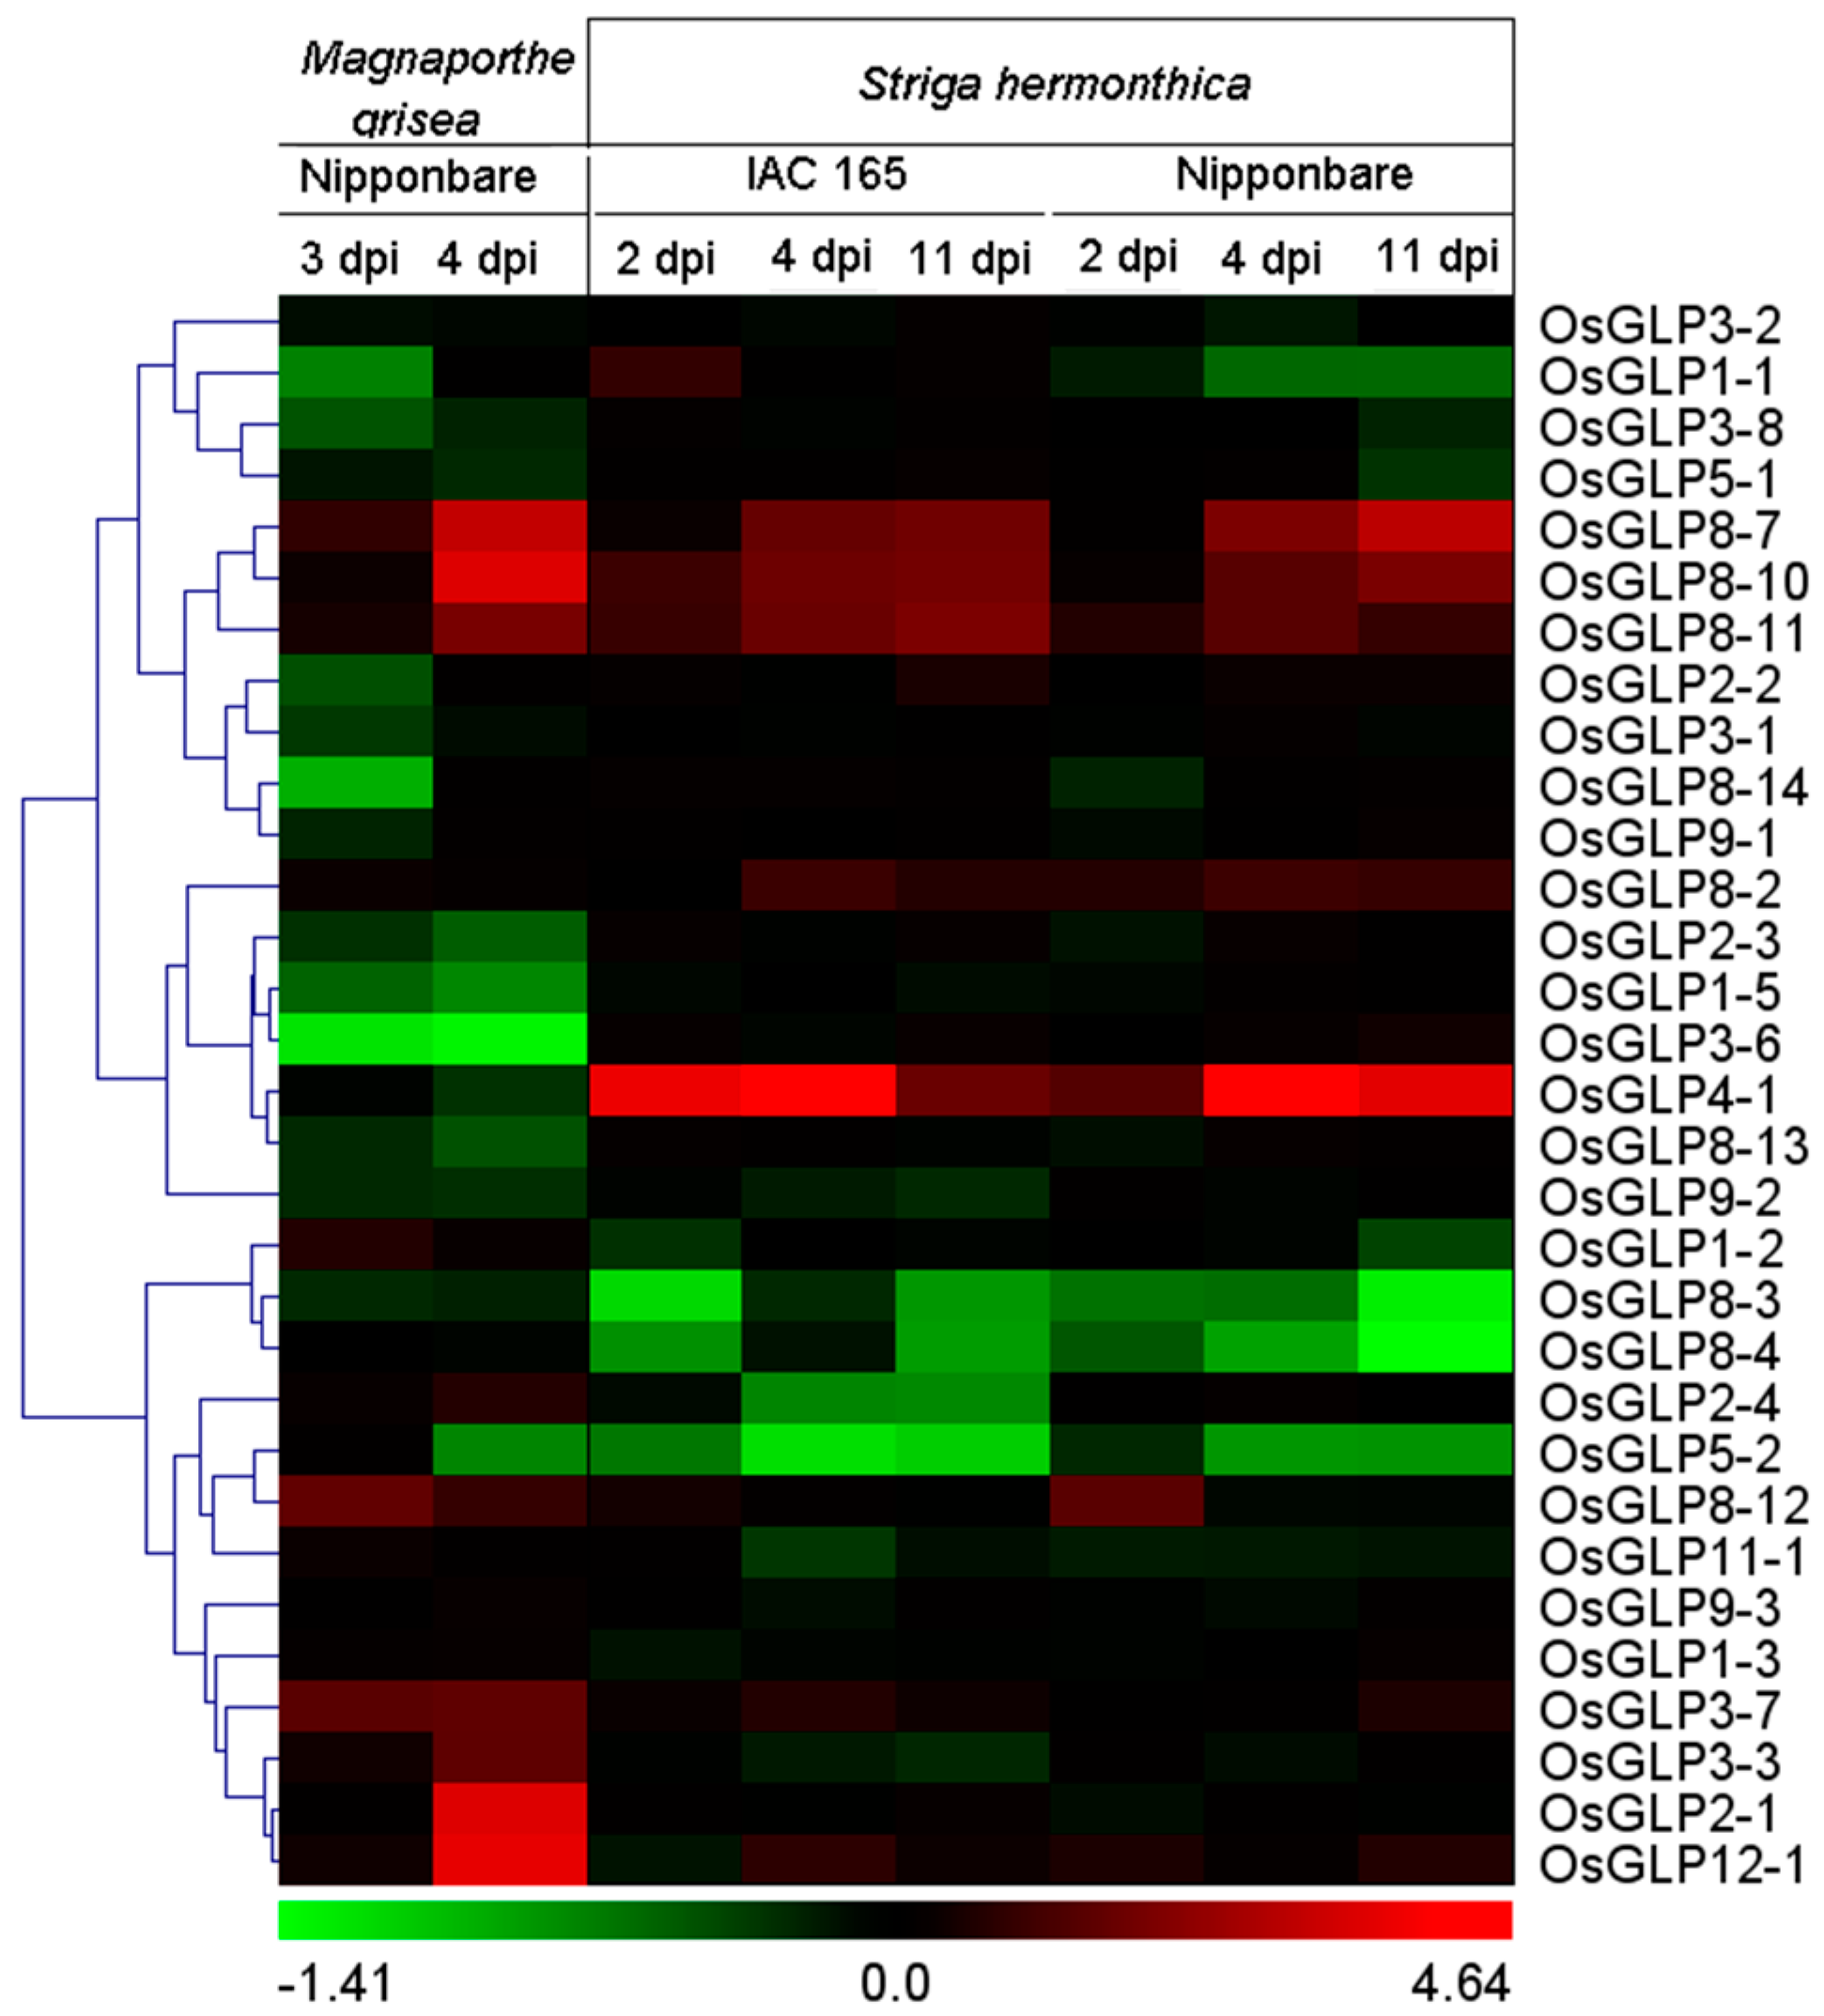
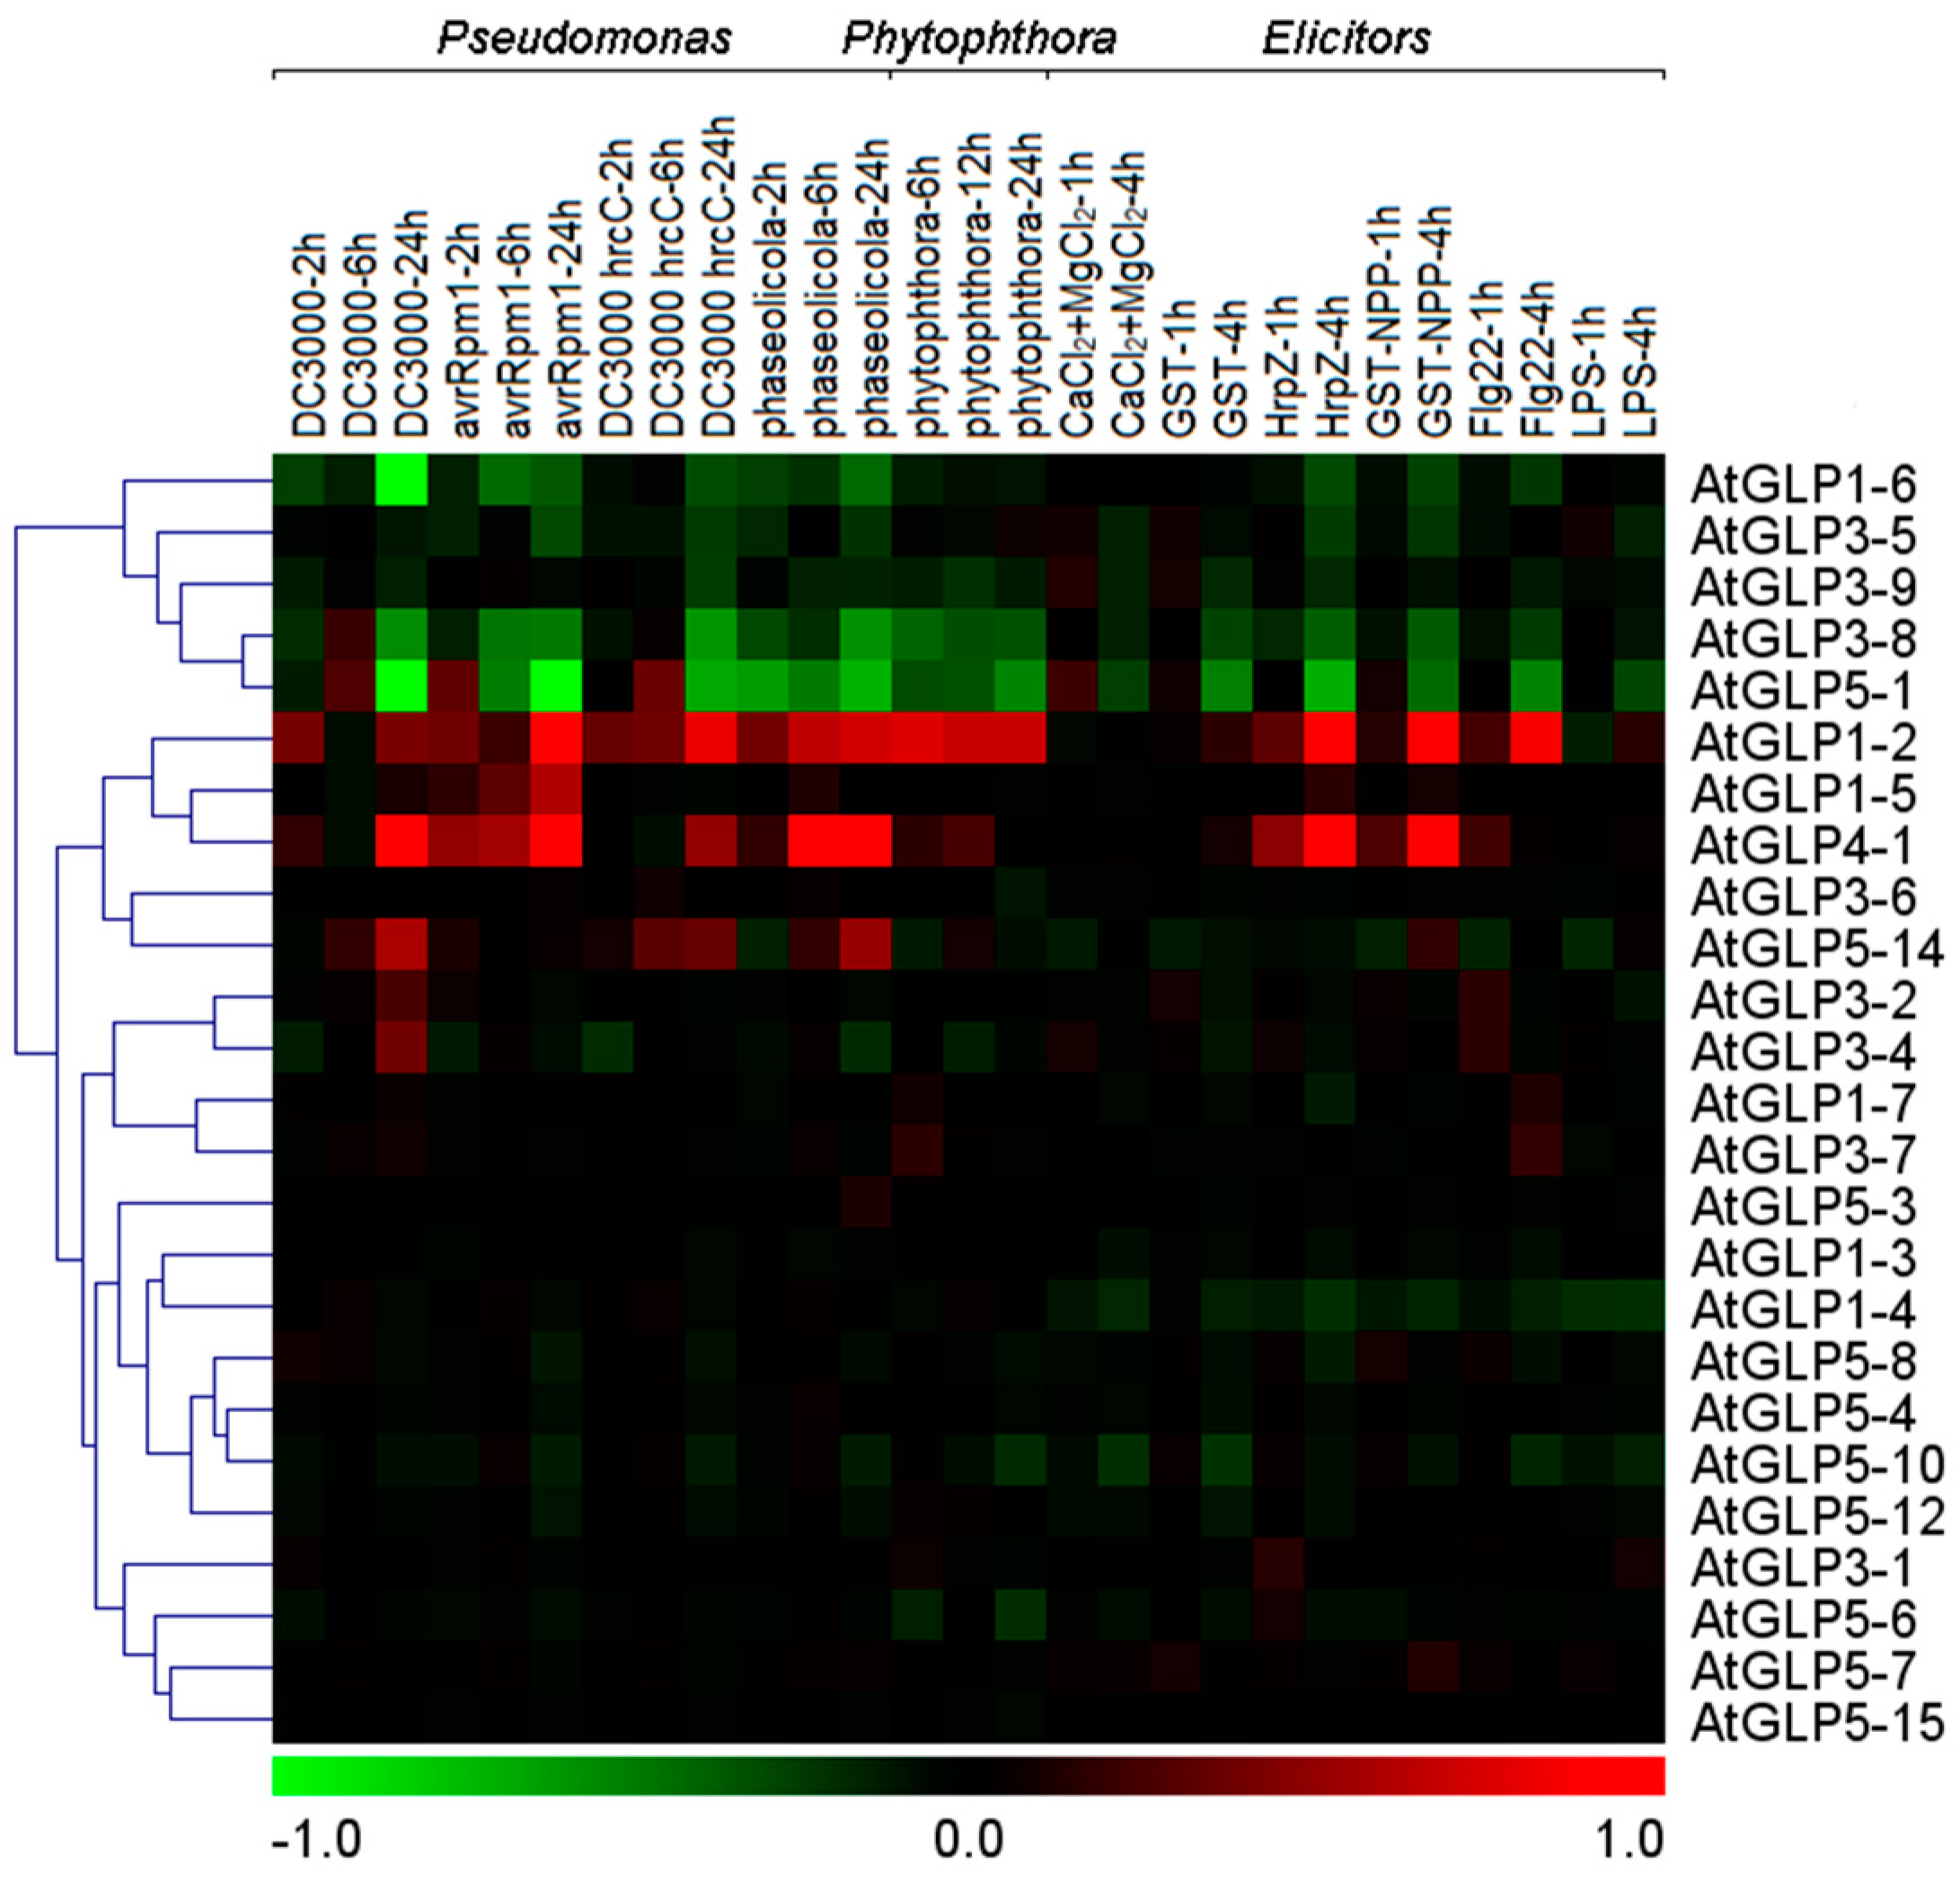
2.6. Differential Expression of GLP Genes during Biotic Stress

It has been shown that the expression of certain GLP genes is increased after infection with pathogens, feed of insects, or chemical application, indicating that GLPs may be involved in plant defence responses [25,27,45]. Rice blast is one of the most serious and widespread diseases caused by Magnaporthe grisea [25], and Striga hermonthica is a hemiparasitic weed that can infect cereals [46]. To study the effect of biotic stresses on the expressions of GLP genes in rice, the OsGLP gene responses to M. grise and two varieties of S. hermonthica (Nipponbare and IAC165) were analysed using GSE7256 and GSE10373 respectively [46,47]. A total of nine GLP genes were differentially expressed under M. grisea infection (Figure 6, Table S8). To be specific, four OsGLP genes on chromosome 8 (OsGLP8-7, OsGLP8-10, OsGLP8-11, and OsGLP8-12) were up-regulated. Besides, OsGLP2-1, OsGLP3-3, OsGLP3-7, and OsGLP12-1 were up-regulated, and OsGLP3-6 was down-regulated. As regards S. hermonthica infection, 8 GLP genes were differentially expressed by more than 2-fold under infection with the Nipponbare variety, while the expression of 6 genes changed after exposure to the IAC165 variety. Among them, the expression of three OsGLP genes on chromosome 8 (OsGLP8-7, OsGLP8-10 and OsGLP8-11) and OsGLP4-1 were significantly up-regulated, while OsGLP8-3 was down-regulated in response to both two varieties. These results indicated that the tandem duplicated OsGLP genes on chromosome 8 might be involved in disease resistance. Previous studies have reported that these genes provide quantitative disease resistance as a quantitative trait loci (QTL) [25]. What is noteworthy is that the expression of OsGLP4-1 was significant induced under S. hermonthica infection but not regulated under M. grisea challenging. Interestingly, both the expressions of OsGLP1-5 and OsGLP5-2, located in segmentally duplicated regions, were slightly down-regulated under M. grisea infection.
AtGLP genes that respond to pathogens (Pseudomonas and Phytophthora) and elicitors [flagellin frgment 22 (Flg22), lipopolysaccharides (LPS), harpin (HrpZ), glutathione S-transferases (GST) and GST-necrosis-inducing phytophthora protein 1 (GST-NPP1)] were analysed using microarray data [48,49,50,51]. The expressions of 8 AtGLP genes were significantly changed under various biotic stress conditions (Figure 7, Table S9). Among them, AtGLP3-8 and AtGLP5-1 were significantly down-regulated under both pathogen and elicitor treatments, while AtGLP1-2 and AtGLP4-1 were significantly up-regulated. No disease resistance QTL region was found in Arabidopsis.
The influence of plant defence by GLPs is likely related to their SOD activity [23,27,52]. Superoxide produced by NADPH oxidase or peroxidases in response to pathogen attack is predicted to be dis-mutated to H2O2 by the GLPs, accounting for the accumulation of H2O2 [41]. H2O2 is an important component of plant defence responses, such as cell wall structure protein stiffening and lignification, as well as papillae formation [53]. In previous studies, GLP genes located on chromosome 8 in rice were reported to be the key disease-resistance genes [18,25]. Their orthologous GLP members in barley and grapevine are also implicated in basal defence responses [23,27], which suggests that the resistance conferred by the OsGLP genes on chromosome 8 is via a broad-spectrum, basal mechanism conserved among the Gramineae. Natural selection may have preserved a cluster of OsGLP genes on chromosome 8 to provide a stepwise, flexible defence response to pathogen invasion.

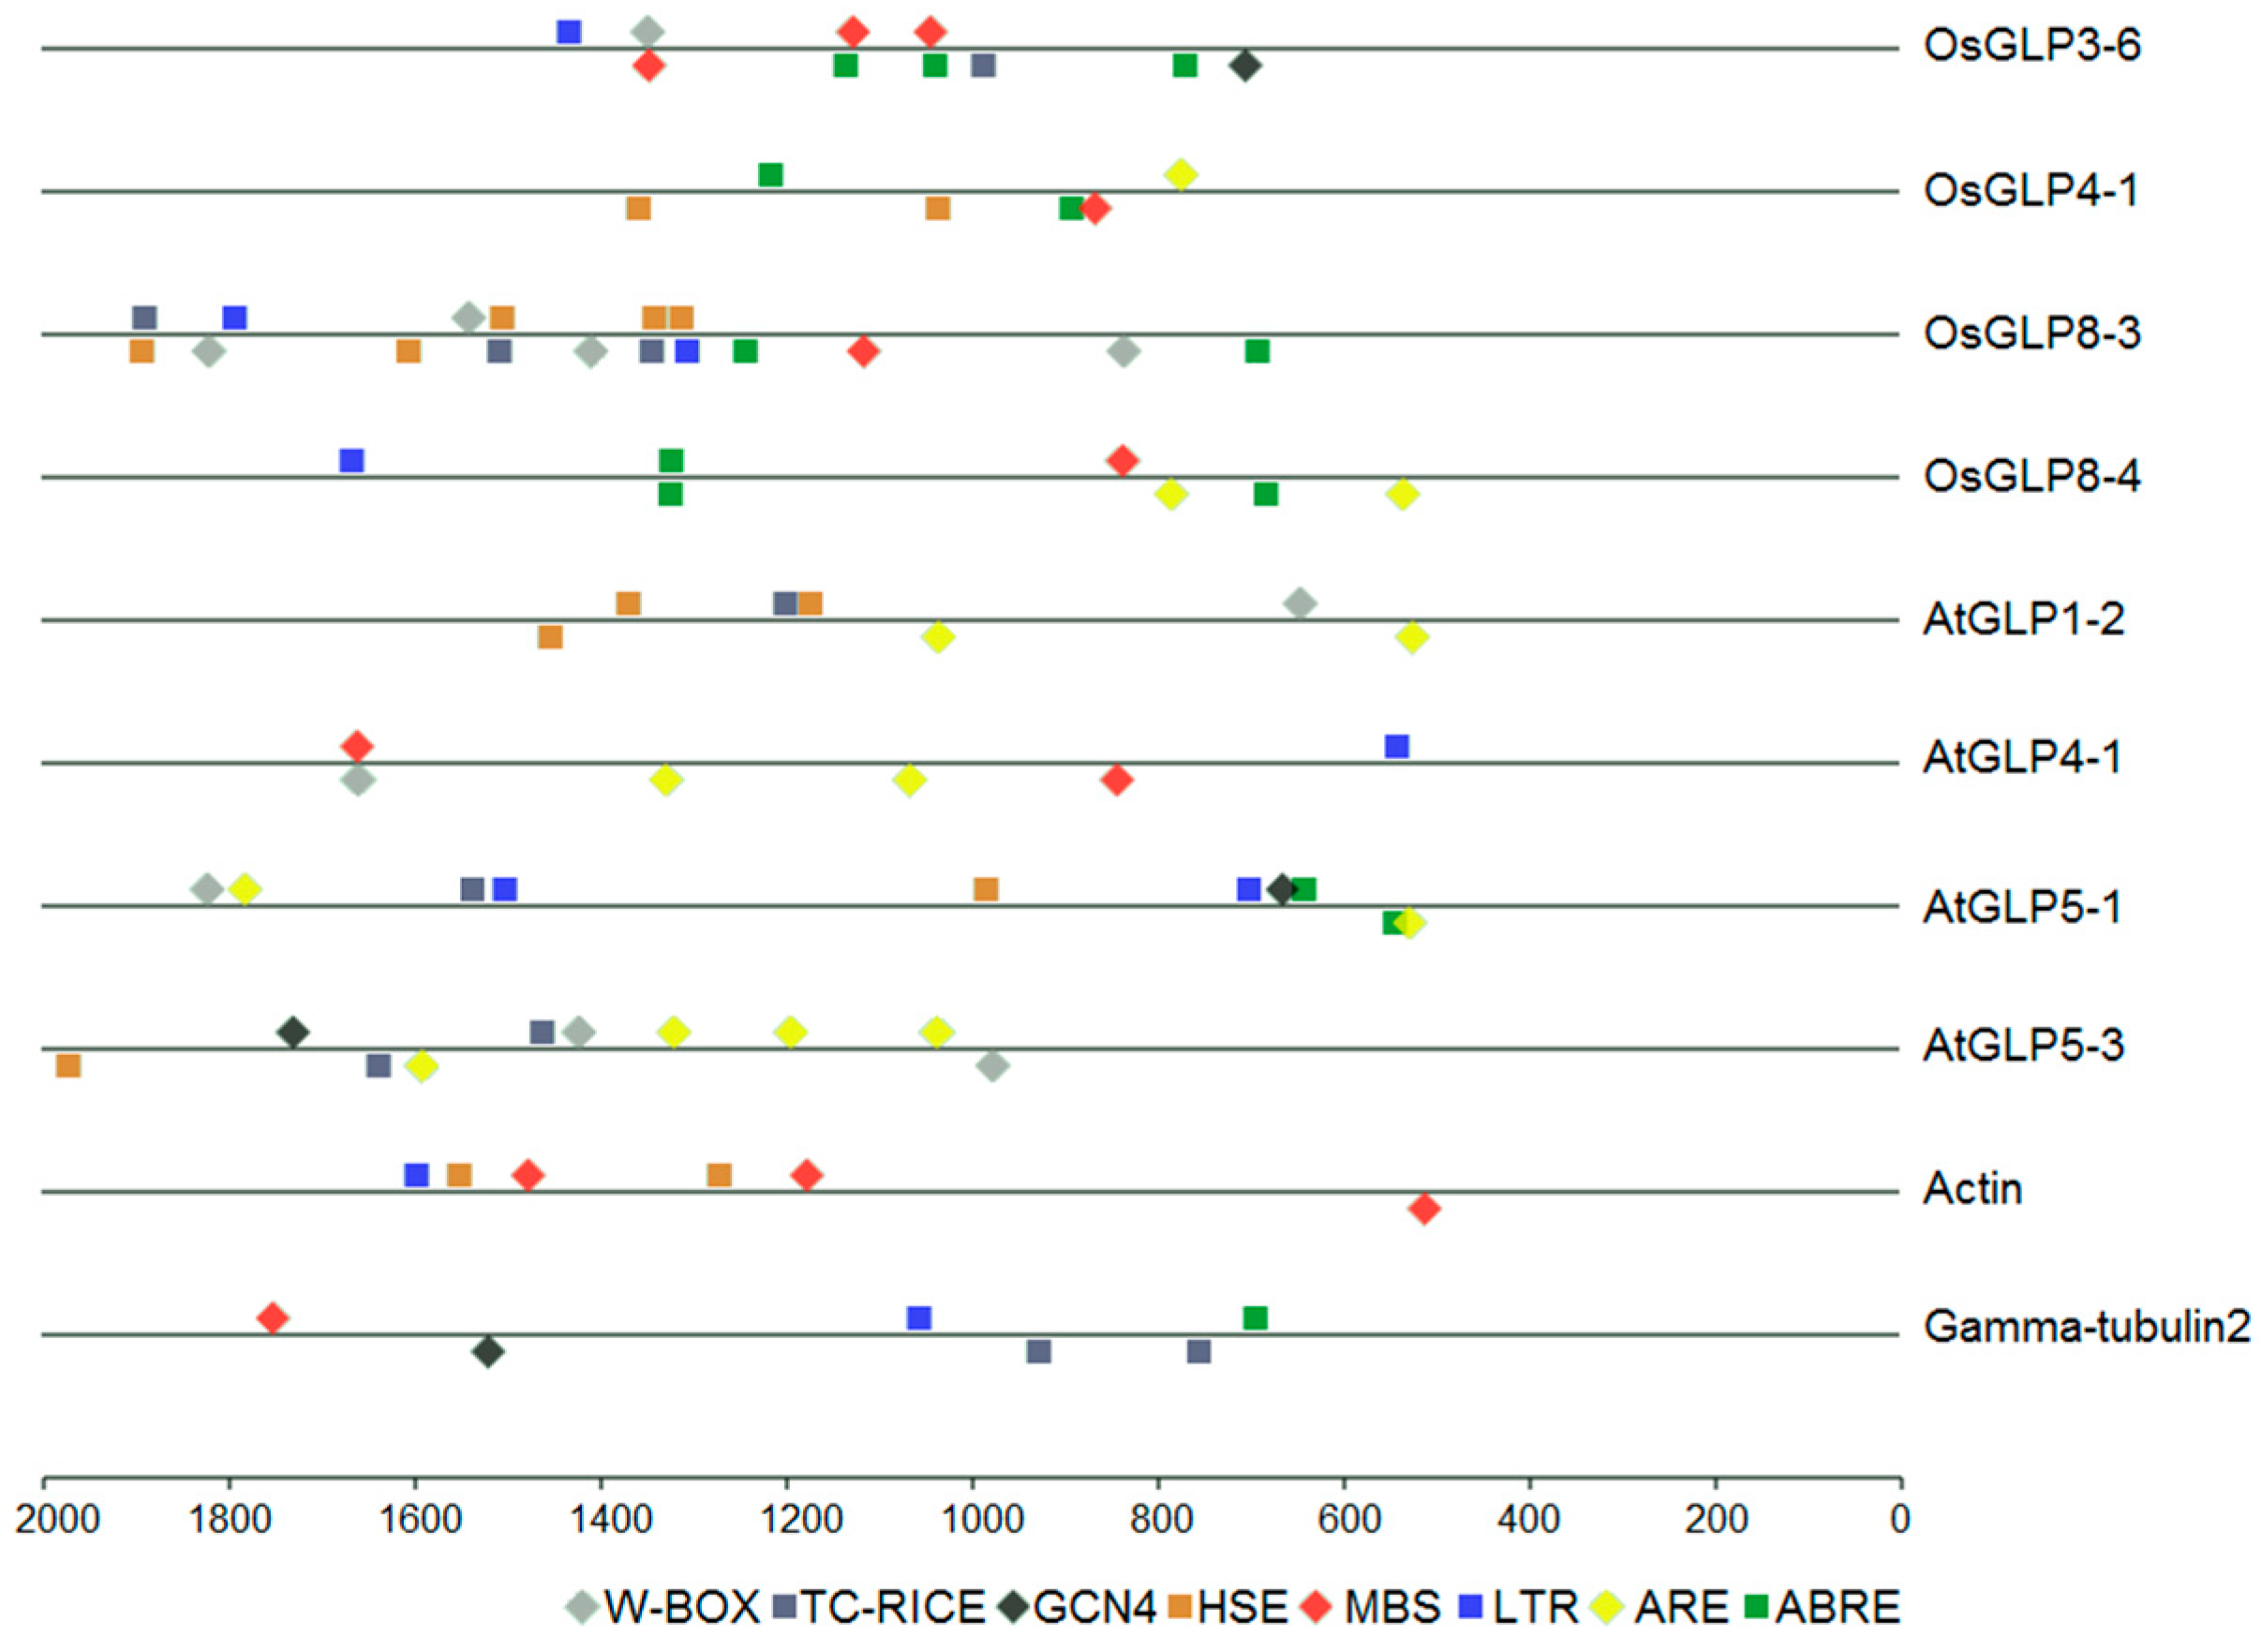
2.7. cis-Regulatory Elements in the Promoter of GLP Genes

Conserved regulatory elements in GLP promoter sequences have been reported to be responsive to environmental stresses and growth factors [21,54]. Here, the promoter analysis was performed for GLP genes whose promoter sequences (–2.0 kb) were available in the RGAP and TAIR genome database (Table S10). Eight abiotic/biotic stress-induced GLP genes (four from rice and four from Arabidopsis) were randomly selected to compare with sets of two housekeeping promoters (Actin and γ-tubulin2) (Figure 8). A total of eight stress and developmental-related cis-elements were selected for promoter analysis, including ABA responsive element (ABRE), anaerobic response element (ARE), low temperature responsive element (LTR), myb-binding site (MBS), heat shock element (HSE), endosperm expression (GCN4), TC-rich repeat responsible for defence, and stress (TC-RICH) and wounding and pathogen response (W-BOX). We found that each GLP gene examined in the analysis contained at least four regulatory elements in their promoter regions, while only three regulatory elements were found in Actin promoter and five were found in γ-tubulin2 promoter (Figure 8). Compared with the two housekeeping promoters, two stress-related cis-elements (W-BOX and ARE) were only found among the promoter regions of GLP genes, and each GLP gene contained at least one of the two cis-elements. Six regulatory elements were found in the 2 kb upstream region of OsGLP3-6 which was commonly up-regulated during cold, drought, salt, and different heavy metal stresses, while AtGLP5-1, which contained seven regulatory elements, was down-regulated in both Pseudomonas and Phytophthora biotic stress. Although the promoter regions of OsGLP8-3 and OsGLP8-4 contained many stress-related cis-elements, both genes were down-regulated under abiotic and biotic stress. The cis-element GCN4, which is essential for endosperm-specific expression, was identified in three genes (OsGLP3-6, AtGLP5-1, and AtGLP5-3). These three genes were highly expressed under developmental conditions. Besides, TC-RICH cis-element has been identified in the promoter region of five GLP genes, suggesting that they might play important roles in response to stress conditions (Figure 8).

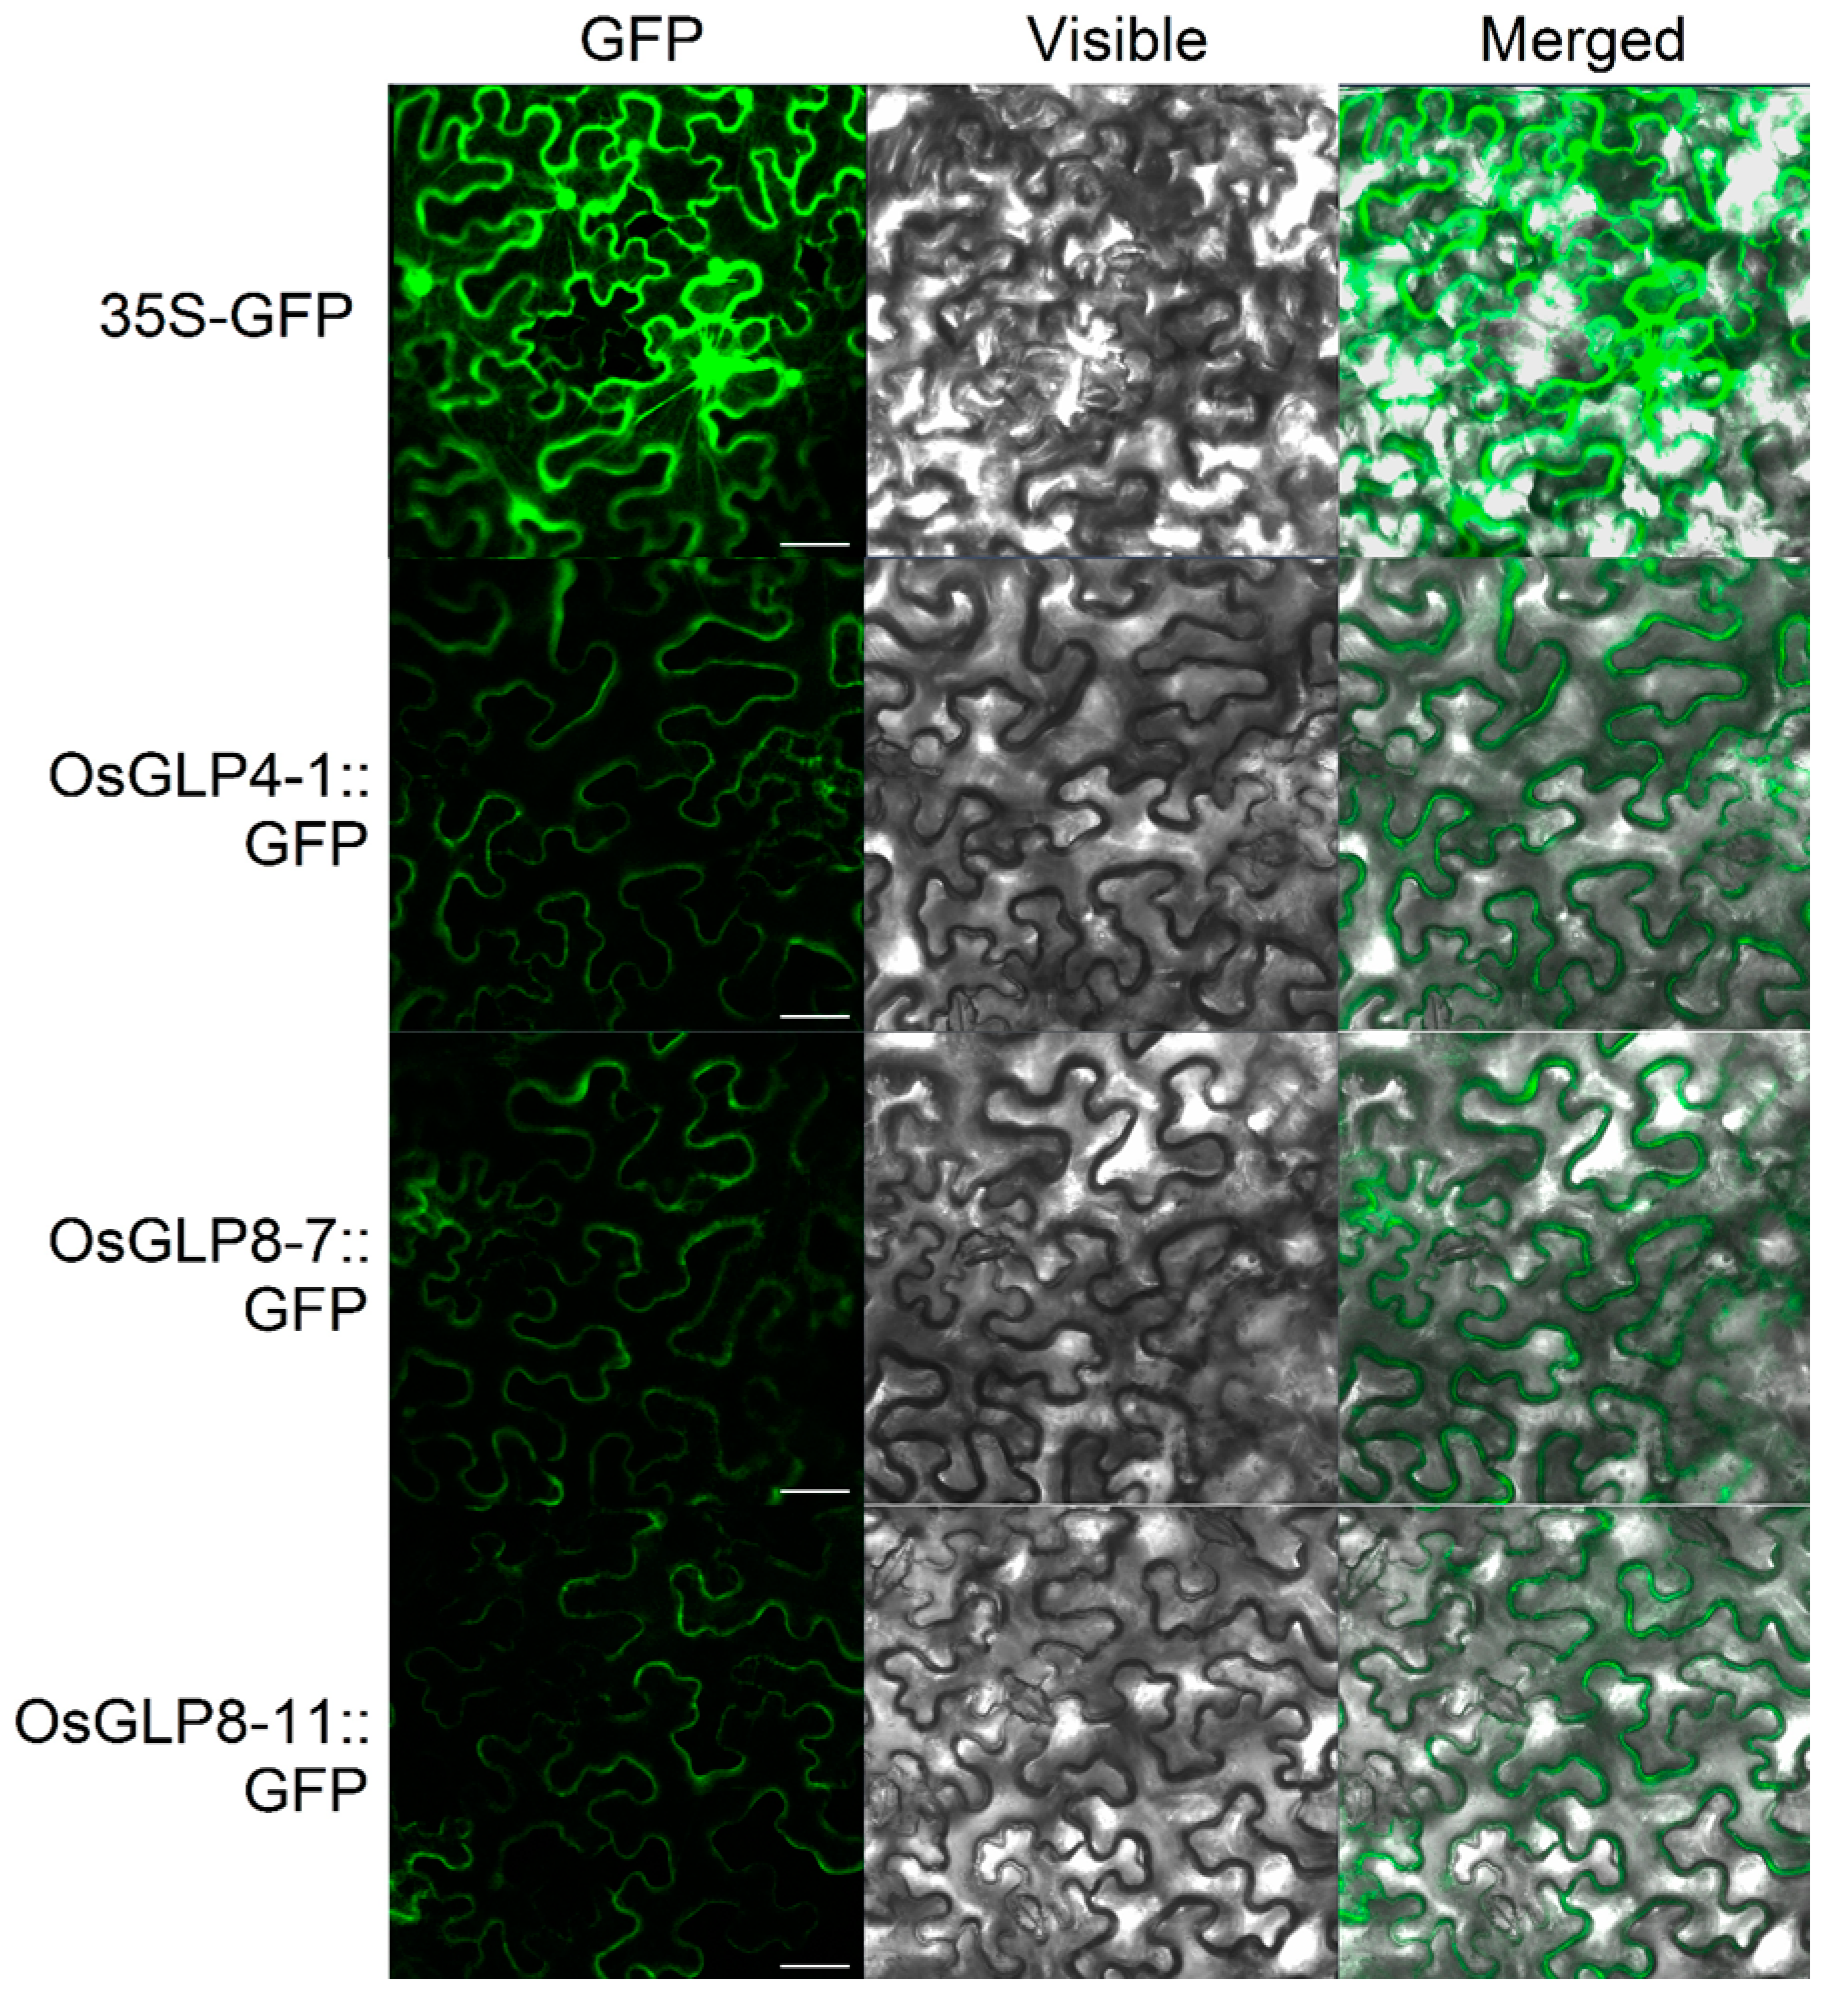
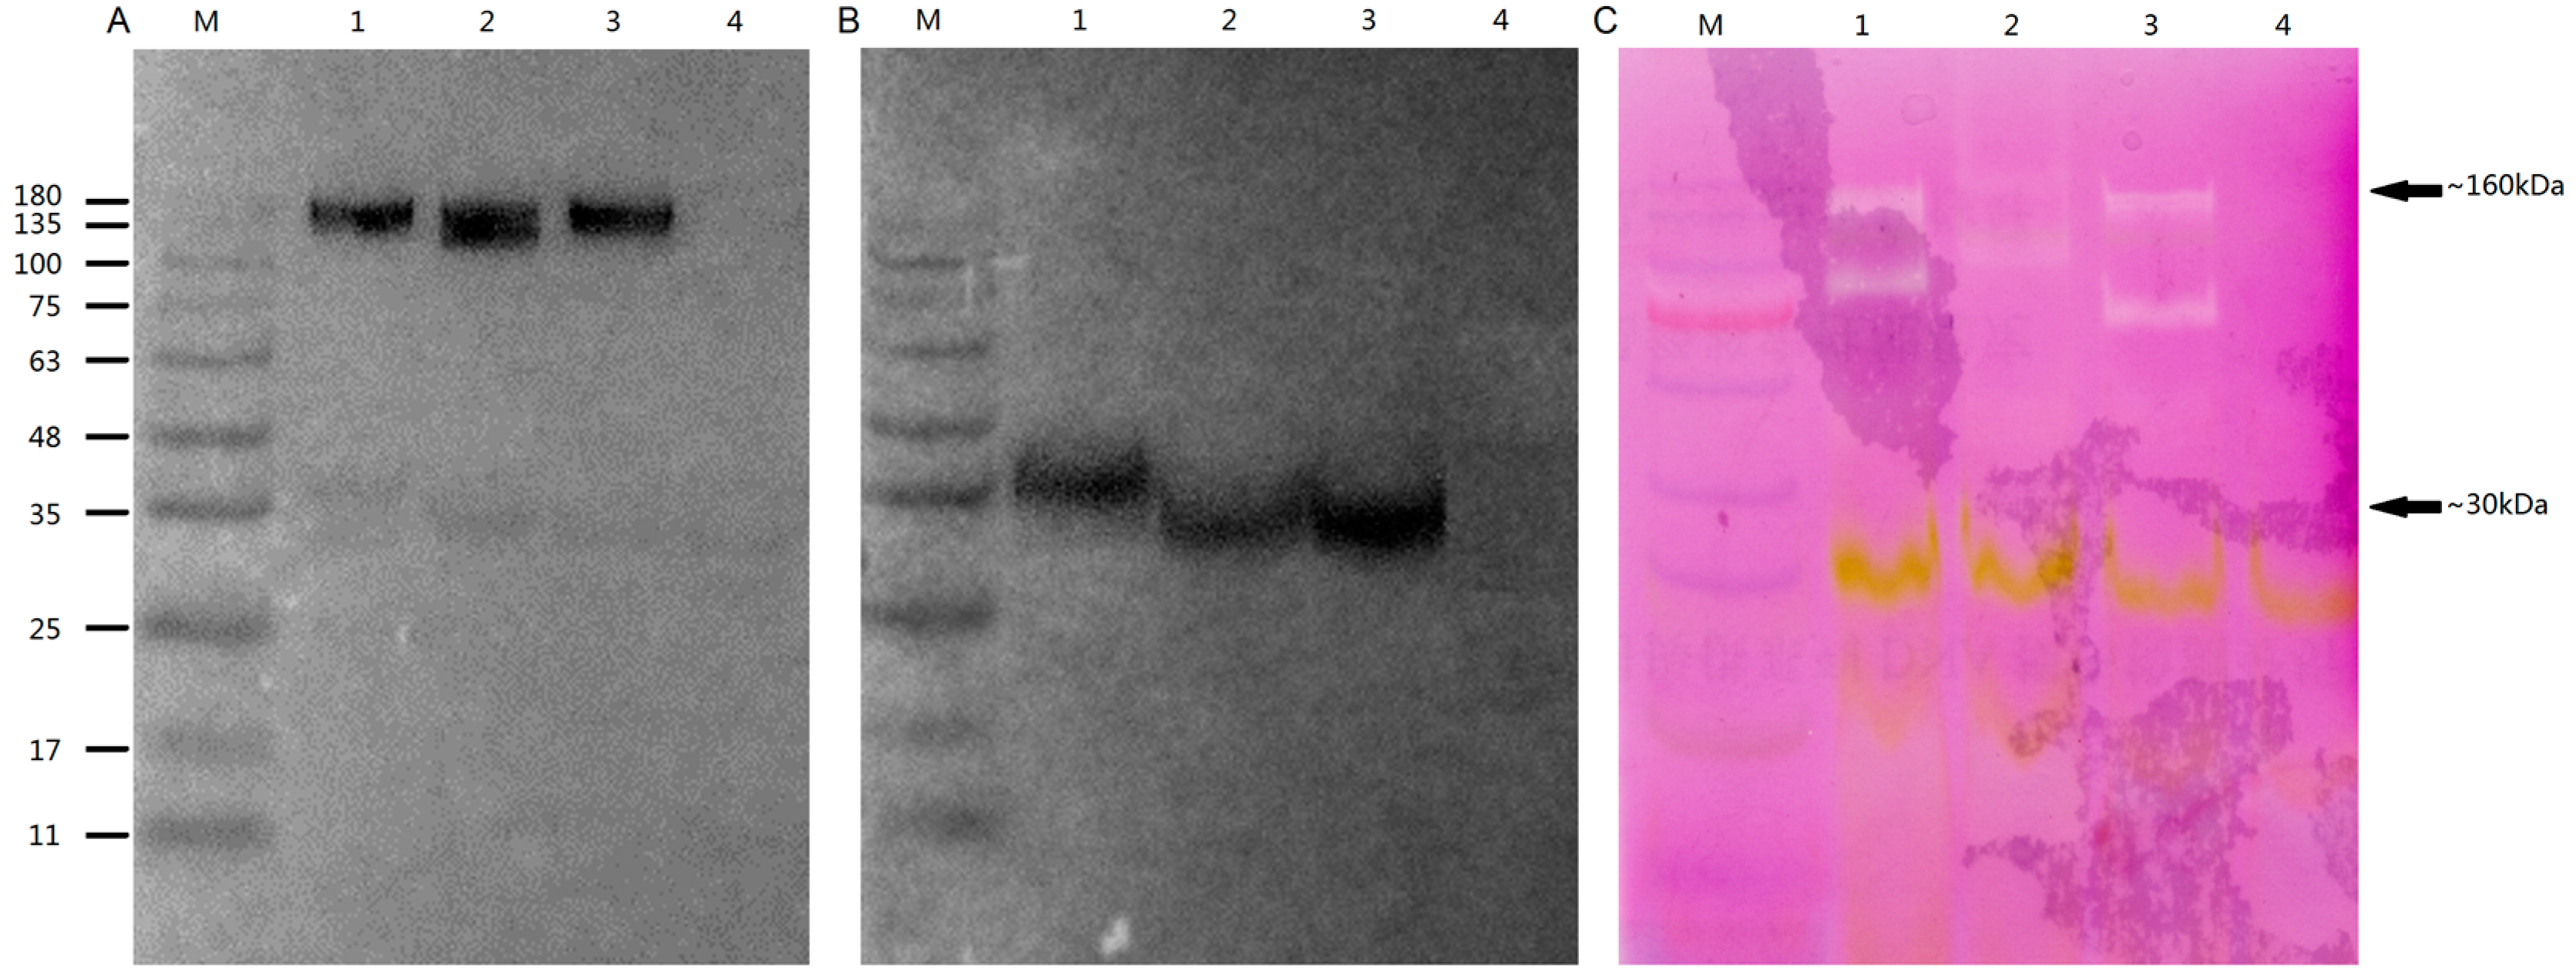
2.8. Subcellular Localisation and Enzyme Activity of OsGLPs

Considering OsGLP genes on chromosome 8 and 4 were sensitive to various stresses, two genes on chromosome 8 (OsGLP8-7 and OsGLP8-11) and one gene on chromosome 4 (OsGLP4-1) were randomly selected to study their subcellular localisations and enzyme activity. Fusion proteins of OsGLP4-1, OsGLP8-7, and OsGLP8-11 with C-terminal green fluorescent proteins (GFP) or a triple FLAG tag (3× FLAG) were detected by transient expression in the heterologous plant, Nicotiana benthamiana. The results showed that the control vector (35S–GFP) was distributed throughout the whole cell including cell nucleus, cytoplasm and plasma membrane, and cell wall, while the fusion proteins of OsGLP4-1, OsGLP8-7, and OsGLP8-11 were only distributed in the cell wall (Figure 9, Figure S1). To further confirm this result, the target N. benthamiana was plasmolysed, and no fluorescence remained in the cell plasmalemma. Meanwhile, the three fusion proteins of OsGLP::FLAG were detected in vitro immunoblotting and through SOD activity analysis (Figure 10). These OsGLP fusion proteins showed a band ~160 kDa (without boiling) (Figure 10A) or ~30 kDa (boiling) (Figure 10B). In the SOD activity assay, all these three proteins showed SOD activity. A cell-wall-associated GLP in rice was found to be enriched in sub-epidermal cells [17]. Both gene silencing in epidermal cells of N. attenuata and transgenic ectopic expression studies in soybean indicated that the expression of GLP genes in the cell wall is related to abiotic and biotic stress [55,56]. GLP gene expression has been shown to increase within plant cells during plant interactions with pathogenic microflora, inducing an “oxidative burst” response [24]. GLPs could transform superoxide to H2O2 and CO2, as well as reinforce the cell wall through protein coupling and glycosylation [10].

3. Materials and Methods

3.1. Identification of GLPs in Arabidopsis and Rice

To identify GLPs in Arabidopsis and rice, a hidden Markov model (HMM) search was performed using the TAIR 10 (http://arabidopsis.org) and RGAP 7 (http://rice.plantbiology.msu.edu/) databases (E-value ≤ 1 × 10⁻¹⁰). All putative GLPs identified were subjected to Pfam (http://Pfam.sanger.ac.uk/) to verify the presence of cupin_1 domain (PF00190). The putative GLPs containing a cupin_1 domain were furtherly confirmed by SMART (http://smart.embl-heidelberg.de/).

3.2. Chromosomal Organisation and Phylogenetic Analysis

Chromosome localizations of GLP genes were analysed by the MapInspect software [57]. The GLP genes separated by a maximum of five genes were identified as tandem duplicated genes. Multiple sequence alignment was performed using MAFFT [58]. Phylogenetic analyses were conducted using Bayesian inference (BI) implemented in MrBayes [59] through the server at CIPRES Science Gateway (http://www.phylo.org/). Four independent runs were performed with four differentially heated Metropolis-coupled Monte Carlo Markov chains for 2 × 10⁶ million generations starting from a random tree, and model parameters were estimated during the analysis. After that, 100 trees were sampled from each run to determine the final consensus tree and posterior probabilities for each clade. The gene structure schematic diagrams were drawn using GSDS (Gene Structure Display Server; http://gsds1.cbi.pku.edu.cn/).

3.3. Promoter Analysis

To identify the various cis-acting regulatory elements in promoters of GLP genes, 2000 base pairs upstream of the CDS were extracted from TAIR 10 and RGAP 7 databases. The upstream sequence was subsequently scanned in the PLACE software [60] to analyse the presence of various cis-regulatory elements.

3.4. Expression Analysis Using the MPSS and Microarray Data

Expression profiles were obtained from the Arabidopsis and rice MPSS project websites (http://mpss.udel.edu/). MPSS data from 22 mRNA libraries representing 18 different tissues/organs of rice, and 17 mRNA libraries representing 9 different tissue/organs of Arabidopsis, were used for the analysis. The expression profile of Arabidopsis GLP genes from microarray data was analysed by AtGenExpress [61]. The samples for these microarray experiments included root tissues under abiotic stress conditions (salt, drought, osmotic, cold, heat, oxidative, genotoxic, wounding, and UV/B), leaf tissues under biotic stress conditions (challenging by Pseudomonas and Phytophthora), and tissues/organs with different developmental stages [61]. Fold changes at the transcript level were calculated by comparing with controls. For the developmental stage data of Arabidopsis, heat maps were generated based on log10 transformed Affymetrix values, and hierarchical clustering analysis was performed using the MeV software package [62]. For rice GLP genes, the expression profiles from Affymetrix GeneChip rice genome arrays [63] were used, including GSE6893 (various stages of development), GSE7951 (stigma and ovary of rice), GSE6901 (rice seedling under cold, salt, or drought stress conditions), GSE25206 (root tissue of rice under heavy metals stress conditions), GSE7256 (seedling infected by M. grisea), and GSE10373 (root tissue of two rice cultivars infected by S. hermonthica). Among them, the developmental stages of GSE6893 covered root of 7-day old seedling, mature leaf (collected before pollination), young leaf, shoot apical meristem (SD-7-day old seedling), six stages of panicle (i.e., P1 (0–3 cm panicle), P2 (3–5 cm panicle), P3 (5–10 cm panicle), P4 (10–15 cm panicle), P5 (15–22 cm panicle), and P6 (22–30 cm panicle)), and five stages of seed tagged from day of pollination (DAP) (i.e., S1 (0–2 DAP), S2 (3–4 DAP), S3 (5–10 DAP), S4 (11–20 DAP), and S5 (21–29 DAP)). The expression profiles of rice were graphically presented in a heat map based on log2 fold change after value normalisation using R software (R Development Core Team, Vienna, Austria).

3.5. Plant Material and Stress Treatment for qRT-PCR Analysis

Seeds of rice cultivar (O. sativa “Nipponbare”) were germinated in the hydroponic system. The seedlings were grown in Yoshida medium [64] in a growth chamber at 28 ± 1 °C under a 16-h light/8-h dark photoperiod. After 7 days, various stress treatments were administered to seedlings viz. salinity stress (200 mM NaCl for 3 h), dehydration (dried between folds of tissue paper for 3 h), cold stress (4 °C for 3 h), or heavy metal stress (100 µM Cr6+/100 µM As5+/100 µM Cd2+/100 µM Pb2+ solutions for 24 h). After treatment, seedlings were cut, weighed, and frozen in liquid nitrogen until further use. Total RNA was extracted using the RNA simple Total RNA Kit (Tiangen Biotech, Beijing, China) according to the manufacturer’s instructions, treated with DNase I, and then converted to cDNA using PrimeScript RT Master Mix (TaKaRa, Dalian, China). To verify the expression pattern of GLP genes obtained from microarray data, qRT-PCR was performed using randomly selected genes from OsGLP genes sensitive to abiotic stresses. Same tissues were used in qRT-PCR and microarray analysis. Primers were designed in the 3’UTR unique regions of each selected genes using Primer3 software (Tables S11–S13). Each primer was checked for its specificity using BLAST. Three biological replicates of each sample were used for qRT-PCR analysis. To normalise variance among samples, actin was used as the endogenous control. The relative gene expression levels of each target gene were calculated using the ΔΔCt method [65].

3.6. Gene Cloning of OsGLPs and Transient Expression

The open reading frame region (without stop codon) of OsGLP4-1, OsGLP8-7, and OsGLP8-11 was amplified using designed primers (Tables S12 and S13). PCR products were then cloned into the PHB-GFP or 1306-3FLAG vector using the ClonExpress one-step cloning kit (Vazyme, Piscataway, NJ, USA) to obtain OsGLP::GFP or 1306-3FLAG fusion vector with the CaMV35S promoter. Then, these OsGLP::GFP or OsGLP::FLAG fusion vectors were transformed into Agrobacterium tumefaciens strain GV3101 by the freeze thaw method [66]. Transformed A. tumefaciens strains were cultivated overnight in 20 mL cultures at 25 °C. Then the cultures was diluted (OD600 = 0.5) and infiltrated into leaves of N. benthamiana with a 1 mL needleless syringe.

3.7. Subcellular Localization of OsGLPS

After 3 days post-inoculation, OsGLP::GFP fusion proteins in N. benthamiana leaves mentioned above were imaged using confocal microscopy (LSM5Pascal; Carl Zeiss, Wetzlar, Germany). Leaves were plasmolysed by incubation in 30% sucrose for 1 h. Leaf sections were mounted on microscope slides in plasmolysis solution.

3.8. Biochemical Analysis in vitro OsGLPs

The OsGLP::FLAG fusion proteins were extracted from ~1 g of N. benthamiana leaves [10]. An in-gel SOD activity assay was performed according to the method of Beauchamp and Fridovich [67]. For immune detection, the fusion proteins were detected essentially as described in Rietz et al. [10].

4. Conclusions

The present study examined the GLP gene family in rice and Arabidopsis. We provided an updated annotation and nomenclature for the GLP family and identified several developmental stage-specific, abiotic and biotic stress-responsive GLP genes. Tandem duplication of GLP genes and the presence of different stress-related cis-regulatory elements in the promoter were also analysed. In addition, SOD enzyme activity and subcellular location analysis indicated that the random selected OsGLP genes on chromosome 8 and 4 of rice were expressed in the cell wall with SOD activity. It is worth mentioning that evidence of altered expression of GLP genes in response to stress is not enough to claim their role for stress tolerance which may be just an indirect consequence of the stress. Thus, more experiments such as studying the stress tolerance of GLP mutants are necessary to explore their role in response to stress.

Supplementary Materials

Supplementary materials can be found at www.mdpi.com/1422-0067/17/10/1622/s1.

Acknowledgments

The research was funded by the Doctoral Program of Higher Education (20120097130004) and the National Natural Science Foundation of China (31672224, 31471938 and 31400328).

Author Contributions

Lu Li carried out the study, data analysis. Chen Chen conceived of and supervised the study, wrote the manuscript. Xihui Xu and Zhenguo Shen edited and revised the manuscript.

Conflicts of Interest

The authors declare no conflict of interest.

Abbreviations

GLPsgermin-like proteins
SODsuperoxide dismutase
OXOoxalate oxidase
SDSsodium dodecyl sulfonate
ROSreactive oxygen species
MPSSmassively parallel signature sequencing
GFPgreen fluorescent protein
BIbayesian inference
GSDSgene structure display server

References

  1. Lane, B.G.; Cuming, A.C.; Fregeau, J.; Carpita, N.C.; Hurkman, W.J.; Bernier, F.; Dratewka-Kos, E.; Kennedy, T.D. Germin isoforms are discrete temporal markers of wheat development. Eur. J. Biochem. 1992, 209, 961–969. [Google Scholar] [CrossRef] [PubMed]
  2. Dunwell, J.M.; Gibbings, J.G.; Mahmood, T.; Naqvi, S.M.S. Germin and germin-like proteins: Evolution, structure, and function. Crit. Rev. Plant Sci. 2008, 27, 342–375. [Google Scholar] [CrossRef]
  3. Lu, M.; Han, Y.P.; Gao, J.G.; Wang, X.J.; Li, W.B. Identification and analysis of the germin-like gene family in soybean. BMC Genom. 2010, 11. [Google Scholar] [CrossRef] [PubMed]
  4. Finn, R.D.; Tate, J.; Mistry, J.; Coggill, P.C.; Sammut, S.J.; Hotz, H.R.; Ceric, G.; Forslund, K.; Eddy, S.R.; Sonnhammer, E.L.; et al. The PFAM protein families database. Nucleic Acids Res. 2008, 36, D281–D288. [Google Scholar] [CrossRef] [PubMed]
  5. Agarwal, G.; Rajavel, M.; Gopal, B.; Srinivasan, N. Structure-based phylogeny as a diagnostic for functional characterization of proteins with a cupin fold. PLoS ONE 2009, 4, e5736. [Google Scholar] [CrossRef] [PubMed]
  6. Bernier, F.; Berna, A. Germins and germin-like proteins: Plant do-all proteins. But what do they do exactly? Plant Physiol. Biochem. 2001, 39, 545–554. [Google Scholar] [CrossRef]
  7. Carrillo, M.G.C.; Goodwin, P.H.; Leach, J.E.; Leung, H.; Cruz, C.M.V. Phylogenomic relationships of rice oxalate oxidases to the cupin superfamily and their association with disease resistance QTL. Rice 2009, 2, 67–79. [Google Scholar] [CrossRef]
  8. Davidson, R.M.; Reeves, P.A.; Manosalva, P.M.; Leach, J.E. Germins: A diverse protein family important for crop improvement. Plant Sci. 2009, 17, 499–510. [Google Scholar] [CrossRef]
  9. Woo, E.J.; Dunwell, J.M.; Goodenough, P.W.; Marvier, A.C.; Pickersgill, R.W. Germin is a manganese containing homohexamer with oxalate oxidase and superoxide dismutase activities. Nat. Struct. Biol. 2000, 7, 1036–1040. [Google Scholar] [PubMed]
  10. Rietz, S.; Bernsdorff, F.E.M.; Cai, D.G. Members of the germin-like protein family in Brassica napus are candidates for the initiation of an oxidative burst that impedes pathogenesis of Sclerotinia sclerotiorum. J. Exp. Bot. 2012, 63, 5507–5519. [Google Scholar] [CrossRef] [PubMed]
  11. Cheng, X.; Huang, X.; Liu, S.; Tang, M.; Hu, W.; Pan, S. Characterization of germin-like protein with polyphenol oxidase activity from Satsuma mandarine. Biochem. Biophys. Res. Commun. 2014, 449, 313–318. [Google Scholar] [CrossRef] [PubMed]
  12. Sakamoto, A.; Nishimura, T.; Miyaki, Y.; Watanabe, S.; Takagi, H.; Izumi, S.; Shimada, H. In vitro and in vivo evidence for oxalate oxidase activity of a germin-like protein from azalea. Biochem. Biophys. Res. Commun. 2015, 458, 536–542. [Google Scholar] [CrossRef] [PubMed]
  13. Guevara-Olvera, L.; Ruíz-Nito, M.; Rangel-Cano, R.; Torres-Pacheco, I.; Rivera-Bustamante, R.; Muñoz-Sánchez, C.; González-Chavira, M.; Cruz-Hernandez, A.; Guevara-González, R. Expression of a germin-like protein gene (CchGLP) from a geminivirus-resistant pepper (Capsicum chinense Jacq.) enhances tolerance to geminivirus infection in transgenic tobacco. Physiol. Mol. Plant Pathol. 2012, 78, 45–50. [Google Scholar] [CrossRef]
  14. Yin, K.; Han, X.; Xu, Z.; Xue, H. Arabidopsis GLP4 is localized to the Golgi and binds auxin in vitro. Acta Biochim. Biophys. Sin. 2009, 41, 478–487. [Google Scholar] [CrossRef] [PubMed]
  15. Segarra, C.I.; Casalongué, C.A.; Pinedo, M.L.; Ronchi, V.P.; Conde, R.D. A germin-like protein of wheat leaf apoplast inhibits serine proteases. J. Exp. Bot. 2003, 54, 1335–1341. [Google Scholar] [CrossRef] [PubMed]
  16. Wang, T.; Chen, X.; Zhu, F.; Li, H.; Li, L.; Yang, Q.; Chi, X.; Yu, S.; Liang, X. Characterization of peanut germin-like proteins, AhGLPs in plant development and defense. PLoS ONE 2013, 8, e61722. [Google Scholar] [CrossRef] [PubMed]
  17. Banerjee, J.; Maiti, M.K. Functional role of rice germin-like protein1 in regulation of plant height and disease resistance. Biochem. Biophys. Res. Commun. 2010, 394, 178–183. [Google Scholar] [CrossRef] [PubMed]
  18. Ham, B.K.; Li, G.; Kang, B.H.; Zeng, F.; Lucas, W.J. Overexpression of Arabidopsis plasmodesmata germin-like proteins disrupts root growth and development. Plant Cell. 2012, 24, 3630–3648. [Google Scholar] [CrossRef] [PubMed]
  19. Berna, A.; Bernier, F. Regulation by biotic and abiotic stress of a wheat germin gene encoding oxalate oxidase, a H2O2-producing enzyme. Plant Mol. Biol. 1999, 39, 539–549. [Google Scholar] [CrossRef] [PubMed]
  20. Mahmood, T.; Nazar, N.; Abbasi, B.H.; Naqvi, S.M.S. Comparative analysis of regulatory elements in different germin-like protein gene promoters. Afr. J. Biotechnol. 2010, 9, 1871–1881. [Google Scholar]
  21. Houde, M.; Diallo, A.O. Identification of genes and pathways associated with aluminum stress and tolerance using transcriptome profiling of wheat near-isogenic lines. BMC Genom. 2008, 9. [Google Scholar] [CrossRef] [PubMed]
  22. Knecht, K.; Seyffarth, M.; Desel, C.; Thurau, T.; Sherameti, I.; Lou, B.; Oelmuller, R.; Cai, D. Expression of BvGLP-1 encoding a germin-like protein from sugar beet in Arabidopsis thaliana leads to resistance against phytopathogenic fungi. Mol. Plant Microbe Interact. 2010, 23, 446–457. [Google Scholar] [CrossRef] [PubMed]
  23. Godfrey, D.; Able, A.J.; Dry, I.B. Induction of a grapevine germin-like protein (VvGLP3) gene is closely linked to the site of Erysiphe necator infection: A possible role in defense? Mol. Plant-Microbe Interact. 2007, 20, 1112–1125. [Google Scholar] [CrossRef] [PubMed]
  24. Averyanov, A. Oxidative burst and plant disease resistance. Front. Biosci. 2008, 1, 142–152. [Google Scholar]
  25. Manosalva, P.M.; Davidson, R.M.; Liu, B.; Zhu, X.Y.; Hulbert, S.H.; Leung, H.; Leach, J.E. A germin-like protein gene family functions as a complex quantitative trait locus conferring broad-spectrum disease resistance in rice. Plant Physiol. 2009, 149, 286–296. [Google Scholar] [CrossRef] [PubMed]
  26. Himmelbach, A.; Liu, L.; Zierold, U.; Altschmied, L.; Maucher, H.; Beier, F.; Muller, D.; Hensel, G.; Heise, A.; Schutzendubel, A.; et al. Promoters of the barley germin-like GER4 gene cluster enable strong transgene expression in response to pathogen attack. Plant Cell 2010, 22, 937–952. [Google Scholar] [CrossRef] [PubMed]
  27. Zimmermann, G.; Baumlein, H.; Mock, H.P.; Himmelbach, A.; Schweizer, P. The multigene family encoding germin-like proteins of barley. Regulation and function in Basal host resistance. Plant Physiol. 2006, 142, 181–192. [Google Scholar] [CrossRef] [PubMed]
  28. Schweizer, P.; Christoffel, A.; Dudler, R. Transient expression of members of the germin-like gene family in epidermal cells of wheat confers disease resistance. Plant J. 1999, 20, 541–552. [Google Scholar] [CrossRef] [PubMed]
  29. Nakata, M.; Watanabe, Y.; Sakurai, Y.; Hashimoto, Y.; Matsuzaki, M.; Takahashi, Y.; Satoh, T. Germin-like protein gene family of a moss, Physcomitrella patens, phylogenetically falls into two characteristic new clades. Plant Mol. Biol. 2004, 56, 381–395. [Google Scholar] [CrossRef] [PubMed]
  30. Zhang, J. Evolution by gene duplication: An update. Trends Ecol. Evol. 2003, 18, 292–298. [Google Scholar] [CrossRef]
  31. Zhang, G.; Wang, F.; Li, J.; Ding, Q.; Zhang, Y.; Li, H.; Zhang, J.; Gao, J. Genome-wide identification and analysis of the VQ motif-containing protein family in Chinese cabbage (Brassica rapa L. ssp. Pekinensis). Int. J. Mol. Sci. 2015, 16, 28683–28704. [Google Scholar] [CrossRef] [PubMed]
  32. Wang, H.; Yin, X.; Li, X.; Wang, L.; Zheng, Y.; Xu, X.; Zhang, Y.; Wang, X. Genome-wide identification, evolution and expression analysis of the grape (Vitis vinifera L.) zinc finger-homeodomain gene family. Int. J. Mol. Sci. 2014, 15, 5730–5748. [Google Scholar] [CrossRef] [PubMed]
  33. Guo, Y.; Qiu, L.J. Genome-wide analysis of the Dof transcription factor gene family reveals soybean-specific duplicable and functional characteristics. PLoS ONE 2013, 8, e76809. [Google Scholar] [CrossRef] [PubMed]
  34. Hu, R.; Qi, G.; Kong, Y.; Kong, D.; Gao, Q.; Zhou, G. Comprehensive analysis of NAC domain transcription factor gene family in Populus trichocarpa. BMC Plant Biol. 2010, 10, 145. [Google Scholar] [CrossRef] [PubMed]
  35. Jain, M.; Nijhawan, A.; Arora, R.; Agarwal, P.; Ray, S.; Sharma, P.; Kapoor, S.; Tyagi, A.K.; Khurana, J.P. F-box proteins in rice. Genome-wide analysis, classification, temporal and spatial gene expression during panicle and seed development, and regulation by light and abiotic stress. Plant Physiol. 2007, 143, 1467–1483. [Google Scholar] [CrossRef] [PubMed]
  36. Dubey, S.; Misra, P.; Dwivedi, S.; Chatterjee, S.; Bag, S.K.; Mantri, S.; Asif, M.H.; Rai, A.; Kumar, S.; Shri, M.; et al. Transcriptomic and metabolomic shifts in rice roots in response to Cr (VI) stress. BMC Genom. 2010, 11, 648. [Google Scholar] [CrossRef] [PubMed]
  37. Hurkman, W.J.; Lane, B.G.; Tanaka, C.K. Nucleotide-sequence of a transcript encoding a germin-like protein that is present in salt-stressed barley (Hordeum-vulgare L.) roots. Plant Physiol. 1994, 104, 803–804. [Google Scholar] [CrossRef] [PubMed]
  38. Bae, M.S.; Cho, E.J.; Choi, E.Y.; Park, O.K. Analysis of the Arabidopsis nuclear proteome and its response to cold stress. Plant J. 2003, 36, 652–663. [Google Scholar] [CrossRef] [PubMed]
  39. Chen, C.; Song, Y.; Zhuang, K.; Li, L.; Xia, Y.; Shen, Z. Proteomic analysis of copper-binding proteins in excess copper-stressed roots of two rice (Oryza sativa L.) varieties with different cu tolerances. PLoS ONE 2015, 10, e0125367. [Google Scholar] [CrossRef] [PubMed]
  40. Breen, J.; Bellgard, M. Germin-like proteins (GLPs) in cereal genomes: Gene clustering and dynamic roles in plant defence. Funct. Integr. Genom. 2010, 10, 463–476. [Google Scholar] [CrossRef] [PubMed]
  41. Banerjee, J.; Das, N.; Dey, P.; Maiti, M.K. Transgenically expressed rice germin-like protein1 in tobacco causes hyper-accumulation of H2O2 and reinforcement of the cell wall components. Biochem. Biophys. Res. Commun. 2010, 402, 637–643. [Google Scholar] [CrossRef] [PubMed]
  42. Li, F.; Shi, J.; Shen, C.; Chen, G.; Hu, S.; Chen, Y. Proteomic characterization of copper stress response in Elsholtzia splendens roots and leaves. Plant Mol. Biol. 2009, 71, 251–263. [Google Scholar] [CrossRef] [PubMed]
  43. Rutter, M.T.; Cross, K.V.; van Woert, P.A. Birth, death and subfunctionalization in the Arabidopsis genome. Trends Plant Sci. 2010, 17, 204–212. [Google Scholar] [CrossRef] [PubMed]
  44. Hanada, K.; Zou, C.; Lehti-Shiu, M.D.; Shinozaki, K.; Shiu, S.H. Importance of lineage-specific expansion of plant tandem duplicates in the adaptive response to environmental stimuli. Plant Physiol. 2008, 148, 993–1003. [Google Scholar] [CrossRef] [PubMed]
  45. Beracochea, V.C.; Almasia, N.I.; Peluffo, L.; Nahirnak, V.; Hopp, E.H.; Paniego, N.; Heinz, R.A.; Vazquez-Rovere, C.; Lia, V.V. Sunflower germin-like protein HaGLP1 promotes ROS accumulation and enhances protection against fungal pathogens in transgenic Arabidopsis thaliana. Plant Cell Rep. 2015, 34, 1717–1733. [Google Scholar] [CrossRef] [PubMed]
  46. Swarbrick, P.J.; Huang, K.; Liu, G.; Slate, J.; Press, M.C.; Scholes, J.D. Global patterns of gene expression in rice cultivars undergoing a susceptible or resistant interaction with the parasitic plant Striga hermonthica. New Phytol. 2008, 179, 515–529. [Google Scholar] [CrossRef] [PubMed]
  47. Ribot, C.; Hirsch, J.; Balzergue, S.; Tharreau, D.; Notteghem, J.L.; Lebrun, M.H.; Morel, J.B. Susceptibility of rice to the blast fungus, Magnaporthe grisea. J. Plant Physiol. 2008, 165, 114–124. [Google Scholar] [CrossRef] [PubMed]
  48. Katagiri, F.; Thilmony, R.; He, S.Y. The Arabidopsis thaliana-pseudomonas syringae interaction. Arab. Book 2002, 1, e0039. [Google Scholar] [CrossRef] [PubMed]
  49. Fellbrich, G.; Romanski, A.; Varet, A.; Blume, B.; Brunner, F.; Engelhardt, S.; Felix, G.; Kemmerling, B.; Krzymowska, M.; Nürnberger, T. NPP1, a phytophthora-associated trigger of plant defense in parsley and Arabidopsis. Plant J. 2002, 32, 375–390. [Google Scholar] [CrossRef] [PubMed]
  50. Zeidler, D.; Zahringer, U.; Gerber, I.; Dubery, I.; Hartung, T.; Bors, W.; Hutzler, P.; Durner, J. Innate immunity in Arabidopsis thaliana: Lipopolysaccharides activate nitric oxide synthase (NOS) and induce defense genes. Proc. Natl. Acad. Sci. USA 2004, 101, 15811–15816. [Google Scholar] [CrossRef] [PubMed]
  51. Haapalainen, M.; Dauphin, A.; Li, C.M.; Bailly, G.; Tran, D.; Briand, J.; Bouteau, F.; Taira, S. HrpZ harpins from different Pseudomonas syringae pathovars differ in molecular interactions and in induction of anion channel responses in Arabidopsis thaliana suspension cells. Plant Physiol. Biochem. 2012, 51, 168–174. [Google Scholar] [CrossRef] [PubMed]
  52. Yasmin, T.; Mumtaz, A.; Mahmood, T.; Hyder, M.Z.; Naqvi, S.M.S. A germin-like protein gene of rice increased superoxide dismutase activity in transformed tobacco. Biol. Plant. 2015, 59, 456–462. [Google Scholar] [CrossRef]
  53. Wei, Y.; Zhang, Z.; Andersen, C.H.; Schmelzer, E.; Gregersen, P.L.; Collinge, D.B.; Smedegaard-Petersen, V.; Thordal-Christensen, H. An epidermis/papilla-specific oxalate oxidase-like protein in the defence response of barley attacked by the powdery mildew fungus. Plant Mol. Biol. 1998, 36, 101–112. [Google Scholar] [CrossRef] [PubMed]
  54. Sassaki, F.T.; Bravo, J.P.; Gonzalez, E.R.; Maia, I.G. Expression pattern and promoter analysis of a eucalyptus grandis germin-like gene. Plant Mol. Biol. Rep. 2015, 33, 12–21. [Google Scholar] [CrossRef]
  55. Donaldson, P.A.; Anderson, T.; Lane, B.G.; Davidson, A.L.; Simmonds, D.H. Soybean plants expressing an active oligomeric oxalate oxidase from the wheat gf-2.8 (germin) gene are resistant to the oxalate-secreting pathogen Sclerotina sclerotiorum. Physiol. Mol. Plant Pathol. 2001, 59, 297–307. [Google Scholar] [CrossRef]
  56. Lou, Y.; Baldwin, I.T. Silencing of a germin-like gene in Nicotiana attenuata improves performance of native herbivores. Plant Physiol. 2006, 140, 1126–1136. [Google Scholar] [CrossRef] [PubMed]
  57. Lin, Y.X.; Jiang, H.Y.; Chu, Z.X.; Tang, X.L.; Zhu, S.W.; Cheng, B.J. Genome-wide identification, classification and analysis of heat shock transcription factor family in maize. BMC Genom. 2011, 12. [Google Scholar] [CrossRef] [PubMed]
  58. Katoh, K.; Standley, D.M. MAFFT multiple sequence alignment software version 7: Improvements in performance and usability. Mol. Biol. Evol. 2013, 30, 772–780. [Google Scholar] [CrossRef] [PubMed]
  59. Ronquist, F.; Huelsenbeck, J.P. MrBayes 3: Bayesian phylogenetic inference under mixed models. Bioinformatics 2003, 19, 1572–1574. [Google Scholar] [CrossRef] [PubMed]
  60. Higo, K.; Ugawa, Y.; Iwamoto, M.; Korenaga, T. Plant cis-acting regulatory DNA elements (PLACE) database: 1999. Nucleic Acids Res. 1999, 27, 297–300. [Google Scholar] [CrossRef] [PubMed]
  61. Schmid, M.; Davison, T.S.; Henz, S.R.; Pape, U.J.; Demar, M.; Vingron, M.; Scholkopf, B.; Weigel, D.; Lohmann, J.U. A gene expression map of Arabidopsis thaliana development. Nat. Genet. 2005, 37, 501–506. [Google Scholar] [CrossRef] [PubMed]
  62. Eisen, M.B.; Spellman, P.T.; Brown, P.O.; Botstein, D. Cluster analysis and display of genome-wide expression patterns. Proc. Natl. Acad. Sci. USA 1998, 95, 14863–14868. [Google Scholar] [CrossRef] [PubMed]
  63. Barrett, T.; Wilhite, S.E.; Ledoux, P.; Evangelista, C.; Kim, I.F.; Tomashevsky, M.; Marshall, K.A.; Phillippy, K.H.; Sherman, P.M.; Holko, M.; et al. Ncbi geo: Archive for functional genomics data sets—Update. Nucleic Acids Res. 2011, 39, 1005–1010. [Google Scholar] [CrossRef] [PubMed]
  64. Yoshida, S.; Parao, F. Performance of improved rice varieties in the tropics with special reference to tillering capacity. Exp. Agric. 1972, 8, 203–212. [Google Scholar] [CrossRef]
  65. Wang, E.; Wang, K.; Chen, D.; Wang, J.; He, Y.; Long, B.; Yang, L.; Yang, Q.; Geng, Y.; Huang, X. Evaluation and selection of appropriate reference genes for real-time quantitative PCR analysis of gene expression in Nile tilapia (Oreochromis niloticus) during vaccination and infection. Int. J. Mol. Sci. 2015, 16, 9998–10015. [Google Scholar] [CrossRef] [PubMed]
  66. Jyothishwaran, G.; Kotresha, D.; Selvaraj, T.; Srideshikan, S.; Rajvanshi, P.; Jayabaskaran, C. A modified freeze–thaw method for efficient transformation of Agrobacterium tumefaciens. Curr. Sci. 2007, 93, 770–772. [Google Scholar]
  67. Beauchamp, C.; Fridovich, I. Superoxide dismutase: Improved assays and an assay applicable to acrylamide gels. Anal. Biochem. 1971, 44, 276–287. [Google Scholar] [CrossRef]
Figure 1. Chromosomal distribution of rice (A) and Arabidopsis (B) germin-like protein (GLP) genes. The chromosome numbers are shown at the top of the chromosomes and the centromeric regions are indicated by ellipses. Tandem duplicated genes are shown in boxes, and the segmentally duplicated genes are connected by dashed lines. The exact position of each GLP gene on rice and Arabidopsis chromosome pseudo-molecules is given in Table S1.
Ijms 17 01622 g001
Figure 2. Phylogenetic relationships (A) and exon/intron structure (B) of GLP genes of rice and Arabidopsis. Multiple sequence alignment of nucleotide sequences was performed using the MAFFT program and a phylogenetic tree was generated using Bayesian inference (BI). Posterior probabilities (scaled to 100) are showed on the branch. The gene structure schematic diagrams were drawn using the Gene Structure Display Server (GSDS); (http://gsds1.cbi.pku.edu.cn/). The exons, introns and upstream/downstream sequences are indicated by green rectangle, black lines and blue rectangle, respectively. The length of the rectangles and lines are scaled based on the length of the gene.
Ijms 17 01622 g002
Figure 3. Expression patterns of rice and Arabidopsis GLP genes in various tissues/organs and developmental stages. Hierarchical clustering analysis of 31 OsGLP genes (A) and 25 AtGLP genes (B) represented on an Affymetrix genome array is shown. Reproductive development comprising six stages of panicle (P1 (0–3 cm), P2 (3–5 cm), P3 (5–10 cm), P4 (10–15 cm), P5 (15–22 cm), and P6 (22–30 cm)) and five stages of seed tagged from day of pollination (S1 (0–2 DAP), S2 (3–4 DAP), S3 (5–10 DAP), S4 (11–20 DAP), and S5 (21–29 DAP)) development. For clustering we used average log signal values (log10 for Arabidopsis and log2 for rice) for three biological replicates of each sample after normalisation of raw data (Tables S2 and S3). The colour scale for log signal values is shown at the bottom.
Ijms 17 01622 g003
Figure 4. Differential expressions of rice GLP genes in response to various abiotic stresses. Hierarchical clustering of rice GLP genes showing significantly different expressions under at least one abiotic stress condition (A) or heavy metals (B) is shown. The log2 fold change of GLP gene expressions (Table S6) in treated samples compared with mock-treated control sample was used for clustering. The colour scale for log2 fold change values is shown at the bottom; (C,D) Real-time PCR analysis of random selected genes to validate their differential expression during various abiotic stress conditions. The mRNA levels for each gene in different tissue samples were calculated relative to its expression in control seedlings. The green colour represents downregulation, black signifies no change in expression, and red shows upregulation. The error bars represent standard deviation. DS, desiccation stress; SS, salt stress; CS, cold stress.
Ijms 17 01622 g004aIjms 17 01622 g004b
Figure 5. Microarray-based expression profile of Arabidopsis GLP genes under various abiotic stress conditions. Heat maps show the log10 fold changes of Arabidopsis GLP gene expressions in root tissues under different abiotic stress conditions such as salt, drought, osmotic, cold, heat, oxidative, genotoxic, wounding, and UV/B stress. Microarray data (Table S7) was obtained for different time points and stresses viz. 12 and 24 h for root tissues and analysed with respect to the control. Relative signal values are represented by the colour bar shown at the bottom of heat map; green colour represents downregulation, black signifies no change in expression, and red shows up-regulation.
Ijms 17 01622 g005
Figure 6. Differential expressions of rice GLP genes in response to various biotic stress conditions. Hierarchical clustering of GLP genes showing significant differential expressions in at least one condition is shown. The log2 fold change of GLP gene expressions (Table S8) in treated sample compared with a mock-treated control sample was used for clustering. The colour scale for log2 fold change values is shown at the bottom. The green colour represents downregulation, black signifies no change in expression, and red shows upregulation. Dpi, days of post-inoculation.
Ijms 17 01622 g006
Figure 7. Differential expressions of Arabidopsis GLP genes in response to various biotic stress conditions. Heat maps show the log10 fold changes of Arabidopsis GLP gene expressions in leaf tissues under different biotic stress conditions such as Pseudomonas, Phytophthora, and elicitors. Microarray data of Arabidopsis leaves (Table S9) was obtained for different pathogens or elicitors and analysed with respect to the control samples. The colour scale for log10 fold change values are represented by the colour bar shown at the bottom of the heat map; the green colour represents downregulation, black signifies no change in expression, and red shows upregulation.
Ijms 17 01622 g007
Figure 8. Promoter analysis of eight stress-induced GLP genes and two housekeeping genes (Actin and Gamma-tubulin2). Stress-related cis-elements of the −2 Kb 5′ upstream region of ten genes are shown. cis-Elements in the sense-strand are indicated above the line, and those in the complementary-strand are below the line.
Ijms 17 01622 g008
Figure 9. Subcellular localisation of OsGLPs::GFP in Nicotiana benthamiana via Agrobacterium tumefaciens transformation. Agrobacterium-infiltrated N. benthamiana leaves expressing the OsGLPs::GFP and 35S–GFP fusion proteins driven by the CaMV35S promoter. Green fluorescent protein (GFP) fluorescence and differential interference contrast images and visible/GFP merged images are shown from left to right. Scale bar = 25 μm.
Ijms 17 01622 g009
Figure 10. Biochemical characterization of the OsGLP::FLAG proteins production in Nicotiana benthamiana. Lane 1, OsGLP8-7::FLAG; Lane 2, OsGLP4-1::FLAG; Lane 3, OsGLP8-11::FLAG; Lane 4, negative control (proteins extracted from wild type N. benthamiana); M, molecular size marker. (A) Immunodetection of recombinant proteins using FLAG-specific antibody in total protein extracts. Samples were loaded without prior boiling; (B) Protein extracts separated as in (A) were loaded after boiling; (C) Protein extracts separated as in (A) were assayed for SOD activity.
Ijms 17 01622 g010

