
Comprehensive Analysis of miRNome Alterations in Response to Sorafenib Treatment in Colorectal Cancer Cells

 ,
,
Abstract
:
1. Introduction
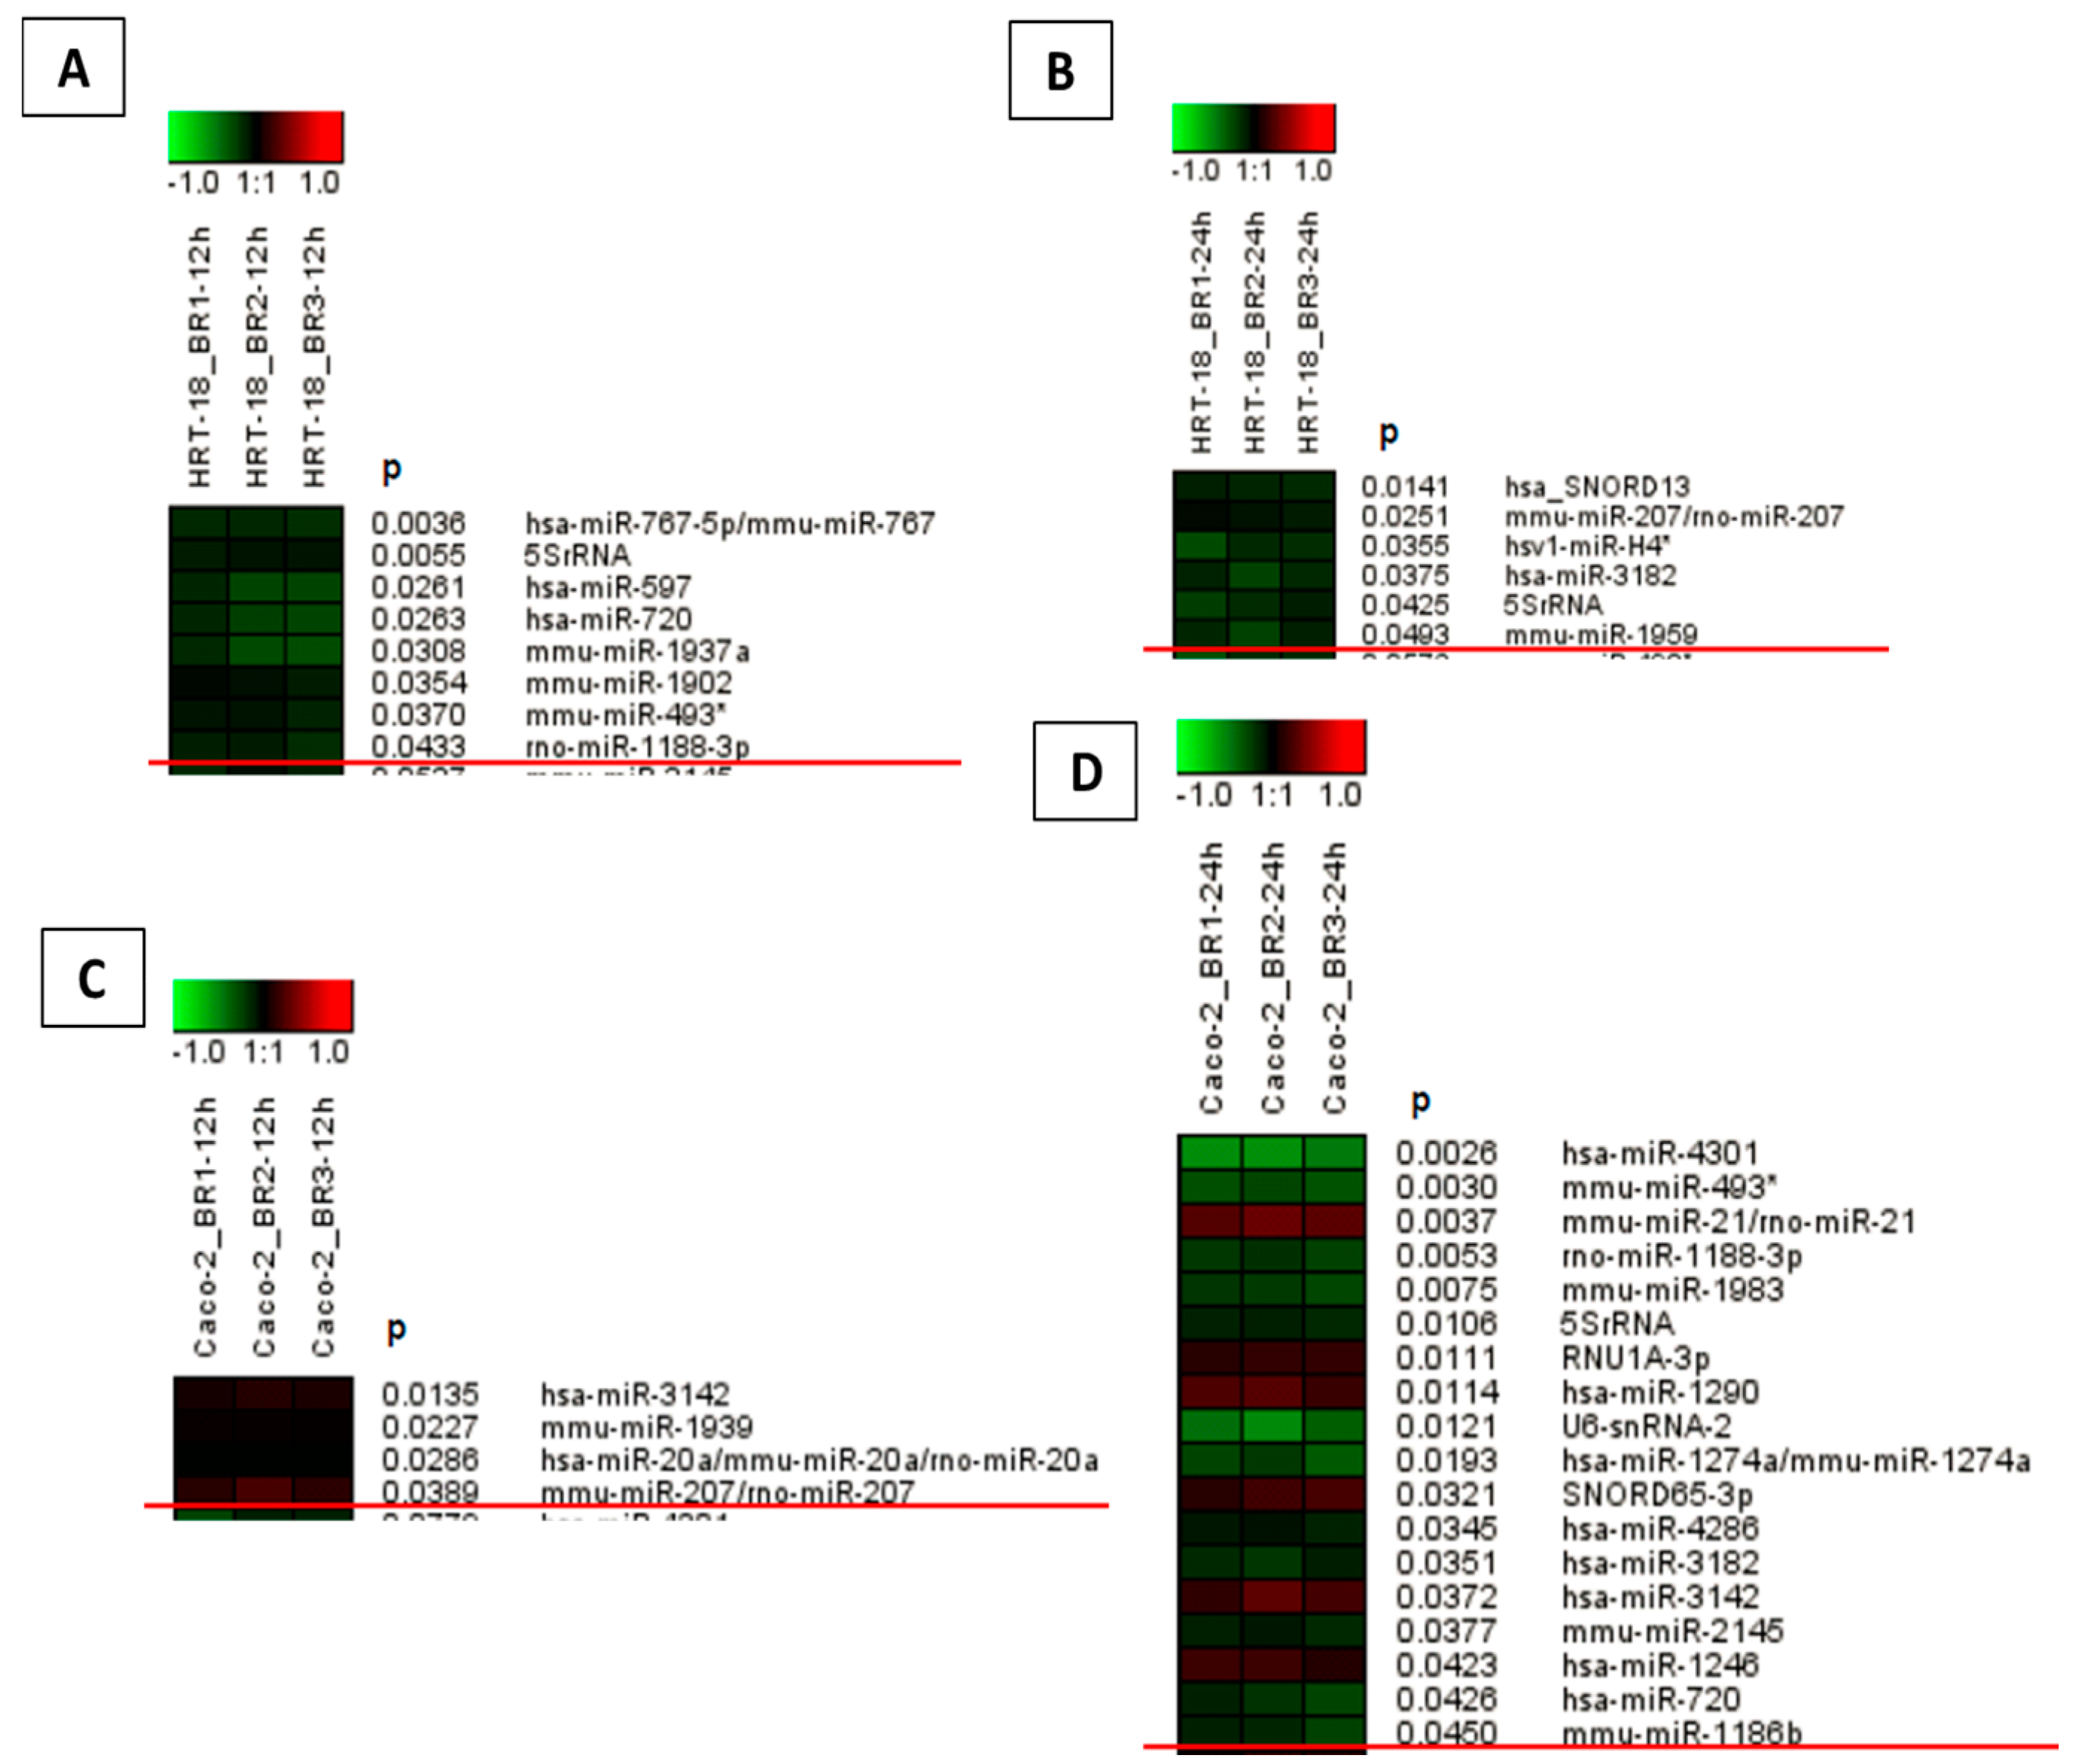
2. Results
3. Discussion
4. Material and Methods
4.1. Colorectal Cancer Cell Lines
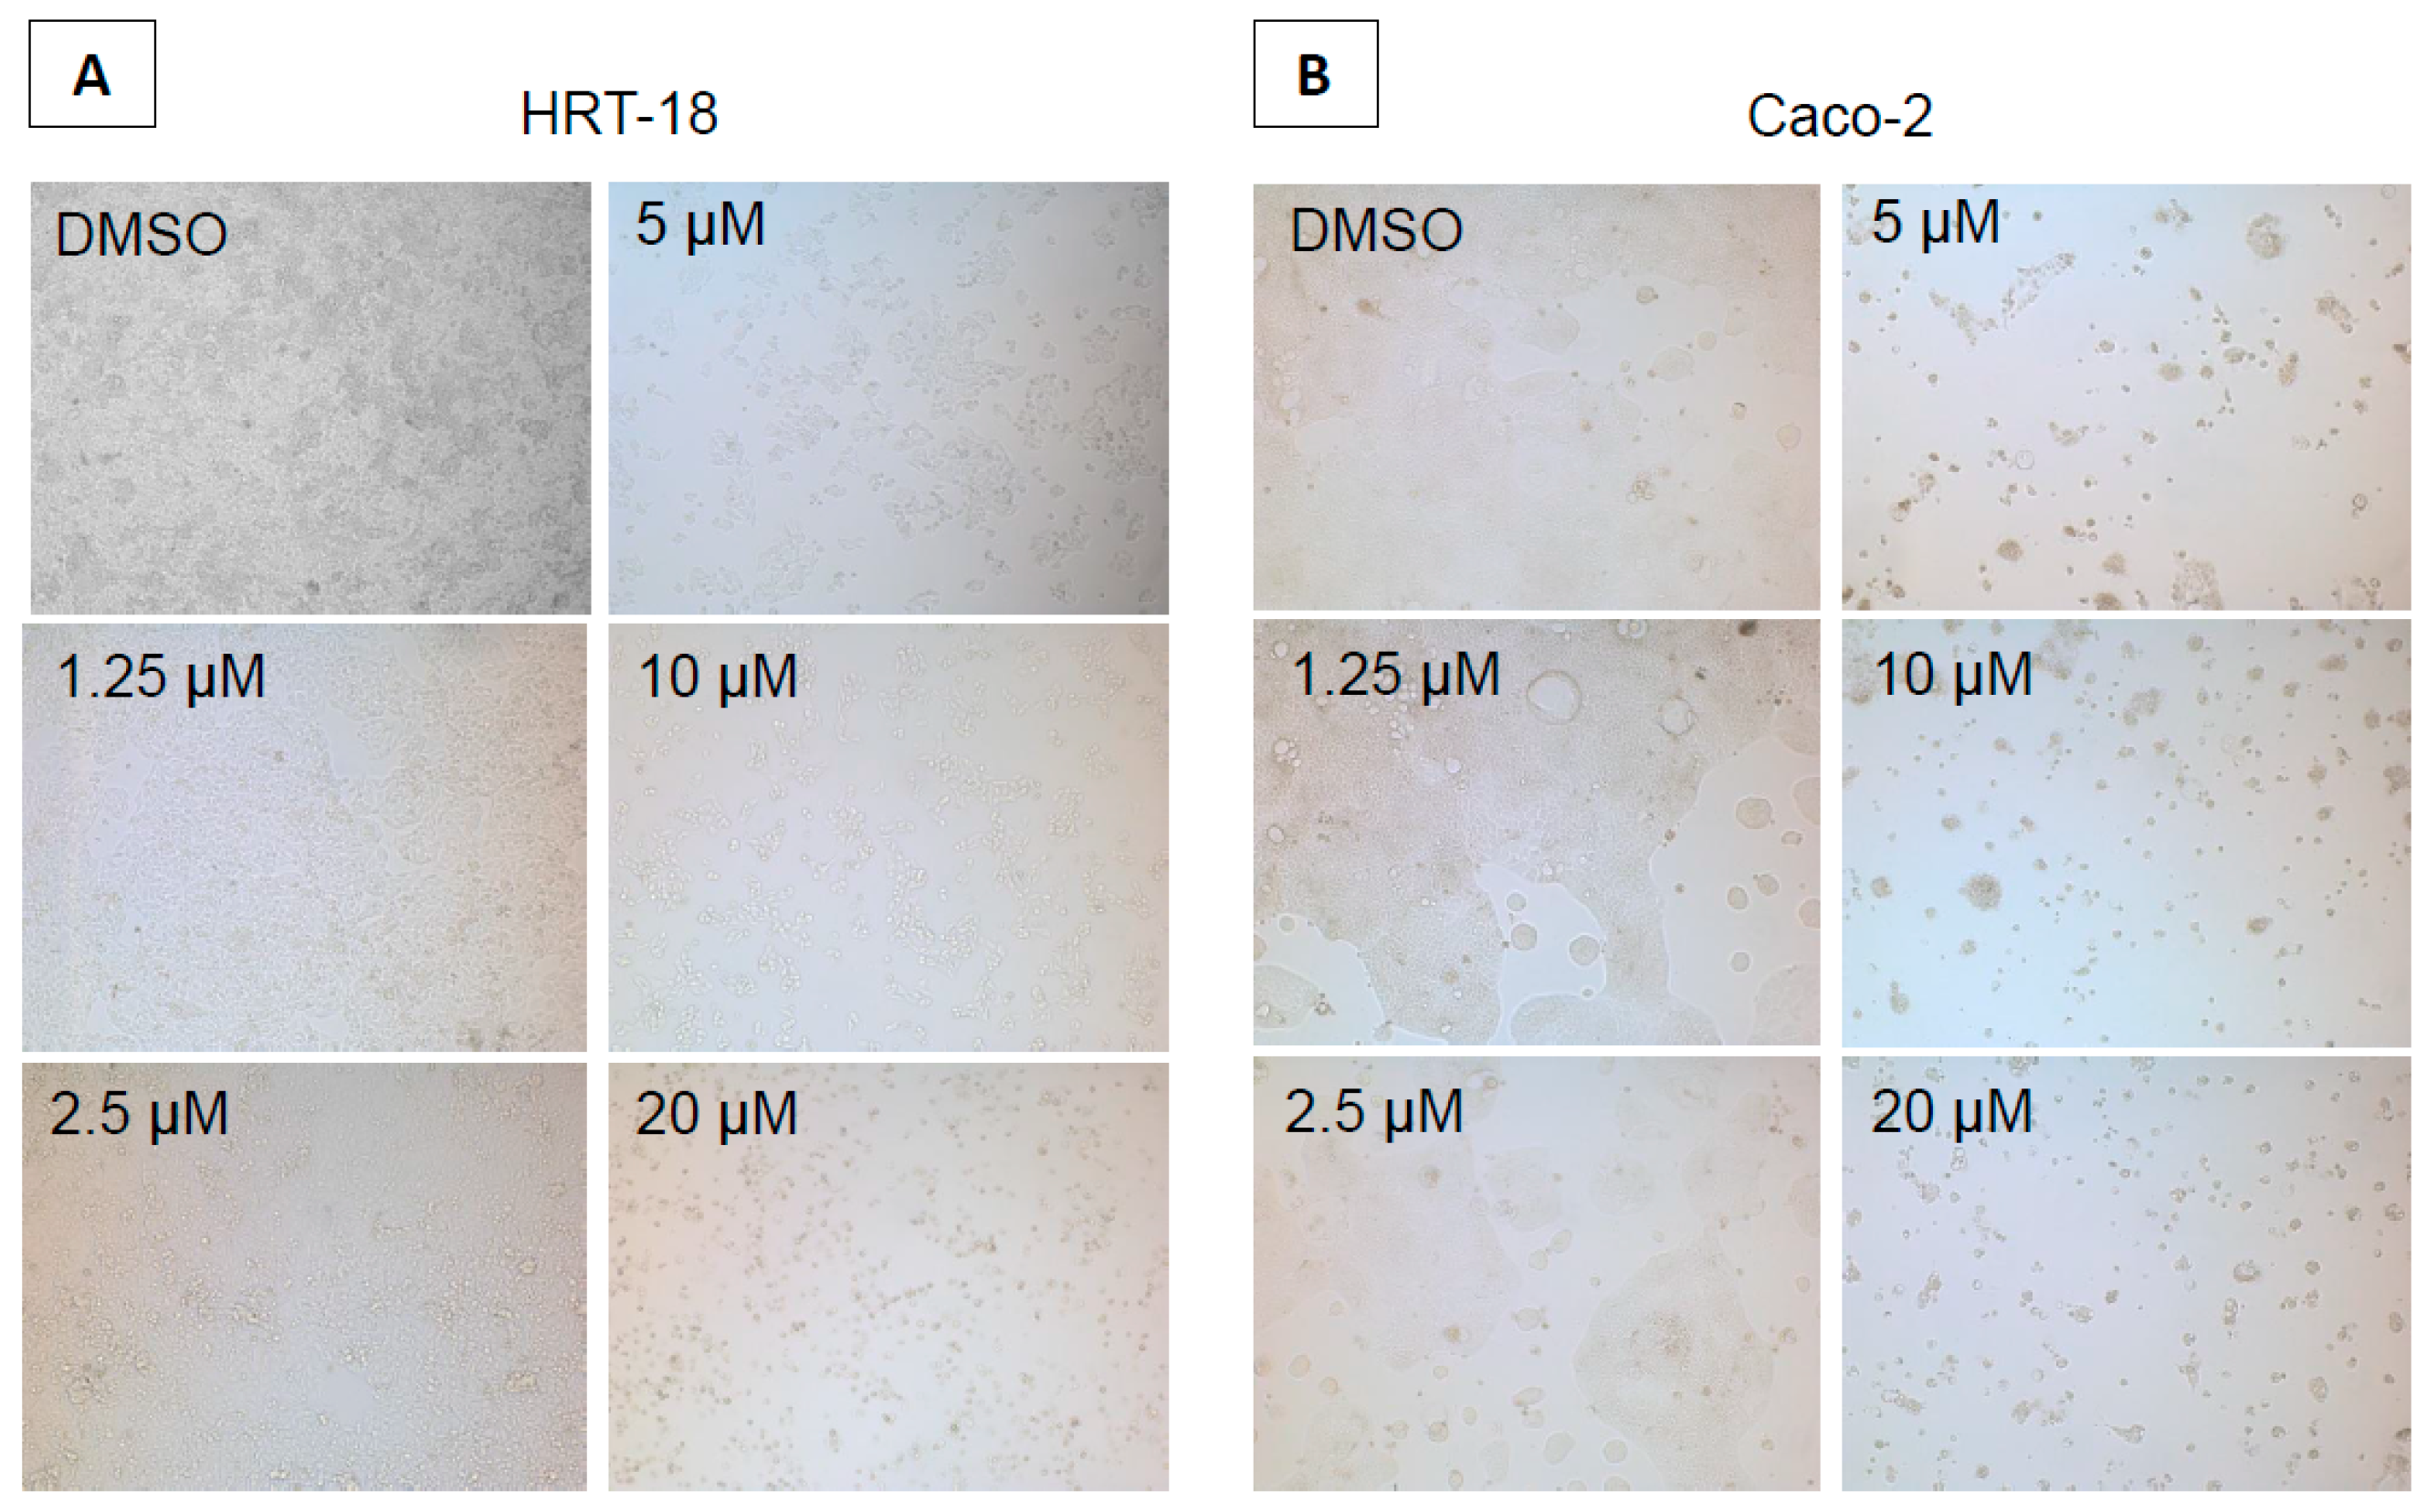
4.2. Cytotoxicity Assays
4.3. Cell Cycle and Apoptosis
4.4. MicroRNA Microarray Analysis
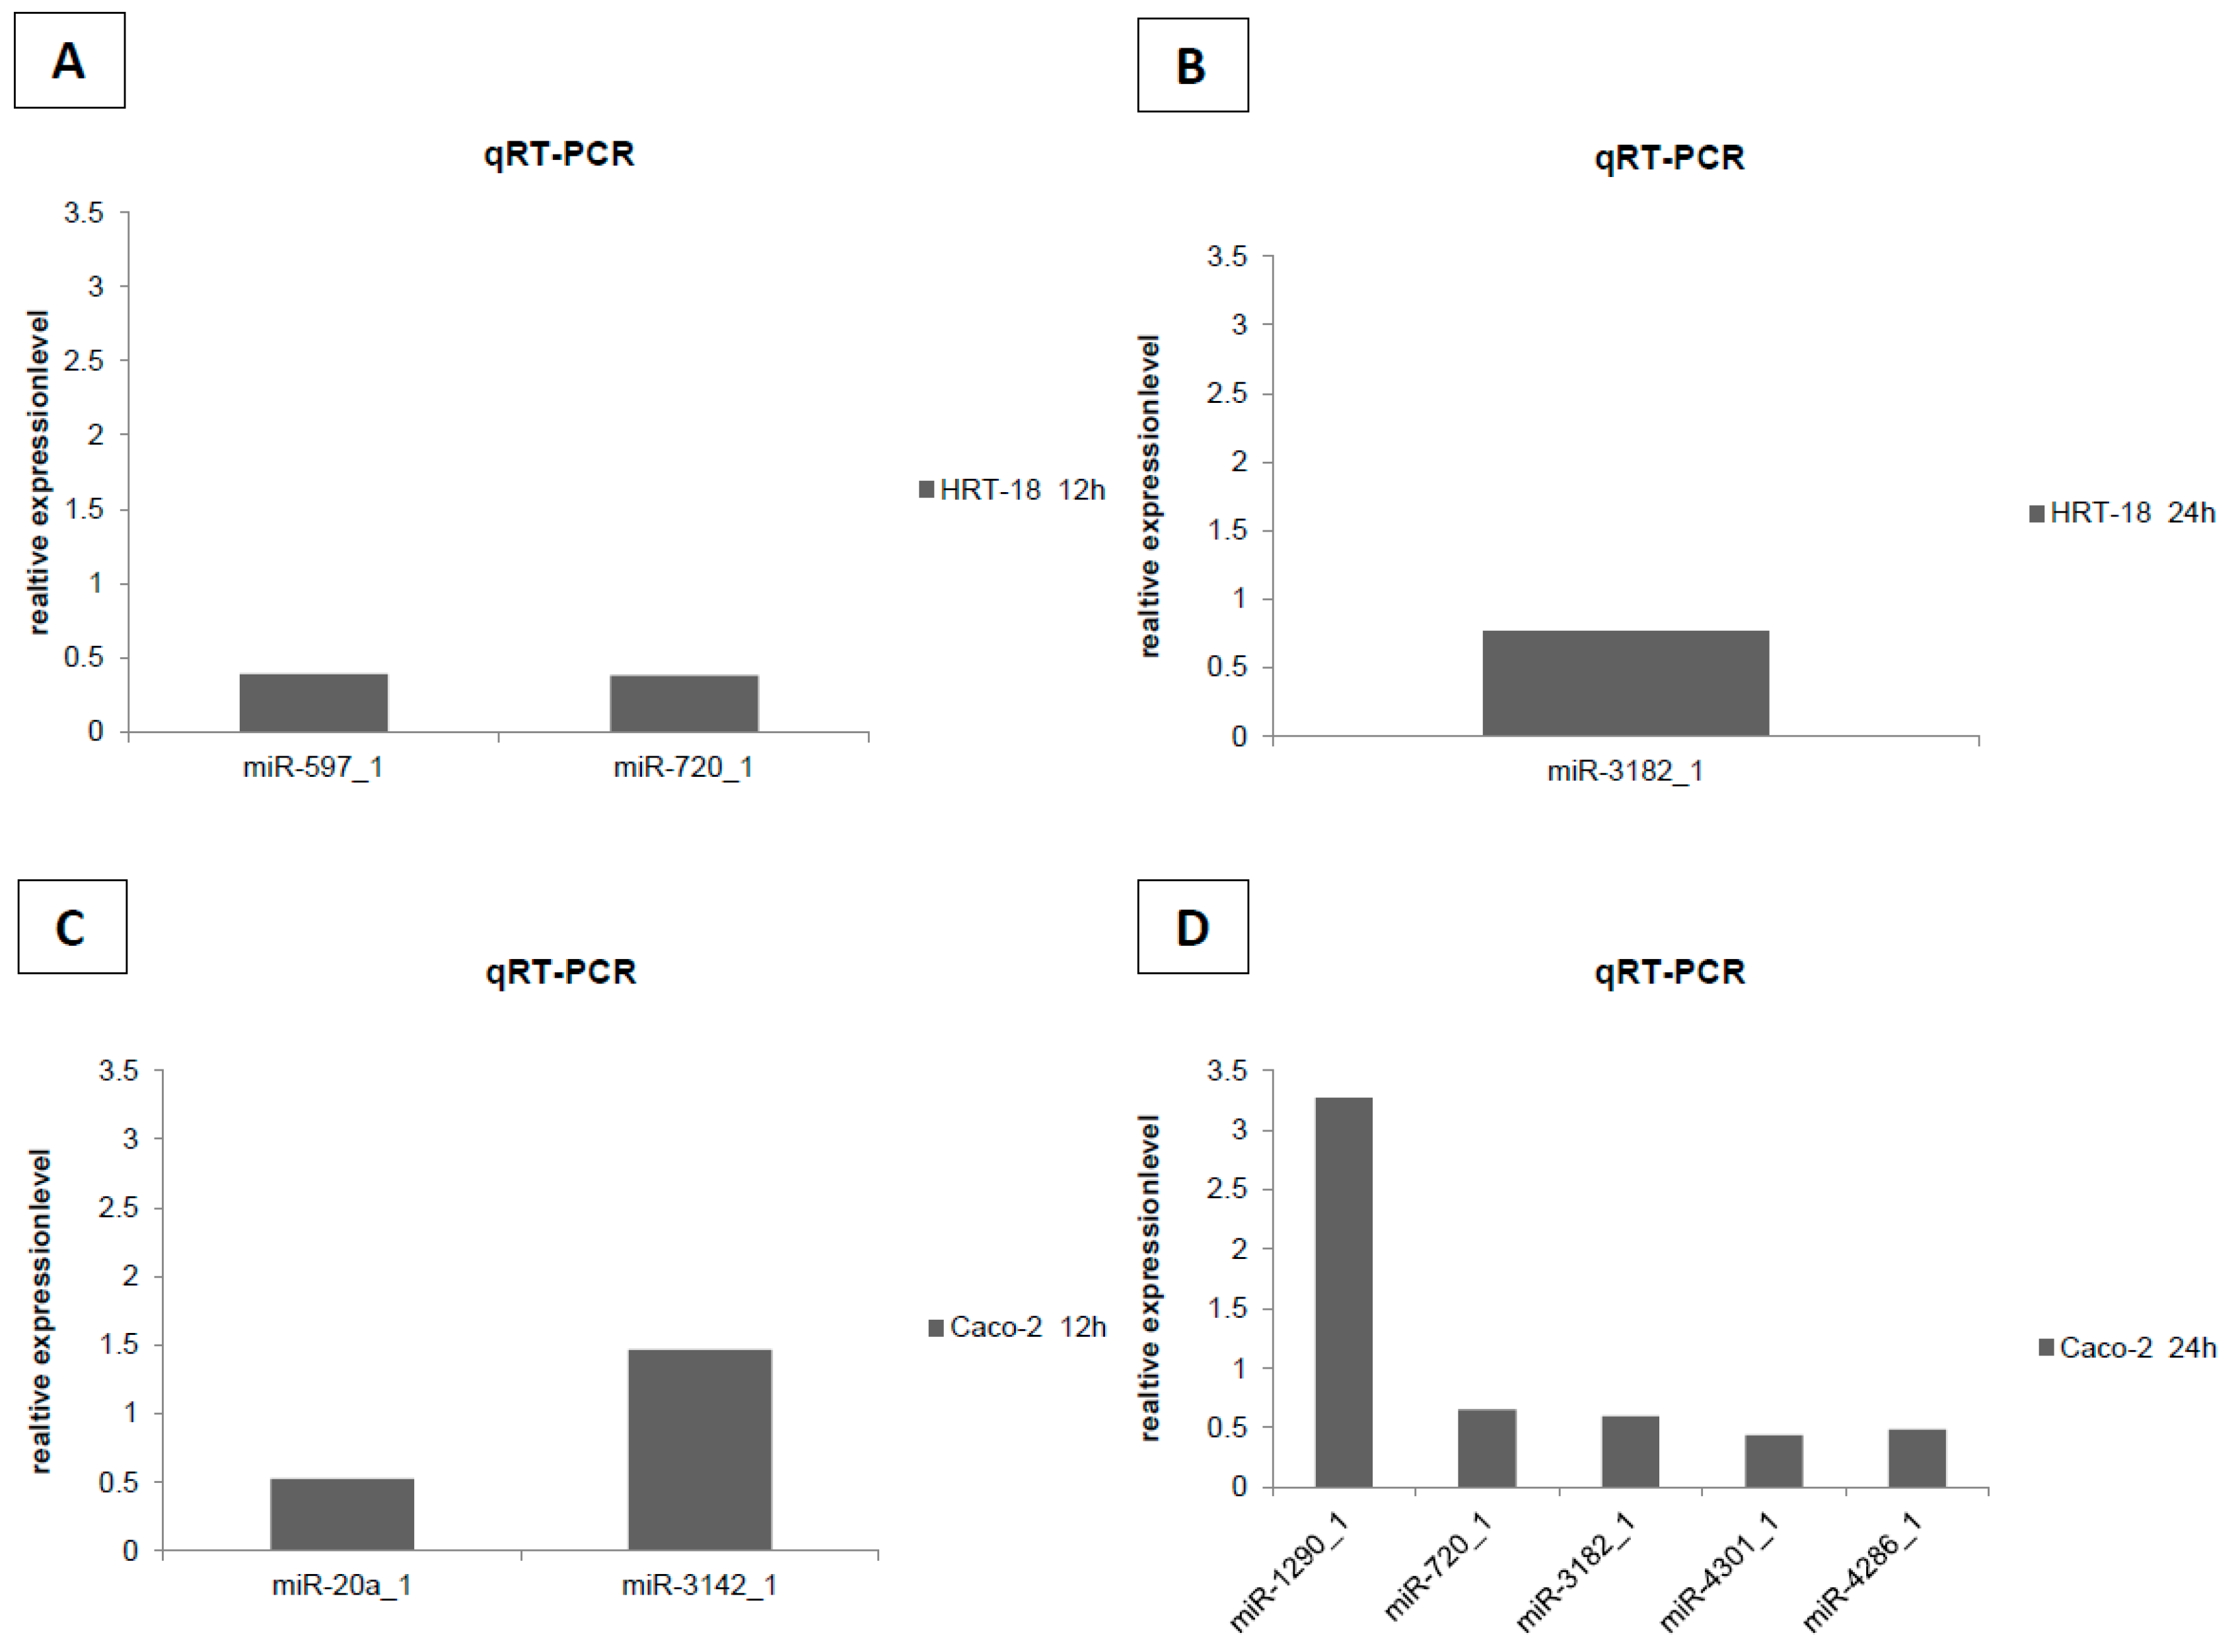
4.5. Validation of Microarray by RT-qPCR
Acknowledgments
Author Contributions
Conflicts of Interest
References
- Torre, L.A.; Bray, F.; Siegel, R.L.; Ferlay, J.; Lortet-Tieulent, J.; Jemal, A. Global cancer statistics. CA Cancer J. Clin. 2015, 65, 87–108. [Google Scholar] [CrossRef] [PubMed]
- Siegel, R.L.; Miller, K.D.; Jemal, A. Cancer statistics. CA Cancer J. Clin. 2016, 66, 7–30. [Google Scholar] [CrossRef] [PubMed]
- Vogelstein, B.; Kinzler, K.W. The multistep nature of cancer. Trends Genet. 1993, 9, 138–141. [Google Scholar] [CrossRef]
- Gout, S.; Huot, J. Role of cancer microenvironment in metastasis: Focus on colon cancer. Cancer Microenviron. 2008, 1, 69–83. [Google Scholar] [CrossRef] [PubMed]
- Calin, G.A.; Garzon, R.; Cimmino, A.; Fabbri, M.; Croce, C.M. MicroRNAs and leukemias: How strong is the connection? Leuk. Res. 2006, 30, 653–655. [Google Scholar] [CrossRef] [PubMed]
- Bartel, D.P. Micrornas: Genomics, biogenesis, mechanism, and function. Cell 2004, 116, 281–297. [Google Scholar] [CrossRef]
- Di Leva, G.; Garofalo, M.; Croce, C.M. MicroRNAs in cancer. Annu. Rev. Pathol. 2014, 9, 287–314. [Google Scholar] [CrossRef] [PubMed]
- Thomas, J.; Ohtsuka, M.; Pichler, M.; Ling, H. MicroRNAs: Clinical relevance in colorectal cancer. Int. J. Mol. Sci. 2015, 16, 28063–28076. [Google Scholar] [CrossRef] [PubMed] [Green Version]
- Okugawa, Y.; Toiyama, Y.; Goel, A. An update on microRNAs as colorectal cancer biomarkers: Where are we and what's next? Expert Rev. Mol. Diagn. 2014, 14, 999–1021. [Google Scholar] [CrossRef] [PubMed]
- Andre, T.; Boni, C.; Navarro, M.; Tabernero, J.; Hickish, T.; Topham, C.; Bonetti, A.; Clingan, P.; Bridgewater, J.; Rivera, F.; et al. Improved overall survival with oxaliplatin, fluorouracil, and leucovorin as adjuvant treatment in stage II or III colon cancer in the mosaic trial. J. Clin. Oncol. 2009, 27, 3109–3116. [Google Scholar] [CrossRef] [PubMed]
- Papadimitriou, C.A.; Papakostas, P.; Karina, M.; Malettou, L.; Dimopoulos, M.A.; Pentheroudakis, G.; Samantas, E.; Bamias, A.; Miliaras, D.; Basdanis, G.; et al. A randomized phase III trial of adjuvant chemotherapy with irinotecan, leucovorin and fluorouracil versus leucovorin and fluorouracil for stage II and III colon cancer: A hellenic cooperative oncology group study. BMC Med. 2011, 9, 10. [Google Scholar] [CrossRef] [PubMed]
- Smolle, M.A.; Pichler, M.; Haybaeck, J.; Gerger, A. Genetic markers of recurrence in colorectal cancer. Pharmacogenomics 2015, 16, 1315–1328. [Google Scholar] [CrossRef] [PubMed]
- Gauthier, A.; Ho, M. Role of sorafenib in the treatment of advanced hepatocellular carcinoma: An update. Hepatol. Res. 2013, 43, 147–154. [Google Scholar] [CrossRef] [PubMed]
- Brose, M.S.; Nutting, C.M.; Sherman, S.I.; Shong, Y.K.; Smit, J.W.; Reike, G.; Chung, J.; Kalmus, J.; Kappeler, C.; Schlumberger, M. Rationale and design of decision: A double-blind, randomized, placebo-controlled phase III trial evaluating the efficacy and safety of sorafenib in patients with locally advanced or metastatic radioactive iodine (RAI)-refractory, differentiated thyroid cancer. BMC Cancer 2011, 11, 349. [Google Scholar] [PubMed]
- Cheng, A.L.; Kang, Y.K.; Chen, Z.; Tsao, C.J.; Qin, S.; Kim, J.S.; Luo, R.; Feng, J.; Ye, S.; Yang, T.S.; et al. Efficacy and safety of sorafenib in patients in the asia-pacific region with advanced hepatocellular carcinoma: A phase III randomised, double-blind, placebo-controlled trial. Lancet Oncol. 2009, 10, 25–34. [Google Scholar] [CrossRef]
- Escudier, B.; Eisen, T.; Stadler, W.M.; Szczylik, C.; Oudard, S.; Staehler, M.; Negrier, S.; Chevreau, C.; Desai, A.A.; Rolland, F.; et al. Sorafenib for treatment of renal cell carcinoma: Final efficacy and safety results of the phase III treatment approaches in renal cancer global evaluation trial. J. Clin. Oncol. 2009, 27, 3312–3318. [Google Scholar] [CrossRef] [PubMed]
- Mross, K.; Steinbild, S.; Baas, F.; Gmehling, D.; Radtke, M.; Voliotis, D.; Brendel, E.; Christensen, O.; Unger, C. Results from an in vitro and a clinical/pharmacological phase I study with the combination irinotecan and sorafenib. Eur. J. Cancer 2007, 43, 55–63. [Google Scholar] [CrossRef] [PubMed]
- Kupsch, P.; Henning, B.F.; Passarge, K.; Richly, H.; Wiesemann, K.; Hilger, R.A.; Scheulen, M.E.; Christensen, O.; Brendel, E.; Schwartz, B.; et al. Results of a phase I trial of sorafenib (bay 43–9006) in combination with oxaliplatin in patients with refractory solid tumors, including colorectal cancer. Clin. Colorectal Cancer 2005, 5, 188–196. [Google Scholar] [CrossRef] [PubMed]
- Tabernero, J.; Garcia-Carbonero, R.; Cassidy, J.; Sobrero, A.; van Cutsem, E.; Kohne, C.H.; Tejpar, S.; Gladkov, O.; Davidenko, I.; Salazar, R.; et al. Sorafenib in combination with oxaliplatin, leucovorin, and fluorouracil (modified folfox6) as first-line treatment of metastatic colorectal cancer: The respect trial. Clin. Cancer Res. 2013, 19, 2541–2550. [Google Scholar] [CrossRef] [PubMed]
- Pennarun, B.; Kleibeuker, J.H.; Boersma-van Ek, W.; Kruyt, F.A.; Hollema, H.; de Vries, E.G.; de Jong, S. Targeting flip and MCL-1 using a combination of aspirin and sorafenib sensitizes colon cancer cells to trail. J. Pathol. 2013, 229, 410–421. [Google Scholar] [CrossRef] [PubMed]
- Samalin, E.; Bouche, O.; Thezenas, S.; Francois, E.; Adenis, A.; Bennouna, J.; Taieb, J.; Desseigne, F.; Seitz, J.F.; Conroy, T.; et al. Sorafenib and irinotecan (nexiri) as second- or later-line treatment for patients with metastatic colorectal cancer and KRAS-mutated tumours: A multicentre phase I/II trial. Br. J. Cancer 2014, 110, 1148–1154. [Google Scholar] [CrossRef] [PubMed]
- Adjei, A.A.; Richards, D.A.; El-Khoueiry, A.; Braiteh, F.; Becerra, C.H.; Stephenson, J.J., Jr.; Hezel, A.F.; Sherman, M.; Garbo, L.; Leffingwell, D.P.; et al. A phase I study of the safety, pharmacokinetics, and pharmacodynamics of combination therapy with refametinib plus sorafenib in patients with advanced cancer. Clin. Cancer Res. 2016, 22, 2368–2376. [Google Scholar] [CrossRef] [PubMed]
- Pichler, M.; Calin, G.A. MicroRNAs in cancer: From developmental genes in worms to their clinical application in patients. Br. J. Cancer 2015, 113, 569–573. [Google Scholar] [CrossRef] [PubMed]
- Gnoni, A.; Santini, D.; Scartozzi, M.; Russo, A.; Licchetta, A.; Palmieri, V.; Lupo, L.; Faloppi, L.; Palasciano, G.; Memeo, V.; et al. Hepatocellular carcinoma treatment over sorafenib: Epigenetics, microRNAs and microenvironment. Is there a light at the end of the tunnel? Expert Opin. Ther. Targets 2015, 19, 1623–1635. [Google Scholar] [CrossRef] [PubMed]
- Gulhati, P.; Zaytseva, Y.Y.; Valentino, J.D.; Stevens, P.D.; Kim, J.T.; Sasazuki, T.; Shirasawa, S.; Lee, E.Y.; Weiss, H.L.; Dong, J.; et al. Sorafenib enhances the therapeutic efficacy of rapamycin in colorectal cancers harboring oncogenic KRAS and PIK3CA. Carcinogenesis 2012, 33, 1782–1790. [Google Scholar] [CrossRef] [PubMed]
- Awada, A.; Hendlisz, A.; Gil, T.; Bartholomeus, S.; Mano, M.; de Valeriola, D.; Strumberg, D.; Brendel, E.; Haase, C.G.; Schwartz, B.; et al. Phase I safety and pharmacokinetics of bay 43–9006 administered for 21 days on/7 days off in patients with advanced, refractory solid tumours. Br. J. Cancer 2005, 92, 1855–1861. [Google Scholar] [CrossRef] [PubMed]
- Pichler, M.; Ress, A.L.; Winter, E.; Stiegelbauer, V.; Karbiener, M.; Schwarzenbacher, D.; Scheideler, M.; Ivan, C.; Jahn, S.W.; Kiesslich, T.; et al. miR-200a regulates epithelial to mesenchymal transition-related gene expression and determines prognosis in colorectal cancer patients. Br. J. Cancer 2014, 110, 1614–1621. [Google Scholar] [CrossRef] [PubMed]
- Broecker-Preuss, M.; Müller, S.; Britten, M.; Worm, K.; Schmid, K.W.; Mann, K.; Fuhrer, D. Sorafenib inhibits intracellular signaling pathways and induces cell cycle arrest and cell death in thyroid carcinoma cells irrespective of histological origin or BRAF mutational status. BMC Cancer 2015, 15, 184. [Google Scholar] [CrossRef] [PubMed]
- Yang, F.; van Meter, T.E.; Buettner, R.; Hedvat, M.; Liang, W.; Kowolik, C.M.; Mepani, N.; Mirosevich, J.; Nam, S.; Chen, M.Y.; et al. Sorafenib inhibits STAT3 signaling associated with growth arrest and apoptosis of medulloblastomas. Mol. Cancer Ther. 2008, 7, 3519–3526. [Google Scholar] [CrossRef] [PubMed]
- Bach, D.; Fuereder, J.; Karbiener, M.; Scheideler, M.; Ress, A.L.; Neureiter, D.; Kemmerling, R.; Dietze, O.; Wiederstein, M.; Berr, F.; et al. Comprehensive analysis of alterations in the mirnome in response to photodynamic treatment. J. Photochem. Photobiol. B 2013, 120, 74–81. [Google Scholar] [CrossRef] [PubMed]
- Wang, X.; Kuang, Y.; Shen, X.; Zhou, H.; Chen, Y.; Han, Y.; Yuan, B.; Zhou, J.; Zhao, H.; Zhi, Q.; et al. Evaluation of miR-720 prognostic significance in patients with colorectal cancer. Tumour Biol. 2015, 36, 719–727. [Google Scholar] [CrossRef] [PubMed]
- Nonaka, R.; Miyake, Y.; Hata, T.; Kagawa, Y.; Kato, T.; Osawa, H.; Nishimura, J.; Ikenaga, M.; Murata, K.; Uemura, M.; et al. Circulating miR-103 and miR-720 as novel serum biomarkers for patients with colorectal cancer. Int. J. Oncol. 2015, 47, 1097–1102. [Google Scholar] [CrossRef] [PubMed]
- Li, X.; Zhang, Z.; Yu, M.; Li, L.; Du, G.; Xiao, W.; Yang, H. Involvement of miR-20a in promoting gastric cancer progression by targeting early growth response 2 (EGR2). Int. J. Mol. Sci. 2013, 14, 16226–16239. [Google Scholar] [CrossRef] [PubMed]
- Pellatt, D.F.; Stevens, J.R.; Wolff, R.K.; Mullany, L.E.; Herrick, J.S.; Samowitz, W.; Slattery, M.L. Expression profiles of mirna subsets distinguish human colorectal carcinoma and normal colonic mucosa. Clin. Transl. Gastroenterol. 2016, 7, e152. [Google Scholar] [CrossRef] [PubMed]
- Xiong, Y.; Zhang, L.; Kebebew, E. miR-20a is upregulated in anaplastic thyroid cancer and targets LIMK1. PLoS ONE 2014, 23, e96103. [Google Scholar] [CrossRef] [PubMed]
- Zhou, J.; Liu, R.; Luo, C.; Zhou, X.; Xia, K.; Chen, X.; Zhou, M.; Zou, Q.; Cao, P.; Cao, K. miR-20a inhibits cutaneous squamous cell carcinoma metastasis and proliferation by directly targeting LIMK1. Cancer Biol. Ther. 2014, 15, 1340–1349. [Google Scholar] [CrossRef] [PubMed]
- Zhao, S.; Yao, D.; Chen, J.; Ding, N.; Ren, F. miR-20a promotes cervical cancer proliferation and metastasis in vitro and in vivo. PLoS ONE 2015, 10, e0120905. [Google Scholar] [CrossRef] [PubMed]
- Mo, D.; Gu, B.; Gong, X.; Wu, L.; Wang, H.; Jiang, Y.; Zhang, B.; Zhang, M.; Zhang, Y.; Xu, J.; et al. miR-1290 is a potential prognostic biomarker in non-small cell lung cancer. J. Thorac. Dis. 2015, 7, 1570–1579. [Google Scholar] [PubMed]
- Janiszewska, J.; Szaumkessel, M.; Kostrzewska-Poczekaj, M.; Bednarek, K.; Paczkowska, J.; Jackowska, J.; Grenman, R.; Szyfter, K.; Wierzbicka, M.; Giefing, M.; et al. Global miRNA expression profiling identifies miR-1290 as novel potential oncomiR in laryngeal carcinoma. PLoS ONE 2015, 10, e0144924. [Google Scholar] [CrossRef] [PubMed]
- Nagamitsu, Y.; Nishi, H.; Sasaki, T.; Takaesu, Y.; Terauchi, F.; Isaka, K. Profiling analysis of circulating microRNA expression in cervical cancer. Mol. Clin. Oncol. 2016, 5, 189–194. [Google Scholar] [CrossRef] [PubMed]
- Chen, W.C.; Lin, M.S.; Ye, Y.L.; Gao, H.J. MicroRNA expression pattern and its alteration following celecoxib intervention in human colorectal cancer. Exp. Ther. Med. 2012, 3, 1039–1048. [Google Scholar] [CrossRef] [PubMed]
- Pichler, M.; Stiegelbauer, V.; Vychytilova-Faltejskova, P.; Ivan, C.; Ling, H.; Winter, E.; Zhang, X.; Goblirsch, M.; Wulf-Goldenberg, A.; Ohtsuka, M.; et al. Genome-wide microRNA analysis identifies miR-188–3p as novel prognostic marker and molecular factor involved in colorectal carcinogenesis. Clin. Cancer Res. 2016, in press. [Google Scholar] [CrossRef] [PubMed]
- Mosakhani, N.; Lahti, L.; Borze, I.; Karjalainen-Lindsberg, M.L.; Sundstrom, J.; Ristamaki, R.; Osterlund, P.; Knuutila, S.; Sarhadi, V.K. MicroRNA profiling predicts survival in anti-EGFR treated chemorefractory metastatic colorectal cancer patients with wild-type KRAS and BRAF. Cancer Genet. 2012, 205, 545–551. [Google Scholar] [CrossRef] [PubMed]
- Sun, D.; Yu, F.; Ma, Y.; Zhao, R.; Chen, X.; Zhu, J.; Zhang, C.Y.; Chen, J.; Zhang, J. MicroRNA-31 activates the ras pathway and functions as an oncogenic microRNA in human colorectal cancer by repressing RAS p21 GTpase activating protein 1 (RASA1). J. Biol. Chem. 2013, 288, 9508–9518. [Google Scholar] [CrossRef] [PubMed]
- Igarashi, H.; Kurihara, H.; Mitsuhashi, K.; Ito, M.; Okuda, H.; Kanno, S.; Naito, T.; Yoshii, S.; Takahashi, H.; Kusumi, T.; et al. Association of microRNA-31–5p with clinical efficacy of anti-EGFR therapy in patients with metastatic colorectal cancer. Ann. Surg. Oncol. 2015, 22, 2640–2648. [Google Scholar] [CrossRef] [PubMed]
- Manceau, G.; Imbeaud, S.; Thiebaut, R.; Liebaert, F.; Fontaine, K.; Rousseau, F.; Genin, B.; Le Corre, D.; Didelot, A.; Vincent, M.; et al. Hsa-miR-31–3p expression is linked to progression-free survival in patients with KRAS wild-type metastatic colorectal cancer treated with anti-EGFR therapy. Clin. Cancer Res. 2014, 20, 3338–3347. [Google Scholar] [CrossRef] [PubMed]
- Mlcochova, J.; Faltejskova-Vychytilova, P.; Ferracin, M.; Zagatti, B.; Radova, L.; Svoboda, M.; Nemecek, R.; John, S.; Kiss, I.; Vyzula, R.; et al. MicroRNA expression profiling identifies miR-31–5p/3p as associated with time to progression in wild-type RAS metastatic colorectal cancer treated with cetuximab. Oncotarget 2015, 6, 38695–38704. [Google Scholar] [PubMed]
- Kiss, I.; Mlcochova, J.; Bortlicek, Z.; Poprach, A.; Drabek, J.; Vychytilova-Faltejskova, P.; Svoboda, M.; Buchler, T.; Batko, S.; Ryska, A.; et al. Efficacy and toxicity of panitumumab after progression on cetuximab and predictive value of miR-31–5p in metastatic wild-type KRAS colorectal cancer patients. Anticancer Res. 2016, 36, 4955–4959. [Google Scholar] [CrossRef] [PubMed]
- Liu, L.; Cao, Y.; Chen, C.; Zhang, X.; McNabola, A.; Wilkie, D.; Wilhelm, S.; Lynch, M.; Carter, C. Sorafenib blocks the raf/mek/erk pathway, inhibits tumor angiogenesis, and induces tumor cell apoptosis in hepatocellular carcinoma model plc/prf/5. Cancer Res. 2006, 66, 11851–11858. [Google Scholar] [CrossRef] [PubMed]
- Ress, A.L.; Stiegelbauer, V.; Schwarzenbacher, D.; Deutsch, A.; Perakis, S.; Ling, H.; Ivan, C.; Calin, G.A.; Rinner, B.; Gerger, A.; et al. Spinophilin expression determines cellular growth, cancer stemness and 5-flourouracil resistance in colorectal cancer. Oncotarget 2014, 5, 8492–8502. [Google Scholar] [CrossRef] [PubMed]
- Karbiener, M.; Scheideler, M. Microarray analysis of small non-coding RNAs. Methods Mol. Biol. 2015, 1296, 161–171. [Google Scholar] [PubMed]
- Pieler, R.; Sanchez-Cabo, F.; Hackl, H.; Thallinger, G.G.; Trajanoski, Z. Arraynorm: Comprehensive normalization and analysis of microarray data. Bioinformatics 2004, 20, 1971–1973. [Google Scholar] [CrossRef] [PubMed]
- Sturn, A.; Quackenbush, J.; Trajanoski, Z. Genesis: Cluster analysis of microarray data. Bioinformatics 2002, 18, 207–208. [Google Scholar] [CrossRef] [PubMed]


© 2016 by the authors; licensee MDPI, Basel, Switzerland. This article is an open access article distributed under the terms and conditions of the Creative Commons Attribution (CC-BY) license (http://creativecommons.org/licenses/by/4.0/).
Share and Cite
Pehserl, A.-M.; Ress, A.L.; Stanzer, S.; Resel, M.; Karbiener, M.; Stadelmeyer, E.; Stiegelbauer, V.; Gerger, A.; Mayr, C.; Scheideler, M.; et al. Comprehensive Analysis of miRNome Alterations in Response to Sorafenib Treatment in Colorectal Cancer Cells. Int. J. Mol. Sci. 2016, 17, 2011. https://doi.org/10.3390/ijms17122011
Pehserl A-M, Ress AL, Stanzer S, Resel M, Karbiener M, Stadelmeyer E, Stiegelbauer V, Gerger A, Mayr C, Scheideler M, et al. Comprehensive Analysis of miRNome Alterations in Response to Sorafenib Treatment in Colorectal Cancer Cells. International Journal of Molecular Sciences. 2016; 17(12):2011. https://doi.org/10.3390/ijms17122011
Chicago/Turabian StylePehserl, Anna-Maria, Anna Lena Ress, Stefanie Stanzer, Margit Resel, Michael Karbiener, Elke Stadelmeyer, Verena Stiegelbauer, Armin Gerger, Christian Mayr, Marcel Scheideler, and et al. 2016. "Comprehensive Analysis of miRNome Alterations in Response to Sorafenib Treatment in Colorectal Cancer Cells" International Journal of Molecular Sciences 17, no. 12: 2011. https://doi.org/10.3390/ijms17122011