Article

Testosterone Deficiency Induces Changes of the Transcriptomes of Visceral Adipose Tissue in Miniature Pigs Fed a High-Fat and High-Cholesterol Diet

1
College of Animal Science and Technology, Nanjing Agricultural University, Nanjing 210095, China
2
Laboratory Animal Research Center, Zhejiang Chinese Medical University, Hangzhou 310053, China
*
Authors to whom correspondence should be addressed.
Int. J. Mol. Sci. 2016, 17(12), 2125; https://doi.org/10.3390/ijms17122125
Submission received: 12 October 2016 / Revised: 8 December 2016 / Accepted: 12 December 2016 / Published: 16 December 2016
(This article belongs to the Section Biochemistry)

Abstract

:
Testosterone deficiency causes fat deposition, particularly in visceral fat, and its replacement might reverse fat accumulation, however, the underlying mechanisms of such processes under diet-induced adiposity are largely unknown. To gain insights into the genome-wide role of androgen on visceral adipose tissue (VAT), RNA-Seq was used to investigate testosterone deficiency induced changes of VAT in miniature pigs fed a high-fat and high-cholesterol (HFC) diet among intact male pigs (IM), castrated male pigs (CM), and castrated male pigs with testosterone replacement (CMT) treatments. The results showed that testosterone deficiency significantly increased VAT deposition and serum leptin concentrations. Moreover, a total of 1732 differentially expressed genes (DEGs) were identified between any two groups. Compared with gene expression profiles in IM and CMT pigs, upregulated genes in CM pigs, i.e., LOC100520753 (CD68), LCN2, EMR1, S100A9, NCF1 (p47phox), and LEP, were mainly involved in inflammatory response, oxidation-reduction process, and lipid metabolic process, while downregulated genes in CM pigs, i.e., ABHD5, SPP1, and GAS6, were focused on cell differentiation and cell adhesion. Taken together, our study demonstrates that testosterone deficiency alters the expression of numerous genes involved in key biological processes of VAT accumulation under HFC diet and provides a novel genome-wide view on the role of androgen on VAT deposition under HFC diet, thus improving our understanding of the molecular mechanisms involved in VAT changes induced by testosterone deficiency.

1. Introduction

Visceral adiposity represents excess visceral fat tissue (VAT) deposition in body, which is associated with several critical human diseases such as type 2 diabetes, metabolic syndrome and cardiovascular disease, suggesting visceral adiposity is a high disease risk factor in the life. As we know, excessive nutrients intake from the daily diet, such as high-fat and high-cholesterol (HFC) diet, significantly increases VAT accumulation [1,2]. On the other hand, sex hormone levels might also contribute to VAT deposition. For example, low testosterone levels result in excess VAT accumulation or waist circumference in men, thus increasing visceral adiposity [3,4,5], indicating that diet and sex hormone could play important roles on visceral adiposity. In some cases, more severe testosterone deficiency and wider waist circumference were observed in obese or diabetic individuals with aging or hypogonadal state [3], illustrating that testosterone deficiency in obese or diabetic individuals might further aggravate the extent of visceral adiposity.
Conversely, to avoid visceral adiposity induced by testosterone deficiency, a feasible strategy is testosterone replacement, which resulted in a significant decrease in body mass index, fat mass, and regional fat distribution in hypogonadal and aging men [6,7]. Furthermore, testosterone treatment reduced waist circumference, waist/hip ratio, visceral fat mass and metabolic syndrome mainly caused by visceral adiposity in obese hypogonadal men [8,9], strongly suggesting that testosterone replacement might be used for visceral adiposity treatment in men caused by testosterone deficiency. Most recently, a review pointed out that appropriate testosterone therapy in obese men with testosterone deficiency is a novel medical approach to treat obesity [10]. In other animal models, testosterone replacement decreased visceral fat weight and size in rabbits with high-fat (HFD) diet [11] and visceral fat size in hypogonadal and aged male rats [12]. Therefore, these data clearly show that testosterone replacement might be considered as a safe and effective therapy for obesity in men or animals with testosterone deficiency [13].
In general, pig model has been widely used for studying the changes induced by testosterone deficiency because it was shown to have similar characteristics concerning obesity and metabolic syndrome to human [14,15,16]. Therefore, by using pig model, our previous study discovered that castration-induced testosterone deficiency resulted in significant changes of miRNAs in subcutaneous adipose tissue, which were associated with fatty acid metabolism by acting on their target genes [17]. Moreover, we also found that testosterone deficiency caused severe hypercholesterolemia and hepatic steatosis in pigs fed a HFC diet and could be reversed by testosterone replacement therapy [18,19]. However, thus far, little is known about the underlying mechanisms of changes in VAT induced by testosterone deficiency under HFC diet, particularly in alterations of gene expression and regulation in VAT caused by testosterone changes. To shed light on this issue, we studied the characteristics of gene expression in VAT under the changes of testosterone on pigs fed a HFC diet by RNA-Seq technology, thus providing novel genome-wide insights in mechanisms involved in androgen roles on VAT metabolism.

2. Results

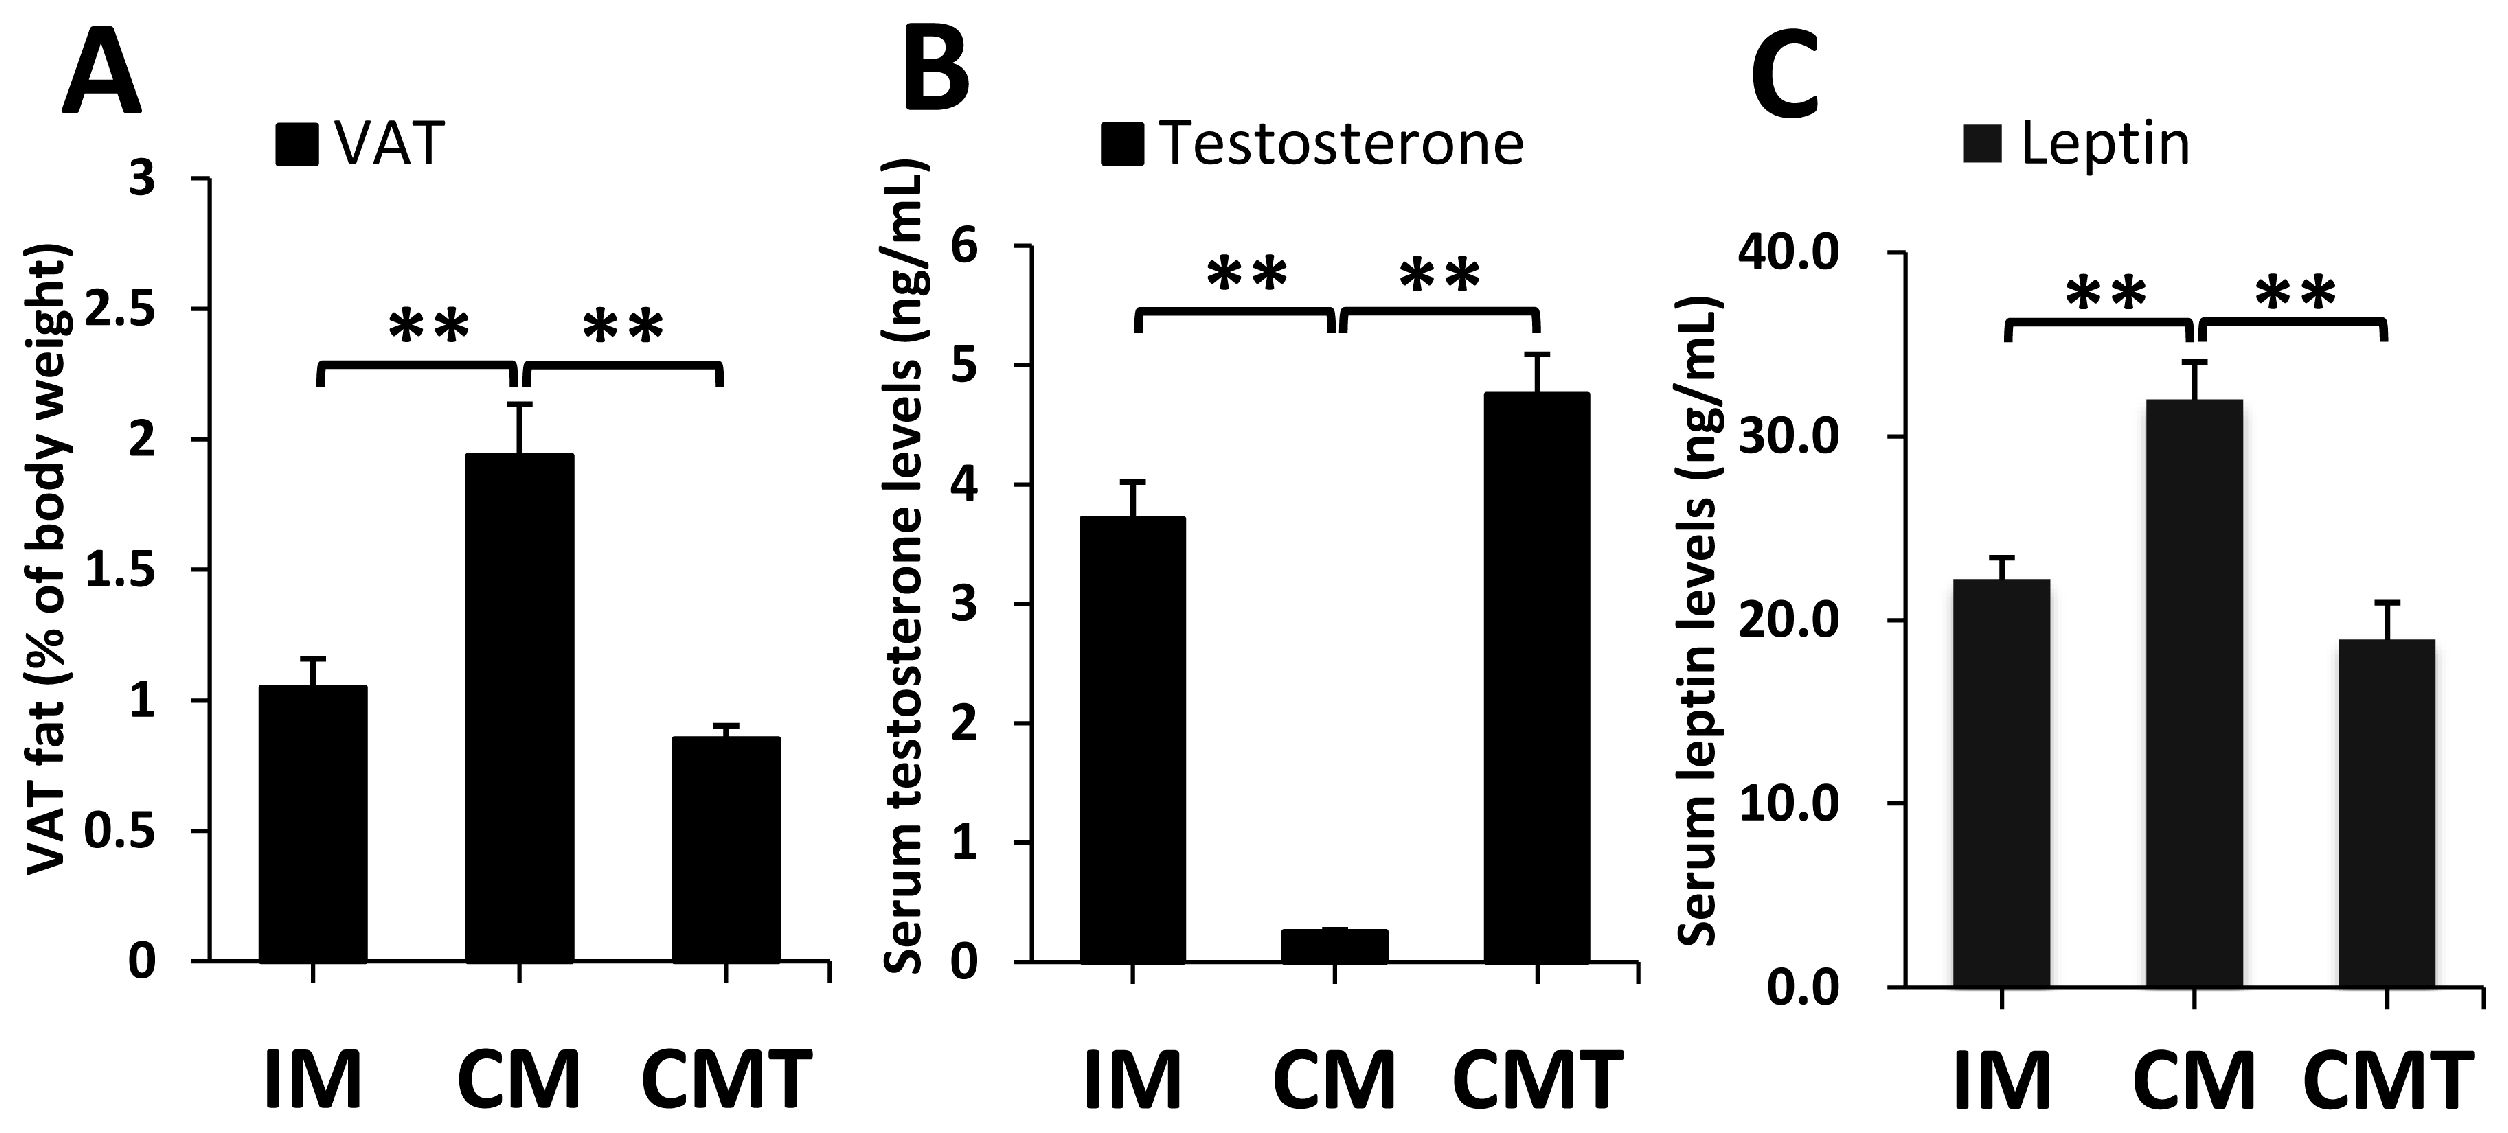
2.1. Effects of Castration and Testosterone Treatment on VAT Fat and Serum Leptin Levels

Castration significantly enhanced VAT fat, while testosterone treatment significantly decreased VAT fat, with no significant difference between IM and CMT pig groups (Figure 1A). By contrast, testosterone levels significantly decreased in CM pigs but increased in CMT pigs (Figure 1B). Consistent with the changes of VAT fat, serum leptin levels significantly increased in CM pigs but decreased in CMT pigs (Figure 1C).

2.2. Characteristics of RNA-Seq

A total of approximately 26.81, 24.65, and 23.87 million high quality clean reads were obtained from IM, CM, and CMT pigs, respectively. More than 81% of reads could be mapped to the pig reference genome 10.2. Furthermore, more than 77% of these mapped reads aligned with unique genes (Table 1). Finally, 16,836 mRNAs were found to be expressed in at least one of IM, CM, and CMT pig groups (Table S1).

2.3. Gene Expression Analysis

From 16,836 expressed mRNAs, 15,806, 15,811 and 15,785 expressed genes were detected in VAT of IM, CM, and CMT pig group, respectively. Among these genes, 14,814 genes were expressed in all three groups; 314, 280, and 344 genes were expressed in each pair of groups (CM versus IM, CMT versus CM, and CMT versus IM, respectively), while 334, 403, and 347 genes were exclusively found in IM, CM, and CMT pigs, respectively (Figure 2A and Table S1).

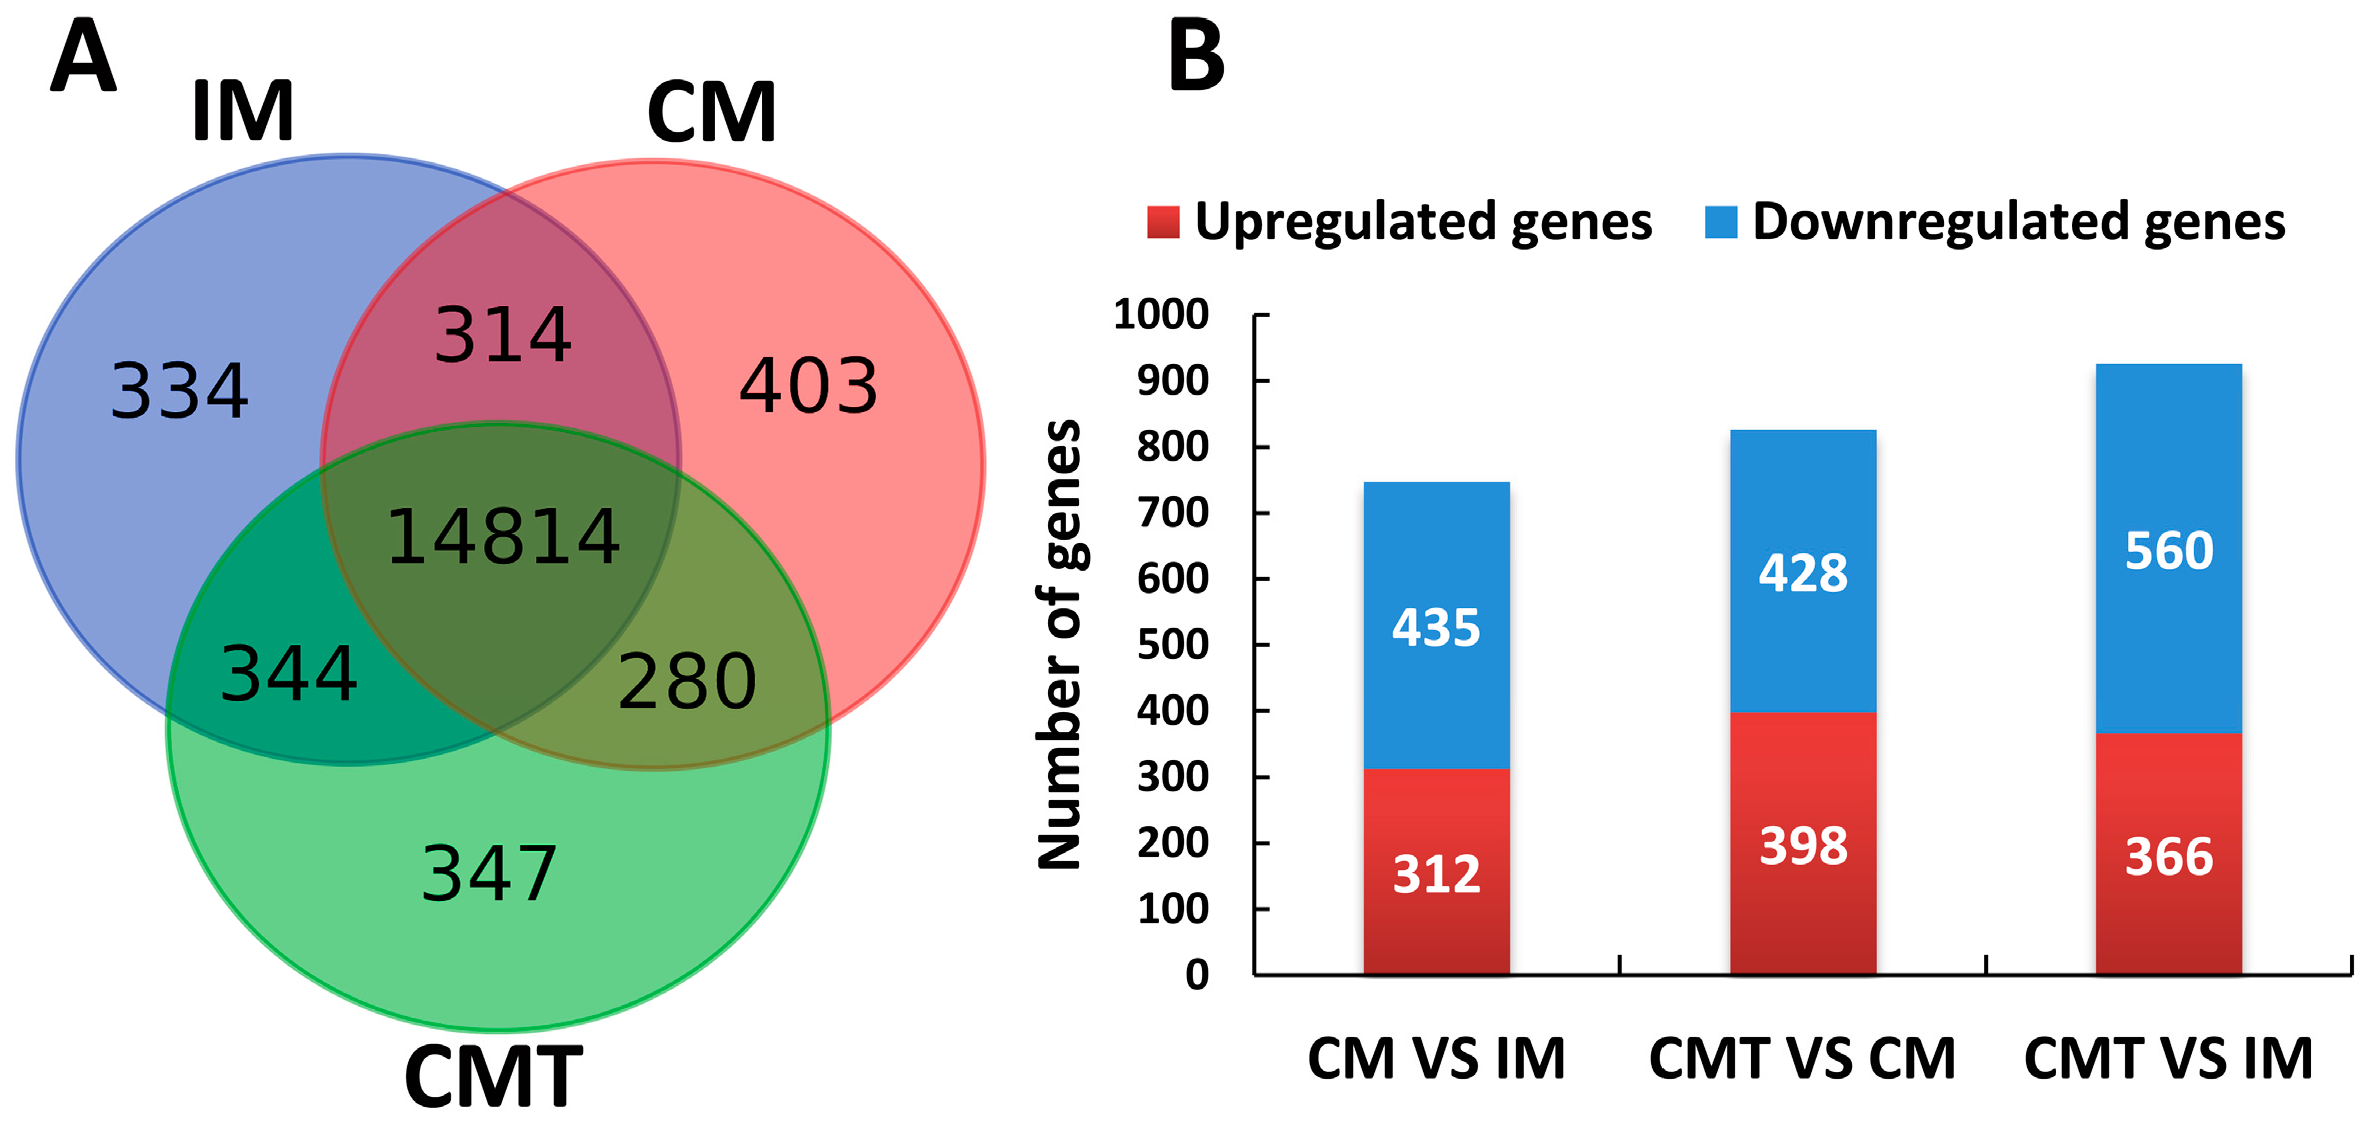
2.4. Identification of Differentially Expressed Genes (DEGs)

Based on our criteria of defining DEGs, 747 (312 upregulated and 435 downregulated), 826 (398 upregulated and 428 downregulated), and 926 (366 upregulated and 560 downregulated) DEGs were identified between groups of CM versus IM, CMT versus CM, and CMT versus IM, respectively (Figure 2B and Table S2). Totally, 1732 DEGs between any two groups were found in the study (Table S2).

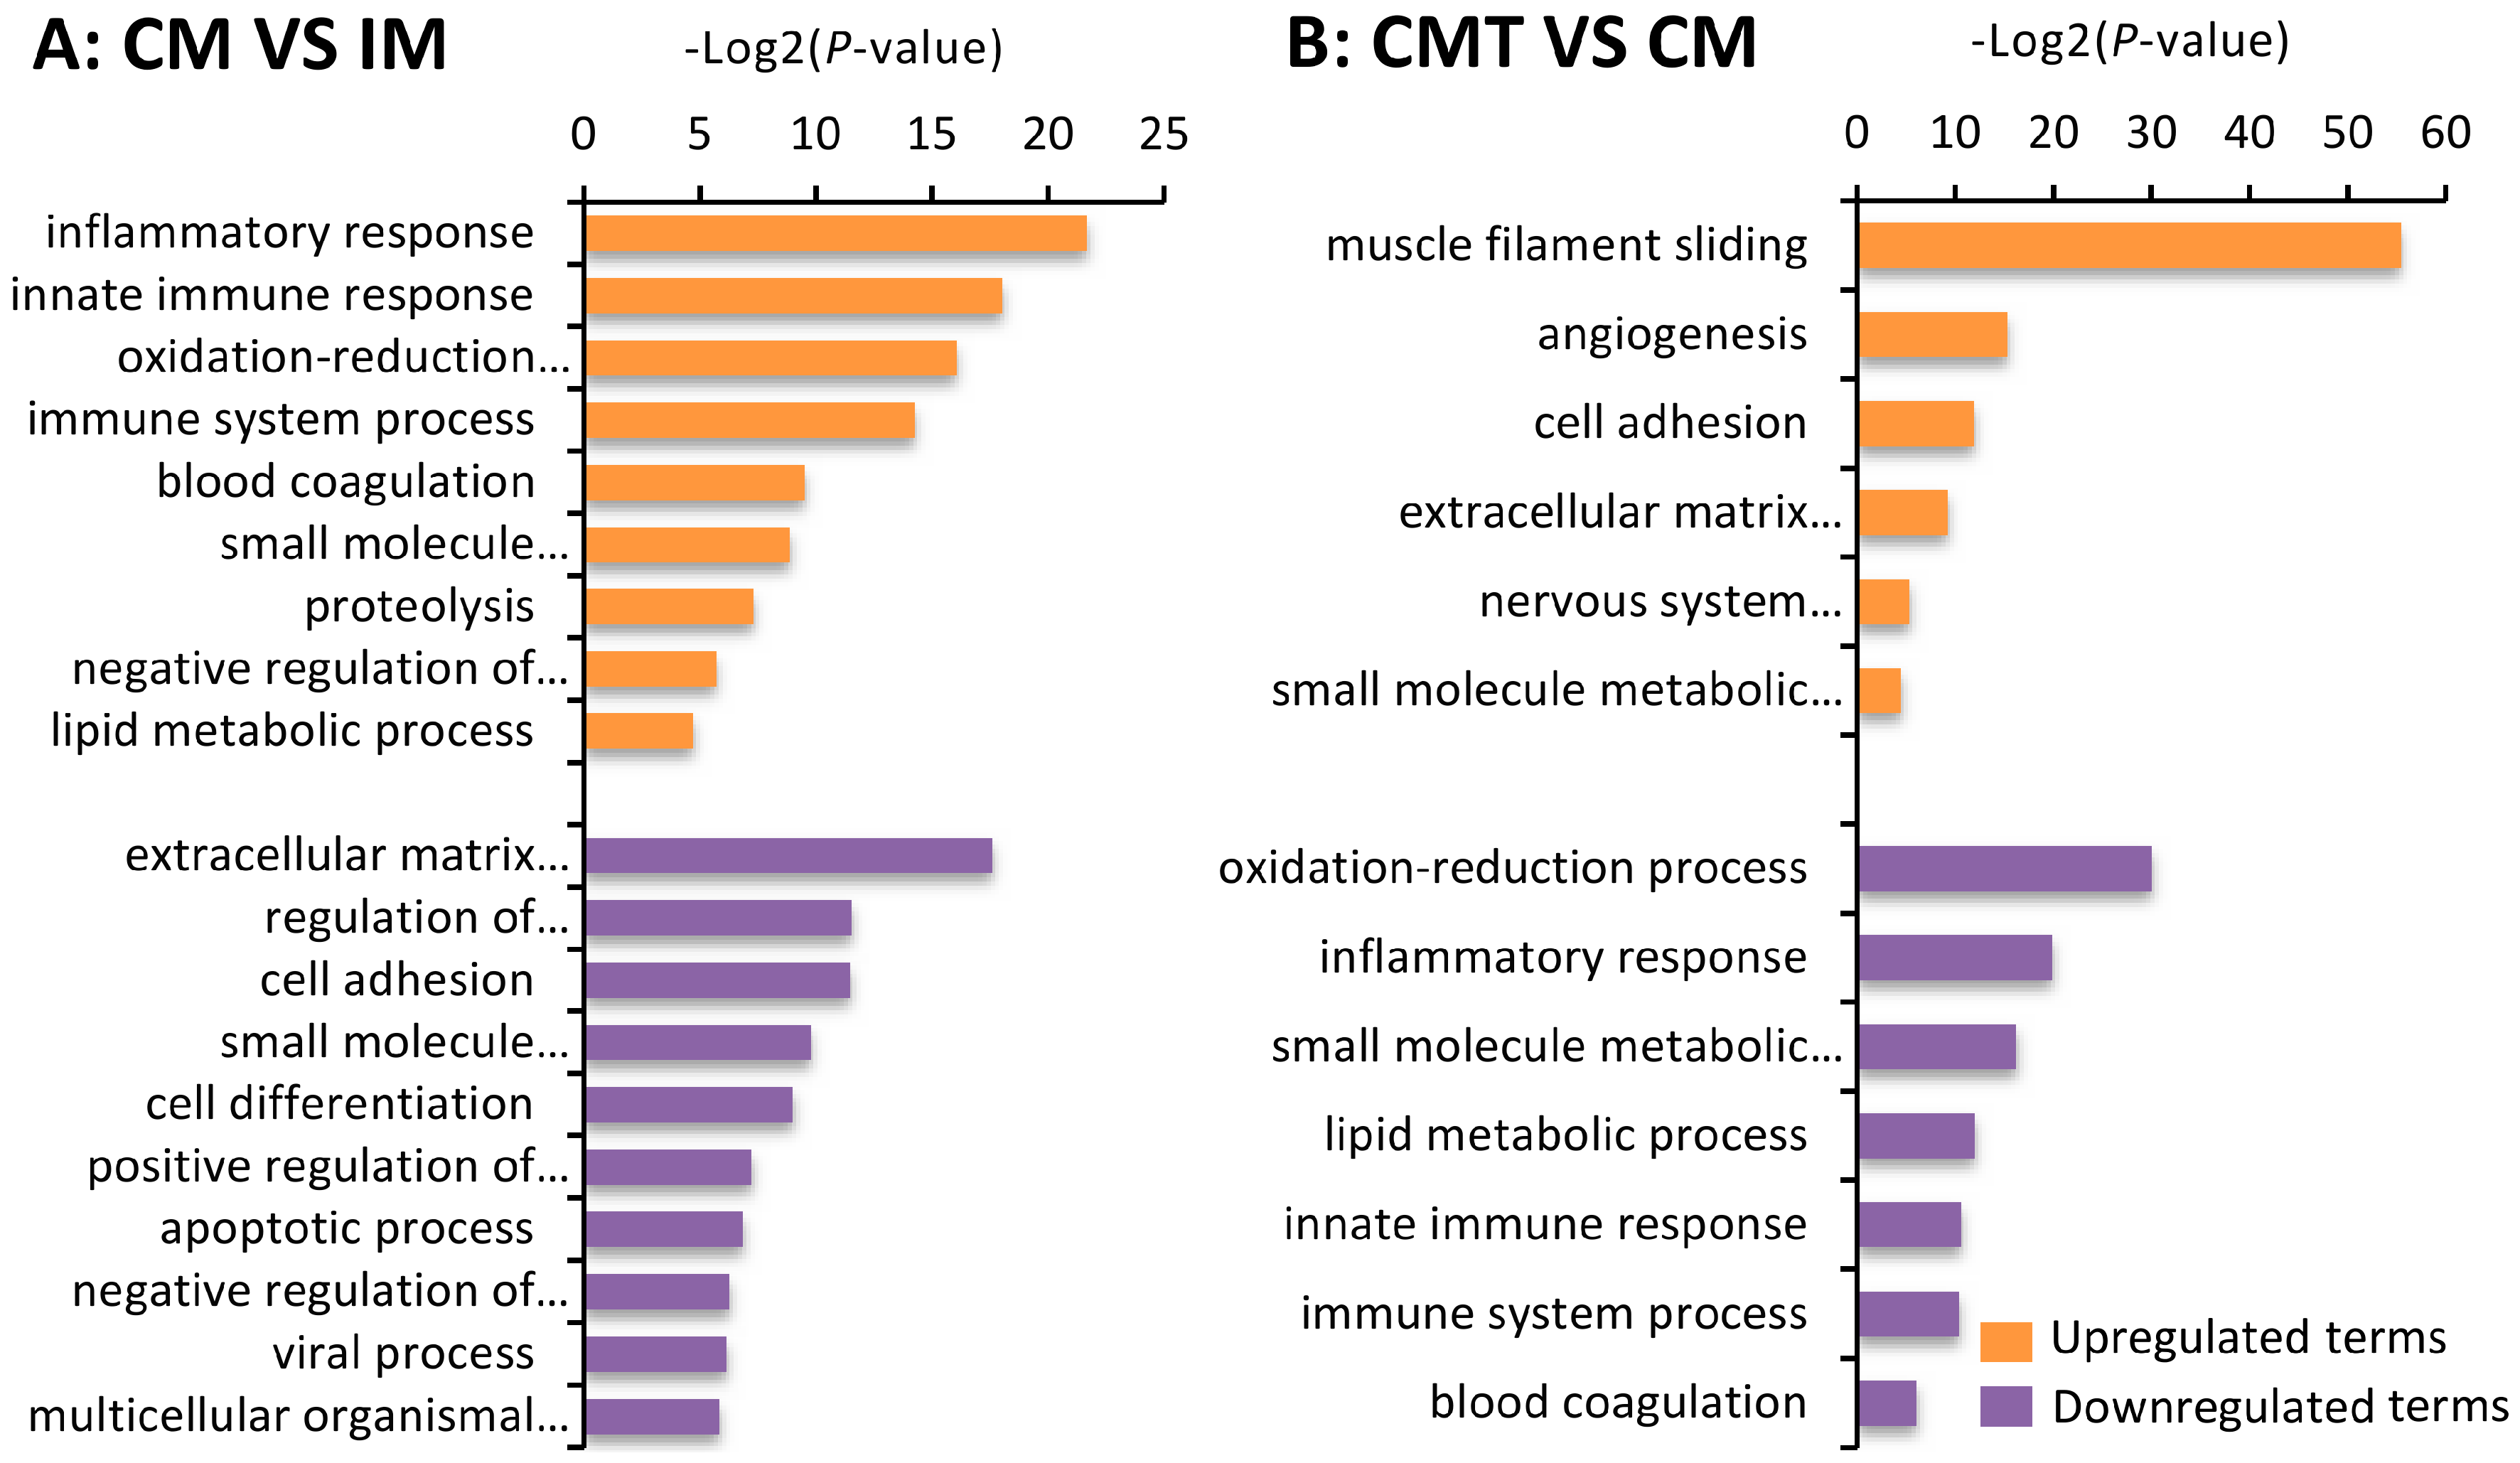
2.5. Gene Ontology (GO) Enrichment Analysis of DEGs between Different Groups

To obtain the biological functions of DEGs in VAT of IM, CM, and CMT pigs, Gene Ontology (GO) enrichment analysis was further performed. The results showed that significantly upregulated GO terms between CM and IM pigs were mainly enriched in inflammatory response, innate immune response, and oxidation-reduction, while downregulated DEGs were mainly involved in extracellular matrix organization, regulation of transcription from RNA polymerase II promoter, and cell adhesion (Figure 3A and Table S3). Furthermore, upregulated DEGs between CMT and CM pigs were mainly enriched in muscle filament sliding, angiogenesis, and cell adhesion, while downregulated DEGs were mainly involved in oxidation-reduction process, inflammatory response, and lipid metabolic process (Figure 3B and Table S4).

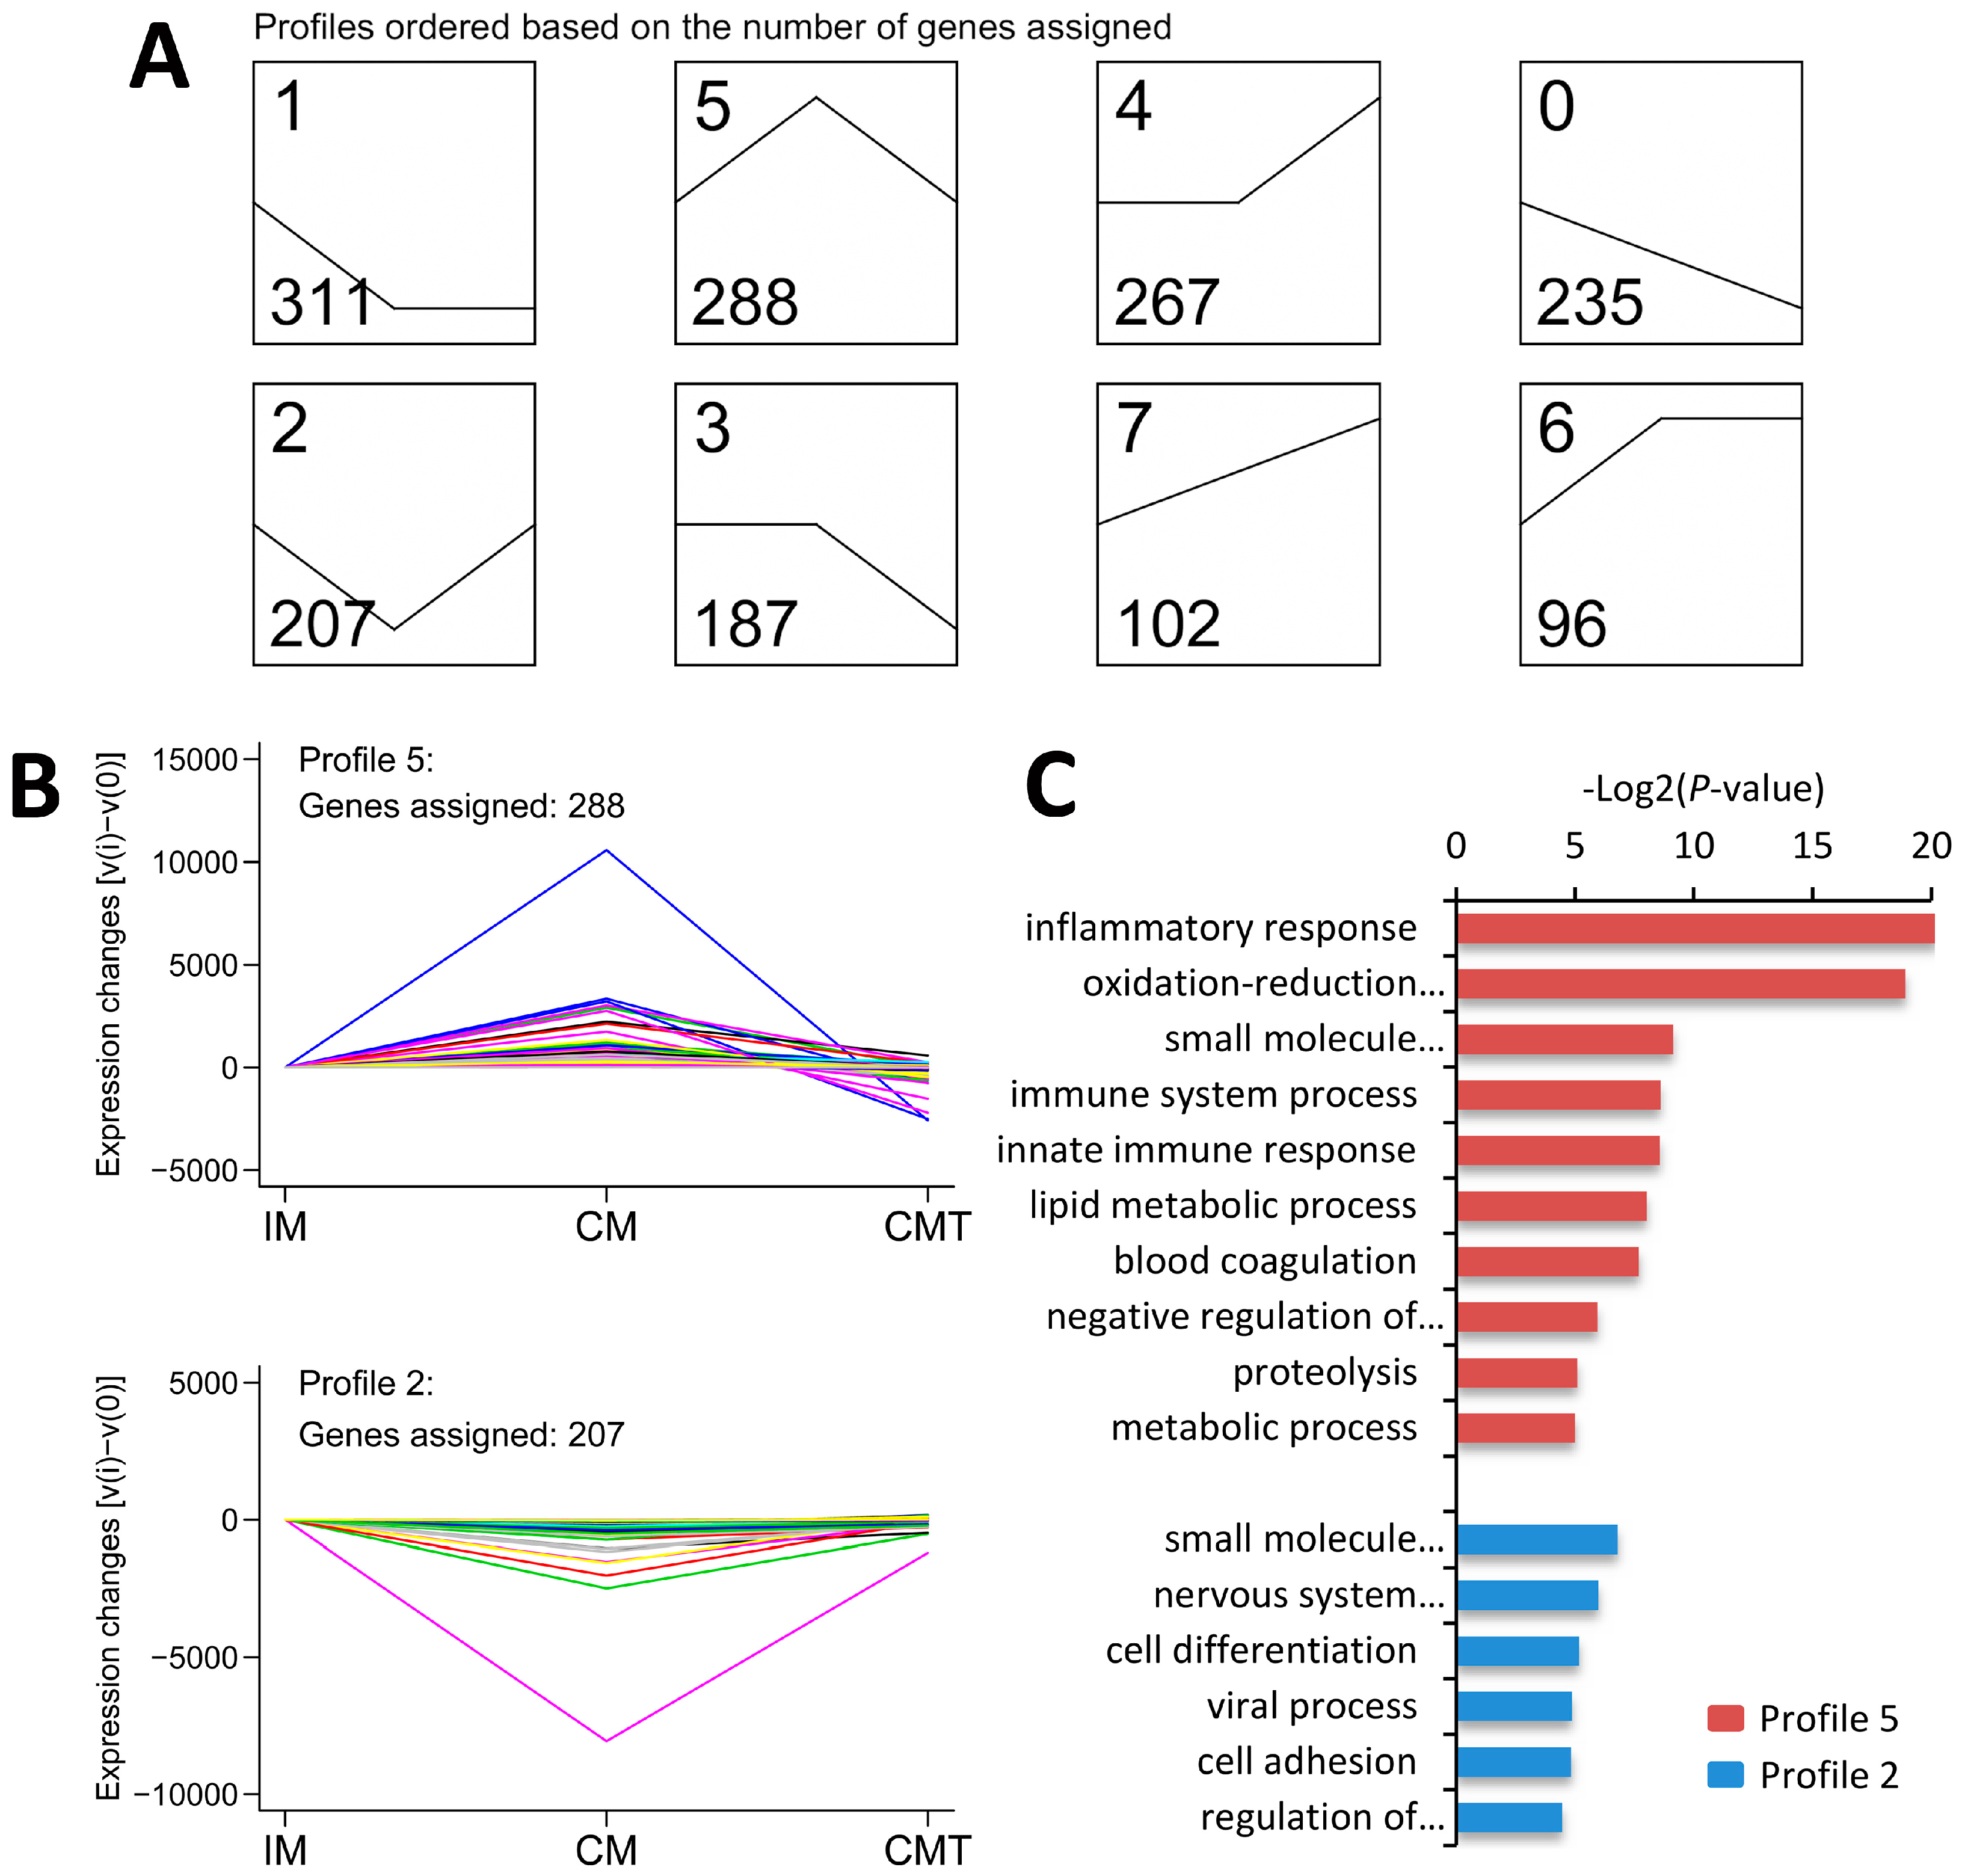
2.6. Series-Cluster Analysis of DEGs

To further refine the expression modes of DEGs in all groups, after excluding 39 DEGs with 0 value in each group, 1693 out of 1732 DEGs were used for series-cluster analysis, which were categorized into eight clusters (Figure 4A). Two of the clusters, named profiles 5 and 2, were the representative profiles for discovering the common changes induced by testosterone deficiency (Figure 4A). Compared with IM pigs, profile 5 contained 288 genes that were characterized by increased expression in CM pigs but decreased in CMT pigs, while profile 2 contained 207 genes that were characterized by decreased expression in CM pigs but increased in CMT pigs (Figure 4B and Table S5).

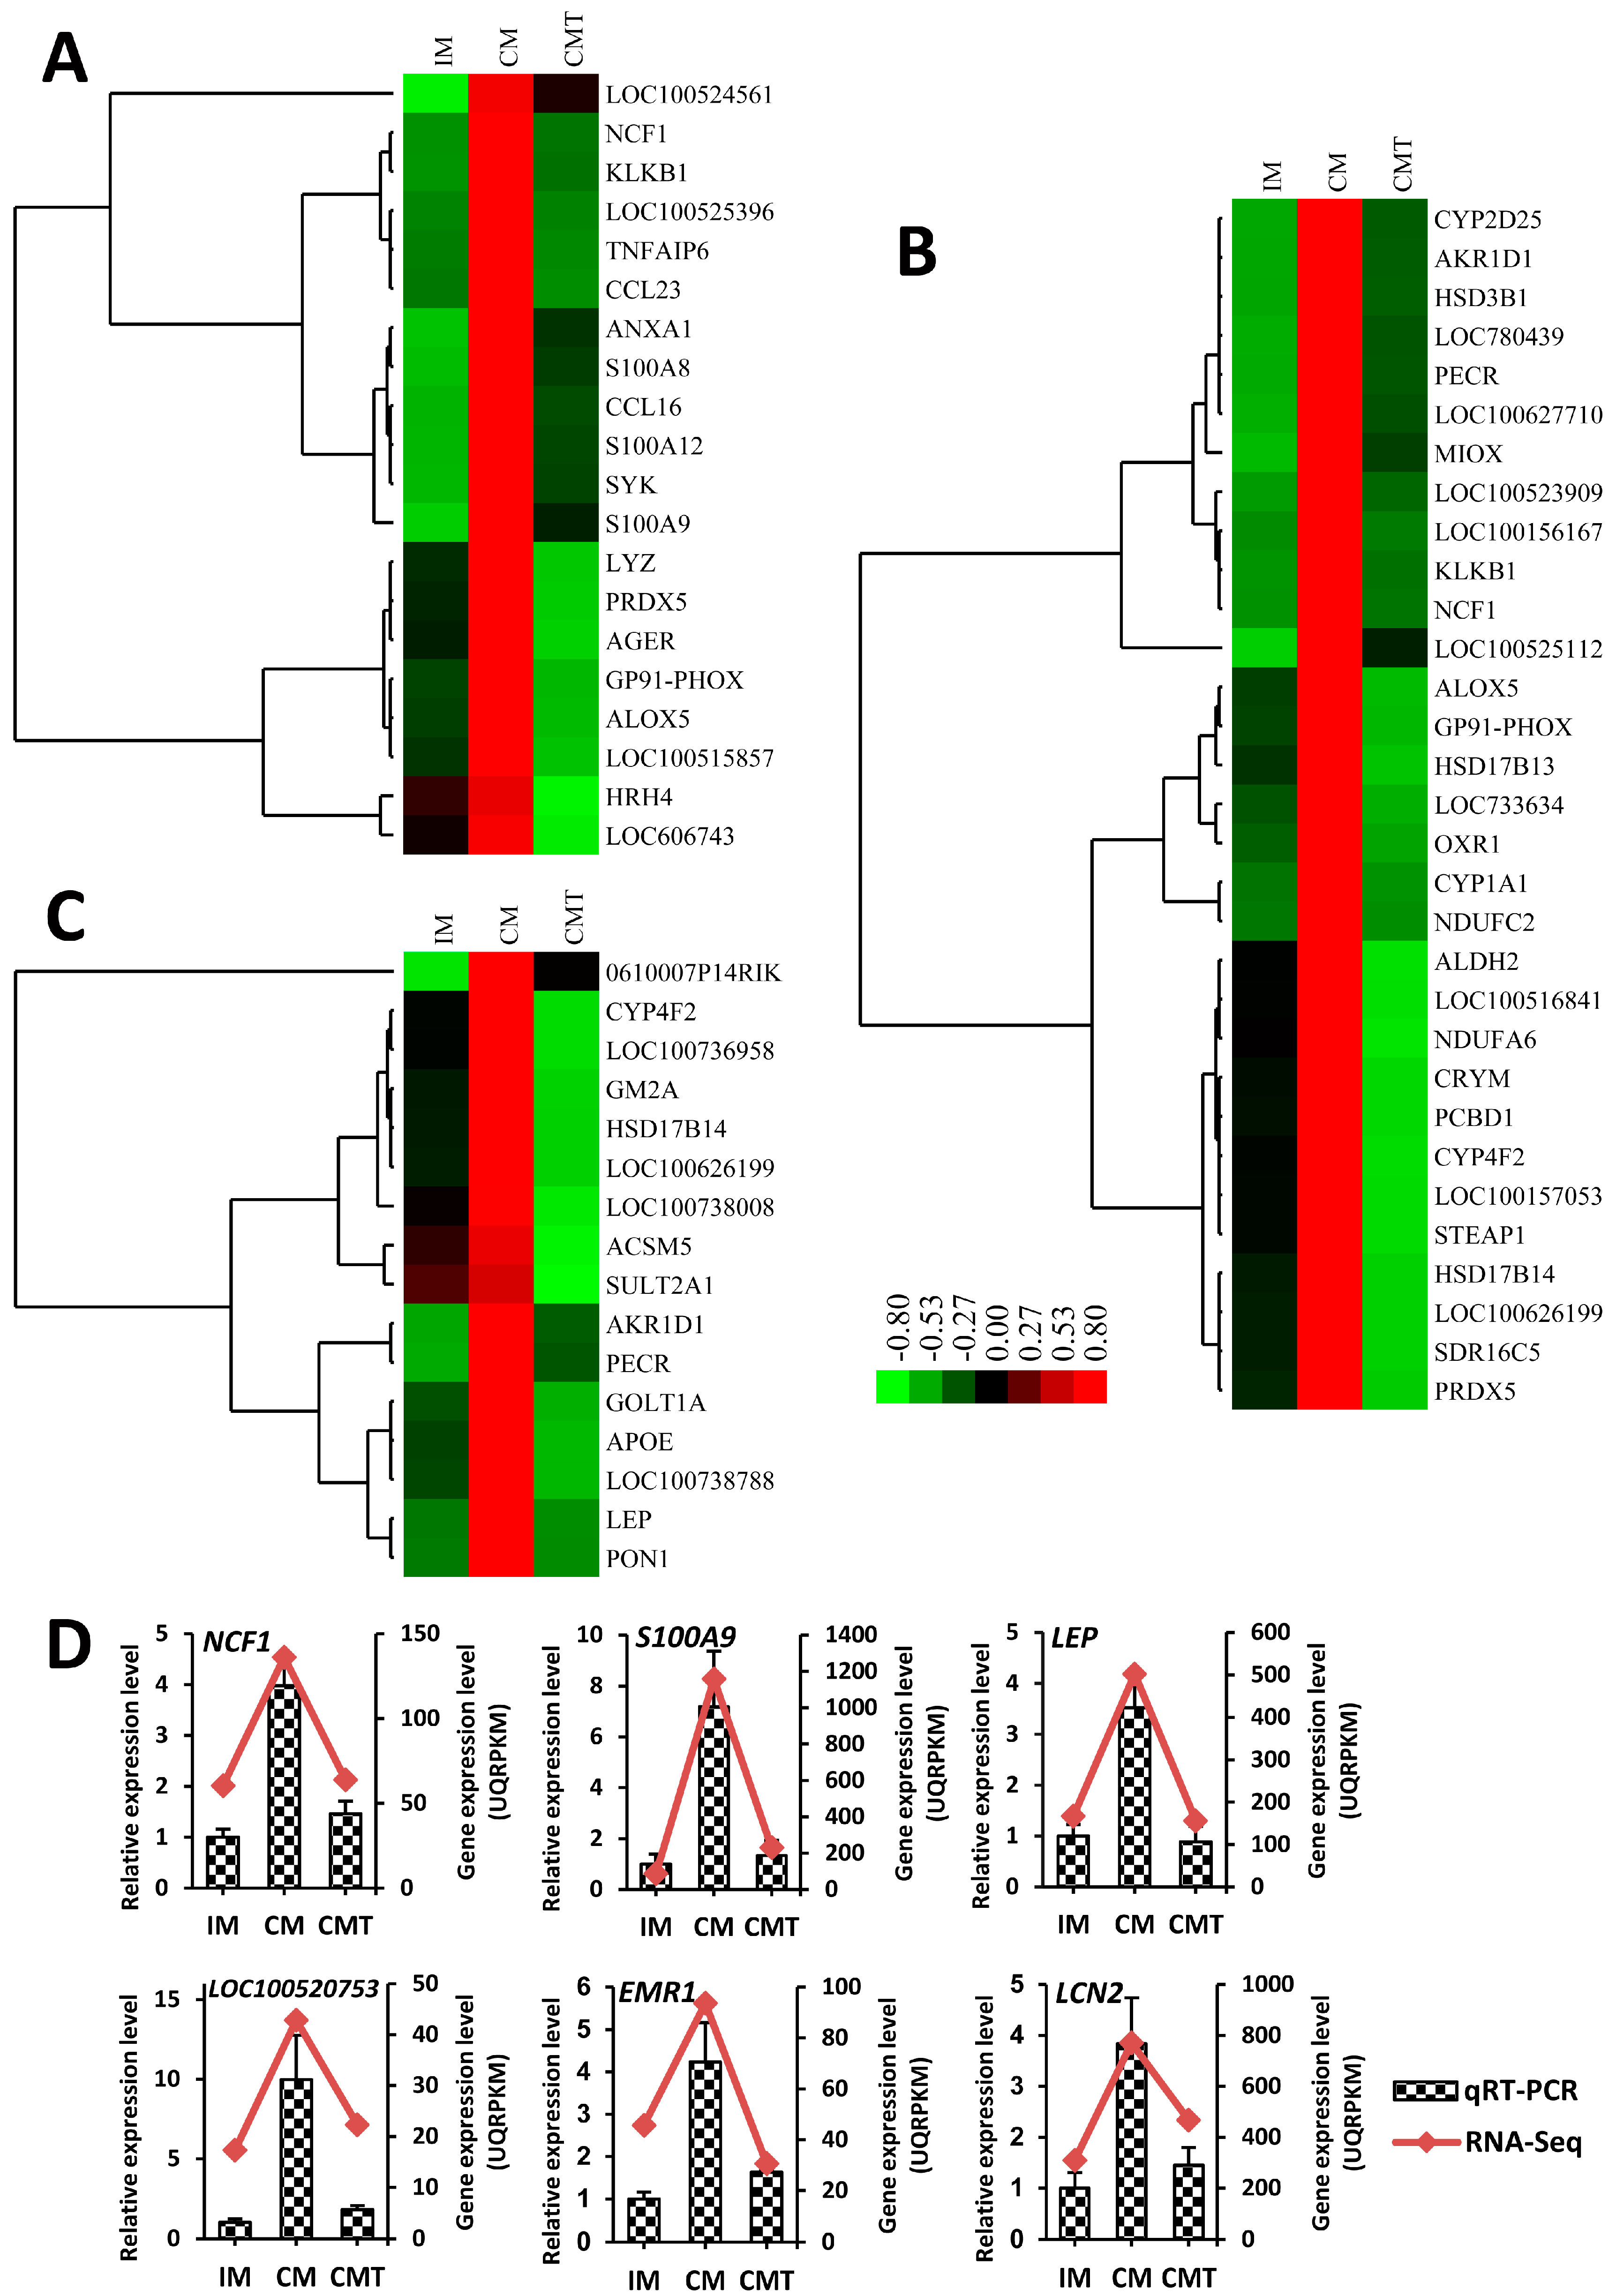
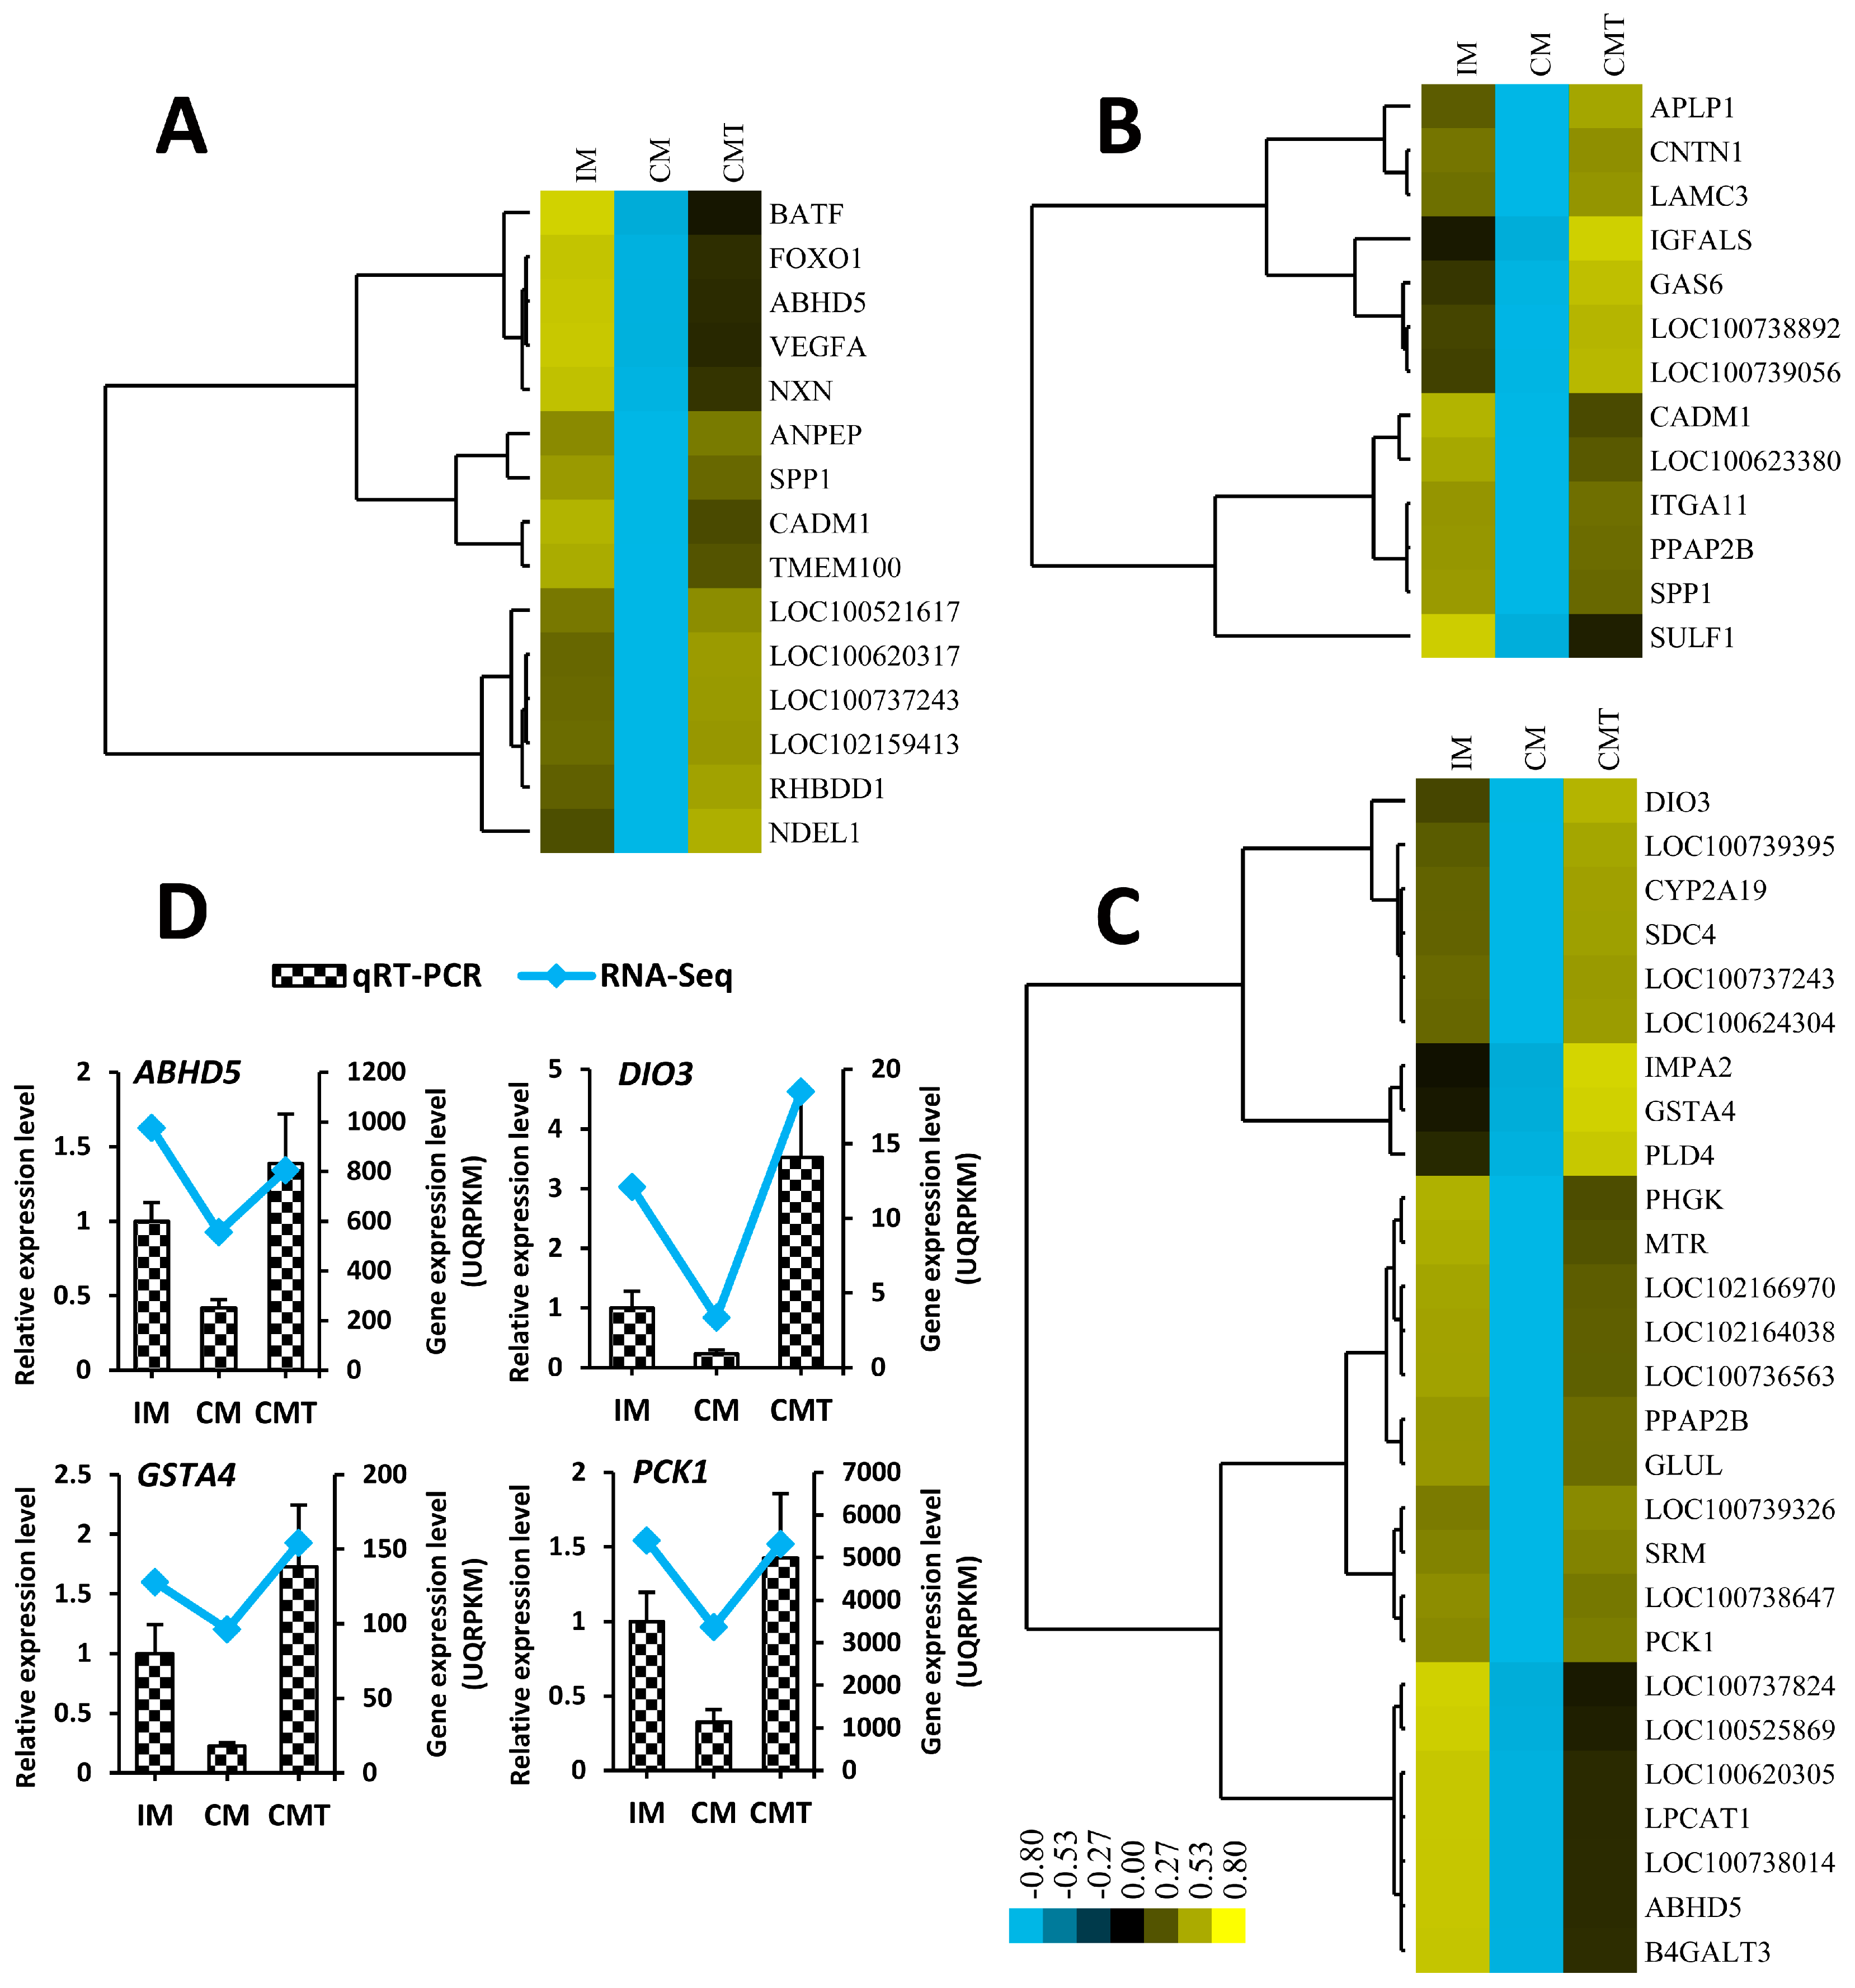
2.7. GO Enrichment Analysis of DEGs Involved in Profile 5 and 2

As shown in Figure 4C and Figure 5A–C, and Table S6, GO terms of DEGs involved in profile 5 were mainly enriched in inflammatory response, oxidation-reduction process, immune system process, and lipid metabolic process, while GO terms of DEGs involved in profile 2 were mainly involved in small molecule metabolic process, cell differentiation, and cell adhesion (Figure 4C and Figure 6A–C, and Table S7). To verify the mRNA expression of genes related with these above processes, quantitative real-time RT-PCR (qRT-PCR) was performed using RNA samples from IM, CM, and CMT groups applied for RNA-Seq. Ten genes, including six genes (NCF1, S100A9, LEP, LOC100520753 (CD68), EMR1, and LCN2) related with inflammatory response, oxidation-reduction process and lipid metabolic process from profile 5 and four genes (ABDH5, DIO3, GSTA4, and PCK1) related of cell differentiation and small molecule metabolic process from profile 2, were selected for qRT-PCR verification. Consistent with RNA-Seq data, the expression of six genes from profile 5 were increased in CM pigs but decreased in CMT pigs (Figure 5D), while four genes from profile 2 were decreased in CM pigs but increased in CMT pigs (Figure 6D), indicating the strong consistence between RNA-Seq and qRT-PCR data.

3. Discussion

Generally, testosterone deficiency or HFC diet resulted in increased VAT accumulation. With aging or hypogonadal of obese individuals, these two factors act together on VAT deposition. However, the role of testosterone in regulating VAT accumulation under HFC diet is still largely unclear. In this study, our pig model fed a HFC diet provides a great opportunity for discovering the role of testosterone deficiency for VAT changes under HFC diet-induced state. Our data found VAT accumulation was increased in CM pigs but decreased in CMT pigs (Figure 1A), indicating testosterone deficiency significantly exacerbated VAT accumulation. In addition, this VAT accumulation process can be reversed by testosterone treatment, showing that testosterone replacement might be involved in the treatment strategy for abating VAT deposition caused by testosterone deficiency under HFC diet. These results are consistent with data observed from testosterone deficiency or androgen receptor knockout (ARKO) mice, which showed that castration induced abdominal obesity of HFD mice and this phenomenon could be eliminated by treating with antibiotics [20] and androgen deficiency under HFD significantly enhanced visceral and total fat accumulation of ARKO mice [21]. However, another study discovered there was no significant difference of VAT mass between obesogenic diet-fed (OGD, including greater amounts of sugars, saturated and monounsaturated fat and less protein and polyunsaturated fat compared to the standard rat chow diet) and orchiectomised (OGD + ORX) male mice [22]. Given differences in diet compositions, it is possible to change the effects on VAT deposition induced by androgen. Further investigation of roles of castration under different diet compositions is required. Additionally, except for testosterone, castration might alter the levels of other hormones, such as estrogen, inhibin and gonadotropins. However, there was no significant difference in key genes related to the levels of estrogen, inhibin and gonadotropins between any two groups, i.e., ESR1, INHBA, and GNRH1, and the expressions of ESR2, INHA, and GNRHR were undetected (Table S1), indicating that these genes or their related hormones might not have significant contributions in VAT deposition induced by testosterone deficiency under HFC diet.
Moreover, testosterone deficiency enhanced leptin levels in both serum and VAT, while testosterone treatment decreased these levels of leptin (Figure 1C and Figure 5D). As a key marker of fat deposition, leptin plays a core role of white adipose tissue (WAT) deposition [23]. In our previous study, castration increased the expression levels of LEP in subcutaneous and leaf fat tissue [24]. Furthermore, consistent with these data obtained from obese children and adolescents or type 2 diabetic men, which showed testosterone suppressed both leptin levels of serum and adipocytes [25,26], our current data indicated testosterone replacement resulted in significantly reduced leptin levels in serum and VAT as well as VAT deposition, further confirming the role of leptin as an indicator for VAT deposition. Alternatively, a major triglyceride-rich lipoprotein of the chylomicron, APOE was found to be significantly increased under testosterone deficiency. In APOE-deficient mice (APOE−/−) with diabetogenic or HFD diet, the fat mass was found to be significantly lower than that in APOE+/+ or wild-type mice, indicating that APOE-deficient might be resistant to adiposity and APOE was positively related with diet-induced adiposity [27,28]. Therefore, enhanced APOE under testosterone deficiency in our data might amplify castration-induced VAT deposition under HFC diet. Actually, expression levels of other well-known lipoproteins for modulating triglyceride metabolism, such as APOA5 and APOC3 [29,30], were also upregulated under testosterone deficiency, although the expressions of APOC3 were not detected in IM pig groups (Table S1). In the previous study, APOE, APOC3, and APOA5 were shown to be positively associated with plasma triglyceride levels [31,32], which indicated VAT accumulation. Accordingly, our previous results found the levels of serum triglyceride were highly significant increased under testosterone deficiency in pigs fed a HFC diet [18]. Thus, our data suggested that these enhanced lipoproteins might contribute to VAT changes caused by testosterone deficiency under HFC feeding. Interestingly, we did not find any significant difference in other common adipogenic markers, such as ADIPOQ, PPARγ, and CEBPα, suggesting that these genes might not have significant roles in the regulation of castration-induced VAT deposition under HFC feeding.
As expected, testosterone deficiency with HFC induced the expression of genes related with inflammatory response. The marked genes, such as LOC100520753 (CD68), EMR1, LCN2, S100A8, S100A9, and S100A12 (Figure 5 and Table S5), were upregulated in CM pigs but downregulated in CMT pigs, suggesting testosterone replacement in castrated pigs might decrease the risk of inflammation. CD68 and EMR1 are two key markers of macrophage infiltration in WAT. In previous studies, the expressions of CD68 and the extent of adiposity and macrophage infiltration in obese mice were increased under Zn deficiency [33]; CD68+ cell percentage as well as CD68 mRNA expressions were positively related with VAT area in women [34]; percentage of cell expressing EMR1 (F4/80) was positively correlated with adipocyte size and macrophage accumulation in obese mice [35]; and the expression levels of EMR1 were significantly reduced in the cocoa-supplemented HFD mice with decreased retroperitoneal WAT weights compared with HFD-fed mice only [36], showing that CD68 and EMR1 could play important roles on WAT accumulation and macrophage infiltration under adiposity. In this study, CD68 and EMR1 were significantly increased in testosterone deficiency of CM pigs and decreased in testosterone replacement of CMT pigs, suggesting that testosterone deficiency with HFC might exacerbate macrophage infiltration in VAT. Furthermore, LCN2, an inflammation-pathway related factor, was discovered to be regulated by testosterone deficiency. Actually, the levels of LCN2 mRNA were dramatically increased in adipose tissue of obese mice compared with that of lean individuals [37] and were positively correlated with pro-inflammatory markers including CD68 in VAT of obese patients [38]. Therefore, our results suggested that enhanced LCN2 in VAT might contribute to inflammation under testosterone deficiency. Additionally, other important inflammation related markers, such as S100A8, S100A9, and S100A12, were also induced by testosterone changes. Our data are consistent with those observed by Sekimoto et al (2012) and Yamaoka et al (2013) [39,40], who found the expression levels of S100A8, S100A9, and S100A12 were positively correlated with VAT adiposity in human and overexpression of S100A8 and S100A9 could increase adipose inflammation. Most recently, upregulated S100A8 expression levels were shown to contribute to the very early stage of pathogenesis of obesity and induce local inflammation [41]. Obviously, our data strongly supported that testosterone deficiency with HFC might enhance the risk of inflammation via upregulating the expression levels of inflammatory markers.
Furthermore, we found the genes involved in oxidation-reduction process were induced by testosterone deficiency with HFC and resulted in up-regulation of oxidant-related genes (i.e., NCF1 (p47phox) and NOX2 (GP91-PHOX)) and down-regulation of antioxidant-related genes (i.e., GPX3 and GSTA4) (Figure 5 and Figure 6, and Table S5). It is not surprising because oxidative related process such as oxidative stress is associated with adiposity caused by VAT accumulation [42,43]. In fact, as two important oxidant genes of oxidative stress, the expression levels of p47phox and GP91-PHOX were shown to be positively associated with VAT mass in mice or rats [43,44], suggesting VAT changes resulted in oxidative stress by regulating the expression of p47phox and GP91-PHOX. For antioxidant markers, oxidative stress reduced the levels of GPX3 in the plasma of obese subjects and adipose tissue of HFD mice [45,46] as well as GSTA4 expression in adipose tissue of obese C57BL/6J mice [47]. Therefore, these data demonstrated that fat deposition might enhance oxidative stress by upregulating oxidant-related genes and downregulating antioxidant-related genes. Consistent with these data, our results supported that VAT deposition of testosterone deficiency with HFC in pigs is associated with oxidative related process by regulating oxidant- and antioxidant-related genes.
In addition, testosterone deficiency with HFC mainly decreased the genes involved in cell differentiation, cell adhesion and small molecule metabolic process. Some important genes, i.e., ABHD5 for cell differentiation, SPP1 for both cell differentiation and cell adhesion, GAS6 for cell adhesion, and DIO3 and PCK1 for small molecule metabolic process (Figure 6 and Table S5), were significantly downregulated under testosterone deficiency with HFC. ABHD5, also known as CGI-58, is a master regulator of triacylglycerol hydrolysis [48] and its knockdown resulted in abnormal accumulation of lipid droplets in 3T3-L1 preadipocytes [49]. In HFD-induced mice, CGI-58 deficiency aggravated macrophage inflammation [50], but Knockdown of CGI-58 was found to prevent HFD-induced obesity and reduce the expression of both lipolytic and lipogenic genes in WAT [51], indicating that the role of CGI-58 for obesity under HFD is still controversial. In this study, ABHD5 was significantly downregulated in CM pigs and testosterone replacement significantly increased its expression in CMT pigs, providing new evidence that ABHD5 might have roles of VAT accumulation regulated by testosterone deficiency with HFC. SPP1, also known as osteopontin, a secreted extracellular matrix protein that binds to specific integrins to promote cell adhesion in porcine trophectoderm cell [52], had been shown to induce brown adipogenesis from white preadipocytes [53]. Moreover, the expression of SPP1 in principal cells of the rat epididymis disappeared after orchiectomy and can be restored with testosterone replacement [54], demonstrating that testosterone could positively regulate SPP1 expression. GAS6, a vitamin K-dependent protein, was shown to regulate cell adhesion in different cells such as endothelial cells and schwannoma cells [55,56]. Furthermore, mutations of GAS6 were shown to be associated with obesity and type 2 diabetes individuals [57] and its serum levels were positively associated with testosterone levels in male patients with coronary heart disease [58], and androgen could directly regulate GAS6 expression by binding the androgen-response elements of its promoter regions for inhibition of vascular calcification [59]. In the present study, downregulated GAS6 and SPP1 under testosterone deficiency with HFC were discovered, further confirmed the role of androgen signaling to regulate these two genes in diet-induced VAT deposition. DIO3, a master gene of heat production and energy metabolism, was found to be associated with multiple traits of fat deposition in pig [60], but so far, the role of DIO3 in VAT deposition induced by androgen is unclear. Here our results provide a novel clue that DIO3 might play an important role in VAT deposition under testosterone deficiency. PCK1, a rate-limiting enzyme for encoding the gluconeogenesis [61], was downregulated by testosterone deficiency with HFC. Consistent with those data observed by Niang et al (2011) [62], who found leptin can significantly downregulated the mRNA expressions of PCK1 in rat WAT, our data also discovered the expression levels of PCK1 were significantly decreased with the increase of leptin levels under testosterone deficiency with HFC, showing that the function of PCK1 in VAT deposition might be induced by leptin signaling. Accordingly, our results indicated that testosterone deficiency with HFC might reduce cell differentiation, cell adhesion and small molecule metabolic process by down-regulating their related genes. However, some upregulated genes involved in small molecule metabolic process were simultaneously found in this study, hence the role of testosterone deficiency with HFC in small molecule metabolic process need to be investigated further. Taken together, our data provide a comprehensive clue on the role of androgen in cell differentiation, cell adhesion, and small molecule metabolic process.

4. Materials and Methods

4.1. Animals

Chinese Wuzhishan miniature male pigs (6–7 months old) were obtained from the Institute of Animal Sciences, Hainan Academy of Agricultural Sciences (Haikou, China). The animals received a standard diet without cholesterol during a 7-week “pretreatment period” for acclimation to the environment. At week 7, the pigs were divided into three groups as follows: intact male pigs fed a HFC diet (IM), castrated male pigs fed a HFC diet (CM), and castrated pigs with testosterone replacement fed a HFC diet (CMT). Among them, IM pigs received only skin incisions which were closed by suture, CM pigs were gonadectomized through two incisions in the perineum which were closed by suture, and CMT pigs were given testosterone treatment after castration by intramuscular weekly injection with testosterone propionate (10 mg/kg body weight; Sigma-Aldrich, St. Louis, MO, USA) dissolved in corn oil. All surgical operations were performed under anesthesia. The HFC diet was fed for 12 weeks starting from week 8. The HFC diet was comprised of 73% normal swine diet, 15% lard, 10% egg yolk power, 1.5% cholesterol, and 0.5% sodium cholate. All experimental procedures were approved by the Institutional Animal Care and Use Committee of the Zhejiang Chinese Medical University (2013450; 9 December 2013).
At the end of the experimental period, animals were weighted and killed by exsanguination under sodium pentobarbital anesthesia. Blood samples were collected and centrifuged at 3000× g at 4 °C for 15 min and then stored at −80 °C for serum measurement. VAT of each animal was derived from retroperitoneal adipose tissue and weighed, followed by freezing storage in liquid nitrogen for RNA extraction. VAT fat was measured as a ratio of VAT weight refers to the proportion of body weight. Serum testosterone concentrations were measured using an RIA kit (B10B, Beijing North Institute of Biological Technology, Beijing, China), and serum leptin levels were measured using a commercially available kit (50R-E.1511P, Tianjin Anoric Bio-technology, Co., Ltd., Tianjin, China) and analyzed by an Automatic Biochemistry Analyzer (Hitachi 7020, Tokyo, Japan). The intra-assay and inter-assay coefficients of variation were below 10% and 15% for testosterone, respectively, and the inter-assay coefficients of variation were below 6% for leptin. The assay sensitivities were 0.02 ng/mL and 0.1 ng/L for testosterone and leptin, respectively.

4.2. RNA Extraction, cDNA Library Construction and Ion Proton Sequencing

Total RNA was extracted using TRIzol reagent (Invitrogen, Carlsbad, CA, USA) according to the manufacturer’s protocol. RNA integrities and qualities were assessed by Bioanalyzer 2100 (Agilent Technologies, Santa Clara, CA, USA) and agarose gel electrophoresis. The RNA integrity number (RIN) of all samples was more than 7.0. Then, RNA samples from IM, CM, and CMT groups (n = 4 per group) were pooled with equal quantities, respectively, and were used for cDNA library construction and Ion-proton sequencing. Briefly, cDNA libraries for single-end sequencing were prepared using the Ion Total RNA-Seq Kit v2.0 (Life Technologies, Carlsbad, CA, USA) according to the manufacturer’s instructions. After diluting and mixing of samples, the mixture was processed on OneTouch 2 instrument and was enriched on OneTouch 2 ES station (Life Technologies, Carlsbad, CA, USA). Finally, the enriched mixture samples were loaded on to 1 P1v2 Proton Chip and sequenced on Proton Sequencers according to the Ion PI Sequencing 200 Kit v2.0 (Life Technologies, Carlsbad, CA, USA).

4.3. Sequence Mapping and DEGs Filtering

Raw sequencing data were filtered by removing the adaptor sequences, reads with >5% ambiguous bases, and low-quality reads with qualities <13. These clean data were then mapped to the current pig reference genome (Sscrofa 10.2) using the MapSplice program [63]. UQRPKM values [64,65] were used to measure the expression levels of each gene. DEGSeq algorithm of R package was used to identify DEGs [66]. The DEGs were defined as fold changes of 1.5 or more, p value less 0.05 after false discovery rate (FDR) correction, and UQRPKM values greater than or equal to 1 in any two groups.

4.4. Cluster Analysis

Hierarchical clustering analysis was performed using Cluster 3.0 and was visualized using the Java Treeview (version 1.1.6r2, Stanford University, Stanford, CA, USA). The expression profiles of DEGs were determined by series-cluster analysis based on the Short Time-Series Expression Miner (STEM) method [67].

4.5. Gene Ontology (GO) Analysis

Gene ontology (GO) analysis of DEGs using GO annotation from the Gene Ontology (http://www.geneontology.org/). Fisher’s exact test was applied to identify the significant GO categories. Terms with p values less than 0.05 and the number of matching genes in term (DifGene) more than 5% of all used genes (AllDifGene) were selected as significant or enriched terms.

4.6. Quantitative Real-Time RT-PCR

Ten genes (six from profile 5 and four from profile 2) were analyzed by quantitative real-time RT-PCR (qRT-PCR) for validating the data from RNA sequencing. The primers of each gene are listed in Table S8. Approximately 1 μg RNA was reverse transcribed using an MMLV-RT Kit (Promega, Madison, WI, USA) according to the manufacturer’s protocol. Next, qRT-PCR was performed using a standard SYBR Green PCR kit (Takara, Dalian, China) and was processed on StepOnePlus™ Real-Time PCR Detection System (Applied Biosystems, Foster City, CA, USA). The qRT-PCR conditions were used as follows: 95 °C for 5 min, followed by 40 cycles of 95 °C for 15 s, 60 °C for 30 s, and 72 °C for 30 s. β-Actin was used as an internal control to normalize gene expression and assays were run in triplicate. The 2−ΔΔCt method was used to determine the expression level differences [68].

4.7. Statistical Analysis

Statistical analyses were performed using SPSS v17.0 software (SPSS, Chicago, IL, USA) and the results showed as means ± SEMs. Statistical differences between groups were examined using ANOVA followed Bonferroni multiple comparison, and p values of less than 0.05 and 0.01 were considered as significant and highly significant, respectively.

4.8. Data Accessibility

The datasets have been submitted to the Gene Expression Omnibus (GEO) database of NCBI (accession number GSE77544).

5. Conclusions

In summary, a genome-wide view of transcriptome changes of VAT with HFC induced by testosterone deficiency in miniature pig model was investigated here. Our data discovered that testosterone deficiency in pigs fed a HFC diet mainly increased the changes of genes associated with inflammatory process, oxidation-reduction process, and lipid metabolic process, while reduced other genes mainly involved in cell differentiation and cell adhesion. Furthermore, this study provides novel insights for comprehensively understanding the mechanisms of the VAT changes induced by testosterone deficiency, revealing possible clues for treatment or abatement of visceral adiposity under testosterone deficiency.

Supplementary Materials

Supplementary materials can be found at www.mdpi.com/1422-0067/17/12/2125/s1.

Acknowledgments

This work was supported by the Fundamental Research Funds for the Central Universities (KYZ201414), the National Natural Science Foundation of China (31200921 and 31501930), the National Key Technology Research and Development Program of the Ministry of Science and Technology of China (2015BAD03B01), and the Natural Science Foundation of Jiangsu Province of China (BK20150656 and BK20150669).

Author Contributions

Conceived and designed the experiments: Lifan Zhang and Zhaowei Cai. Performed the experiments: Zhaowei Cai, Yueqin Cai, Yun Ling, Liang Zhu, and Lifan Zhang. Analyzed the data: Lifan Zhang, Zhaowei Cai, and Shengjuan Wei. Contributed reagents/materials/analysis tools: Lifan Zhang, Dongfeng Li, and Zhaowei Cai. Wrote the paper: Lifan Zhang, Zhaowei Cai, and Shengjuan Wei.

Conflicts of Interest

The authors declare no conflict of interest.

References

  1. Zheng, H.; Zhang, C.; Yang, W.; Wang, Y.; Lin, Y.; Yang, P.; Yu, Q.; Fan, J.; Liu, E. Fat and cholesterol diet induced lipid metabolic disorders and insulin resistance in rabbit. Exp. Clin. Endocrinol. Diabetes 2009, 117, 400–405. [Google Scholar] [CrossRef] [PubMed]
  2. Muir, R.; Ballan, J.; Clifford, B.; McMullen, S.; Khan, R.; Shmygol, A.; Quenby, S.; Elmes, M. Modelling maternal obesity: The effects of a chronic high-fat, high-cholesterol diet on uterine expression of contractile-associated proteins and ex vivo contractile activity during labour in the rat. Clin. Sci. 2016, 130, 183–192. [Google Scholar] [CrossRef] [PubMed]
  3. Kapoor, D.; Aldred, H.; Clark, S.; Channer, K.S.; Jones, T.H. Clinical and biochemical assessment of hypogonadism in men with type 2 diabetes: Correlations with bioavailable testosterone and visceral adiposity. Diabetes Care 2007, 30, 911–917. [Google Scholar] [CrossRef] [PubMed]
  4. Tsai, E.C.; Boyko, E.J.; Leonetti, D.L.; Fujimoto, W.Y. Low serum testosterone level as a predictor of increased visceral fat in Japanese–American men. Int. J. Obes. Relat. Metab. Disord. 2000, 24, 485–491. [Google Scholar] [CrossRef] [PubMed]
  5. Saad, F. Androgen therapy in men with testosterone deficiency: Can testosterone reduce the risk of cardiovascular disease? Diabetes Metab. Res. Rev. 2012, 28 (Suppl. S2), 52–59. [Google Scholar] [CrossRef] [PubMed]
  6. Allan, C.A.; McLachlan, R.I. Androgens and obesity. Curr. Opin. Endocrinol. Diabetes Obes. 2010, 17, 224–232. [Google Scholar] [CrossRef] [PubMed]
  7. Yassin, A.; Doros, G. Testosterone therapy in hypogonadal men results in sustained and clinically meaningful weight loss. Clin. Obes. 2013, 3, 73–83. [Google Scholar] [CrossRef] [PubMed]
  8. Kapoor, D.; Goodwin, E.; Channer, K.S.; Jones, T.H. Testosterone replacement therapy improves insulin resistance, glycaemic control, visceral adiposity and hypercholesterolaemia in hypogonadal men with type 2 diabetes. Eur. J. Endocrinol. 2006, 154, 899–906. [Google Scholar] [CrossRef] [PubMed]
  9. Kalinchenko, S.Y.; Tishova, Y.A.; Mskhalaya, G.J.; Gooren, L.J.; Giltay, E.J.; Saad, F. Effects of testosterone supplementation on markers of the metabolic syndrome and inflammation in hypogonadal men with the metabolic syndrome: The double-blinded placebo-controlled moscow study. Clin. Endocrinol. 2010, 73, 602–612. [Google Scholar] [CrossRef] [PubMed]
  10. Traish, A.M.; Zitzmann, M. The complex and multifactorial relationship between testosterone deficiency (TD), obesity and vascular disease. Rev. Endocr. Metab. Disord. 2015, 16, 249–268. [Google Scholar] [CrossRef] [PubMed]
  11. Maneschi, E.; Morelli, A.; Filippi, S.; Cellai, I.; Comeglio, P.; Mazzanti, B.; Mello, T.; Calcagno, A.; Sarchielli, E.; Vignozzi, L.; et al. Testosterone treatment improves metabolic syndrome-induced adipose tissue derangements. J. Endocrinol. 2012, 215, 347–362. [Google Scholar] [CrossRef] [PubMed]
  12. Abdelhamed, A.; Hisasue, S.; Shirai, M.; Matsushita, K.; Wakumoto, Y.; Tsujimura, A.; Tsukamoto, T.; Horie, S. Testosterone replacement alters the cell size in visceral fat but not in subcutaneous fat in hypogonadal aged male rats as a late-onset hypogonadism animal model. Res. Rep. Urol. 2015, 7, 35–40. [Google Scholar] [CrossRef] [PubMed]
  13. Saad, F.; Yassin, A.; Doros, G.; Haider, A. Effects of long-term treatment with testosterone on weight and waist size in 411 hypogonadal men with obesity classes I–III: Observational data from two registry studies. Int. J. Obes. 2016, 40, 162–170. [Google Scholar] [CrossRef] [PubMed]
  14. Christoffersen, B.O.; Grand, N.; Golozoubova, V.; Svendsen, O.; Raun, K. Gender-associated differences in metabolic syndrome-related parameters in Göttingen minipigs. Comp. Med. 2007, 57, 493–504. [Google Scholar] [PubMed]
  15. Christoffersen, B.; Golozoubova, V.; Pacini, G.; Svendsen, O.; Raun, K. The young Göttingen minipig as a model of childhood and adolescent obesity: Influence of diet and gender. Obesity 2013, 21, 149–158. [Google Scholar] [CrossRef] [PubMed]
  16. Koopmans, S.J.; Schuurman, T. Considerations on pig models for appetite, metabolic syndrome and obese type 2 diabetes: From food intake to metabolic disease. Eur. J. Pharmacol. 2015, 759, 231–239. [Google Scholar] [CrossRef] [PubMed]
  17. Cai, Z.; Zhang, L.; Chen, M.; Jiang, X.; Xu, N. Castration-induced changes in microRNA expression profiles in subcutaneous adipose tissue of male pigs. J. Appl. Genet. 2014, 55, 259–266. [Google Scholar] [CrossRef] [PubMed]
  18. Cai, Z.; Jiang, X.; Pan, Y.; Chen, L.; Zhang, L.; Zhu, K.; Cai, Y.; Ling, Y.; Chen, F.; Xu, X.; et al. Transcriptomic analysis of hepatic responses to testosterone deficiency in miniature pigs fed a high-cholesterol diet. BMC Genom. 2015, 16, 59. [Google Scholar] [CrossRef] [PubMed]
  19. Cai, Z.; Xi, H.; Pan, Y.; Jiang, X.; Chen, L.; Cai, Y.; Zhu, K.; Chen, C.; Xu, X.; Chen, M. Effect of testosterone deficiency on cholesterol metabolism in pigs fed a high-fat and high-cholesterol diet. Lipids Health Dis. 2015, 14, 18. [Google Scholar] [CrossRef] [PubMed]
  20. Harada, N.; Hanaoka, R.; Horiuchi, H.; Kitakaze, T.; Mitani, T.; Inui, H.; Yamaji, R. Castration influences intestinal microflora and induces abdominal obesity in high-fat diet-fed mice. Sci. Rep. 2016, 6, 23001. [Google Scholar] [CrossRef] [PubMed]
  21. Rubinow, K.B.; Wang, S.; den Hartigh, L.J.; Subramanian, S.; Morton, G.J.; Buaas, F.W.; Lamont, D.; Gray, N.; Braun, R.E.; Page, S.T. Hematopoietic androgen receptor deficiency promotes visceral fat deposition in male mice without impairing glucose homeostasis. Andrology 2015, 3, 787–796. [Google Scholar] [CrossRef] [PubMed]
  22. Donner, D.G.; Elliott, G.E.; Beck, B.R.; Bulmer, A.C.; Du Toit, E.F. Impact of diet-induced obesity and testosterone deficiency on the cardiovascular system: A novel rodent model representative of males with testosterone-deficient metabolic syndrome (TDMetS). PLoS ONE 2015, 10, e0138019. [Google Scholar] [CrossRef] [PubMed]
  23. Kiess, W.; Reich, A.; Meyer, K.; Glasow, A.; Deutscher, J.; Klammt, J.; Yang, Y.; Muller, G.; Kratzsch, J. A role for leptin in sexual maturation and puberty? Horm. Res. 1999, 51 (Suppl. S3), 55–63. [Google Scholar] [CrossRef] [PubMed]
  24. Cai, Z.W.; Zhao, X.F.; Yao, Y.C.; Jiang, X.L.; Zhang, L.F.; Xu, N.Y.; Wu, C.X. Castration modulates leptin and its receptor in the hypothalamus from male pigs. J. Anim. Vet. Adv. 2010, 9, 1696–1701. [Google Scholar]
  25. Wabitsch, M.; Blum, W.F.; Muche, R.; Braun, M.; Hube, F.; Rascher, W.; Heinze, E.; Teller, W.; Hauner, H. Contribution of androgens to the gender difference in leptin production in obese children and adolescents. J. Clin. Investig. 1997, 100, 808–813. [Google Scholar] [CrossRef] [PubMed]
  26. Kapoor, D.; Clarke, S.; Stanworth, R.; Channer, K.S.; Jones, T.H. The effect of testosterone replacement therapy on adipocytokines and C-reactive protein in hypogonadal men with type 2 diabetes. Eur. J. Endocrinol. 2007, 156, 595–602. [Google Scholar] [CrossRef] [PubMed]
  27. Hofmann, S.M.; Perez-Tilve, D.; Greer, T.M.; Coburn, B.A.; Grant, E.; Basford, J.E.; Tschop, M.H.; Hui, D.Y. Defective lipid delivery modulates glucose tolerance and metabolic response to diet in apolipoprotein E-deficient mice. Diabetes 2008, 57, 5–12. [Google Scholar] [CrossRef] [PubMed]
  28. Wang, J.; Perrard, X.D.; Perrard, J.L.; Mukherjee, A.; Rosales, C.; Chen, Y.; Smith, C.W.; Pownall, H.J.; Ballantyne, C.M.; Wu, H. ApoE and the role of very low density lipoproteins in adipose tissue inflammation. Atherosclerosis 2012, 223, 342–349. [Google Scholar] [CrossRef] [PubMed]
  29. Zhang, L.F.; Jiang, X.L.; Hua, X.C.; Lu, Y.P.; Xu, N.Y. Molecular cloning, expression and polymorphism of the porcine apolipoprotein A5 gene in a Jinhua × Pietrain F2 reference population. Animal 2010, 4, 523–529. [Google Scholar] [CrossRef] [PubMed]
  30. Timpson, N.J.; Walter, K.; Min, J.L.; Tachmazidou, I.; Malerba, G.; Shin, S.Y.; Chen, L.; Futema, M.; Southam, L.; Iotchkova, V.; et al. A rare variant in APOC3 is associated with plasma triglyceride and VLDL levels in Europeans. Nat. Commun. 2014, 5, 4871. [Google Scholar] [CrossRef] [PubMed] [Green Version]
  31. Drosatos, K.; Sanoudou, D.; Kypreos, K.E.; Kardassis, D.; Zannis, V.I. A dominant negative form of the transcription factor c-jun affects genes that have opposing effects on lipid homeostasis in mice. J. Biol. Chem. 2007, 282, 19556–19564. [Google Scholar] [CrossRef] [PubMed]
  32. Dallinga-Thie, G.M.; van Tol, A.; Hattori, H.; van Vark-van der Zee, L.C.; Jansen, H.; Sijbrands, E.J. Plasma apolipoprotein A5 and triglycerides in type 2 diabetes. Diabetologia 2006, 49, 1505–1511. [Google Scholar] [CrossRef] [PubMed]
  33. Liu, M.J.; Bao, S.; Bolin, E.R.; Burris, D.L.; Xu, X.; Sun, Q.; Killilea, D.W.; Shen, Q.; Ziouzenkova, O.; Belury, M.A.; et al. Zinc deficiency augments leptin production and exacerbates macrophage infiltration into adipose tissue in mice fed a high-fat diet. J. Nutr. 2013, 143, 1036–1045. [Google Scholar] [CrossRef] [PubMed]
  34. Michaud, A.; Drolet, R.; Noel, S.; Paris, G.; Tchernof, A. Visceral fat accumulation is an indicator of adipose tissue macrophage infiltration in women. Metabolism 2012, 61, 689–698. [Google Scholar] [CrossRef] [PubMed]
  35. Weisberg, S.P.; McCann, D.; Desai, M.; Rosenbaum, M.; Leibel, R.L.; Ferrante, A.W., Jr. Obesity is associated with macrophage accumulation in adipose tissue. J. Clin. Investig. 2003, 112, 1796–1808. [Google Scholar] [CrossRef] [PubMed]
  36. Gu, Y.; Yu, S.; Lambert, J.D. Dietary cocoa ameliorates obesity-related inflammation in high fat-fed mice. Eur. J. Nutr. 2014, 53, 149–158. [Google Scholar] [CrossRef] [PubMed]
  37. Zhang, J.; Wu, Y.; Zhang, Y.; Leroith, D.; Bernlohr, D.A.; Chen, X. The role of lipocalin 2 in the regulation of inflammation in adipocytes and macrophages. Mol. Endocrinol. 2008, 22, 1416–1426. [Google Scholar] [CrossRef] [PubMed]
  38. Catalan, V.; Gomez-Ambrosi, J.; Rodriguez, A.; Ramirez, B.; Silva, C.; Rotellar, F.; Gil, M.J.; Cienfuegos, J.A.; Salvador, J.; Fruhbeck, G. Increased adipose tissue expression of lipocalin-2 in obesity is related to inflammation and matrix metalloproteinase-2 and metalloproteinase-9 activities in humans. J. Mol. Med. 2009, 87, 803–813. [Google Scholar] [CrossRef] [PubMed]
  39. Sekimoto, R.; Kishida, K.; Nakatsuji, H.; Nakagawa, T.; Funahashi, T.; Shimomura, I. High circulating levels of S100A8/A9 complex (calprotectin) in male Japanese with abdominal adiposity and dysregulated expression of S100A8 and S100A9 in adipose tissues of obese mice. Biochem. Biophys. Res. Commun. 2012, 419, 782–789. [Google Scholar] [CrossRef] [PubMed]
  40. Yamaoka, M.; Maeda, N.; Nakamura, S.; Mori, T.; Inoue, K.; Matsuda, K.; Sekimoto, R.; Kashine, S.; Nakagawa, Y.; Tsushima, Y.; et al. Gene expression levels of S100 protein family in blood cells are associated with insulin resistance and inflammation (peripheral blood S100 mRNAs and metabolic syndrome). Biochem. Biophys. Res. Commun. 2013, 433, 450–455. [Google Scholar] [CrossRef] [PubMed]
  41. Sekimoto, R.; Fukuda, S.; Maeda, N.; Tsushima, Y.; Matsuda, K.; Mori, T.; Nakatsuji, H.; Nishizawa, H.; Kishida, K.; Kikuta, J.; et al. Visualized macrophage dynamics and significance of S100A8 in obese fat. Proc. Natl. Acad. Sci. USA 2015, 112, E2058–E2066. [Google Scholar] [CrossRef] [PubMed]
  42. Gletsu-Miller, N.; Hansen, J.M.; Jones, D.P.; Go, Y.M.; Torres, W.E.; Ziegler, T.R.; Lin, E. Loss of total and visceral adipose tissue mass predicts decreases in oxidative stress after weight-loss surgery. Obesity 2009, 17, 439–446. [Google Scholar] [CrossRef] [PubMed]
  43. Wainright, K.S.; Fleming, N.J.; Rowles, J.L.; Welly, R.J.; Zidon, T.M.; Park, Y.M.; Gaines, T.L.; Scroggins, R.J.; Anderson-Baucum, E.K.; Hasty, A.H.; et al. Retention of sedentary obese visceral white adipose tissue phenotype with intermittent physical activity despite reduced adiposity. Am. J. Physiol. Regul. Integr. Comp. Physiol. 2015, 309, R594–R602. [Google Scholar] [CrossRef] [PubMed]
  44. Sodhi, K.; Puri, N.; Kim, D.H.; Hinds, T.D.; Stechschulte, L.A.; Favero, G.; Rodella, L.; Shapiro, J.I.; Jude, D.; Abraham, N.G. PPARδ binding to heme oxygenase 1 promoter prevents angiotensin II-induced adipocyte dysfunction in Goldblatt hypertensive rats. Int. J. Obes. 2014, 38, 456–465. [Google Scholar] [CrossRef] [PubMed]
  45. Lee, Y.S.; Kim, A.Y.; Choi, J.W.; Kim, M.; Yasue, S.; Son, H.J.; Masuzaki, H.; Park, K.S.; Kim, J.B. Dysregulation of adipose glutathione peroxidase 3 in obesity contributes to local and systemic oxidative stress. Mol. Endocrinol. 2008, 22, 2176–2189. [Google Scholar] [CrossRef] [PubMed]
  46. DeFuria, J.; Bennett, G.; Strissel, K.J.; Perfield, J.W., 2nd; Milbury, P.E.; Greenberg, A.S.; Obin, M.S. Dietary blueberry attenuates whole-body insulin resistance in high fat-fed mice by reducing adipocyte death and its inflammatory sequelae. J. Nutr. 2009, 139, 1510–1516. [Google Scholar] [CrossRef] [PubMed]
  47. Curtis, J.M.; Grimsrud, P.A.; Wright, W.S.; Xu, X.; Foncea, R.E.; Graham, D.W.; Brestoff, J.R.; Wiczer, B.M.; Ilkayeva, O.; Cianflone, K.; et al. Downregulation of adipose glutathione S-transferase A4 leads to increased protein carbonylation, oxidative stress, and mitochondrial dysfunction. Diabetes 2010, 59, 1132–1142. [Google Scholar] [CrossRef] [PubMed]
  48. Lass, A.; Zimmermann, R.; Haemmerle, G.; Riederer, M.; Schoiswohl, G.; Schweiger, M.; Kienesberger, P.; Strauss, J.G.; Gorkiewicz, G.; Zechner, R. Adipose triglyceride lipase-mediated lipolysis of cellular fat stores is activated by CGI-58 and defective in Chanarin-Dorfman Syndrome. Cell Metab. 2006, 3, 309–319. [Google Scholar] [CrossRef] [PubMed]
  49. Yamaguchi, T.; Omatsu, N.; Morimoto, E.; Nakashima, H.; Ueno, K.; Tanaka, T.; Satouchi, K.; Hirose, F.; Osumi, T. CGI-58 facilitates lipolysis on lipid droplets but is not involved in the vesiculation of lipid droplets caused by hormonal stimulation. J. Lipid Res. 2007, 48, 1078–1089. [Google Scholar] [CrossRef] [PubMed]
  50. Miao, H.; Ou, J.; Ma, Y.; Guo, F.; Yang, Z.; Wiggins, M.; Liu, C.; Song, W.; Han, X.; Wang, M.; et al. Macrophage CGI-58 deficiency activates ROS-inflammasome pathway to promote insulin resistance in mice. Cell Rep. 2014, 7, 223–235. [Google Scholar] [CrossRef] [PubMed]
  51. Brown, J.M.; Betters, J.L.; Lord, C.; Ma, Y.; Han, X.; Yang, K.; Alger, H.M.; Melchior, J.; Sawyer, J.; Shah, R.; et al. CGI-58 knockdown in mice causes hepatic steatosis but prevents diet-induced obesity and glucose intolerance. J. Lipid Res. 2010, 51, 3306–3315. [Google Scholar] [CrossRef] [PubMed]
  52. Erikson, D.W.; Burghardt, R.C.; Bayless, K.J.; Johnson, G.A. Secreted phosphoprotein 1 (SPP1, osteopontin) binds to integrin alphavbeta6 on porcine trophectoderm cells and integrin alphavbeta3 on uterine luminal epithelial cells, and promotes trophectoderm cell adhesion and migration. Biol. Reprod. 2009, 81, 814–825. [Google Scholar] [CrossRef] [PubMed]
  53. Zhong, X.J.; Shen, X.D.; Wen, J.B.; Kong, Y.; Chu, J.J.; Yan, G.Q.; Li, T.; Liu, D.; Wu, M.Q.; Zeng, G.H.; et al. Osteopontin-induced brown adipogenesis from white preadipocytes through a PI3K-AKT dependent signaling. Biochem. Biophys. Res. Commun. 2015, 459, 553–559. [Google Scholar] [CrossRef] [PubMed]
  54. Luedtke, C.C.; McKee, M.D.; Cyr, D.G.; Gregory, M.; Kaartinen, M.T.; Mui, J.; Hermo, L. Osteopontin expression and regulation in the testis, efferent ducts, and epididymis of rats during postnatal development through to adulthood. Biol. Reprod. 2002, 66, 1437–1448. [Google Scholar] [CrossRef] [PubMed]
  55. Bertin, F.R.; Lemarié, C.A.; Robins, R.S.; Blostein, M.D. Growth arrest-specific 6 regulates thrombin-induced expression of vascular cell adhesion molecule-1 through forkhead box O1 in endothelial cells. J. Thromb. Haemost. 2015, 13, 2260–2272. [Google Scholar] [CrossRef] [PubMed]
  56. Ammoun, S.; Provenzano, L.; Zhou, L.; Barczyk, M.; Evans, K.; Hilton, D.A.; Hafizi, S.; Hanemann, C.O. Axl/Gas6/NFκB signalling in schwannoma pathological proliferation, adhesion and survival. Oncogene 2014, 33, 336–346. [Google Scholar] [CrossRef] [PubMed]
  57. Hsieh, C.H.; Chung, R.H.; Lee, W.J.; Lin, M.W.; Chuang, L.M.; Quertermous, T.; Assimes, T.; Hung, Y.J.; Yu, Y.W. Effect of common genetic variants of growth arrest-specific 6 gene on insulin resistance, obesity and type 2 diabetes in an Asian population. PLoS ONE 2015, 10, e0135681. [Google Scholar] [CrossRef] [PubMed]
  58. Zhao, R.; Li, Y.; Dai, W. Serum sex hormone and growth arrest-specific protein 6 levels in male patients with coronary heart disease. Asian J. Androl. 2016, 18, 644–649. [Google Scholar] [PubMed]
  59. Son, B.K.; Akishita, M.; Iijima, K.; Ogawa, S.; Maemura, K.; Yu, J.; Takeyama, K.; Kato, S.; Eto, M.; Ouchi, Y. Androgen receptor-dependent transactivation of growth arrest-specific gene 6 mediates inhibitory effects of testosterone on vascular calcification. J. Biol. Chem. 2010, 285, 7537–7544. [Google Scholar] [CrossRef] [PubMed]
  60. Qiao, M.; Wu, H.Y.; Guo, L.; Mei, S.Q.; Zhang, P.P.; Li, F.E.; Zheng, R.; Deng, C.Y. Imprinting analysis of porcine DIO3 gene in two fetal stages and association analysis with carcass and meat quality traits. Mol. Biol. Rep. 2012, 39, 2329–2335. [Google Scholar] [CrossRef] [PubMed]
  61. Beale, E.G.; Hammer, R.E.; Antoine, B.; Forest, C. Disregulated glyceroneogenesis: PCK1 as a candidate diabetes and obesity gene. Trends Endocrinol. Metab. 2004, 15, 129–135. [Google Scholar] [CrossRef] [PubMed]
  62. Niang, F.; Benelli, C.; Ribière, C.; Collinet, M.; Mehebik-Mojaat, N.; Penot, G.; Forest, C.; Jaubert, A.M. Leptin induces nitric oxide-mediated inhibition of lipolysis and glyceroneogenesis in rat white adipose tissue. J. Nutr. 2011, 141, 4–9. [Google Scholar] [CrossRef] [PubMed]
  63. Wang, K.; Singh, D.; Zeng, Z.; Coleman, S.J.; Huang, Y.; Savich, G.L.; He, X.; Mieczkowski, P.; Grimm, S.A.; Perou, C.M.; et al. Mapsplice: Accurate mapping of RNA-seq reads for splice junction discovery. Nucleic Acids Res. 2010, 38, e178. [Google Scholar] [CrossRef] [PubMed]
  64. Miecznikowski, J.C.; Liu, S.; Ren, X. Statistical modeling for differential transcriptome analysis using RNA-seq technology. J. Solid Tumors 2012, 2, 33–44. [Google Scholar] [CrossRef]
  65. Dillies, M.A.; Rau, A.; Aubert, J.; Hennequet-Antier, C.; Jeanmougin, M.; Servant, N.; Keime, C.; Marot, G.; Castel, D.; Estelle, J.; et al. A comprehensive evaluation of normalization methods for illumina high-throughput RNA sequencing data analysis. Brief. Bioinform. 2013, 14, 671–683. [Google Scholar] [CrossRef] [PubMed]
  66. Wang, L.; Feng, Z.; Wang, X.; Wang, X.; Zhang, X. Degseq: An R package for identifying differentially expressed genes from RNA-seq data. Bioinformatics 2010, 26, 136–138. [Google Scholar] [CrossRef] [PubMed]
  67. Ernst, J.; Bar-Joseph, Z. Stem: A tool for the analysis of short time series gene expression data. BMC Bioinform. 2006, 7, 191. [Google Scholar] [CrossRef] [PubMed]
  68. Livak, K.J.; Schmittgen, T.D. Analysis of relative gene expression data using real-time quantitative PCR and the 2−∆∆Ct method. Methods 2001, 25, 402–408. [Google Scholar] [CrossRef] [PubMed]
Figure 1. Effects of castration and testosterone treatment on visceral adipose tissue (VAT) fat, serum testosterone and leptin levels: (A) VAT fat percentage of body weight; (B) serum testosterone levels; and (C) leptin levels. IM: intact male pigs fed a high-fat and high-cholesterol (HFC) diet; CM: castrated male pigs fed a HFC diet; CMT: castrated pigs with testosterone replacement fed a HFC diet. Data were represented as means ± SEMs, n = 4 per group. ** p < 0.01.
Ijms 17 02125 g001
Figure 2. Gene expression analysis in VAT of IM, CM, and CMT pigs: (A) the numbers of genes expressed in IM, CM, and CMT groups; and (B) the numbers of DEGs between groups. IM: intact male pigs fed a HFC diet; CM: castrated male pigs fed a HFC diet; CMT: castrated pigs with testosterone replacement fed a HFC diet.
Ijms 17 02125 g002
Figure 3. Gene ontology (GO) analysis of differentially expressed genes (DEGs) between groups: (A) GO terms associated with the DEGs between CM versus IM; and (B) GO terms associated with the DEGs between CMT versus CM. IM: intact male pigs fed a HFC diet; CM: castrated male pigs fed a HFC diet; CMT: castrated pigs with testosterone replacement fed a HFC diet.
Ijms 17 02125 g003
Figure 4. Gene expression tendencies and gene ontology (GO) analysis: (A) series-cluster analysis for gene expression profiles of DEGs; (B) gene expression tendencies of profile 5 and 2. Profile 5 included 288 DEGs that increased in CM pigs but decreased in CMT pigs compared with IM pigs, while profile 2 included 207 DEGs that decreased in CM pigs but increased in CMT pigs compared with IM pigs; and (C) Enriched GO terms in profiles 5 and 2. IM: intact male pigs fed a HFC diet; CM: castrated male pigs fed a HFC diet; CMT: castrated pigs with testosterone replacement fed a HFC diet.
Ijms 17 02125 g004
Figure 5. DEGs involved in inflammatory response, oxidation-reduction process and lipid metabolic process: (A) heat map for genes involved in inflammatory response; (B) heat map for genes involved in oxidation-reduction process; (C) heat map for genes involved in lipid metabolic process; and (D) expression levels of six genes (NCF1, S100A9, LEP, LOC100520753 (CD68), EMR1, and LCN2) detected by qRT-PCR that were in agreement with the RNA-Seq results. Data were expressed as means ± SEMs, n = 4 per group. IM: intact male pigs fed a HFC diet; CM: castrated male pigs fed a HFC diet; CMT: castrated pigs with testosterone replacement fed a HFC diet.
Ijms 17 02125 g005
Figure 6. DEGs involved in cell differentiation, cell adhesion and small molecule metabolic process: (A) heat map for genes involved in cell differentiation; (B) heat map for genes involved in cell adhesion; (C) heat map for genes involved in small molecule metabolic process; and (D) expression levels of four genes (ABHD5, DIO3, GSTA4, and PCK1) detected by qRT-PCR that were in agreement with the RNA-Seq results. Data were expressed as means ± SEMs, n = 4 per group. IM: intact male pigs fed a HFC diet; CM: castrated male pigs fed a HFC diet; CMT: castrated pigs with testosterone replacement fed a HFC diet.
Ijms 17 02125 g006
Table 1. Statistics of the sequencing reads mapping to the reference Sscrofa 10.2 genome.
TermsIMCMCMT
All reads26,818,10624,658,79623,870,297
Un mapped reads4,906,5294,295,7524,089,813
Mapped reads21,911,57720,363,04419,780,484
Mapping rate0.8170.8260.829
Unique mapping20,705,54419,206,41418,686,768
Unique mapping rate0.7720.7790.783
Repeat mapping1,206,7441,157,3031,094,352
IM: intact male pigs fed a high-fat and high-cholesterol (HFC) diet; CM: castrated male pigs fed a HFC diet; CMT: castrated pigs with testosterone replacement fed a HFC diet.

