
Dark and Photoinduced Cytotoxic Activity of the New Chlorophyll-a Derivatives with Oligoethylene Glycol Substituents on the Periphery of Their Macrocycles

 ,
,
Abstract
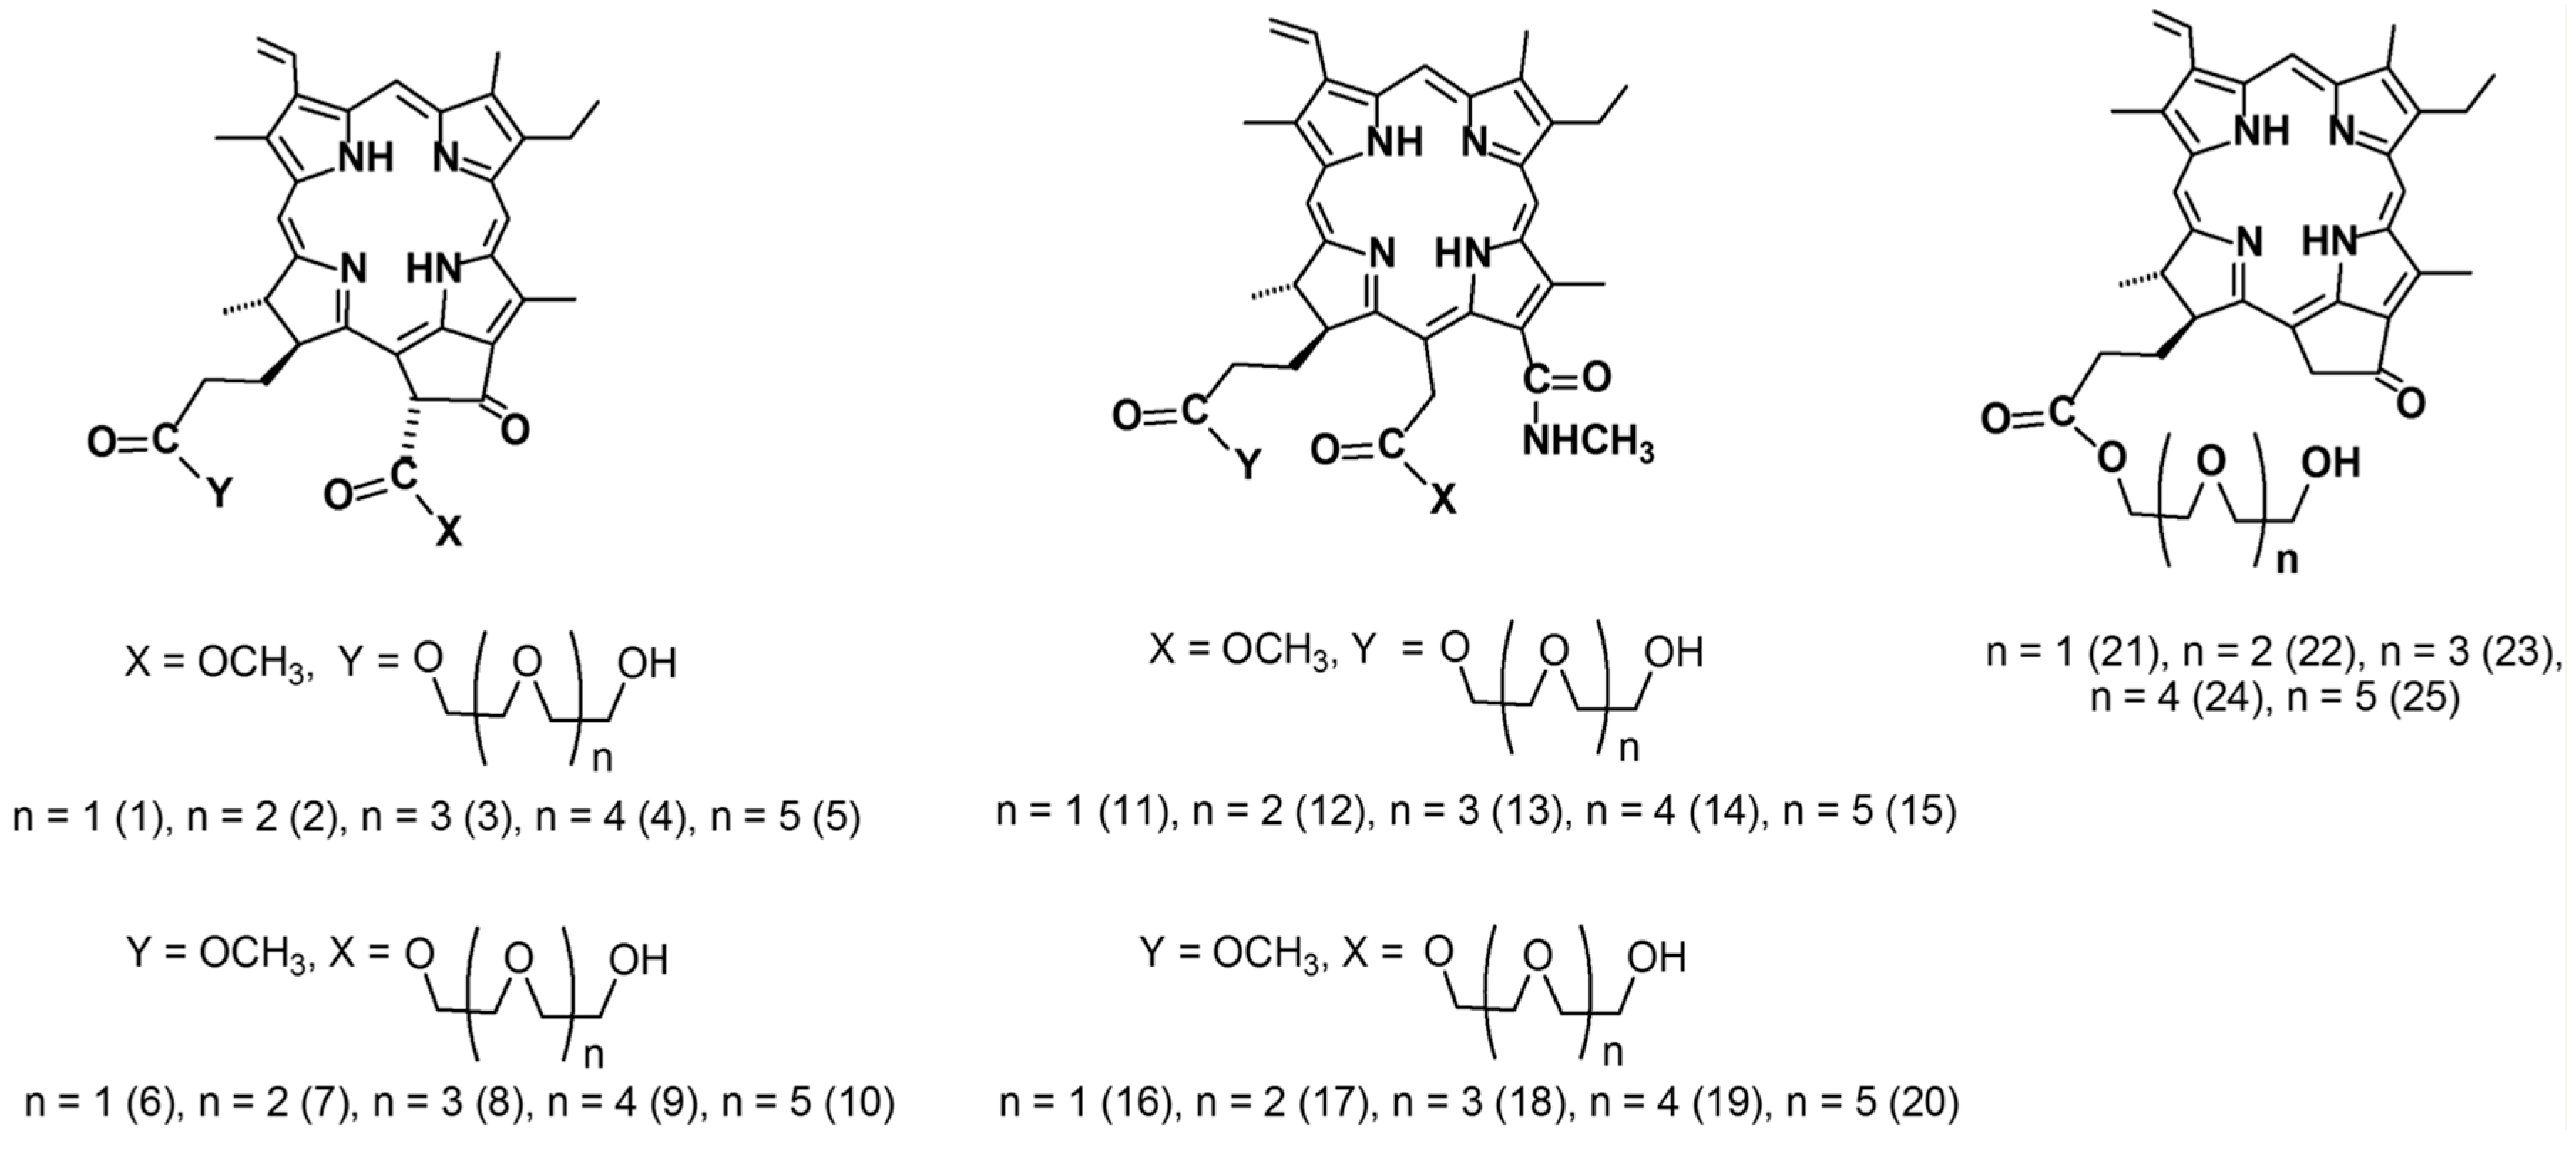
:1. Introduction
2. Results and Discussion
2.1. The Dark Cytotoxic Activity of Chlorophyll-a Derivatives with Oligoethylene Glycol Substituents
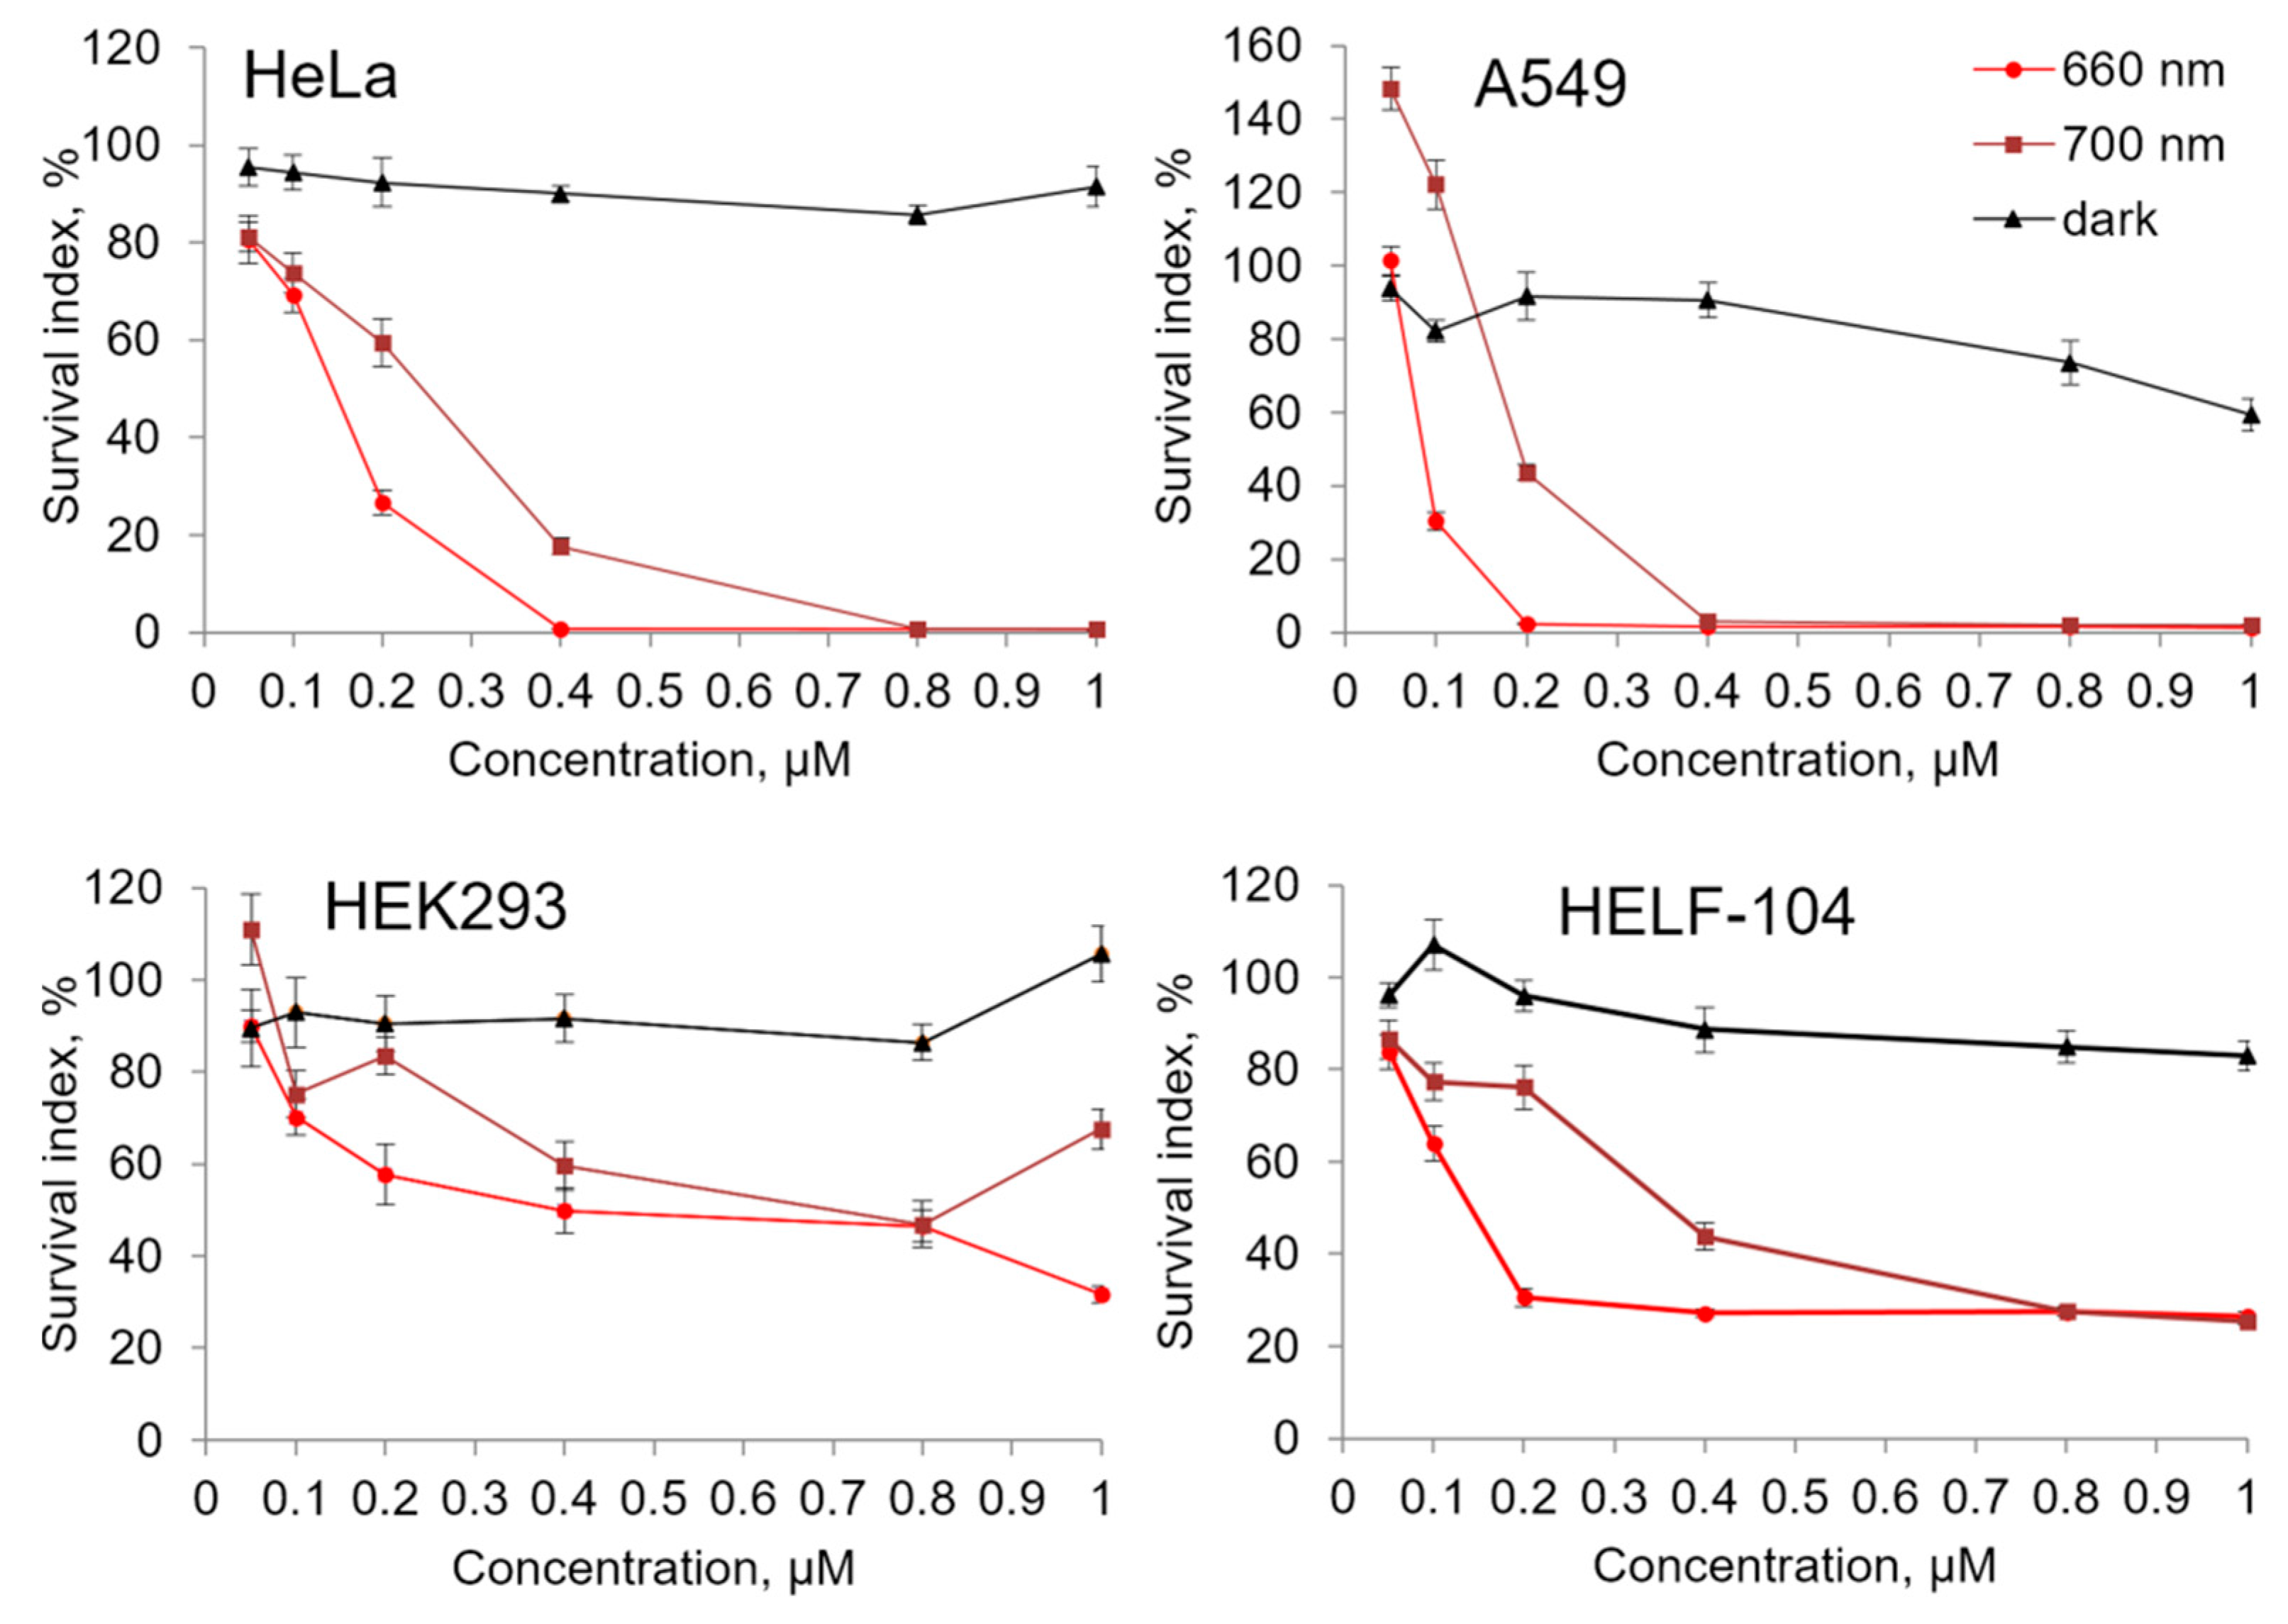
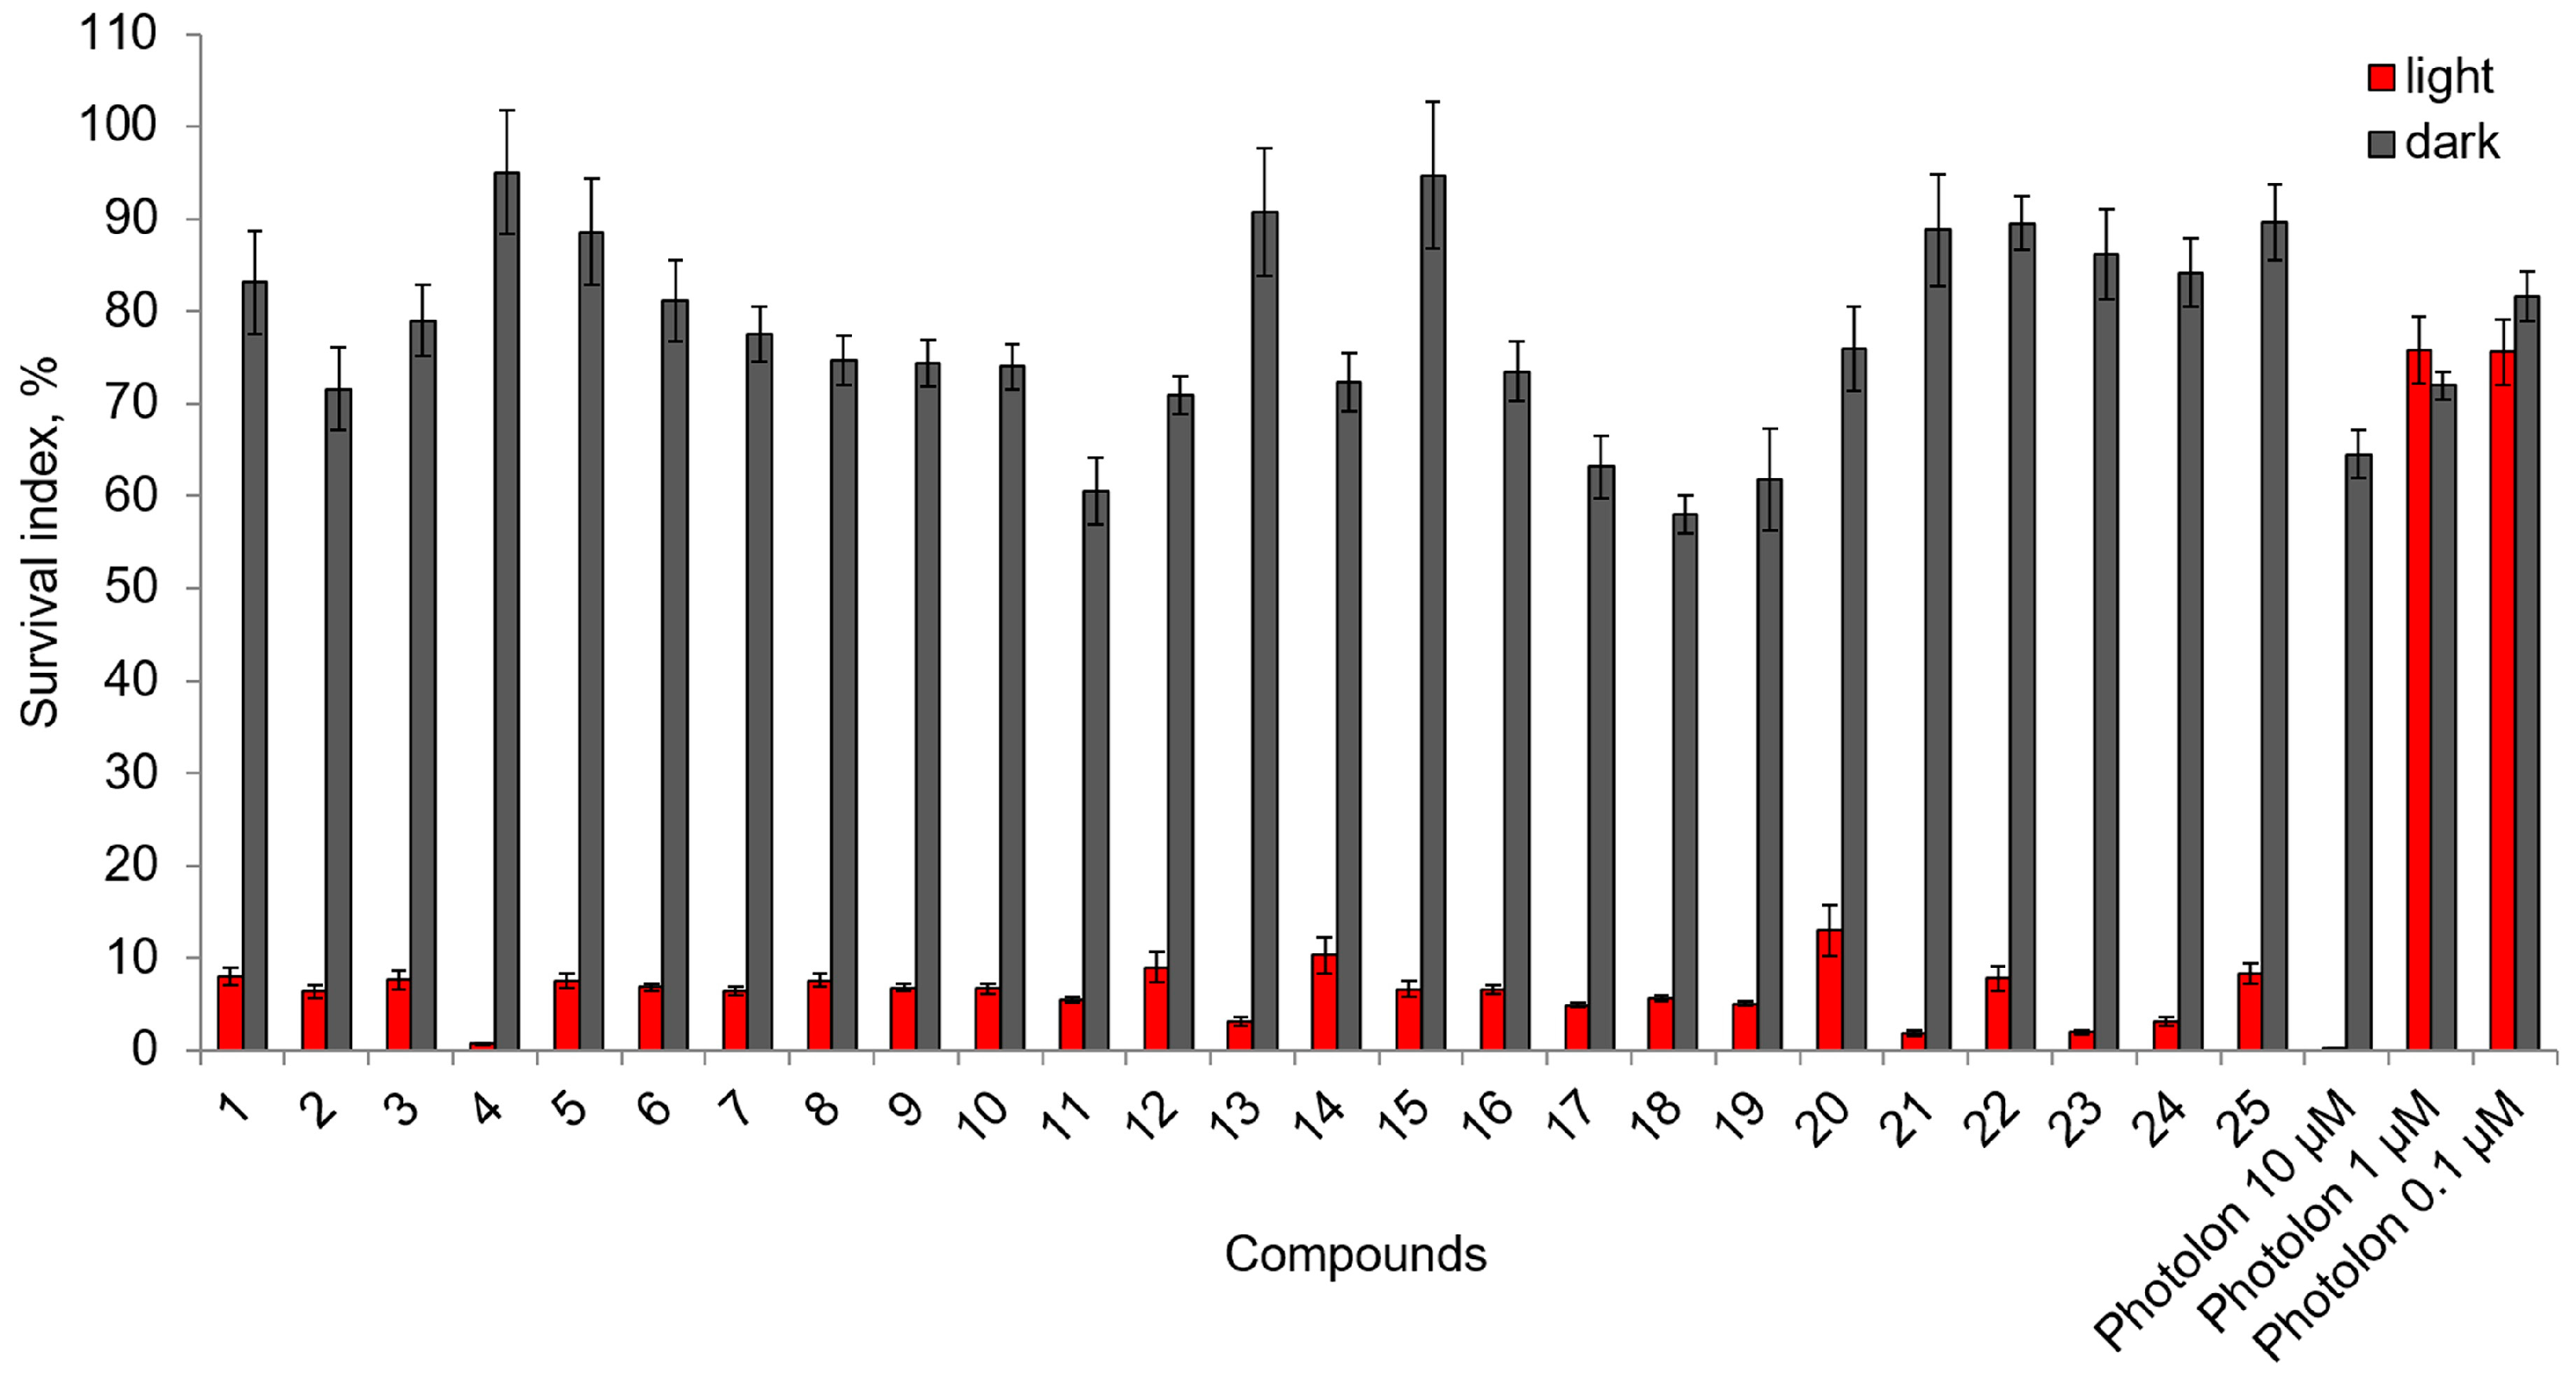
2.2. Photoinduced Cytotoxic and Cytostatic Activity of Chlorophyll-a Derivatives with Oligoethylene Glycol Substituents
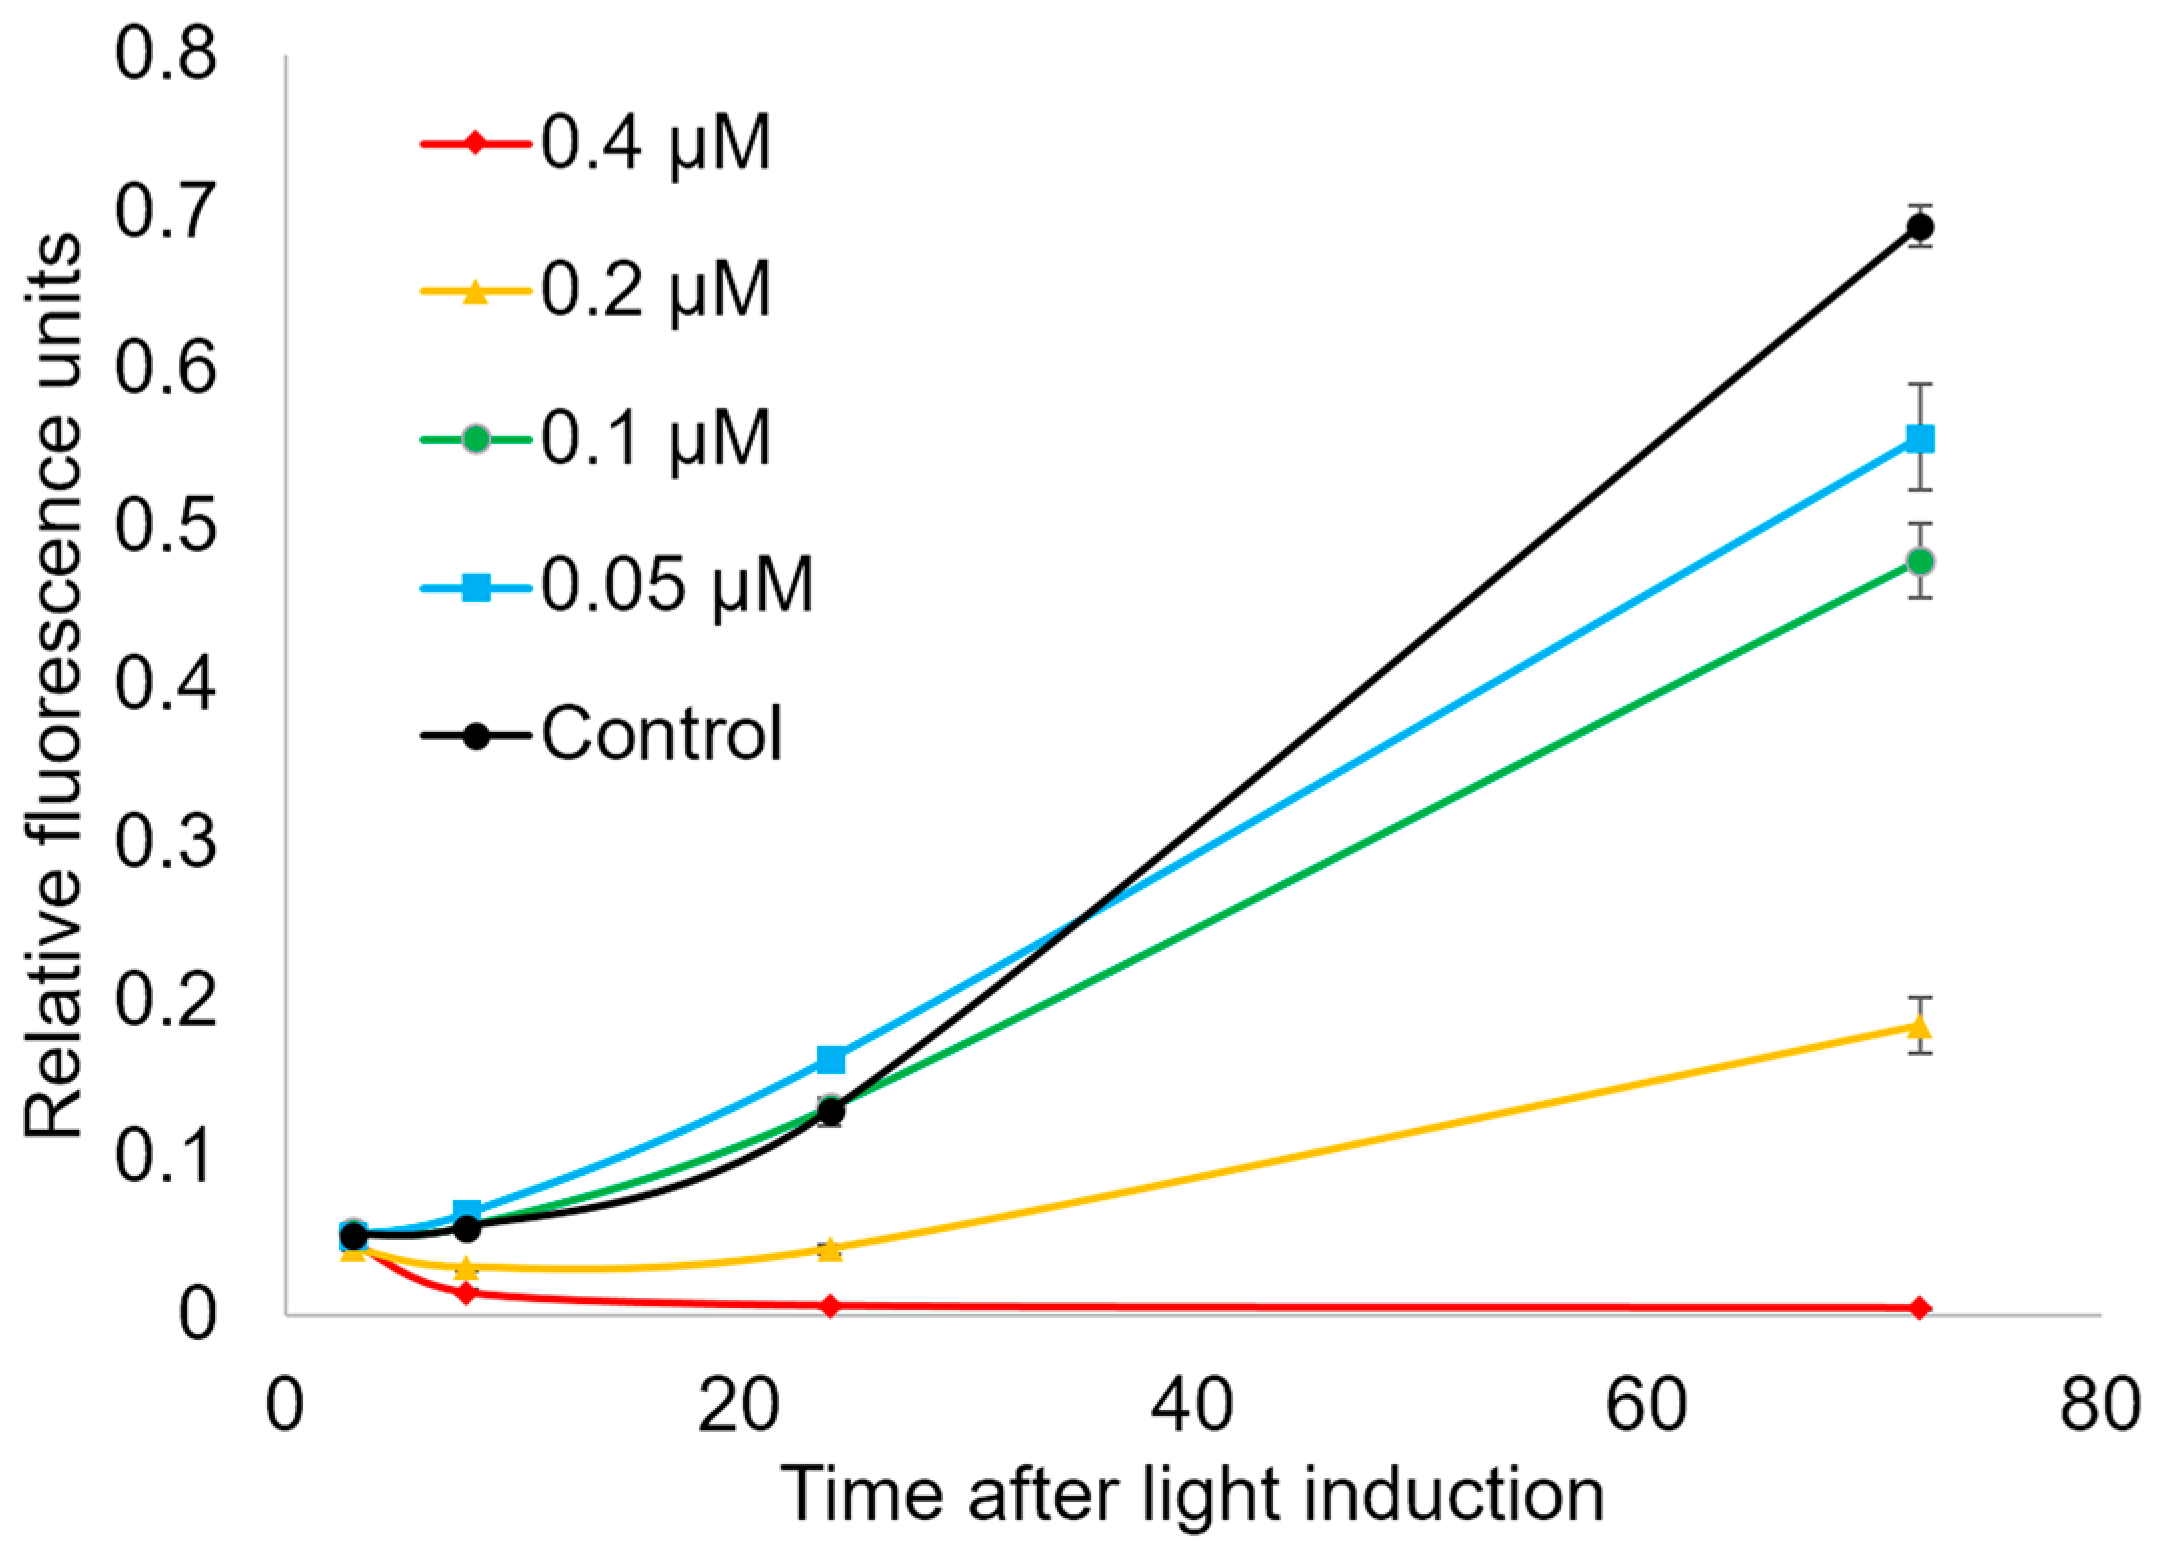
2.3. Cytostatic and Cytotoxic Photoinduced Activity of Compound 21
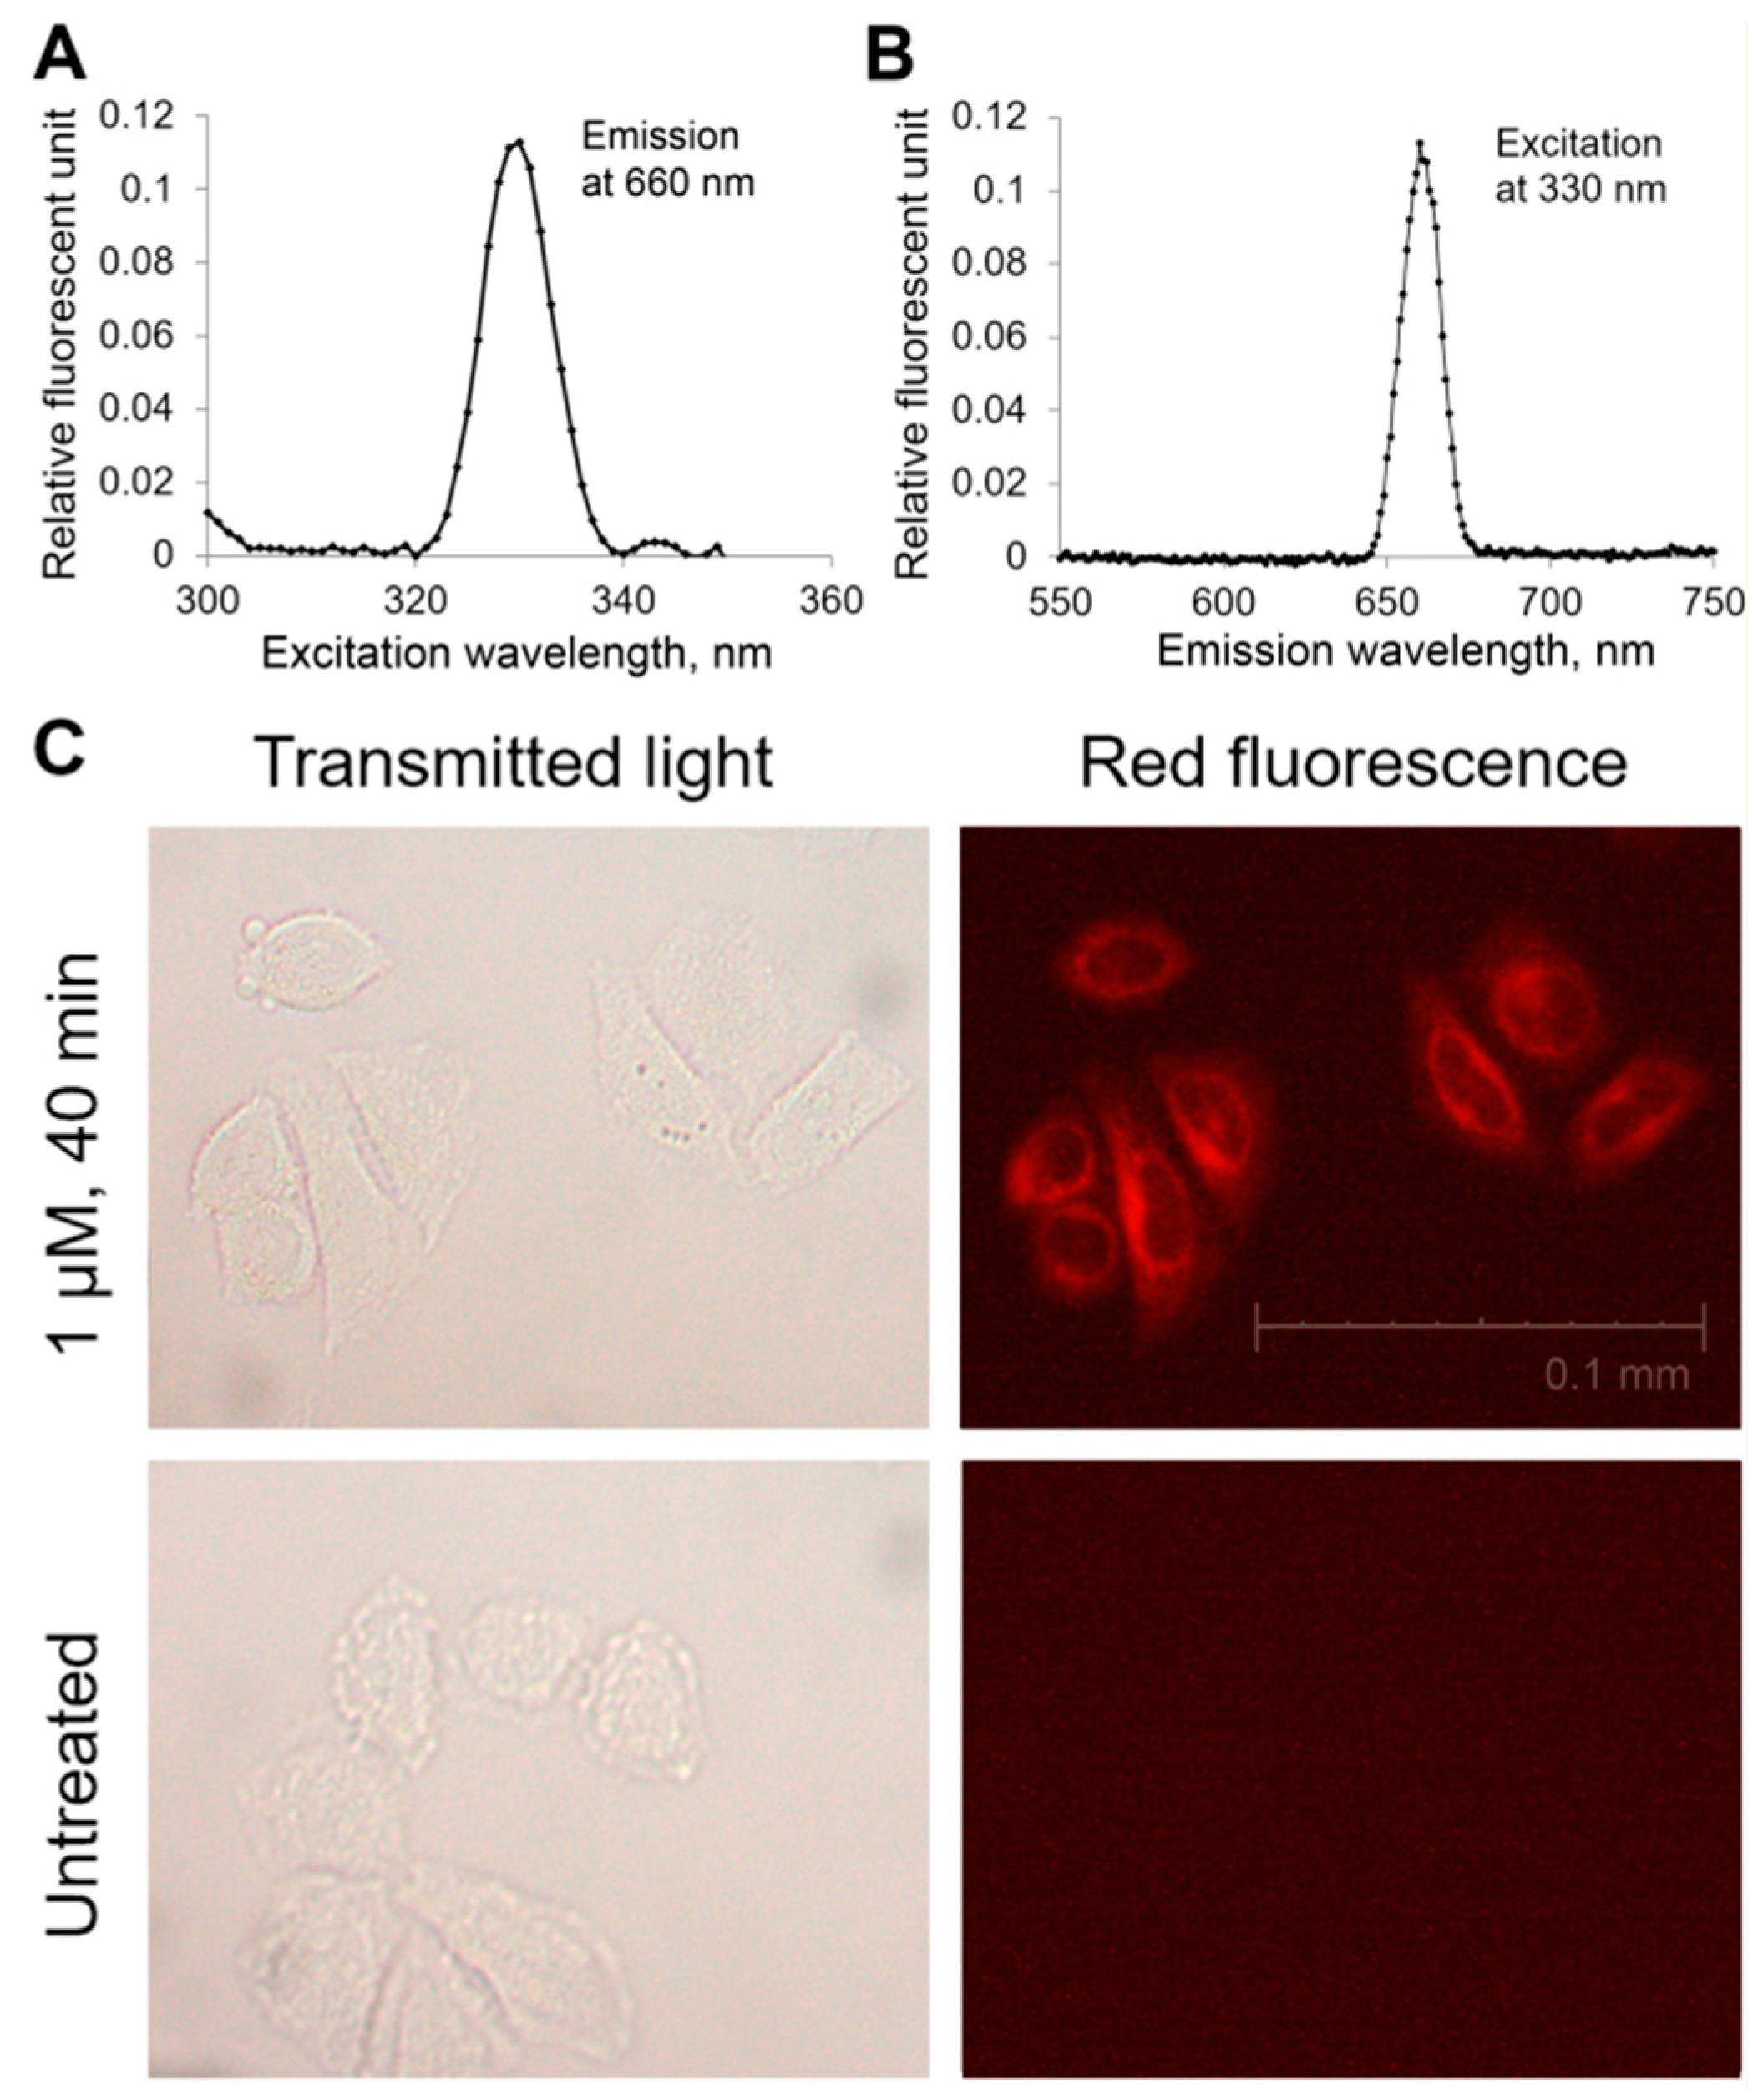
2.4. Ability of Compound 21 to Penetrate the Plasmalemma
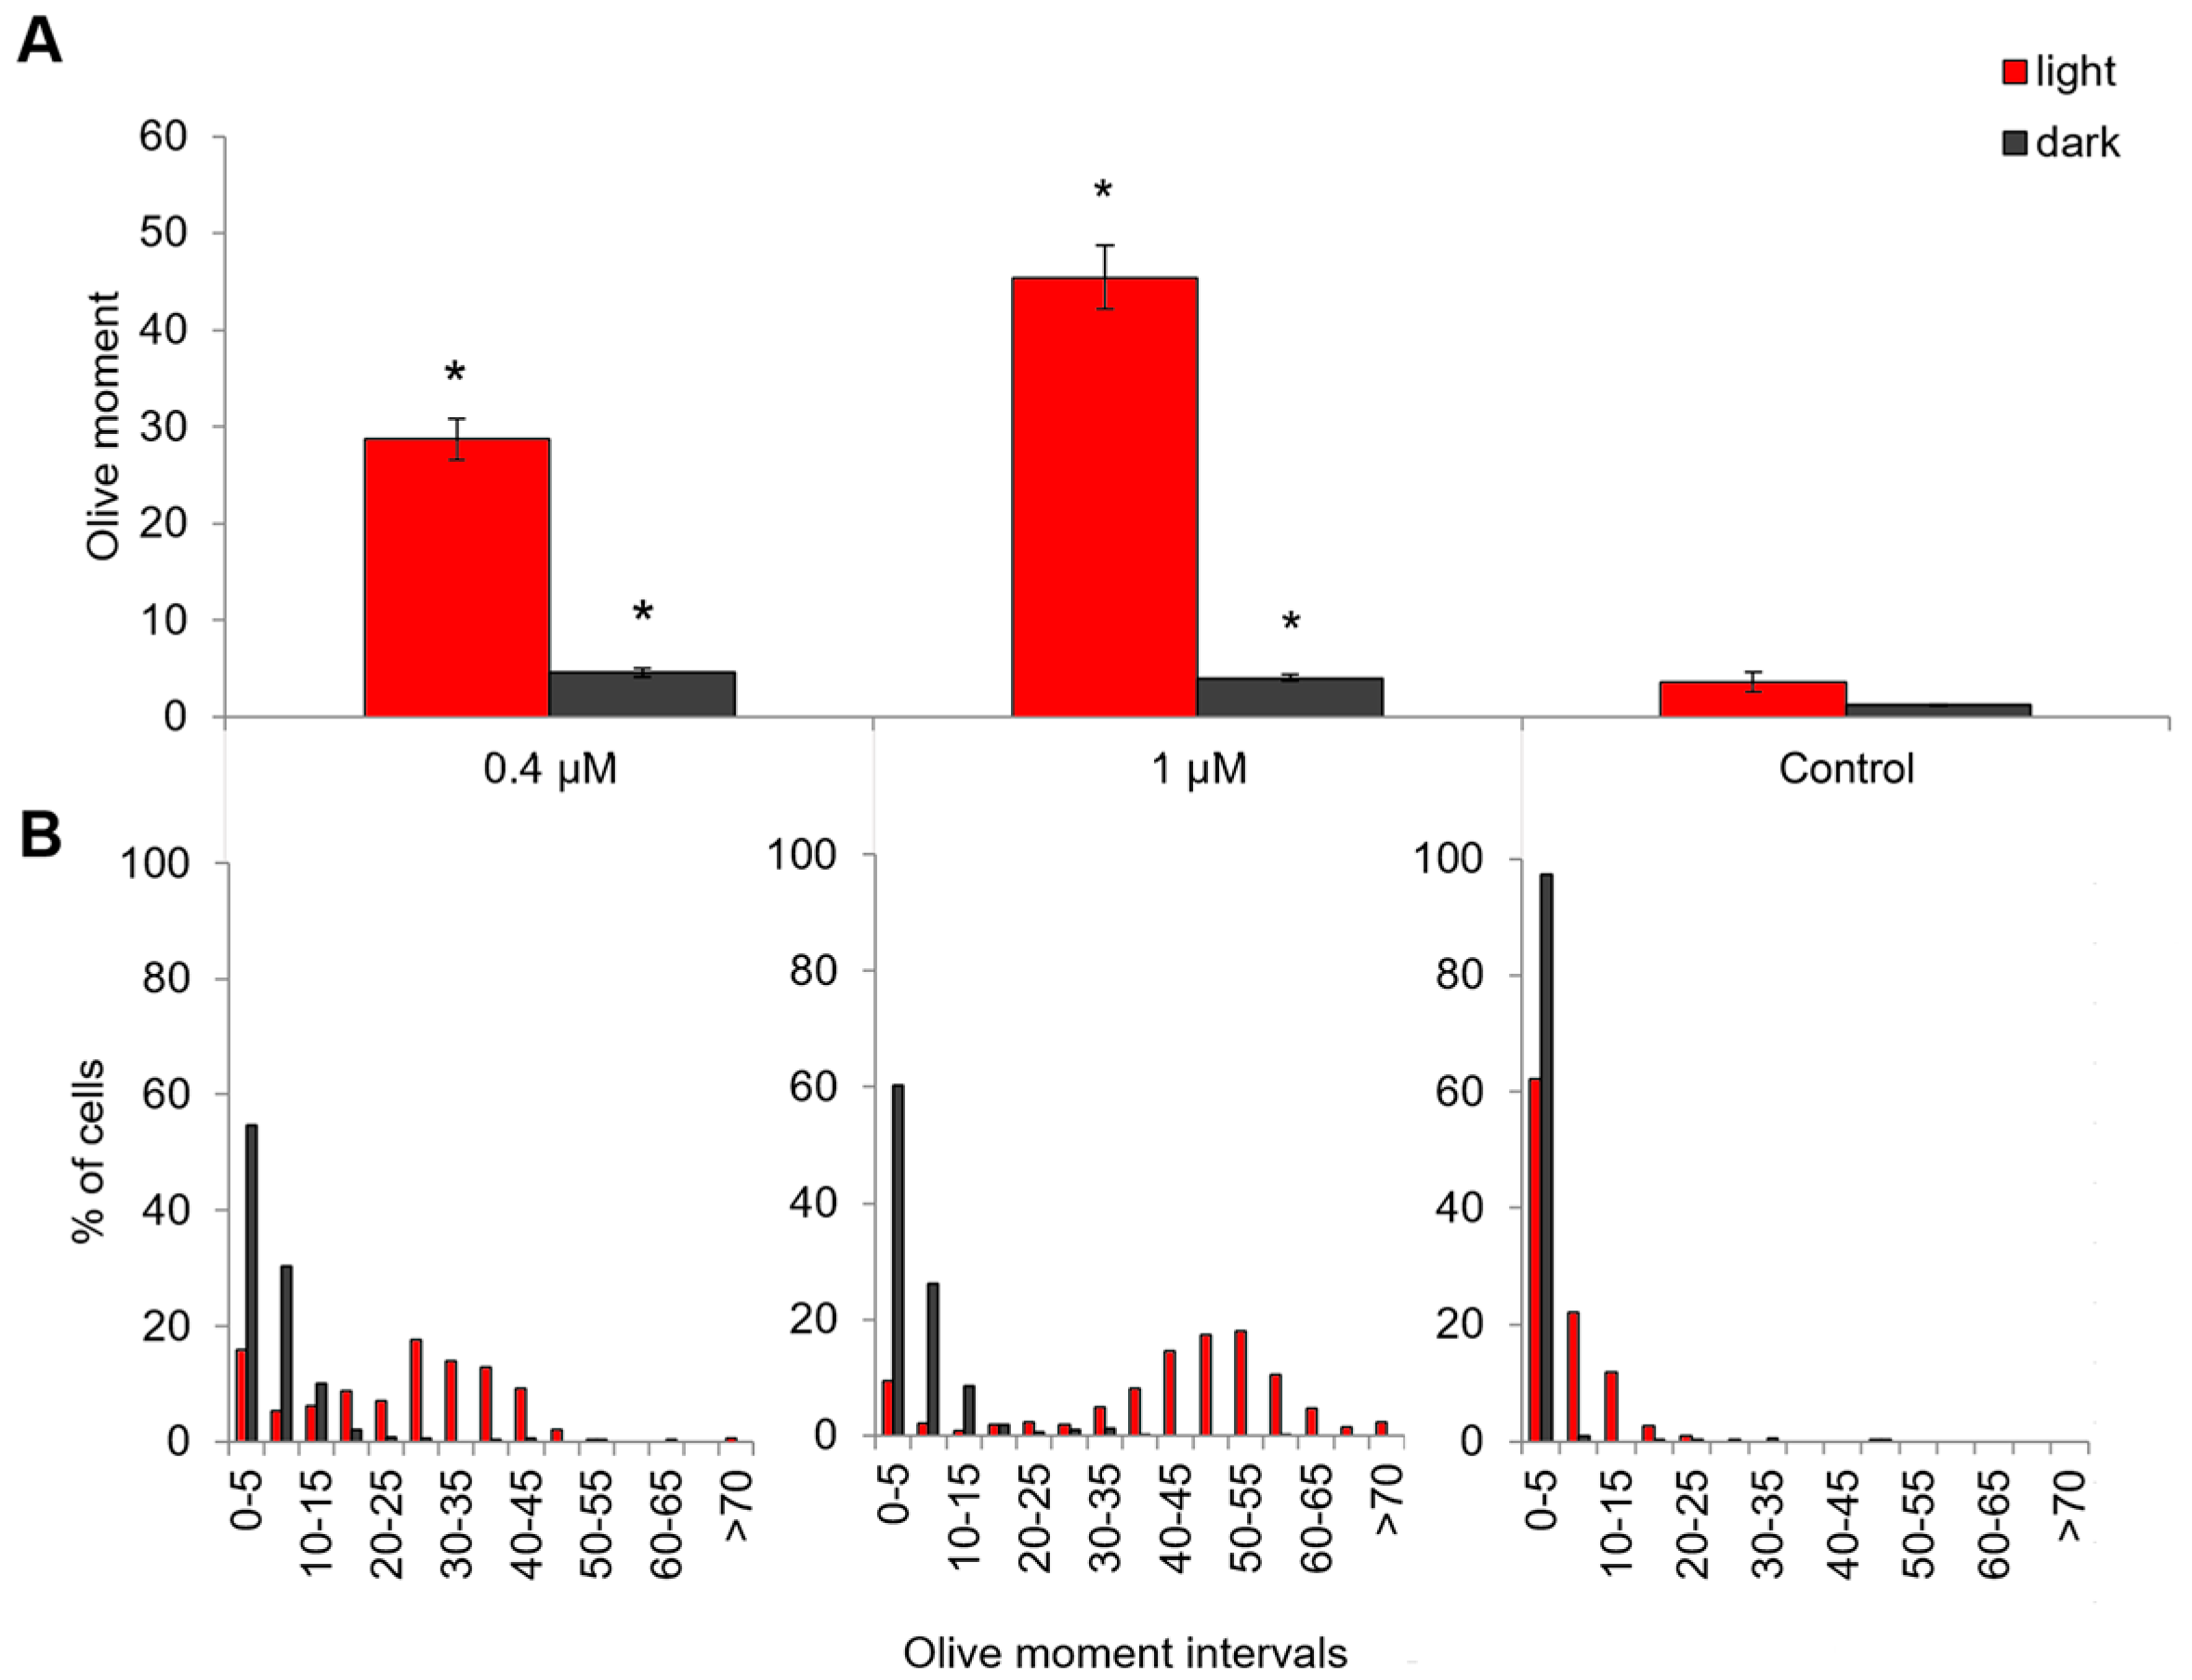
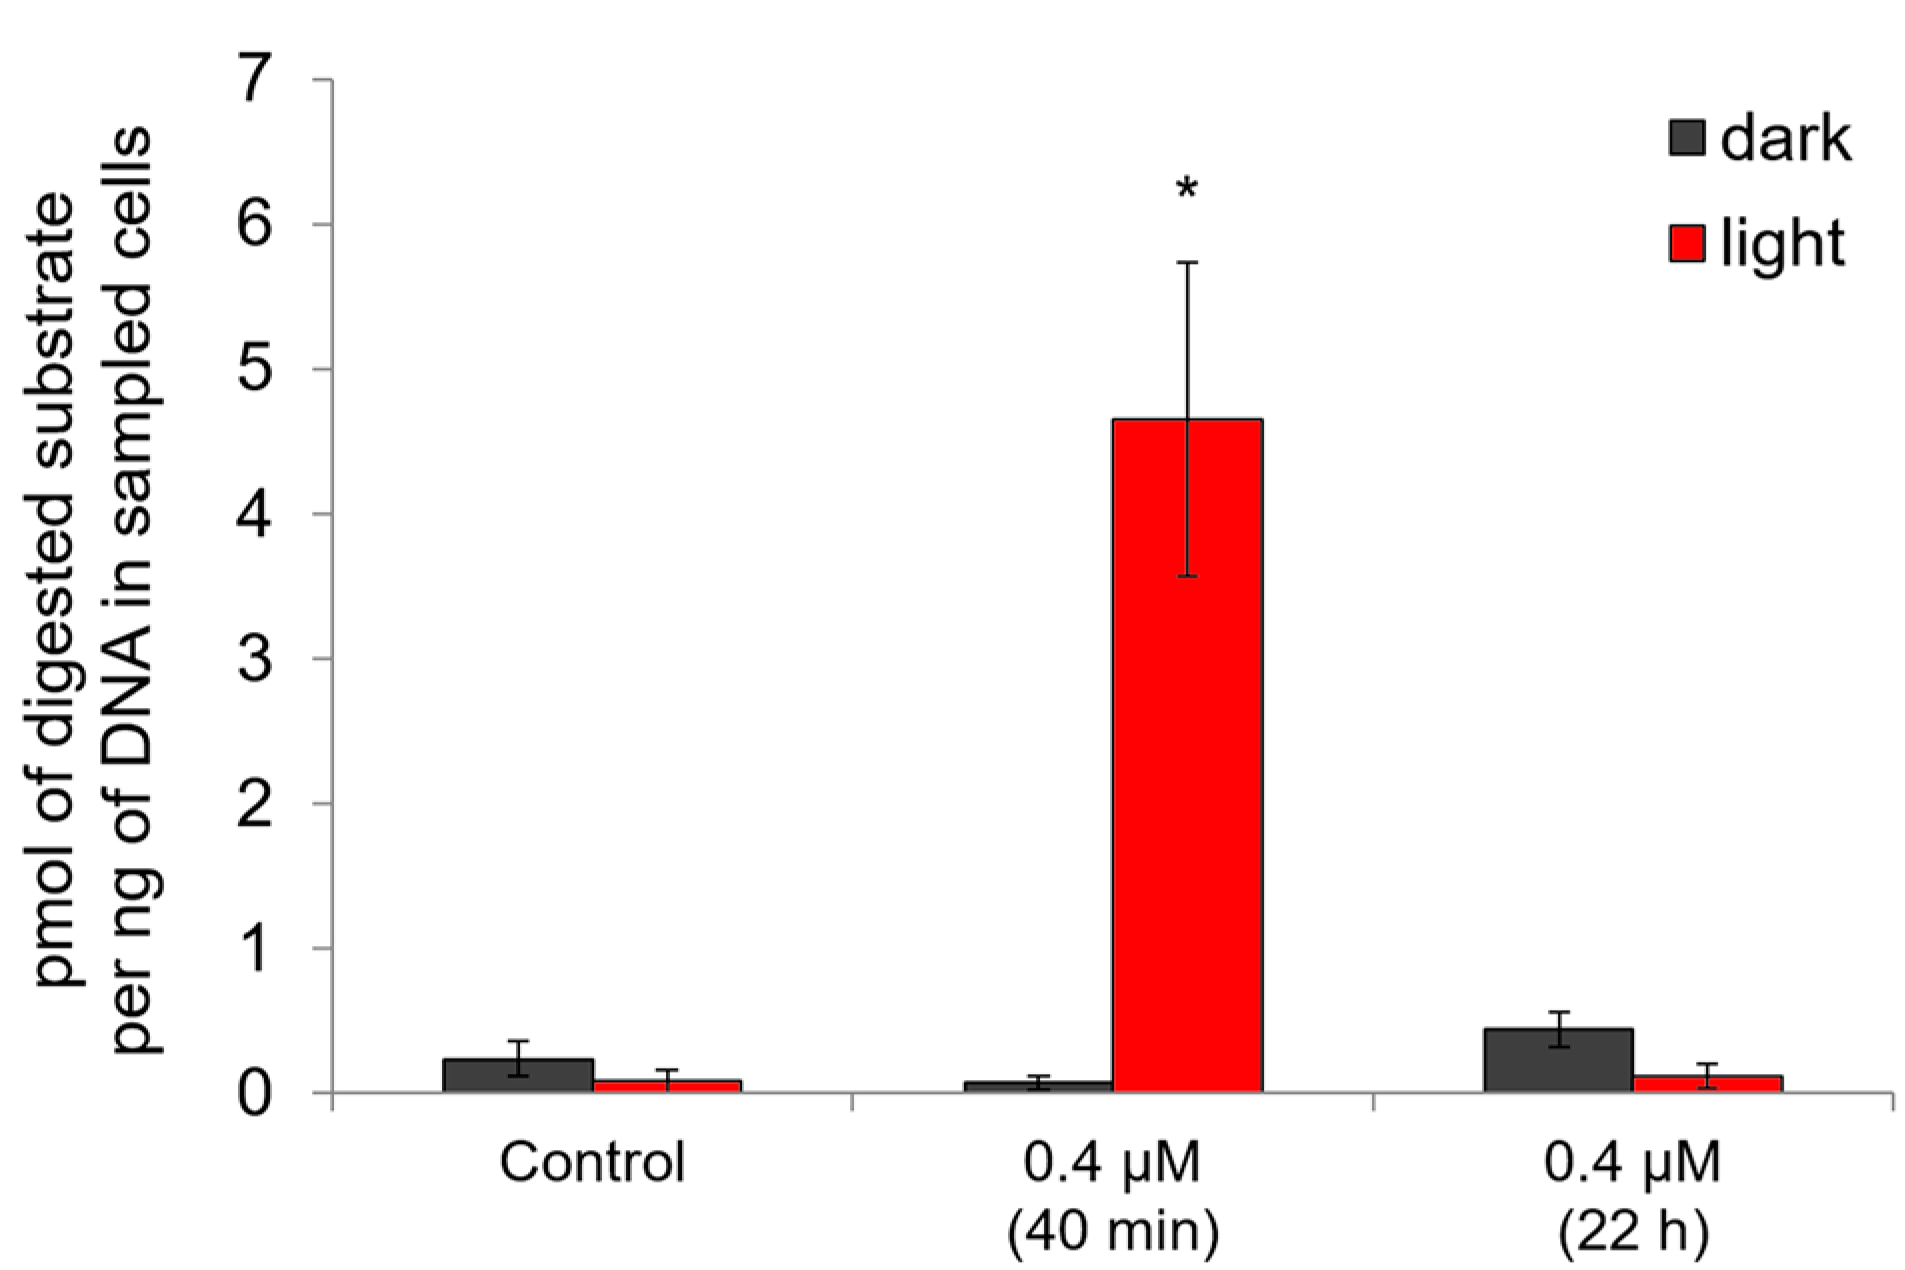
2.5. Genotoxic and Apoptosis-Induced Activity of Compound 21
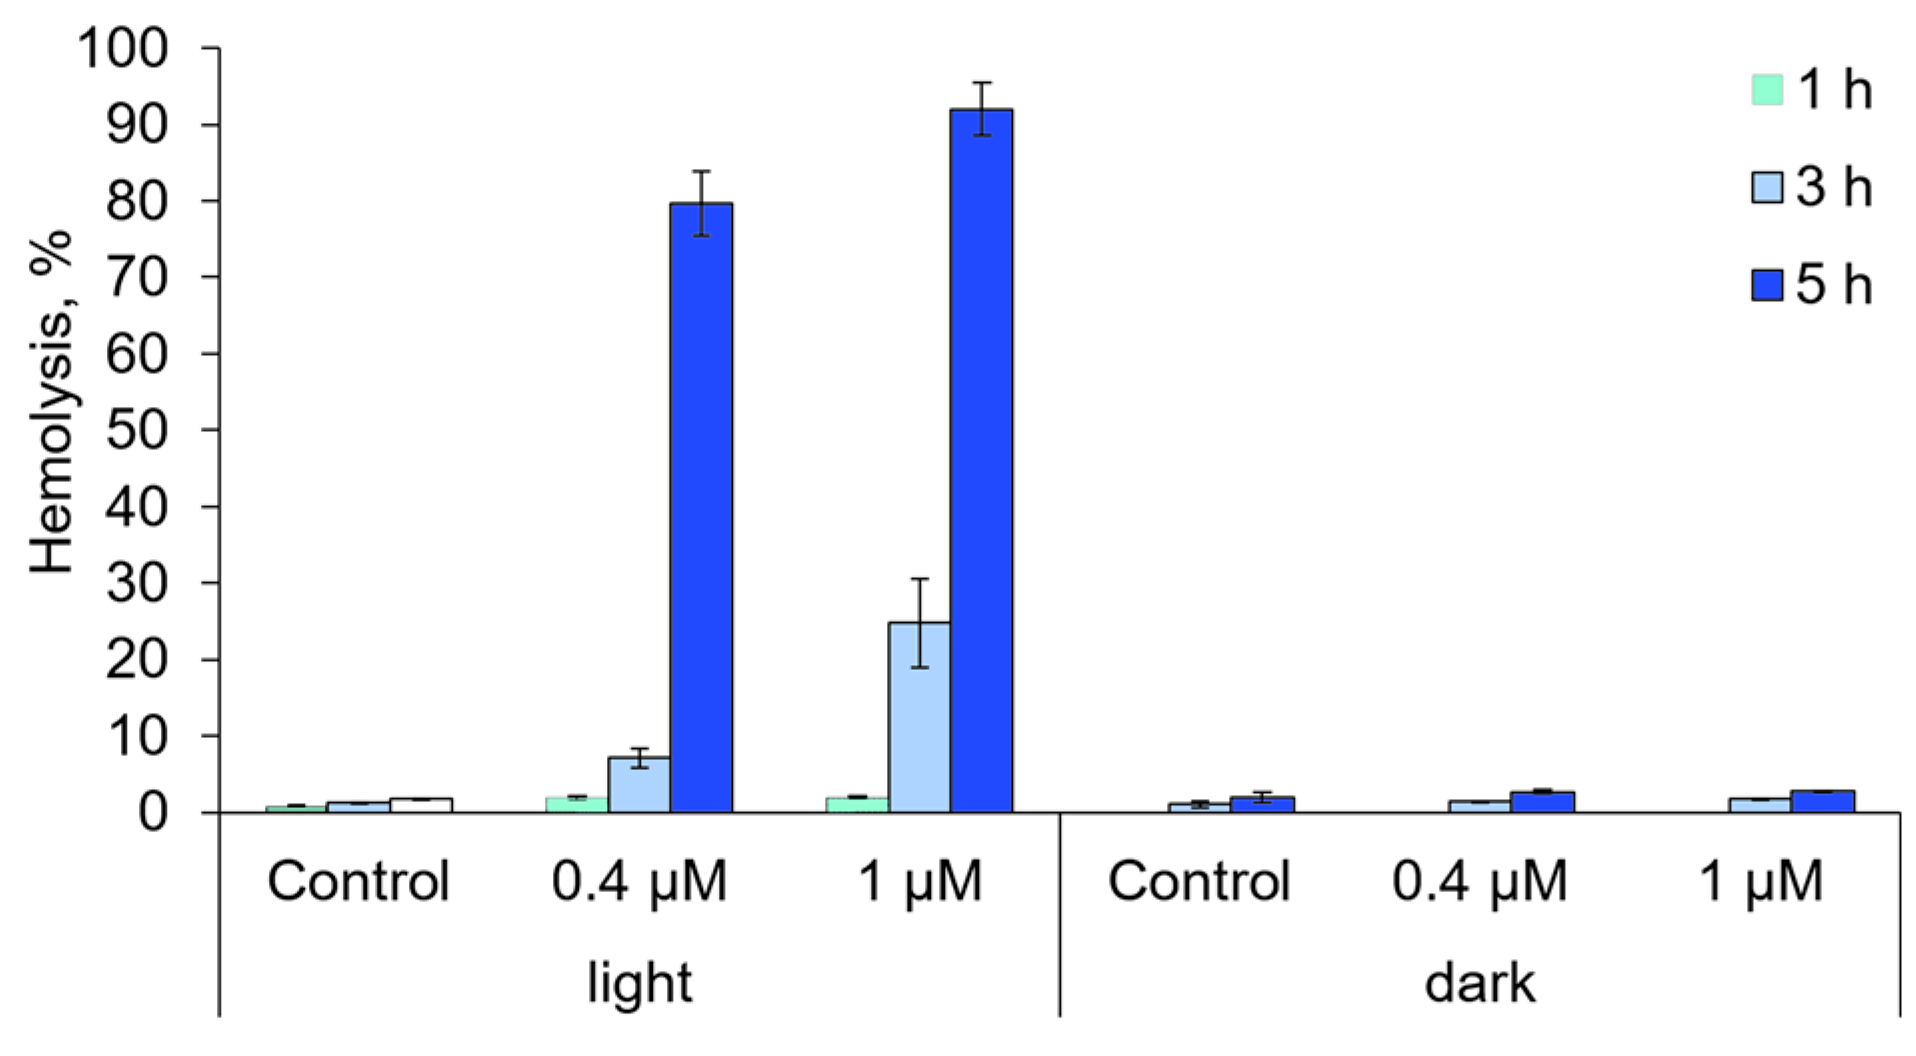
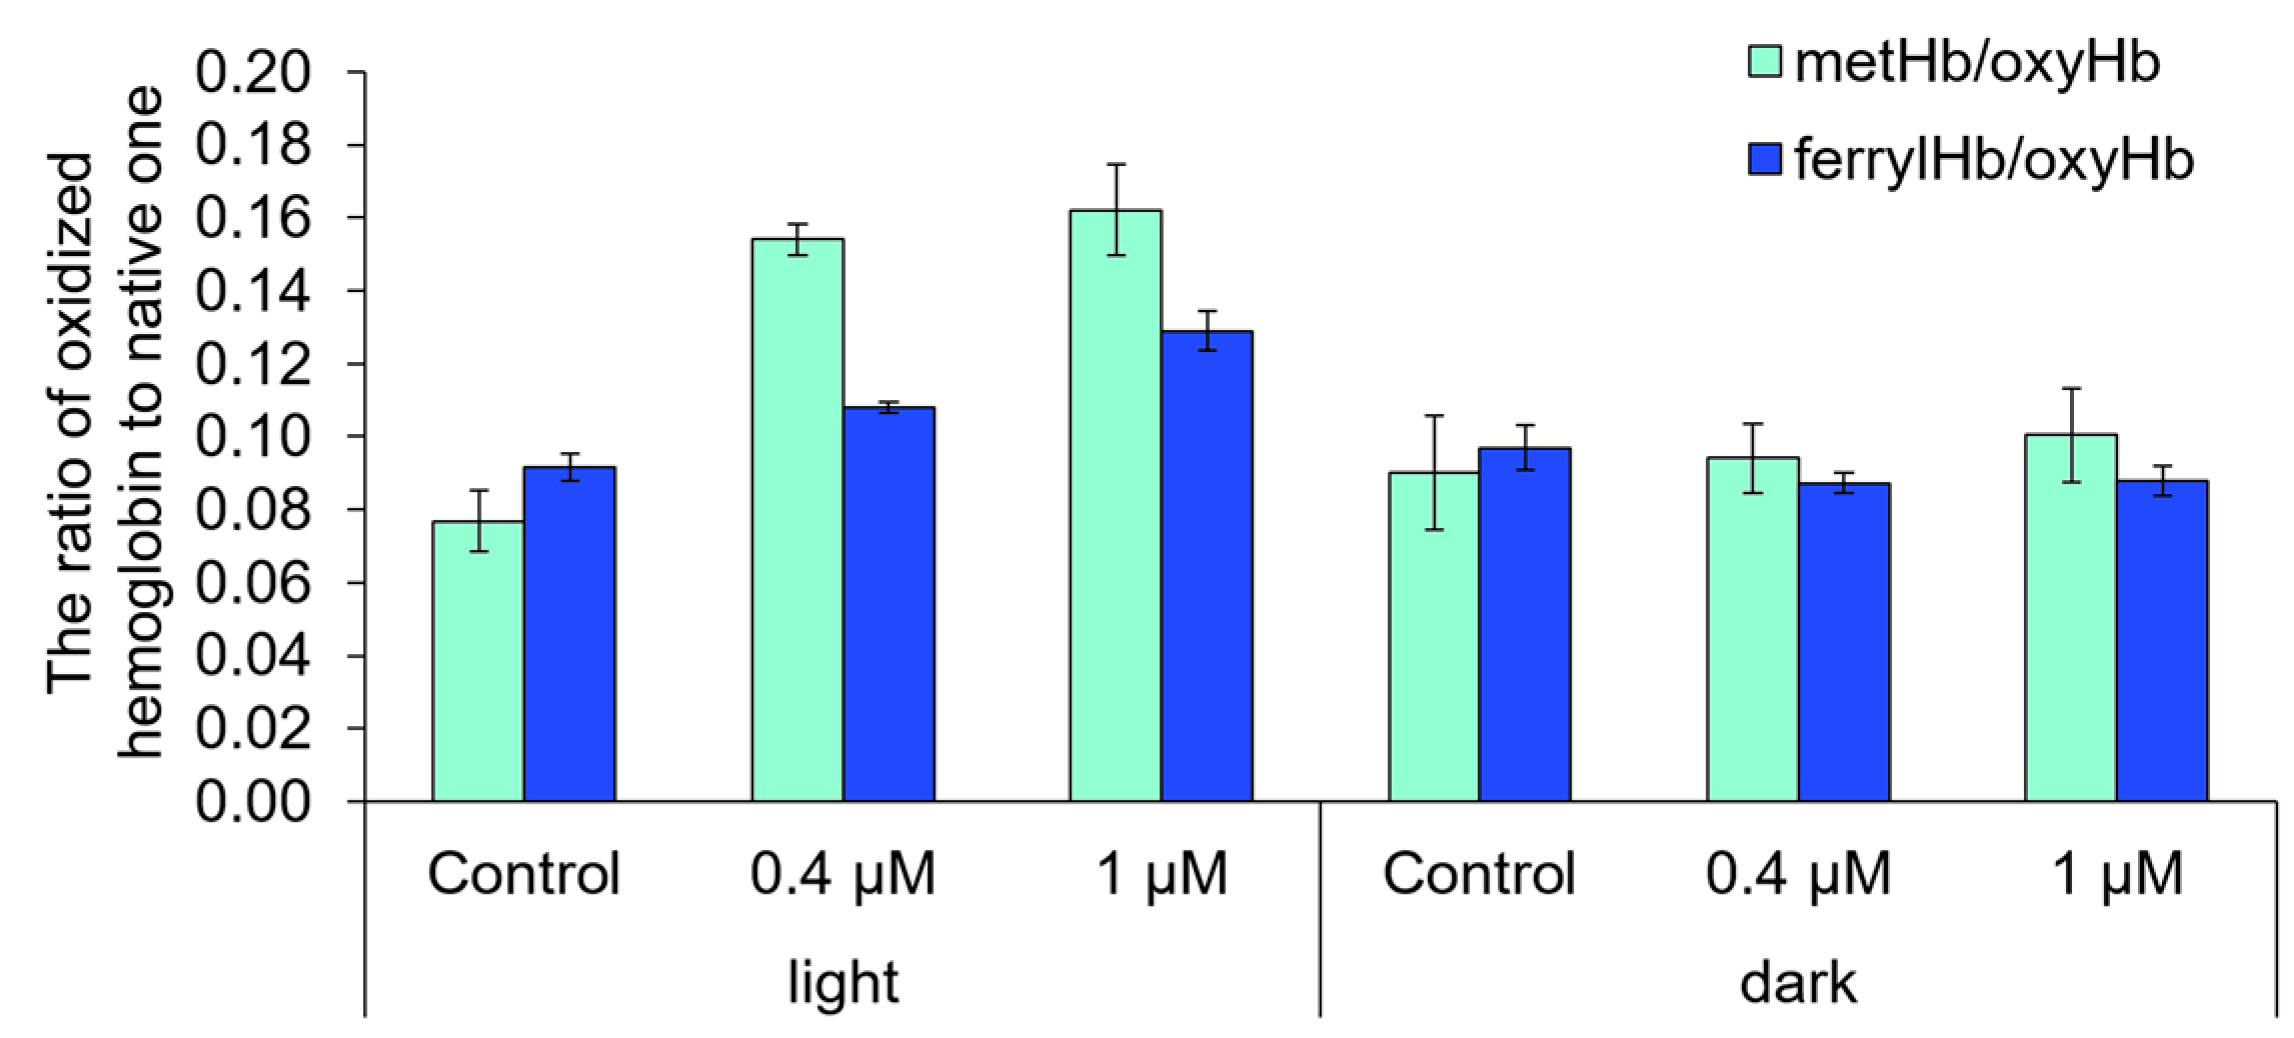
2.6. The Ability of Compound 21 to Destroy Anuclear Cells and to Oxidize Biomolecules
3. Materials and Methods
3.1. Cell Culture
3.2. Estimation of Dark Cytotoxic Activity
3.3. Estimation of Photoinduced Cytotoxic Activity
3.4. Analysis of DNA Damage with Comet-Assay
3.5. Analysis of Caspase 3 Activity
3.6. Estimation of the Ability of Compound 21 to Penetrate the Plasmalemma
3.7. Analysis of Stress-Response Genes Expression
3.8. Hemolytic Activity Analysis
4. Conclusions
Acknowledgments
Author Contributions
Conflicts of Interest
Abbreviations
| FMCA | Fluorometric microculture cytotoxicity assay |
| IC50 | Concentration of compond at which cell grown was inhibited by 50% |
| DMSO | Dimethyl sulfoxide |
| Photo-RBC test | Photo-Red Blood Cells test |
| oxyHb | oxyhemoglobin |
| metHb | methemoglobin |
| ferrylHb | ferrylhemoglobin |
References
- Kubler, A.C.; de Carpentier, J.; Hopper, C.; Leonard, A.G.; Putnam, G. Treatment of squamous cell carcinoma of the lip using Foscan-mediated Photodynamic Therapy. Int. J. Oral Maxillofac. Surg. 2001, 30, 504–509. [Google Scholar] [CrossRef] [PubMed]
- Xu, D.-Y. Research and development of photodynamic therapy photosensitizers in China. Photodiagn. Photodyn. Ther. 2007, 4, 13–25. [Google Scholar] [CrossRef] [PubMed]
- Juzeniene, A.; Moan, J. The history of PDT in Norway: Part one: Identification of basic mechanisms of general PDT. Photodiagn. Photodyn. Ther. 2007, 4, 3–11. [Google Scholar] [CrossRef] [PubMed]
- Huang, Z. An update on the regulatory status of PDT photosensitizers in China. Photodiagn. Photodyn. Ther. 2008, 5, 285–287. [Google Scholar] [CrossRef] [PubMed]
- Filonenko, E.V.; Sokolov, V.V.; Chissov, V.I.; Lukyanets, E.A.; Vorozhtsov, G.N. Photodynamic therapy of early esophageal cancer. Photodiagn. Photodyn. Ther. 2008, 5, 187–190. [Google Scholar] [CrossRef] [PubMed]
- Copley, L.; van der Watt, P.; Wirtz, K.W.; Parker, M.I.; Leaner, V.D. PhotolonTM, a chlorin e6 derivative, triggers ROS production and light-dependent cell death via necrosis. Int. J. Biochem. Cell Biol. 2008, 40, 227–235. [Google Scholar] [CrossRef] [PubMed]
- Kochneva, E.V.; Filonenko, E.V.; Vakulovskaya, E.G.; Scherbakova, E.G.; Seliverstov, O.V.; Markichev, N.A.; Reshetnickov, A.V. Photosensitizer Radachlorin®: Skin cancer PDT phase II clinical trials. Photodiagn. Photodyn. Ther. 2010, 7, 258–267. [Google Scholar] [CrossRef] [PubMed]
- Dougherty, T.J. Photosensitizers: Therapy and detection of malignant tumors. Photochem. Photobiol. 1987, 45, 879–889. [Google Scholar] [CrossRef] [PubMed]
- Jensen, T.J.; Vicente, M.G.H.; Luguya, R.; Norton, J.; Fronczek, F.R.; Smith, K.M. Effect of overall charge and charge distribution on cellular uptake, distribution and phototoxicity of cationic porphyrins in HEp2 cells. J. Photochem. Photobiol. B 2010, 100, 100–111. [Google Scholar] [CrossRef] [PubMed]
- Lim, D.-S.; Ko, S.-H.; Won, D.-H.; Lee, C.-H.; Lee, W.-Y. Photodynamic anti-tumor activity of a new chlorin-based photosensitizer against Lewis Lung Carcinoma cells in vitro and in vivo. J. Porphyr. Phthalocyanines 2003, 7, 155–161. [Google Scholar] [CrossRef]
- Lim, D.-S.; Kol, S.-H.; Lee, C.-H.; Ahn, W.-S.; Lee, W.-Y. DH-I-180-3-mediated photodynamic therapy: Biodistribution and tumor vascular damage. Photochem. Photobiol. 2006, 82, 600–605. [Google Scholar] [CrossRef] [PubMed]
- Kim, C.S.; Lee, C.-H.; Lee, P.H.; Han, S. Inactivation of Mitochondrial electron transport by photosensitization of a pheophorbide a derivative. Mol. Cells 2004, 17, 347–352. [Google Scholar] [PubMed]
- Belykh, D.V.; Startseva, O.M.; Patov, S.A. Novel pH-independent amphiphilic chlorophyll a derivatives with oligoethyleneglycol substituents as a hydrophilic part: Synthesis and hydrophilicity estimation. Macroheterocycles 2014, 7, 401–413. [Google Scholar] [CrossRef]
- Park, J.-H.; Ban, S.-J.; Ahmed, T.; Choi, H.S.; Yoon, H.-E.; Yoon, J.-H.; Choi, H.-K. Development of DH-I-180–3 loaded lipid nanoparticle for photodynamic therapy. Int. J. Pharm. 2015, 491, 393–401. [Google Scholar] [CrossRef] [PubMed]
- Olive, P.L.; Frazer, G.; Banath, J.P. Radiation-induced apoptosis measured in TK6 human B lymphoblast cells using the comet assay. Radiat. Res. 1993, 136, 130–136. [Google Scholar] [CrossRef] [PubMed]
- Fairbairn, D.W.; Olive, P.L.; O’Neill, K.L. The comet assay: A comprehensive review. Mutat. Res. Genet. Toxicol. 1995, 339, 37–59. [Google Scholar] [CrossRef]
- Huang, W.; Tang, S.; Qiao, X.; Ma, W.; Ji, S.; Wang, K.; Ye, M.; Yu, S. Isoangustone A induces apoptosis in SW480 human colorectal adenocarcinoma cells by disrupting mitochondrial functions. Fitoterapia 2014, 94, 36–47. [Google Scholar] [CrossRef] [PubMed]
- Qian, W.; Salamoun, J.; Wang, J.; Roginskaya, V.; van Houten, B.; Wipf, P. The combination of thioxodihydroquinazolinones and platinum drugs reverses platinum resistance in tumor cells by inducing mitochondrial apoptosis independent of Bax and Bak. Bioorg. Med. Chem. Lett. 2015, 25, 856–863. [Google Scholar] [CrossRef] [PubMed]
- Pape, W.J.W.; Brandt, M.; Pfannenbecker, U. Combined in vitro assay for photohaemolysis and haemoglobin oxidation as part of a phototoxicity test system assessed with various phototoxic substances. Toxicol. In Vitro 1994, 8, 755–757. [Google Scholar] [CrossRef]
- Vardapetyan, H.R.; Martirosyan, A.S.; Tiratsuyan, S.G.; Hovhannisyan, A.A. Interaction between hypericin and hemoglobin. J. Photochem. Photobiol. B 2010, 101, 53–58. [Google Scholar] [CrossRef] [PubMed]
- Lindhagen, E.; Nygren, P.; Larsson, R. The fluorometric microculture cytotoxicity assay. Nat. Protoc. 2008, 3, 1364–1369. [Google Scholar] [CrossRef] [PubMed]
- Sharma, A.K.; Ali, A.; Gogna, R.; Singh, A.K.; Pati, U. p53 amino-terminus region (1–125) stabilizes and restores heat denatured p53 wild phenotype. PLoS ONE 2009, 4, e7159. [Google Scholar] [CrossRef] [PubMed]
- Cheng, K.-C.; Huang, H.-C.; Chen, J.-H.; Hsu, J.-W.; Cheng, H.-C.; Ou, C.-H.; Yang, W.-B.; Chen, S.-T.; Wong, C.-H.; Juan, H.-F. Ganoderma lucidum polysaccharides in human monocytic leukemia cells: From gene expression to network construction. BMC Genom. 2007, 8, 411. [Google Scholar] [CrossRef] [PubMed]
- Ghosh, S.; Krishna, M. Role of Rad52 in fractionated irradiation induced signaling in A549 lung adenocarcinoma cells. Mutat. Res. Mol. Mech. Mutagen. 2012, 729, 61–72. [Google Scholar] [CrossRef] [PubMed]
- Marconett, C.N.; Zhou, B.; Rieger, M.E.; Selamat, S.A.; Dubourd, M.; Fang, X.; Lynch, S.K.; Stueve, T.R.; Siegmund, K.D.; Berman, B.P.; et al. Integrated transcriptomic and epigenomic analysis of primary human lung epithelial cell differentiation. PLoS Genet. 2013, 9, e1003513. [Google Scholar] [CrossRef] [PubMed]
- Corrales, R.M.; Galarreta, D.; Herreras, J.; Calonge, M.; Chaves, F. Antioxidant enzyme mRNA expression in conjunctival epithelium of healthy human subjects. Can. J. Ophthalmol. 2011, 46, 35–39. [Google Scholar] [CrossRef] [PubMed]
- Bian, Q.; Fernandes, A.; Taylor, A.; Wu, M.; Pereira, P.; Shang, F. Expression of K6W-ubiquitin in lens epithelial cells leads to upregulation of a broad spectrum of molecular chaperones. Mol. Vis. 2008, 14, 403–412. [Google Scholar] [PubMed]
- Ding, K.-K.; Shang, Z.-F.; Hao, C.; Xu, Q.-Z.; Shen, J.-J.; Yang, C.-J.; Xie, Y.-H.; Qiao, C.; Wang, Y.; Xu, L.-L.; et al. Induced expression of the IER5 gene by γ-ray irradiation and its involvement in cell cycle checkpoint control and survival. Radiat. Environ. Biophys. 2009, 48, 205–213. [Google Scholar] [CrossRef] [PubMed]
- Takebayashi, J.; Chen, J.; Tai, A. A Method for evaluation of antioxidant activity based on inhibition of free radical-induced erythrocyte hemolysis. In Advanced Protocols in Oxidative Stress II; Armstrong, D., Ed.; Humana Press: New York, NY, USA, 2010; pp. 287–296. [Google Scholar]
- Van den Berg, J.J.; Op den Kamp, J.A.; Lubin, B.H.; Roelofsen, B.; Kuypers, F.A. Kinetics and site specificity of hydroperoxide-induced oxidative damage in red blood cells. Free Radic. Biol. Med. 1992, 12, 487–498. [Google Scholar] [CrossRef]


| Compound | IC50 ± SE, μM | Compound | IC50 ± SE, μM | Compound | IC50 ± SE, μM |
|---|---|---|---|---|---|
| 1 | 57.51 ± 38.21 | 11 | 1.43 ± 0.21 | 21 | >100 |
| 2 | 38.40 ± 23.26 | 12 | 1.94 ± 0.78 | 22 | 54.70 ± 27.13 |
| 3 | 48.36 ± 36.18 | 13 | 1.67 ± 0.34 | 23 | 12.77 ± 1.20 |
| 4 | 21.32 ± 3.67 | 14 | 16.64 ± 5.13 | 24 | 5.58 ± 0.93 |
| 5 | 22.61 ± 3.73 | 15 | 13.15 ± 2.08 | 25 | 6.88 ± 5.06 |
| 6 | 19.72 ± 2.79 | 16 | 3.50 ± 0.84 | Diethylene glycol | >100 |
| 7 | 13.88 ± 2.92 | 17 | 12.09 ± 1.85 | Triethylene glycol | >100 |
| 8 | 19.09 ± 6.00 | 18 | 6.47 ± 1.33 | Tetraethylene glycol | >100 |
| 9 | 24.93 ± 5.73 | 19 | 41.56 ± 27.36 | Pentaethylene glycol | >100 |
| 10 | 34.28 ± 11.39 | 20 | 1.97 ± 0.88 | Hexaethylene glycol | >100 |
| PhotolonTM | 31.09 ± 4.92 |
| Compound | λ, nm | HeLa | A549 | Hek293 | HELF-104 |
|---|---|---|---|---|---|
| 21 | 660 nm | 0.15 ± 0.03 | 0.07 ± 0.01 | 0.48 ± 0.23 | 0.16 ± 0.06 |
| 700 nm | 0.23 ± 0.02 | 0.21 ± 0.03 | >1 | 0.39 ± 0.12 | |
| PhotolonTM | 660 nm | >1 | >1 | 0.44 ± 0.09 | >1 |
| Gene | Dark Toxicity | Phototoxicity | ||
|---|---|---|---|---|
| Control | 0.4 µM | Control | 0.4 µM | |
| CDKN1A | 0.363 ± 0.093 | 0.233 ± 0.024 | 0.357 ± 0.052 | 0.641 ± 0.083 ** |
| CDKN2A | 0.963 ± 0.119 | 1.017 ± 0.108 | 0.713 ± 0.100 | 0.869 ± 0.137 |
| CDKN2D | 0.964 ± 0.062 | 0.992 ± 0.057 | 0.908 ± 0.032 | 1.248 ± 0.076 ** |
| BAX | 1.064 ± 0.044 | 1.038 ± 0.018 | 0.992 ± 0.033 | 1.289 ± 0.035 ** |
| TNFSF10 | 0.856 ± 0.103 | 0.781 ± 0.055 | 0.656 ± 0.078 | 0.768 ± 0.067 |
| GSR | 0.935 ± 0.126 | 1.079 ± 0.063 | 1.216 ± 0.042 | 1.127 ± 0.068 |
| PBP74 | 0.424 ± 0.024 | 0.449 ± 0.027 | 0.455 ± 0.010 | 0.544 ± 0.025 * |
| SOD2 | 1.002 ± 0.127 | 1.112 ± 0.079 | 1.196 ± 0.049 | 1.428 ± 0.169 |
| Gene | Forward Primer | Reverse Primer | Source |
|---|---|---|---|
| BAX | AGAGGATGATTGCCGCCGT | CAACCACCCTGGTCTTGGAT | [22] |
| TNFSF10 | GCTGAAGCAGATGCAGGACAAG | CTGACGGAGTTGCCACTTGAC | [23] |
| CDKN1A | CAGCAGAGGAAGACCATGTG | GGCGTTTGGAGTGGTAGAAA | [24] |
| CDKN2A | GACATCCCCGATTGAAAGAA | TTTACGGTAGTGGGGGAAGG | * |
| CDKN2D | TCAGTTTCTTCTGCGCCTCA | CAACGTGCACACTTCAGGTC | * |
| SOD2 | GCTGACGGCTGCATCTGTT | CCTGATTTGGACAAGCAGCAA | [25] |
| GSR | ATCCCCGGTGCCAGCTTAGG | AGCAATGTAACCTGCACCAACAA | [26] |
| PBP74 | TCTGGACTGAATGTGCTTCG | ATCCCCATTTGTGGATTTCA | [27] |
| GAPDH | ACACCCACTCCTCCACCTTTG | GCTGTAGCCAAATTCGTTGTCATAC | [23] |
| ACTB | GCGCGGCTACAGCTTCA | CTTAATGTCACGCACGATTTCC | [28] |
© 2017 by the authors; licensee MDPI, Basel, Switzerland. This article is an open access article distributed under the terms and conditions of the Creative Commons Attribution (CC-BY) license (http://creativecommons.org/licenses/by/4.0/).
Share and Cite
Pylina, Y.I.; Shadrin, D.M.; Shevchenko, O.G.; Startseva, O.M.; Velegzhaninov, I.O.; Belykh, D.V.; Velegzhaninov, I.O. Dark and Photoinduced Cytotoxic Activity of the New Chlorophyll-a Derivatives with Oligoethylene Glycol Substituents on the Periphery of Their Macrocycles. Int. J. Mol. Sci. 2017, 18, 103. https://doi.org/10.3390/ijms18010103
Pylina YI, Shadrin DM, Shevchenko OG, Startseva OM, Velegzhaninov IO, Belykh DV, Velegzhaninov IO. Dark and Photoinduced Cytotoxic Activity of the New Chlorophyll-a Derivatives with Oligoethylene Glycol Substituents on the Periphery of Their Macrocycles. International Journal of Molecular Sciences. 2017; 18(1):103. https://doi.org/10.3390/ijms18010103
Chicago/Turabian StylePylina, Yana I., Dmitry M. Shadrin, Oksana G. Shevchenko, Olga M. Startseva, Igor O. Velegzhaninov, Dmitry V. Belykh, and Ilya O. Velegzhaninov. 2017. "Dark and Photoinduced Cytotoxic Activity of the New Chlorophyll-a Derivatives with Oligoethylene Glycol Substituents on the Periphery of Their Macrocycles" International Journal of Molecular Sciences 18, no. 1: 103. https://doi.org/10.3390/ijms18010103