Article

Transcriptional and Behavioral Responses of Zebrafish Larvae to Microcystin-LR Exposure

1
Laboratory of Biological Chemistry, Medical School, University of Ioannina, 45110 Ioannina, Greece
2
Division of Biomedical Research, Foundation for Research and Technology-Hellas, Institute of Molecular Biology and Biotechnology, 45110 Ιοannina, Greece
3
BIOBIDE, Paseo Mikeletegi 56, 20009 San Sebastian, Spain
4
Laboratory of Zoology, Department of Biological Applications and Technologies, University of Ioannina, 45110 Ioannina, Greece
*
Author to whom correspondence should be addressed.
Int. J. Mol. Sci. 2017, 18(2), 365; https://doi.org/10.3390/ijms18020365
Submission received: 27 December 2016 / Revised: 29 January 2017 / Accepted: 2 February 2017 / Published: 9 February 2017
(This article belongs to the Special Issue Zebrafish: A Model for Toxicological Research)

Abstract

:
Microcystins are cyclic heptapeptides that constitute a diverse group of toxins produced by cyanobacteria. One of the most toxic variants of this family is microcystin-LR (MCLR) which is a potent inhibitor of protein phosphatase 2A (PP2A) and induces cytoskeleton alterations. In this study, zebrafish larvae exposed to 500 μg/L of MCLR for four days exhibited a 40% reduction of PP2A activity compared to the controls, indicating early effects of the toxin. Gene expression profiling of the MCLR-exposed larvae using microarray analysis revealed that keratin 96 (krt96) was the most downregulated gene, consistent with the well-documented effects of MCLR on cytoskeleton structure. In addition, our analysis revealed upregulation in all genes encoding for the enzymes of the retinal visual cycle, including rpe65a (retinal pigment epithelium-specific protein 65a), which is critical for the larval vision. Quantitative real-time PCR (qPCR) analysis confirmed the microarray data, showing that rpe65a was significantly upregulated at 50 μg/L and 500 μg/L MCLR in a dose-dependent manner. Consistent with the microarray data, MCLR-treated larvae displayed behavioral alterations such as weakening response to the sudden darkness and hypoactivity in the dark. Our work reveals new molecular targets for MCLR and provides further insights into the molecular mechanisms of MCLR toxicity during early development.

1. Introduction

Cyanotoxins are secondary metabolites produced by several species of cyanobacteria that exist in freshwater lakes and coastal marine ecosystems due to eutrophication. They are classified into three broad groups according to their chemical structure as cyclic peptides, alkaloids, and lipopolysaccharides [1]. Microcystins are monocyclic heptapeptides produced by several members of cyanobacterial genera including Microcystis, Anabaena, and Planktothrix [2]. To date, more than 90 variants have been identified, and among them microcystin-LR (MCLR) is the most common and toxic member [2,3]. Microcystin-LR is extremely stable under physiological conditions and resistant to chemical hydrolysis or oxidation. A slow degradation occurs either at high temperatures (40 °C) or high/low pH [4]. The toxin can also be degraded by bacterial metalloproteases, called microcystinases, but the bacterial species that produce these enzymes are often absent from surface water [5].
In aquatic environments the concentrations of MCLR vary from traces to 1800 μg/L or even higher during periods of cyanobacterial blooms [6]. Upon cyanobacteria cell death or lysis, MCLR is released into the aquatic environment and the exposure of fish may occur either by oral uptake of toxin-containing cells or via epithelium surfaces that are immersed in the polluted water [7]. Organic anion transporters (OATPs) are specifically required for active uptake of MCLR into hepatocytes and epithelial cells [8]. These transporters are highly expressed in the liver and are also found in the heart, lung, spleen, pancreas, and brain [9].
Regarding fish, MCLR toxicity develops at concentrations in the range of μg/L, depending on the aquatic species, the developmental stage, and the exposure route (intraperitoneal injection, feeding, or immersion) [7,10,11]. During early development, the toxin can disrupt embryonic hatching and growth rate, causing morphological abnormalities such as small head and curved body. It also affects the heart rate and the physiological hepatocyte structure [12]. When fish are exposed to high concentrations of MCLR (>1000 μg/L), hepatocytes die through necrosis, which often leads to tissue disruption and liver failure [12].
Previous studies have proposed that MCLR hepatotoxicity could be due to hyperphosphorylation of actin-associated proteins, which leads to cytoskeleton breakdown and ultimately disrupts the cellular architecture inducing apoptosis in liver [13,14]. Recent evidence suggests that all changes in the phosphorylation status of the cytoskeleton proteins may be attributed to the inhibition of the serine/threonine protein phosphatase 2A (PP2A) by MCLR [15,16]. Protein phosphatase 2A plays essential roles in the control of many biological processes, including cell growth, proliferation, apoptosis, and differentiation, and its activity should be very tightly regulated to maintain the cellular homeostasis [17,18]. Crystallographic experiments revealed that MCLR binds specifically to the active site of the catalytic subunit of PP2A, inhibiting its enzymatic activity with Ki value in the picomolar range [19]. Subsequent studies have shown that alterations of PP2A activity by MCLR is an early event during the toxin exposure and can be considered as one of the main mechanisms of MCLR toxicity [20].
Fish exposed to microcystins have developed detoxification mechanisms to resist the toxin risks. The glutathione pathway is an important biochemical mechanism for the formation of glutathione (GSH) conjugates that increases the water-solubility of MCLR, mediating both its metabolism and elimination [21,22]. Besides the enzymatic activity of PP2A and glutathione transferase, MCLR also affects acetylocholinesterase (AChE), an enzyme that plays key roles in neurotransmitter systems and is widely used as a bioindicator of environmental toxicity [23]. Recently, Zeng et al. have shown that MCLR exposure is accompanied by reactive oxygen species (ROS) production that consequently triggers apoptosis in developing zebrafish embryos in a caspase-dependent manner [24].
Zebrafish has emerged as a prominent organism for investigating vertebrate development and is widely used for environmental and toxicological studies [25,26]. The nervous system of larval fish is suitable for studies of fundamental neuronal pathways because zebrafish have broad homologies to mice and humans with respect to brain patterning, and the structure/function of several neural systems [27]. Recently, a number of neurobehavioral locomotor assays, including learning and memory, have been developed in zebrafish to complement genetic studies [28,29,30,31]. In the present study, we investigated the transcriptional and behavioral responses of zebrafish larvae to MCLR exposure and searched for biochemical pathways affected by the toxin at sublethal concentrations of MCLR.

2. Results

2.1. Alterations of Protein Phosphatase 2A Activity in Zebrafish Larvae Following Exposure to Microcystin-LR

To understand the effects of MCLR on early zebrafish development, three days post-fertilization (dpf) zebrafish larvae were exposed to different concentrations of purified MCLR, ranging from 50–500 μg/L for a period of four days. Morphological observations of the treated larvae showed that the highest concentration of 500 μg/L of MCLR did not cause death or any obvious morphological defects in the exposed animals (not shown). Under these experimental conditions, PP2A activity was markedly reduced in the treated larvae, consistent with the established inhibitory role of MCLR to PP2A [16,19] (Figure 1A). The reduction of PP2A activity in the MCLR-exposed larvae was calculated to be 42.4% ± 6.9% (Figure 1B). These results suggest that exposure of three dpf larvae to 500 μg/L of MCLR within four days can be used to assess early changes of gene expression in the treated fish. Thus, it was tempting to speculate if this dose, effective for a metabolic change without overt toxic consequences, can be used to detect early changes of gene expression in treated larvae.

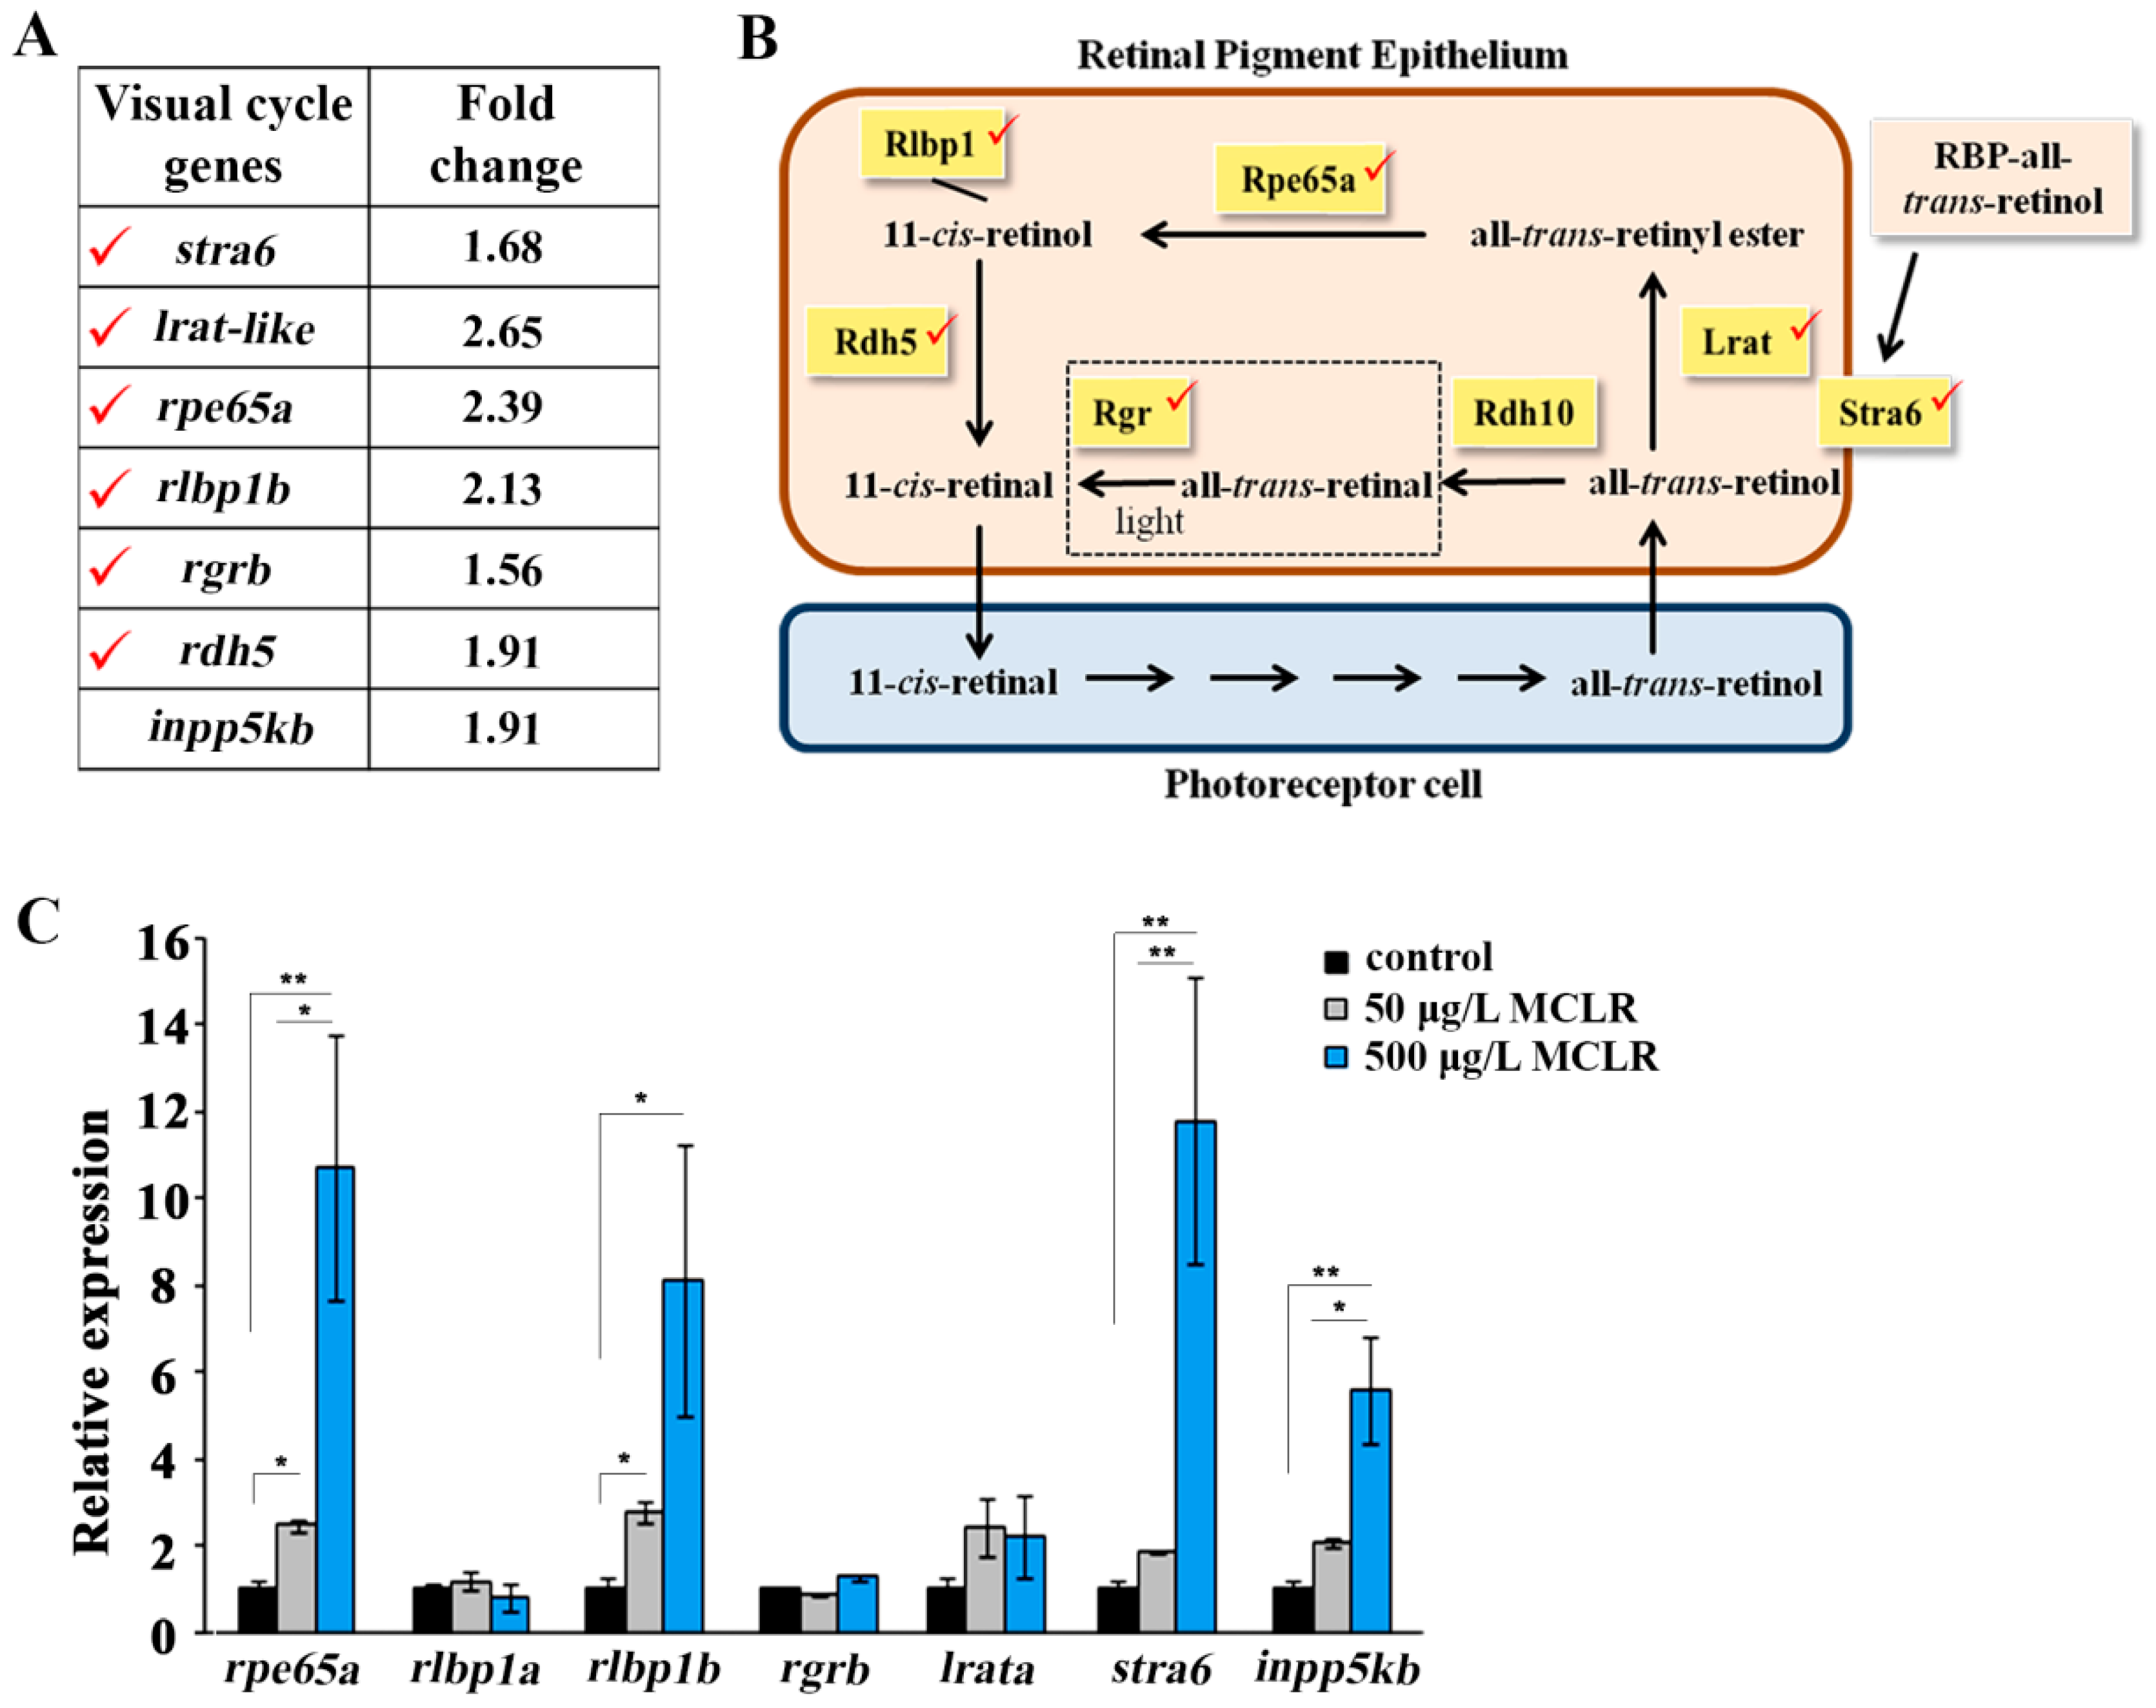
2.2. Gene Expression Analysis

To determine the global gene expression profile of larvae treated with 500 μg/L MCLR, we used DNA microarray analysis. Using a threshold of fold change ≥1.5 and p ≤ 0.05, the total number of the differentially expressed transcripts with known gene ID was 53, and among them, four genes were represented by two different transcripts: tyr (tyrosinase), cp (ceruloplasmin), ttna (titin a), lgals1l1 (lectin, galactoside-binding, soluble, 1) (Table 1). All information concerning the differentially regulated genes and the function of the encoded proteins was obtained from the National Center for Biotechnology Information (NCBI). Our detailed analysis showed that krt96 (keratin 96) and the cytoskeleton-associated ttna and ttnb (titin b) were among the most downregulated transcripts (Table 1), consistent with the well-documented effect of MCLR on cytoskeleton structure and dynamics [13,14,15,32,33]. In addition, most genes of the melanin synthesis pathway such as tyr, dct (dopachrome tautomerase), tyrp1a (tyrosinase-related protein 1a), tyrp1b (tyrosinase-related protein 1b) pmela (premelanosome protein a) and pmelb (premelanosome protein b) were upregulated by 1.55-, 2.13-, 1.51-, 1.70-, 1.72-, and 2.06-fold, respectively (Table 1). These microarray data have been confirmed by quantitative real-time PCR (qPCR) analysis revealing 4.30-fold upregulation of tyr, 5.84-fold of dct, 4.71-fold of pmela, and 11.36-fold of pmelb at 500 μg/L of MCLR exposure (p ≤ 0.05, data not shown).
Our data also demonstrated that all the enzymes of the retinoid visual cycle were differentially expressed upon the exposure of three dpf larvae to 500 μg/L of MCLR (Figure 2A). The visual cycle takes place within the outer segments of the photoreceptors and the retinal pigment epithelium (RPE) and is constituted by a series of reactions that regenerate 11-cis-retinal from all-trans-retinol (outlined in Figure 2B). The critical and apparently rate-limiting step in the retinoid visual cycle is the conversion of the all-trans isomer to its 11-cis form by the retinal pigment epithelium-specific protein 65 kDa (RPE65) [34,35,36].
As indicated by the microarray results, the transcription levels of rpe65a, rlbp1b, rgrb, rdh5, lrat-like, and stra6 were upregulated (Figure 2A). Moreover, inpp5kb—which encodes an enzyme with roles in the phosphoinositide metabolism, that regulates retina function [37]—showed upregulation by 1.91-fold (Table 1, Figure 2A).
To check for early effects of MCLR on gene expression, we analyzed the levels of all the above genes at 50 μg/L and 500 μg/L of MCLR using qPCR analysis, which is a more sensitive and accurate method than microarrays (Figure 2C). In more detail, rpe65a was up-regulated by 2.48- and 10.80-fold, rlbp1a (NM_200705.1) 1.18-fold and 0.82-fold, rlbp1b (NM_205690.2) 2.76-fold and 8.09-fold, lrata (NM_001204131) 2.44- and 2.22-fold, stra6 1.86- and 11.85-fold and inpp5kb by 2.07-fold and 5.57-fold in larvae treated with 50 μg/L and 500 μg/L MCLR, respectively.
Therefore, our results show that exposure of zebrafish larvae to MCLR affects the transcription levels of cytoskeleton-associated, melanin synthesis, and visual cycle genes that may in turn affect the physiological responses of the fish.

2.3. Behavioral Alterations upon Microcystin-LR Exposure of Zebrafish Larvae

Several studies have shown that MCLR accumulates in the brain [9] and exerts toxicity in the nervous system and impacts functions, including behavioral changes [23,38,39]. Furthermore, our data have shown that MCLR affects the transcriptional levels of all visual cycle genes. Therefore, it was tempting to investigate whether the MCLR exposed fish exhibited altered behavioral responsiveness to dark/light changes [40]. In the light, zebrafish normally have less locomotor activity than in the dark. After a sudden decrease in brightness, larvae respond with a rapid increase in movement [41] and exhibit a startle response when the light is turned back on again, followed by minimal movement in the light [40]. This reaction pattern is related to stress produced by the sudden darkness. To evaluate behavioral alterations in response to MCLR, three dpf larvae were exposed to 100 μg/L and 500 μg/L of MCLR for four days. After applying 10 min dark and 10 min light conditions in order to let larvae habituate to the system, tracking was performed at two rounds of 10 min light/10 min dark phases for 40 min. As shown in Figure 3, the behavior of larvae treated with the toxin was significantly different compared to the control group. As expected, control larvae reacted strongly against light/dark changes. On the contrary, larvae exposed to MCLR displayed a weakening reaction towards light changes, showing a constant hypoactivity during dark phases. This mitigated responsiveness of zebrafish larvae to environmental changes could be related to reduced stress and possibly to motor neuron and/or skeletal muscle functional defects caused by MCLR.

3. Discussion

In the present study, we have investigated the early effects of MCLR on zebrafish larvae at the molecular, transcriptional, and behavioral level. The responses of the larvae to sublethal concentrations of the toxin were estimated by measuring the reduction of PP2A activity, in accordance with the established inhibitory role of MCLR to PP2A [16,20]. The inhibition of PP2A activity may be used as a molecular indicator of the effects of MCLR. This suggestion is based on the fact that, at the molecular level, the determination of PP2A enzymatic activity evaluates more accurately the effects of MCLR that depend on the synergies of different factors; toxin bioaccumulation, exposure period, developmental stage of the organisms, and environmental conditions. Moreover, due to contaminant interference and large variations in recoveries of MCLR from tissue samples, the quantitation of MCLR in tissues by enzyme-linked immunosorbent assay (ELISA)-based strategies is more complicated and less reliable than in water samples (detection limit 0.1 μg/L) [22].
Our gene expression data of larvae exposed to MCLR identified upregulation of genes involved in the melanin synthesis pathway. This effect could be a compensatory mechanism for the treated individuals to circumvent the toxin threat and maintain their physiological status [42]. In addition, MCLR affected genes encoding for the enzymes of the retinoid visual cycle, suggesting molecular targets of MCLR in the visual pathway. Interestingly, most of the genes affected by MCLR are expressed in the RPE. For example, rlbp1b, which is localized in RPE, was upregulated in MCLR-treated larvae, while, rlbp1a, which is expressed only in Müller cells [43], was not among the differentially expressed transcripts in both microarray and qPCR analysis. The preference of MCLR action on RPE is interesting, because the pigment epithelium plays a critical role in the development of the retina and in some species it participates in the regeneration of the retinal tissue [44].
The mRNA changes of the above genes may imply an increase in enzyme production and/or activity. However, it is possible that some enzymes might indeed buffer fluctuations, whereas others might accelerate responses to MCLR. These parameters have not been analyzed in our work due to the lack of commercially available antibodies against the zebrafish proteins and the difficulties to assay for the interconnected isomerization reactions of the visual cycle. Since rpe65 has been shown to be critical for the retinoid visual cycle and normal vision [34,35] and it responds transcriptionally to MCLR (our data), rpe65a transcript levels may predict a toxic outcome and can be used as an early biomarker of MCLR exposure.
A previous microarray analysis by Rogers et al. in which three dpf larvae were exposed to 100, 1000 μg/L of MCLR, and Microcystis aeruginosa extract containing 4.5 μg/L of MCLR for four days, reported MCLR changes on genes related to cell signaling and development, cytoskeleton, immune function, and oxidative stress [45]. A comparison of our microarray results with the above study revealed one gene in common; sepp1b (selenoprotein P, plasma, 1b), which was reported to be downregulated in accordance with our data (Table 1). We have validated sepp1b expression in the 500 μg/L MCLR group by qPCR and found a 0.64-fold change. The observed variations between the two studies could be attributed to differences in MCLR concentrations.
Our findings are novel and raise interesting questions concerning the mechanism of MCLR action. Protein phosphatase 2A activity, which is inhibited by MCLR, is a regulator of signal transduction pathways that coordinate the visual cycle [46]. Therefore, it is reasonable to hypothesize that upon entering the RPE cells, MCLR, through inhibition of PP2A, might affect cell signaling that orchestrates the recycling of 11-cis-retinal. In agreement with this hypothesis, a recent proteomic study by Li et al. has shown that MCLR exposure of zebrafish alters the expression of β-crystallins which are present in the lens and are involved in signal transduction [47].
Accumulated evidence demonstrates that MCLR can induce neurotoxicity in nematode, fish, birds, and mammals, and may result in behavioral changes [38,39]. However, the effects of MCLR on the behavior of fish are still largely unknown. A previous study by Baganz et al. recorded altered swimming capacity of adult zebrafish upon long-term treatment with MCLR [48]. Similar results have been obtained from adult zebrafish that were exposed to a cell culture of the microcystin-producing cyanobacterium M. aeruginosa in comparable experimental settings [49]. In our study, we have used the visual locomotor assay that tracks the locomotor responses to light onset and offset and relies on the visual pathway integrity, the nervous system development, and locomotor system development [50]. This behavioral analysis showed that MCLR-treated larvae displayed a weakening response upon rapid loss of light and reduced activity in the dark. It is known that sudden darkness produces a direct stress response to the zebrafish larvae that leads to an increased locomotor activity [40]. Based on our findings, one can speculate that the reduction of the physical activity of larvae exposed to MCLR after the sudden darkness could be due to reduced stress. Additionally, MCLR-treated larvae may display motor neuron and/or skeletal muscle functional defects. In support of this hypothesis, our microarray analysis showed that the muscle-associated ttna and ttnb were among the most downregulated transcripts (0.63-fold each). Furthermore, our experiments revealed that tubulin α-1b (tuba1b) transcript levels were significantly increased to 3.09-fold in the 50 μg/L MCLR group and to 7.78-fold in the 500 μg/L MCLR group (data not shown). Expression of tubulinα-1b is induced in the developing and regenerating central nervous system (CNS) of vertebrates and is considered to be a regulator of motor neuron synapse and axon function [51]. Future experiments using transgenic lines showing motoneuronal and/or muscular cell types could reveal in a more effective way possible effects of MCLR in these anatomical compartments.
It has been established that behavioral profiling can characterize large classes of compounds and reveal information concerning their biological targets [52]. Moreover, the whole-animal behavioral responses can be measured effectively and characterize the sublethal exposure of fish to different molecules that is not accompanied by any obvious pathological effects [53]. Recently, the visual motor response (VMR) has been used for early safety assessment of oculotoxic drugs [54]. Therefore, our behavioral assay may be used to predict MCLR effects and to assess the toxicity risks.
In summary, in the present work we have (i) quantified the effect of MCLR on PP2A activity; (ii) identified the gene expression signature of the treated individuals using DNA microarrays; (iii) validated by qPCR analysis the gene expression changes at concentrations below the toxicity threshold; and (iv) complemented our toxicogenomic analysis with a high-throughput behavioral assay. Our findings provide new insights into the molecular mechanisms of microcystin-LR toxicity during early development.

4. Materials and Methods

4.1. Zebrafish Maintenance

Zebrafish maintenance, spawning, and embryo collection were performed under standard conditions. Briefly, zebrafish were cultivated in a closed flow-through system with charcoal-filtered tap water at 28 ± 0.5 °C in a 14:10 h light:dark photoperiod and were fed with commercial dry food distributed manually twice a day. Zebrafish were staged according to Kimmel et al. [55] and maintained in accordance with the European Directive 2010/63 for the protection of animals used for scientific purposes and the Recommended Guidelines for Zebrafish Husbandry Conditions. Animals were anaesthetized in 0.016% Tricaine MS-222, before sacrifice. The experimental protocols described in this study were carried out with zebrafish larvae up to seven dpf and were approved by the Foundation for Research and Technology-Hellas (FORTH) Ethics Committee (FEC) (Project Code 80821/2012).

4.2. Exposure of Zebrafish Larvae to Microcystin-LR

For exposure of zebrafish larvae to MCLR, 1 mg of pure MCLR (Enzo Life Sciences (New York, NY, USA) was dissolved in 100% ethanol and the MCLR/ethanol solution was added to fish water in different concentrations (50 μg/L and 500 μg/L). The final concentration of ethanol in fish water was ≤0.05% to avoid toxic effects. A control group was exposed to 0.05% ethanol. At three dpf, 55 larvae were exposed to 50 μg/L and 500 μg/L MCLR for four days in 250-mL glass beakers containing 100 mL of MCLR solution. These developmental stages were selected because at three dpf both the hatching period and the morphogenesis of the larvae are complete and by seven dpf, the free swimming larvae have a well-developed nervous system and the ability to perceive cues from the aquatic environment. Each concentration was studied using three independent biological replicates.

4.3. Protein Phosphatase 2A Activity Assay

Seven dpf control and treated larvae (40 larvae per tube) were placed on ice and washed once with 50 mM Tris-HCl buffer (pH 7.5) and once with lysis buffer containing 50 mM Tris-HCl, 0.05% Triton X-100, 10% (v/v) glycerol, 0.5 mM phenylmethylsulfonyl fluoride (PMSF), 0.1 mM ethylenediaminetetraacetic acid (EDTA), and 0.02% (v/v) β-mercaptethanol. Then, larvae were incubated in lysis buffer supplemented with protease inhibitors cocktail (Roche) and 1 mM Na2VO4 (phosphatase inhibitor) for 40 min and homogenized using a 25-gauge syringe. Homogenates were centrifuged at 10,000× g for 3 min at 4 °C and the supernatants were collected. Whole-larvae lysates were passed through Sephadex G-50 columns (Pharmacia Biotech, Piscataway, NJ, USA) to remove free phosphate. The total protein concentration (before and after the column step) was determined by the Bradford method, using bovine serum albumin (BSA) as standard.
To measure PP2A activity, different amounts of larvae lysates were incubated with the synthetic phospho-peptide substrate, RRApTVA (Enzo Life Sciences), which is specific for PP2A, for 30 min at 37 °C. The amount of released free phosphate was determined by measuring the absorbance of the molybdate-malachite green-phosphate complex (Sigma, St. Louis, MO, USA) at 630 nm. PP2A specific activity was expressed as nanomoles of free PO4−3 released per min per μg of total protein. Three independent experiments were performed.

4.4. RNA Preparation and cDNA Synthesis

Total RNA was extracted from control and larvae treated with 50 μg/L and 500 μg/L of MCLR (three biological replicates) using the RNeasy Mini Kit with DNase (Qiagen, Hilden, Germany) treatment to remove genomic DNA contamination. Quantification and quality analysis of RNA was performed via a Nanodrop spectrophotometer (Thermo Scientific Waltham, MA, USA) and confirmed by the Agilent 2100 Bioanalyzer (Agilent Technologies, Santa Clara, CA, USA). cDNA was synthesized using the SuperScript III First-Strand Synthesis SuperMix for qPCR (Invitrogen, Carlsbad, CA, USA) according to the manufacturer’s instructions.

4.5. Microarray Analysis

Affymetrix platform transcriptional microarray analysis was performed on RNA samples obtained from control and larvae treated with 500 μg/L of MCLR (three biological replicates from each group) using the Affymetrix GeneChip Zebrafish Gene 1.0 Arrays (Affymetrix, Santa Clara, CA, USA). RNA samples were processed and labeled for array hybridization using the Ambion WT Expression kit (Life Technologies, Carlsbad, CA, USA). Labeled, fragmented cDNA (Affymetrix GeneChip WT Terminal Labeling and Controls Kit) was hybridized to Zebrafish Gene 1.0 arrays (Affymetrix GeneChip Hybridization, Wash, and Stain Kit) for 16 h at 45 °C at 60 rpm using a GeneChip Hybridization Oven 640 (Affymetrix). Arrays were washed and stained using the Affymetrix Fluidics Station 450, and scanned using the Hewlett-Packard GeneArray Scanner 3000 7G (Palo Alto, CA, USA). Quality of array data was assessed using Expression Console (v 1.3) software (Affymetrix) prior to importing and analyzing the data in GeneSpring 13.0 (Agilent Technologies). Data was analyzed with settings for Affymetrix Expression experiment type, Exon analysis type, and normalization using the RMA16 summarization algorithm. Differentially expressed genes were determined after filtering the data sets for background level of fluorescence (as determined by the Expression Console). Differentially expressed transcripts were determined by comparing normalized average intensities (log2 GC-RMA signal intensity values) of biological triplicates of MCLR-treated larvae to control sample groups and filtering for statistically significant genes using an unpaired Student’s t-test and the cut-off value of p < 0.05, and fold change of 1.5. Microarray data have been deposited to the Gene Expression Omnibus (GEO) database under the accession number (GSE73739).

4.6. Quantitative Real-Time PCR

Quantitative real time PCR was performed on a Lightcycler capillary system 2.0 (Roche, Indianapolis, IN, USA) with SYBRgreen fluorescent label (PrimerDesign, Chandler’s Ford, UK). cDNA samples were synthesized as described in Section 4.4. The 10 μL qPCR reaction mix contained 5 μL of 2× Precision SYBRgreen mastermix (PrimerDesign), 0.25 μL of 10 μM of each PCR primer, 2 μL of diluted cDNA template (12-fold), and 2.5 μL of RNase-free water. The qPCR parameters consisted of initial denaturation at 94 °C for 15 min followed by 45 cycles at 94 °C for 15 s, 60 °C for 20 s, and 72 °C for 10 s. All reactions were performed in triplicates. To ensure that only one PCR product was amplified and that stock solutions were not contaminated, a non-template control was included and melting curve analysis was performed at the end of the amplification phase. Standard curves were constructed for each gene using serial dilutions of stock cDNA. The primers of the target genes were designed based on Danio rerio gene sequences found in the NCBI. Gene names, accession numbers, and forward and reverse primer sequences are shown in Table 2. Gene expression levels were quantified relative to the expression of reference genes gap43 and rpl13 (geNorm reference kit, PrimerDesign) using the qbase PLUS analysis program (Biogazelle, Gent, Belgium). This software uses a modified classic ΔΔCt (cycle threshold) method to take multiple reference genes and gene specific amplification efficiencies into account.
For the statistics of qPCR analysis, we have used the one-way ANOVA F-test (when equality of variances is assumed) or the Welch test (when unequal variances is assumed), followed by an appropriate post-hoc test (Tukey test in the case of equal variances and Dunnett’s test for the case of unequal variances). The hypothesis of equality of variances was checked by Levene’s test for equality of variances.

4.7. Behavior Assay

Three dpf larvae were exposed to 100 μg/L and 500 μg/L of MCLR, as well as to 0.05% ethanol as control, for four days in 250 mL-glass beakers. At seven dpf, larvae were placed in a 96-well plate, one larva per well, 30 larvae per group. The plate was introduced in the DanioVision automated tracking system powered by EthoVision (Noldus, Wageningen, The Netherlands). This system allows tracking locomotor activity of larvae under controlled temperature and lighting conditions. Temperature was set at 28.5 °C and the lighting was variable during tracking period to analyze larvae response to external stimuli. After applying 10 min dark and 10 min light conditions in order to let larvae habituate to the system, tracking was performed at two rounds of 10 min light/10 min dark phases. Total duration of the tracking was 40 min. The mean of the total distance covered by larvae in each group was measured in 2 min time bins. Statistical analysis was done by two-factor mixed-design ANOVA for comparing the mean differences between groups taking into account time (“within-subjects” factor) and MCLR concentration (“between-subjects”) factor.

Acknowledgments

We would like to thank Jelena Pistolic (European Molecular Biology Laboratory, Heidelberg, Germany) and Katerina Soupsana (Biomedical Research Institute, Foundation for Research and Technology-Hellas, Ioannina, Greece) for the microarray analysis, Apostolos Batsidis (University of Ioannina, Greece) for his advice on the statistical analysis, and Zoe Karetsou and Evangeli Lampri for their contribution during the course of this study. We also thank Dimitris Beis (Biomedical Research Foundation, Academy of Athens, Athens, Greece) and the anonymous reviewers for helpful comments that improved our paper. This work was supported by the European Union (European Regional Development Fund-ERDF) and Greek national funds through the Operational Program “Thessaly-Mainland Greece and Epirus-2007-2013” of the National Strategic Reference Framework (NSRF 2007-2013) (Project 348156).

Author Contributions

Eleni Tzima, Iliana Serifi, and Ioanna Tsikari performed experiments and analyzed the data. Ainhoa Alzualde performed the behavior analysis. Thomais Papamarcaki and Ioannis Leonardos conceived the study, designed the experiments, and interpreted the data. Eleni Tzima and Thomais Papamarcaki wrote the article.

Conflicts of Interest

The authors declare no conflict of interest.

References

  1. Ferrao-Filho Ada, S.; Kozlowsky-Suzuki, B. Cyanotoxins: Bioaccumulation and effects on aquatic animals. Mar. Drugs 2011, 9, 2729–2772. [Google Scholar] [CrossRef] [PubMed]
  2. Carmichael, W.W.; Azevedo, S.M.; An, J.S.; Molica, R.J.; Jochimsen, E.M.; Lau, S.; Rinehart, K.L.; Shaw, G.R.; Eaglesham, G.K. Human fatalities from cyanobacteria: Chemical and biological evidence for cyanotoxins. Environ. Health Perspect. 2001, 109, 663–668. [Google Scholar] [CrossRef] [PubMed]
  3. Dittmann, E.; Fewer, D.P.; Neilan, B.A. Cyanobacterial toxins: Biosynthetic routes and evolutionary roots. FEMS Microbiol. Rev. 2013, 37, 23–43. [Google Scholar] [CrossRef] [PubMed]
  4. Harada, K.; Tsuji, K.; Watanabe, M.F. Stability of microcystins from cyanobacteria III. Effect of pH and temperature. Phycologia 1996, 35, 83–88. [Google Scholar] [CrossRef]
  5. Dziga, D.; Wladyka, B.; Zielinska, G.; Meriluoto, J.; Wasylewski, M. Heterologous expression and characterisation of microcystinase. Toxicon 2012, 59, 578–586. [Google Scholar] [CrossRef] [PubMed]
  6. Chorus, I.; Bartram, J. Toxic Cyanobacteria in Water: A Guide to Their Public Health Consequences, Monitoring and Management; E and FN Spon; WHO: London, UK, 1999. [Google Scholar]
  7. Pavagadhi, S.; Balasubramanian, R. Toxicological evaluation of microcystins in aquatic fish species: Current knowledge and future directions. Aquat. Toxicol. 2013, 142–143, 1–16. [Google Scholar] [CrossRef] [PubMed]
  8. Fischer, W.J.; Altheimer, S.; Cattori, V.; Meier, P.J.; Dietrich, D.R.; Hagenbuch, B. Organic anion transporting polypeptides expressed in liver and brain mediate uptake of microcystin. Toxicol. Appl. Pharmacol. 2005, 203, 257–263. [Google Scholar] [CrossRef]
  9. Feurstein, D.; Holst, K.; Fischer, A.; Dietrich, D.R. Oatp-associated uptake and toxicity of microcystins in primary murine whole brain cells. Toxicol. Appl. Pharmacol. 2009, 234, 247–255. [Google Scholar] [CrossRef] [PubMed]
  10. Wang, P.J.; Chien, M.S.; Wu, F.J.; Chou, H.N.; Lee, S.J. Inhibition of embryonic development by microcystin-LR in zebrafish, Danio rerio. Toxicon 2005, 45, 303–308. [Google Scholar] [CrossRef] [PubMed]
  11. Papadimitriou, T.; Armeni, E.; Stalikas, C.D.; Kagalou, I.; Leonardos, I.D. Detection of microcystins in pamvotis lake water and assessment of cyanobacterial bloom toxicity. Environ. Monit. Assess. 2012, 184, 3043–3052. [Google Scholar] [CrossRef] [PubMed]
  12. Malbrouck, C.; Kestemont, P. Effects of microcystins on fish. Environ. Toxicol. Chem. 2006, 25, 72–86. [Google Scholar] [CrossRef] [PubMed]
  13. Khan, S.A.; Wickstrom, M.L.; Haschek, W.M.; Schaeffer, D.J.; Ghosh, S.; Beasley, V.R. Microcystin-LR and kinetics of cytoskeletal reorganization in hepatocytes, kidney cells, and fibroblasts. Nat. Toxins 1996, 4, 206–214. [Google Scholar] [CrossRef]
  14. Wickstrom, M.L.; Khan, S.A.; Haschek, W.M.; Wyman, J.F.; Eriksson, J.E.; Schaeffer, D.J.; Beasley, V.R. Alterations in microtubules, intermediate filaments, and microfilaments induced by microcystin-LR in cultured cells. Toxicol. Pathol. 1995, 23, 326–337. [Google Scholar] [CrossRef] [PubMed]
  15. Zhou, M.; Tu, W.W.; Xu, J. Mechanisms of microcystin-LR-induced cytoskeletal disruption in animal cells. Toxicon 2015, 101, 92–100. [Google Scholar] [CrossRef] [PubMed]
  16. MacKintosh, C.; Beattie, K.A.; Klumpp, S.; Cohen, P.; Codd, G.A. Cyanobacterial microcystin-LR is a potent and specific inhibitor of protein phosphatases 1 and 2A from both mammals and higher plants. FEBS Lett. 1990, 264, 187–192. [Google Scholar] [CrossRef]
  17. Janssens, V.; Goris, J.; van Hoof, C. PP2A: The expected tumor suppressor. Curr. Opin. Genet. Dev. 2005, 15, 34–41. [Google Scholar] [CrossRef] [PubMed]
  18. Perrotti, D.; Neviani, P. Protein phosphatase 2A (PP2A), a drugable tumor suppressor in Ph1(+) leukemias. Cancer Metastasis Rev. 2008, 27, 159–168. [Google Scholar] [CrossRef] [PubMed]
  19. Xing, Y.; Xu, Y.; Chen, Y.; Jeffrey, P.D.; Chao, Y.; Lin, Z.; Li, Z.; Strack, S.; Stock, J.B.; Shi, Y. Structure of protein phosphatase 2A core enzyme bound to tumor-inducing toxins. Cell 2006, 127, 341–353. [Google Scholar] [CrossRef] [PubMed]
  20. Sun, Y.; Zheng, Q.; Sun, Y.T.; Huang, P.; Guo, Z.L.; Xu, L.H. Microcystin-LR induces protein phosphatase 2a alteration in a human liver cell line. Environ. Toxicol. 2014, 29, 1236–1244. [Google Scholar] [CrossRef] [PubMed]
  21. Pflugmacher, S.; Wiegand, C.; Oberemm, A.; Beattie, K.A.; Krause, E.; Codd, G.A.; Steinberg, C.E. Identification of an enzymatically formed glutathione conjugate of the cyanobacterial hepatotoxin microcystin-LR: The first step of detoxication. Biochim. Biophys. Acta 1998, 1425, 527–533. [Google Scholar] [CrossRef]
  22. Schmidt, J.R.; Wilhelm, S.W.; Boyer, G.L. The fate of microcystins in the environment and challenges for monitoring. Toxins 2014, 6, 3354–3387. [Google Scholar] [CrossRef] [PubMed]
  23. Kist, L.W.; Rosemberg, D.B.; Pereira, T.C.; de Azevedo, M.B.; Richetti, S.K.; de Castro Leao, J.; Yunes, J.S.; Bonan, C.D.; Bogo, M.R. Microcystin-LR acute exposure increases AChE activity via transcriptional ache activation in zebrafish (Danio rerio) brain. Comp. Biochem. Physiol. C Toxicol. Pharmacol. 2012, 155, 247–252. [Google Scholar] [CrossRef]
  24. Zeng, C.; Sun, H.; Xie, P.; Wang, J.; Zhang, G.; Chen, N.; Yan, W.; Li, G. The role of apoptosis in MCLR-induced developmental toxicity in zebrafish embryos. Aquat. Toxicol. 2014, 149, 25–32. [Google Scholar] [CrossRef] [PubMed]
  25. Kabashi, E.; Brustein, E.; Champagne, N.; Drapeau, P. Zebrafish models for the functional genomics of neurogenetic disorders. Biochim. Biophys. Acta 2011, 1812, 335–345. [Google Scholar] [CrossRef] [PubMed]
  26. Dai, Y.J.; Jia, Y.F.; Chen, N.; Bian, W.P.; Li, Q.K.; Ma, Y.B.; Chen, Y.L.; Pei, D.S. Zebrafish as a model system to study toxicology. Environ. Toxicol. Chem. 2014, 33, 11–17. [Google Scholar] [CrossRef] [PubMed]
  27. Stahl, B.J. Early and recent primitive brain forms. Ann. N. Y. Acad. Sci. 1977, 299, 87–96. [Google Scholar] [CrossRef] [PubMed]
  28. Moser, V.C. Functional assays for neurotoxicity testing. Toxicol. Pathol. 2011, 39, 36–45. [Google Scholar] [CrossRef] [PubMed]
  29. Fleisch, V.C.; Neuhauss, S.C. Visual behavior in zebrafish. Zebrafish 2006, 3, 191–201. [Google Scholar] [CrossRef] [PubMed]
  30. Neuhauss, S.C. Behavioral genetic approaches to visual system development and function in zebrafish. J. Neurobiol. 2003, 54, 148–160. [Google Scholar] [CrossRef] [PubMed] [Green Version]
  31. Fleisch, V.C.; Neuhauss, S.C. Parallel visual cycles in the zebrafish retina. Prog. Retin. Eye Res. 2010, 29, 476–486. [Google Scholar] [CrossRef] [PubMed] [Green Version]
  32. Chen, L.; Zhang, X.; Zhou, W.; Qiao, Q.; Liang, H.; Li, G.; Wang, J.; Cai, F. The interactive effects of cytoskeleton disruption and mitochondria dysfunction lead to reproductive toxicity induced by microcystin-LR. PLoS ONE 2013, 8, e53949. [Google Scholar] [CrossRef] [PubMed]
  33. Huang, X.; Chen, L.; Liu, W.; Qiao, Q.; Wu, K.; Wen, J.; Huang, C.; Tang, R.; Zhang, X. Involvement of oxidative stress and cytoskeletal disruption in microcystin-induced apoptosis in cik cells. Aquat. Toxicol. 2015, 165, 41–50. [Google Scholar] [CrossRef] [PubMed]
  34. Redmond, T.M.; Yu, S.; Lee, E.; Bok, D.; Hamasaki, D.; Chen, N.; Goletz, P.; Ma, J.X.; Crouch, R.K.; Pfeifer, K. rpe65 is necessary for production of 11-cis-vitamin a in the retinal visual cycle. Nat. Genet. 1998, 20, 344–351. [Google Scholar] [CrossRef] [PubMed]
  35. Marlhens, F.; Bareil, C.; Griffoin, J.M.; Zrenner, E.; Amalric, P.; Eliaou, C.; Liu, S.Y.; Harris, E.; Redmond, T.M.; Arnaud, B.; et al. Mutations in rpe65 cause leber’s congenital amaurosis. Nat. Genet. 1997, 17, 139–141. [Google Scholar] [CrossRef] [PubMed]
  36. Travis, G.H.; Golczak, M.; Moise, A.R.; Palczewski, K. Diseases caused by defects in the visual cycle: Retinoids as potential therapeutic agents. Annu. Rev. Pharmacol. Toxicol. 2007, 47, 469–512. [Google Scholar] [CrossRef] [PubMed]
  37. Rajala, R.V.; Rajala, A.; Morris, A.J.; Anderson, R.E. Phosphoinositides: Minor lipids make a major impact on photoreceptor cell functions. Sci. Rep. 2014, 4, 5463. [Google Scholar] [CrossRef] [PubMed]
  38. Hu, Y.; Chen, J.; Fan, H.; Xie, P.; He, J. A review of neurotoxicity of microcystins. Environ. Sci. Pollut. Res. Int. 2016, 23, 7211–7219. [Google Scholar] [CrossRef] [PubMed]
  39. Wu, Q.; Yan, W.; Liu, C.; Li, L.; Yu, L.; Zhao, S.; Li, G. Microcystin-LR exposure induces developmental neurotoxicity in zebrafish embryo. Environ. Pollut. 2016, 213, 793–800. [Google Scholar] [CrossRef] [PubMed]
  40. Emran, F.; Rihel, J.; Dowling, J.E. A behavioral assay to measure responsiveness of zebrafish to changes in light intensities. J. Vis. Exp. 2008, 20, 923. [Google Scholar] [CrossRef] [PubMed]
  41. Kimmel, C.B.; Patterson, J.; Kimmel, R.O. The development and behavioral characteristics of the startle response in the zebra fish. Dev. Psychobiol. 1974, 7, 47–60. [Google Scholar] [CrossRef] [PubMed]
  42. Higdon, C.W.; Mitra, R.D.; Johnson, S.L. Gene expression analysis of zebrafish melanocytes, iridophores, and retinal pigmented epithelium reveals indicators of biological function and developmental origin. PLoS ONE 2013, 8, e67801. [Google Scholar] [CrossRef] [PubMed]
  43. Fleisch, V.C.; Schonthaler, H.B.; von Lintig, J.; Neuhauss, S.C. Subfunctionalization of a retinoid-binding protein provides evidence for two parallel visual cycles in the cone-dominant zebrafish retina. J. Neurosci. 2008, 28, 8208–8216. [Google Scholar] [CrossRef] [PubMed]
  44. Strauss, O. The retinal pigment epithelium in visual function. Physiol. Rev. 2005, 85, 845–881. [Google Scholar] [CrossRef] [PubMed]
  45. Rogers, E.D.; Henry, T.B.; Twiner, M.J.; Gouffon, J.S.; McPherson, J.T.; Boyer, G.L.; Sayler, G.S.; Wilhelm, S.W. Global gene expression profiling in larval zebrafish exposed to microcystin-LR and microcystis reveals endocrine disrupting effects of cyanobacteria. Environ. Sci. Technol. 2011, 45, 1962–1969. [Google Scholar] [CrossRef] [PubMed]
  46. Wang, N.; Leung, H.T.; Pak, W.L.; Carl, Y.T.; Wadzinski, B.E.; Shieh, B.H. Role of protein phosphatase 2A in regulating the visual signaling in drosophila. J. Neurosci. 2008, 28, 1444–1451. [Google Scholar] [CrossRef] [PubMed]
  47. Li, G.; Chen, J.; Xie, P.; Jiang, Y.; Wu, L.; Zhang, X. Protein expression profiling in the zebrafish (Danio rerio) embryos exposed to the microcystin-LR. Proteomics 2011, 11, 2003–2018. [Google Scholar] [CrossRef] [PubMed]
  48. Baganz, D.; Staaks, G.; Pflugmacher, S.; Steinberg, C.E. Comparative study of microcystin-LR-induced behavioral changes of two fish species, Danio rerio and Leucaspius delineatus. Environ. Toxicol. 2004, 19, 564–570. [Google Scholar] [CrossRef] [PubMed]
  49. Kist, L.W.; Piato, A.L.; da Rosa, J.G.; Koakoski, G.; Barcellos, L.J.; Yunes, J.S.; Bonan, C.D.; Bogo, M.R. Acute exposure to microcystin-producing cyanobacterium microcystis aeruginosa alters adult zebrafish (Danio rerio) swimming performance parameters. J. Toxicol. 2011, 2011, 280304. [Google Scholar] [CrossRef] [PubMed]
  50. Ahmad, F.; Noldus, L.P.J.J.; Tegelenbosch, R.A.J.; Richardson, M.K. Zebrafish embryos and larvae in behavioural assays. Behaviour 2012, 149, 1241–1281. [Google Scholar] [CrossRef]
  51. Baran, R.; Castelblanco, L.; Tang, G.; Shapiro, I.; Goncharov, A.; Jin, Y. Motor neuron synapse and axon defects in a C. elegans alpha-tubulin mutant. PLoS ONE 2010, 5, e9655. [Google Scholar] [CrossRef] [PubMed]
  52. Rihel, J.; Prober, D.A.; Arvanites, A.; Lam, K.; Zimmerman, S.; Jang, S.; Haggarty, S.J.; Kokel, D.; Rubin, L.L.; Peterson, R.T.; et al. Zebrafish behavioral profiling links drugs to biological targets and rest/wake regulation. Science 2010, 327, 348–351. [Google Scholar] [CrossRef] [PubMed]
  53. Connon, R.E.; Geist, J.; Pfeiff, J.; Loguinov, A.V.; D’Abronzo, L.S.; Wintz, H.; Vulpe, C.D.; Werner, I. Linking mechanistic and behavioral responses to sublethal esfenvalerate exposure in the endangered delta smelt; Hypomesus transpacificus (Fam. Osmeridae). BMC Genom. 2009, 10, 608. [Google Scholar] [CrossRef] [PubMed] [Green Version]
  54. Deeti, S.; O’Farrell, S.; Kennedy, B.N. Early safety assessment of human oculotoxic drugs using the zebrafish visualmotor response. J. Pharmacol. Toxicol. Methods 2014, 69, 1–8. [Google Scholar] [CrossRef] [PubMed]
  55. Kimmel, C.B.; Ballard, W.W.; Kimmel, S.R.; Ullmann, B.; Schilling, T.F. Stages of embryonic development of the zebrafish. Dev. Dyn. 1995, 203, 253–310. [Google Scholar] [CrossRef] [PubMed]
Figure 1. Effects of microcystin-LR (MCLR) exposure on protein phosphatase 2A (PP2A) activity. (A) PP2A activity was measured in control and larvae exposed to 500 μg/L of MCLR, as described in the Materials and Methods section. Protein phosphatase 2A activity was expressed as nmol of free PO4−3 released per min using increasing amounts of total protein (μg). The data are indicated as mean ± SE obtained from three independent experiments (p < 0.05); (B) Relative PP2A specific activity of MCLR group vs. control. Control was set to 100%.
Ijms 18 00365 g001
Figure 2. Gene expression profiling of MCLR exposed larvae (A) microarray analysis. Differentially expressed genes in zebrafish larvae treated with 500 μg/L of MCLR involved in the retinoid visual cycle, p < 0.05. (B) The retinoid visual cycle. Briefly, absorption of light by visual pigments causes isomerization of 11-cis-retinal to all-trans-retinal, resulting in phototransduction. All-trans-retinal is reduced to all-trans-retinol and transported into the retinal pigment epithelium (RPE). LRAT esterifies all-trans-retinol to all-trans-retinyl esters, which are further processed to 11-cis-retinol by RPE65. RLBP1 removes 11-cis-retinol from the reaction site to speed the isomerization. RDH5 converts 11-cis-retinol to 11-cis-retinal. STRA6 receptor mediates all-trans-retinol uptake through the plasma membrane. Red check marks indicate the visual cycle-related genes detected in MCLR-treated larvae by microarray analysis. (C) Validation of microarray data by quantitative real-time PCR (qPCR) analysis. Relative mRNA expression of rpe65a, rlbp1a, rlbp1b, rgrb, lrata, stra6, and inpp5kb (inositol polyphosphate-5-phosphatase Kb) at a four-day exposure of larvae to 50 μg/L and 500 μg/L of MCLR. Three biological replicates were run in triplicate. The mRNA expression levels are expressed in relation to the control which is set to 1. * p < 0.05 and ** p < 0.01. RBP: Retinol binding protein.
Ijms 18 00365 g002
Figure 3. Behavioral patterns of MCLR-treated zebrafish larvae. The locomotor activity displayed by controls (0.05% ethanol) and treated larvae with 100 µg/L and 500 µg/L of MCLR is represented by the total distance covered in 2 min time bins. Tracking was performed under variable lighting conditions. Light phases correspond to 0–10 min and 20–30 min and dark phases to 10–20 min and 30–40 min time periods. * p < 0.05, ** p < 0.01, and *** p < 0.001 comparing each treatment to the control group.
Ijms 18 00365 g003
Table 1. Microarray analysis. List of differentially expressed genes top ranked based on fold-change that were differentially expressed, by microarray analysis, upon exposure of three days post-fertilization (dpf) zebrafish larvae to 500 μg/L MCLR for four days, p ≤ 0.05.
Transcript IDGene SymbolGene DescriptionNCBI Gene IDp-ValueFold Change
Upregulated genes
13122067tm6sf2transmembrane 6 superfamily member 27911793.21 × 10−22.95
12945361zgc:194355 (lrat-like)zgc:194355 (lecithin retinol acyltransferase-like)5565753.15 × 10−22.65
13223317rdh20retinol dehydrogenase 20 5558641.42 × 10−22.42
13085946rpe65aretinal pigment epithelium-specific protein 65a3937247.28 × 10−32.39
12985711gch2GTP cyclohydrolase 2642639.80 × 10−42.14
13263303dctdopachrome tautomerase580741.50 × 10−22.13
13156297rlbp1bretinaldehyde binding protein 1b4029906.80 × 10−32.13
13135621pmelbpremelanosome protein b5628106.42 × 10−32.06
13305424slc16a8solute carrier family 16 (monocarboxylate transporter), member 85578843.47 × 10−21.96
13112995LOC103911087uncharacterized LOC1039110871039110877.87 × 10−31.95
12968503inpp5kbinositol polyphosphate-5-phosphatase Kb5661882.05 × 10−31.91
13126385rdh5retinol dehydrogenase 5 (11-cis/9-cis)5565283.12 × 10−21.91
13279630stra6stimulated by retinoic acid 6 7240072.31 × 10−21.73
12972154pmelapremelanosome protein a3212391.63 × 10−31.72
12946322tyrp1btyrosinase-related protein 1b4370226.72 × 10−51.70
13284986/
13022340
tyrtyrosinase302079.79 × 10−3
5.54 × 10⁻³
1.69
1.55
13156897stra6stimulated by retinoic acid 67240077.76 × 10−31.68
12988859si:ch1073-13h15.3 (LOC563241)si:ch1073-13h15.3 (putative all-trans-retinol 13,14-reductase)5632412.07 × 10−21.68
13109427slc45a2solute carrier family 45, member 25583113.11 × 10−21.66
13129757LOC101882639uncharacterized LOC1018826391018826393.57 × 10−21.66
13133349LOC566587Erb-b2 receptor tyrosine kinases (ERBB) receptor feedback inhibitor1-like5665871.79 × 10−21.60
13182209si:dkey-31f5.1 (slc26a3.2)solute carrier family 26 (anion exchanger), member 3, tandem duplicate 25638969.96 × 10−31.59
13274399bco1lβ-carotene oxygenase 1, like3935802.98 × 10−21.57
12994027rgrbretinal G protein coupled receptor b5541423.02 × 10−21.56
13054709LOC100535423urokinase plasminogen activator surface receptor-like1005354231.69 × 10−21.56
13216589mct1b (slc16a1a)solute carrier family 16 (monocarboxylate transporter), member 1a1005347524.29 × 10−21.55
13233501tyrp1atyrosinase-related protein 1a1003331457.52 × 10−41.51
13071881slc39a4solute carrier family 39 (zinc transporter), member 45627624.36 × 10−21.51
12958158zgc:154142zgc:1541425554811.50 × 10−21.50
13215240oca2oculocutaneous albinism II5674195.33 × 10−31.50
Downregulated genes
13089117sepp1bselenoprotein P, plasma, 1b7914795.75 × 10−30.66
13124494/
13279064
cpceruloplasmin847027.16 × 10−3
2.04 × 10⁻²
0.66
0.66
12993720LOC568930uncharacterized LOC5689305689303.97 × 10−20.64
13185986LOC100331497U2 small nuclear ribonucleoprotein auxiliary factor 35 kDa subunit-related protein 1-like1003314971.11 × 10−3
4.63 × 10⁻²
0.64
0.56
13269248/
13285056
ttn.2 (ttna)titin, tandem duplicate 2 (titin a)3177311.54 × 10−2
4.63 × 10⁻²
0.63
0.56
13269083ttnbtitin b1000016841.40 × 10−20.63
13070223si:ch211-250g4.3si:ch211-250g4.35577723.90 × 10−20.63
12959767LOC100330916uncharacterized LOC1003309161003309163.61 × 10−20.60
13283642si:dkey-7c18.24si:dkey-7c18.245629503.36 × 10−30.60
13037425si:dkey-8k3.2si:dkey-8k3.27946353.54 × 10−20.60
13191393LOC100004951stonus toxin subunit β-like (neoverrucotoxin subunit beta-like)1000049512.96 × 10−20.60
13002727si:ch211-270n8.1si:ch211-270n8.17924673.27 × 10−20.59
13283794zgc:172075zgc:1720755558754.83 × 10−20.58
13104731si:dkey-1j5.4si:dkey-1j5.45639493.26 × 10−30.54
13072283si:ch211-133n4.9si:ch211-133n4.91000000612.22 × 10−20.53
12993635zmp:0000001031 (LOC568241)zmp:0000001031 (uncharacterized LOC568241)5682413.33 × 10−20.44
13282574/
13284122
lgals1l1lectin, galactoside-binding, soluble, 1 (galectin 1)-like 13267064.84 × 10−3
4.84 × 10⁻³
0.33
0.33
13076755grn2granulin 23365754.55 × 10−20.32
13121248krt96keratin 963215023.79 × 10−20.26
NCBI: National Center for Biotechnology Information.
Table 2. List of primers used for qPCR analysis.
Gene SymbolGene IDForward Primer (5′–3′) Reverse Primer (5′–3′)
stra6724007CAAGCAATTGTTGTGTTTTGTGTCTGGTGGGATAACTTCGACAGG
lrata553239TACGCGTCGATTCGGTTGAATTACAAAACTTGTCGGTCTGCTC
rpe65a393724AGAGACGGGACGGTCTACAACCGTCATCCCAAAACTGTGC
rlbp1a393678TTGAACATCTGACTGTGAAAGACCGCCTGCCTTGTCTTTAATCATGG
rlbp1b402990TGAGCTTGCTAAAGGTGTTCAGGTCAGGATAATCCCGTCTGAAGC
rgrb554142GGAGCTTTAAAACGCGCACACTCTCGAACCCTGAGGAACG
inpp5k566188GGTTTGTATAAGCCATAGCAAGATGGTGCAATCTGAAGGACTCTCTG
tyr30207GCGCTGGAAGGTTTTGCTAATAAATGGGGTCGTTGGCAGAT
dct58074TGTCTAAAGAGTGCTGCCCGCCGGCAAAGTTTCCAAAGCA
pmela321239CTCCTGCTCCAGTTACAGATGACGTTGGCTACAACTCCCTCC
pmelb562810CACACAGTTTCACGAAGGCGGCCAGTATTTGCCCCAGGTT
cp84702GAAAGAAAGCCCAGGCAACGATATCGGCGGTCCTCTCCTT
sepp1b791479TCTACAGTGGTTGAAGTCCAGCTCCTCGAACCACTGCTTTCC
tuba1b373080AATCACCAATGCTTGCTTCGAGCCTTCACGTCTTTGGGTACCACGTCA

