
Photoluminescent Gold Nanoclusters in Cancer Cells: Cellular Uptake, Toxicity, and Generation of Reactive Oxygen Species

 and
and 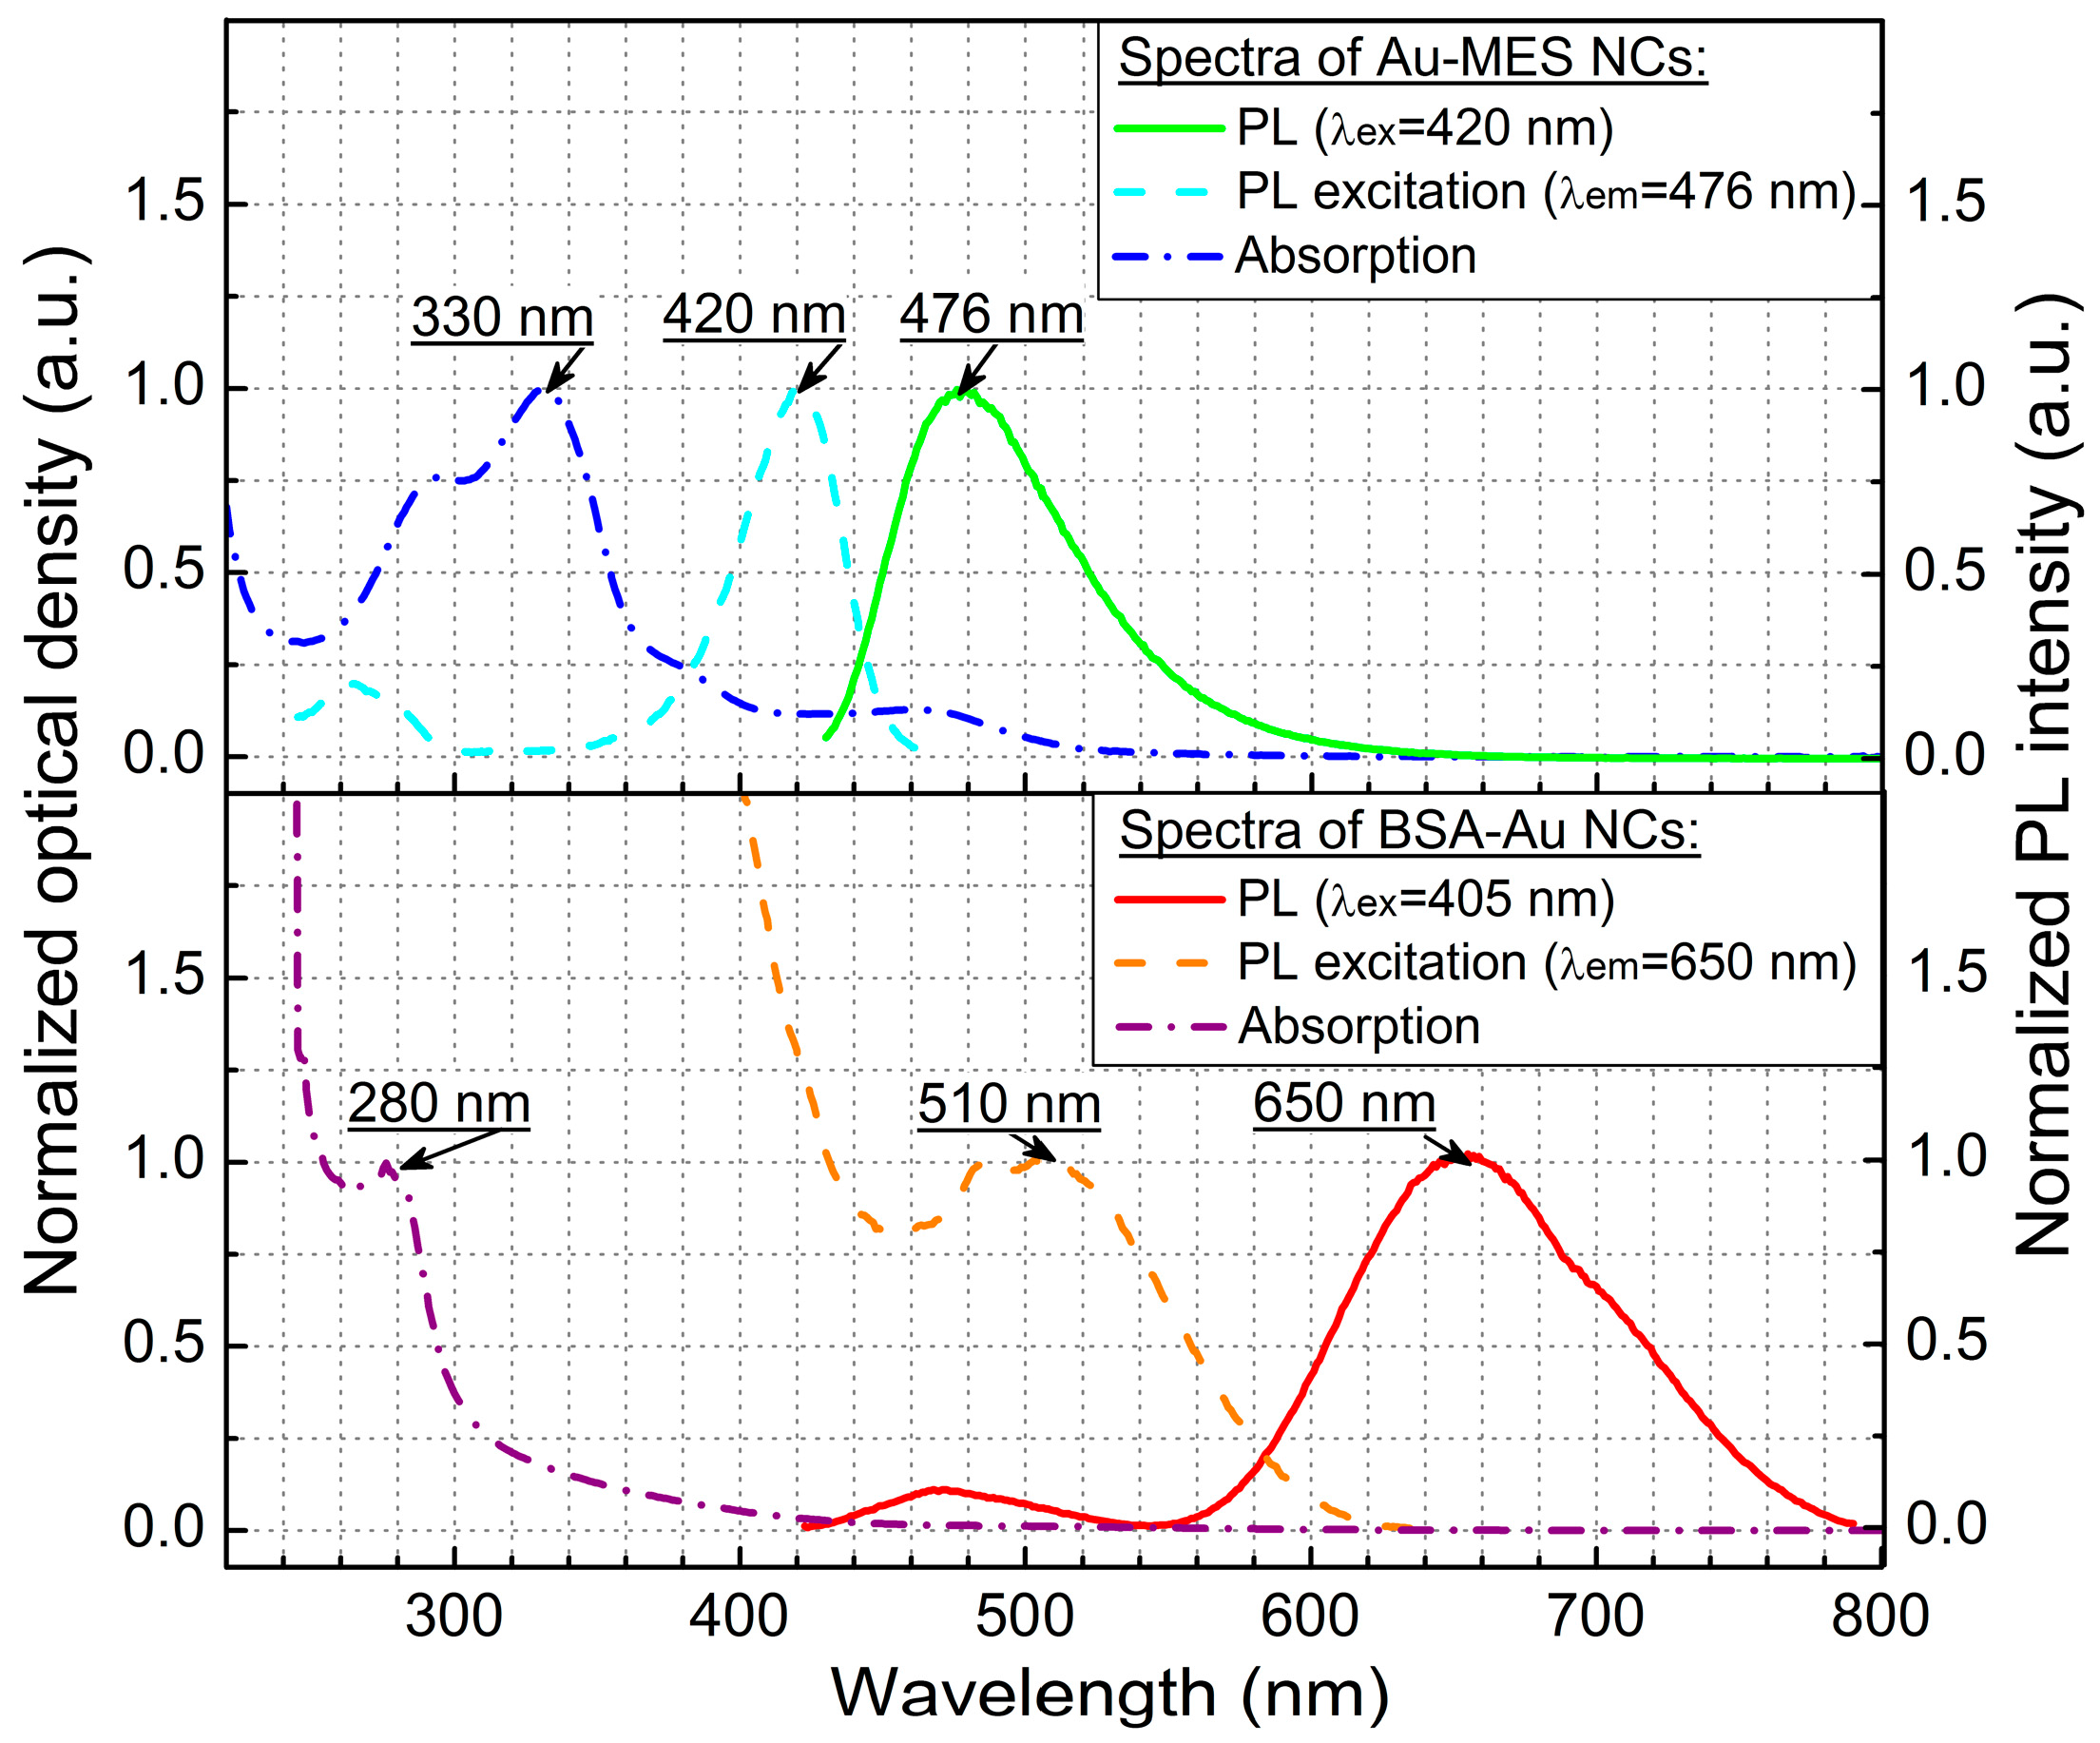
Abstract
:1. Introduction
2. Results
2.1. Spectrometric Characteristics of Au NCs
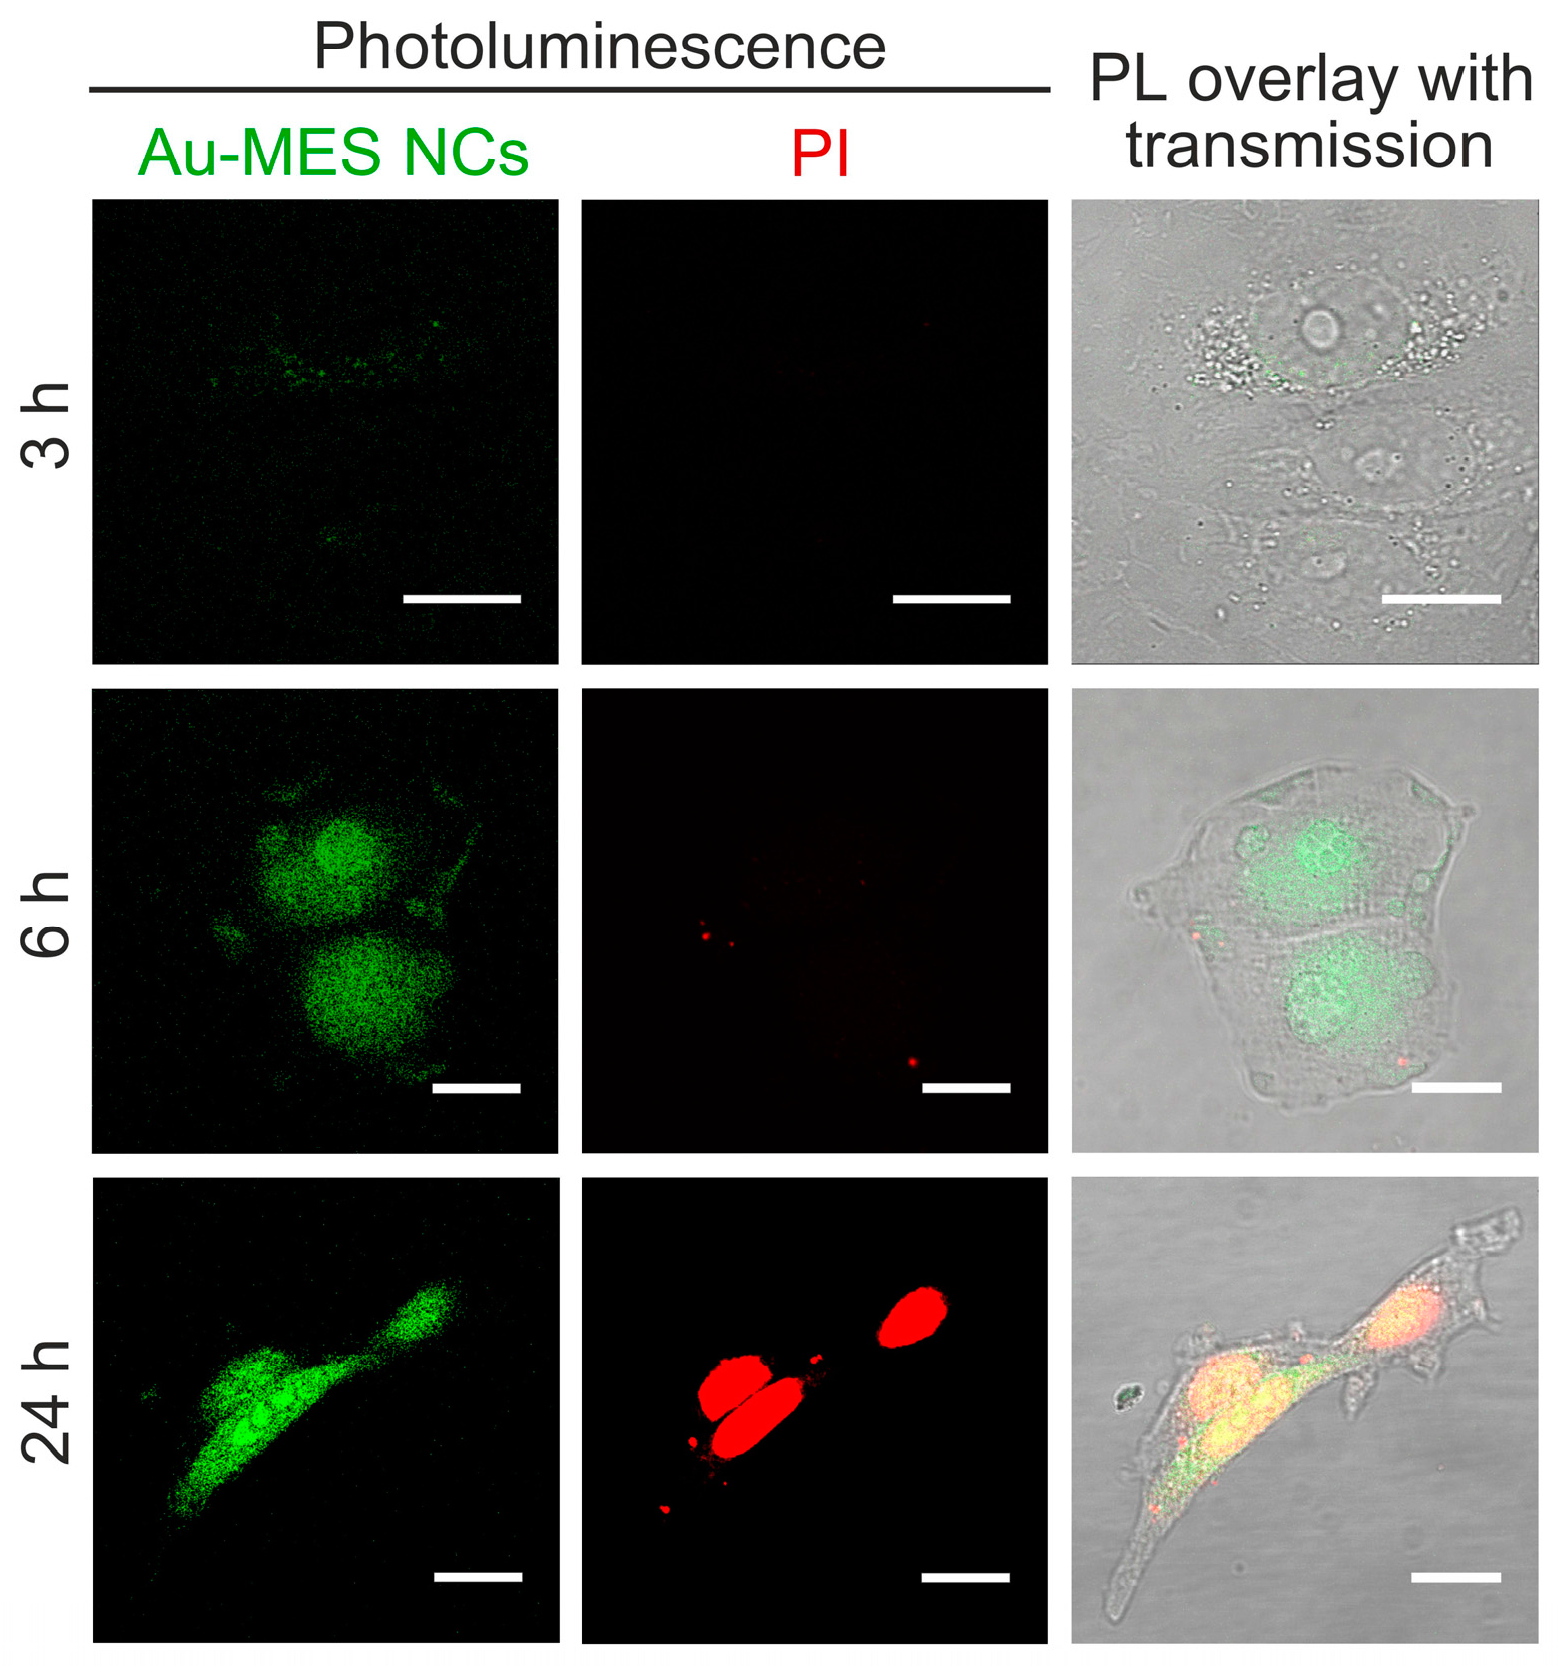
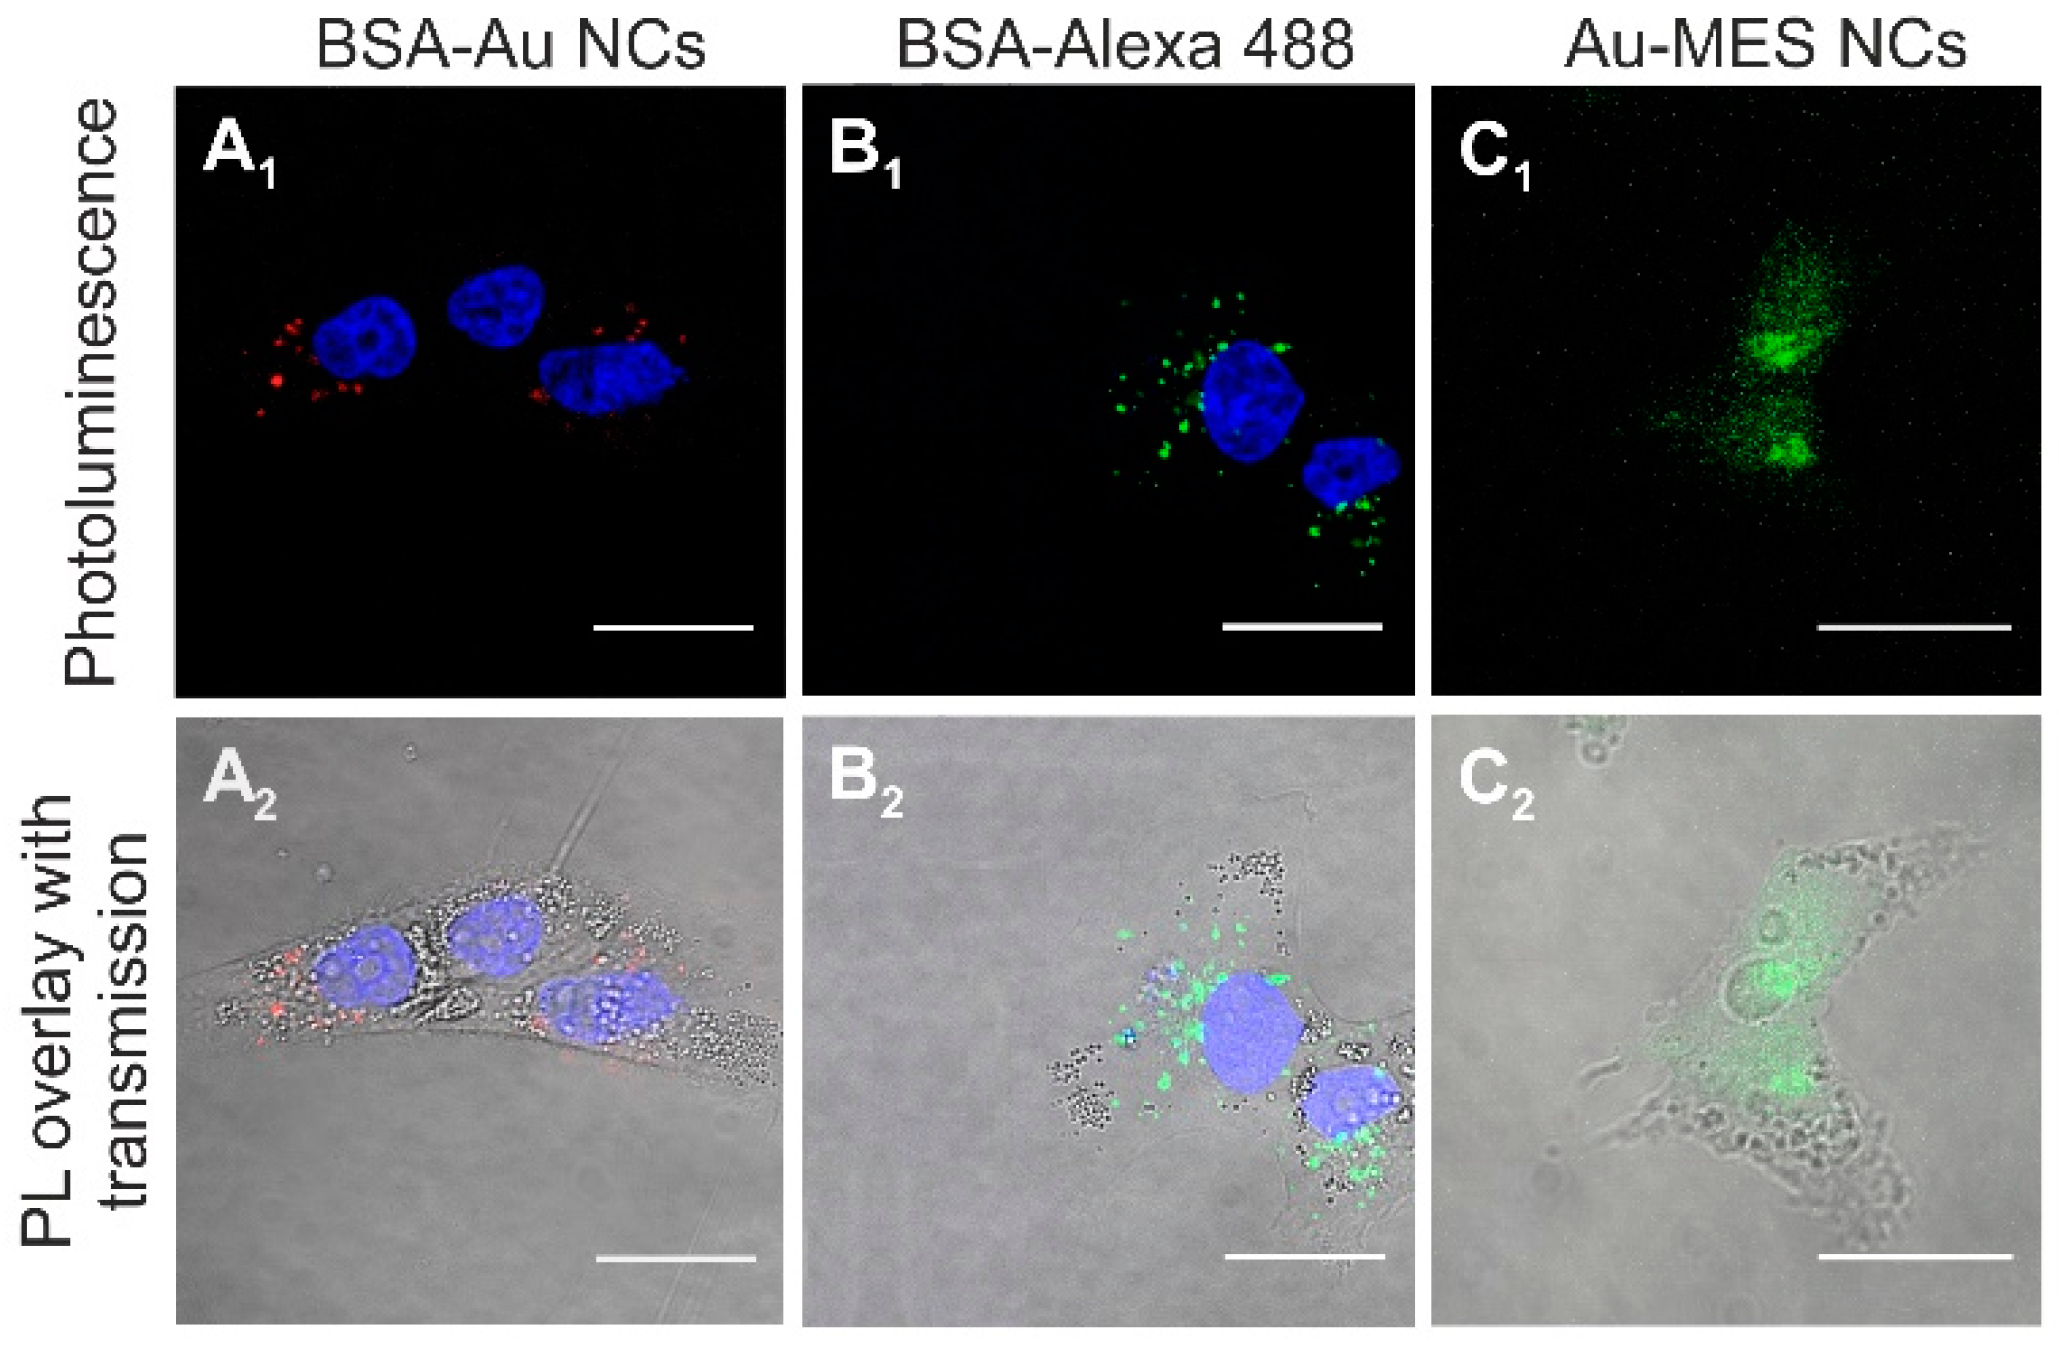
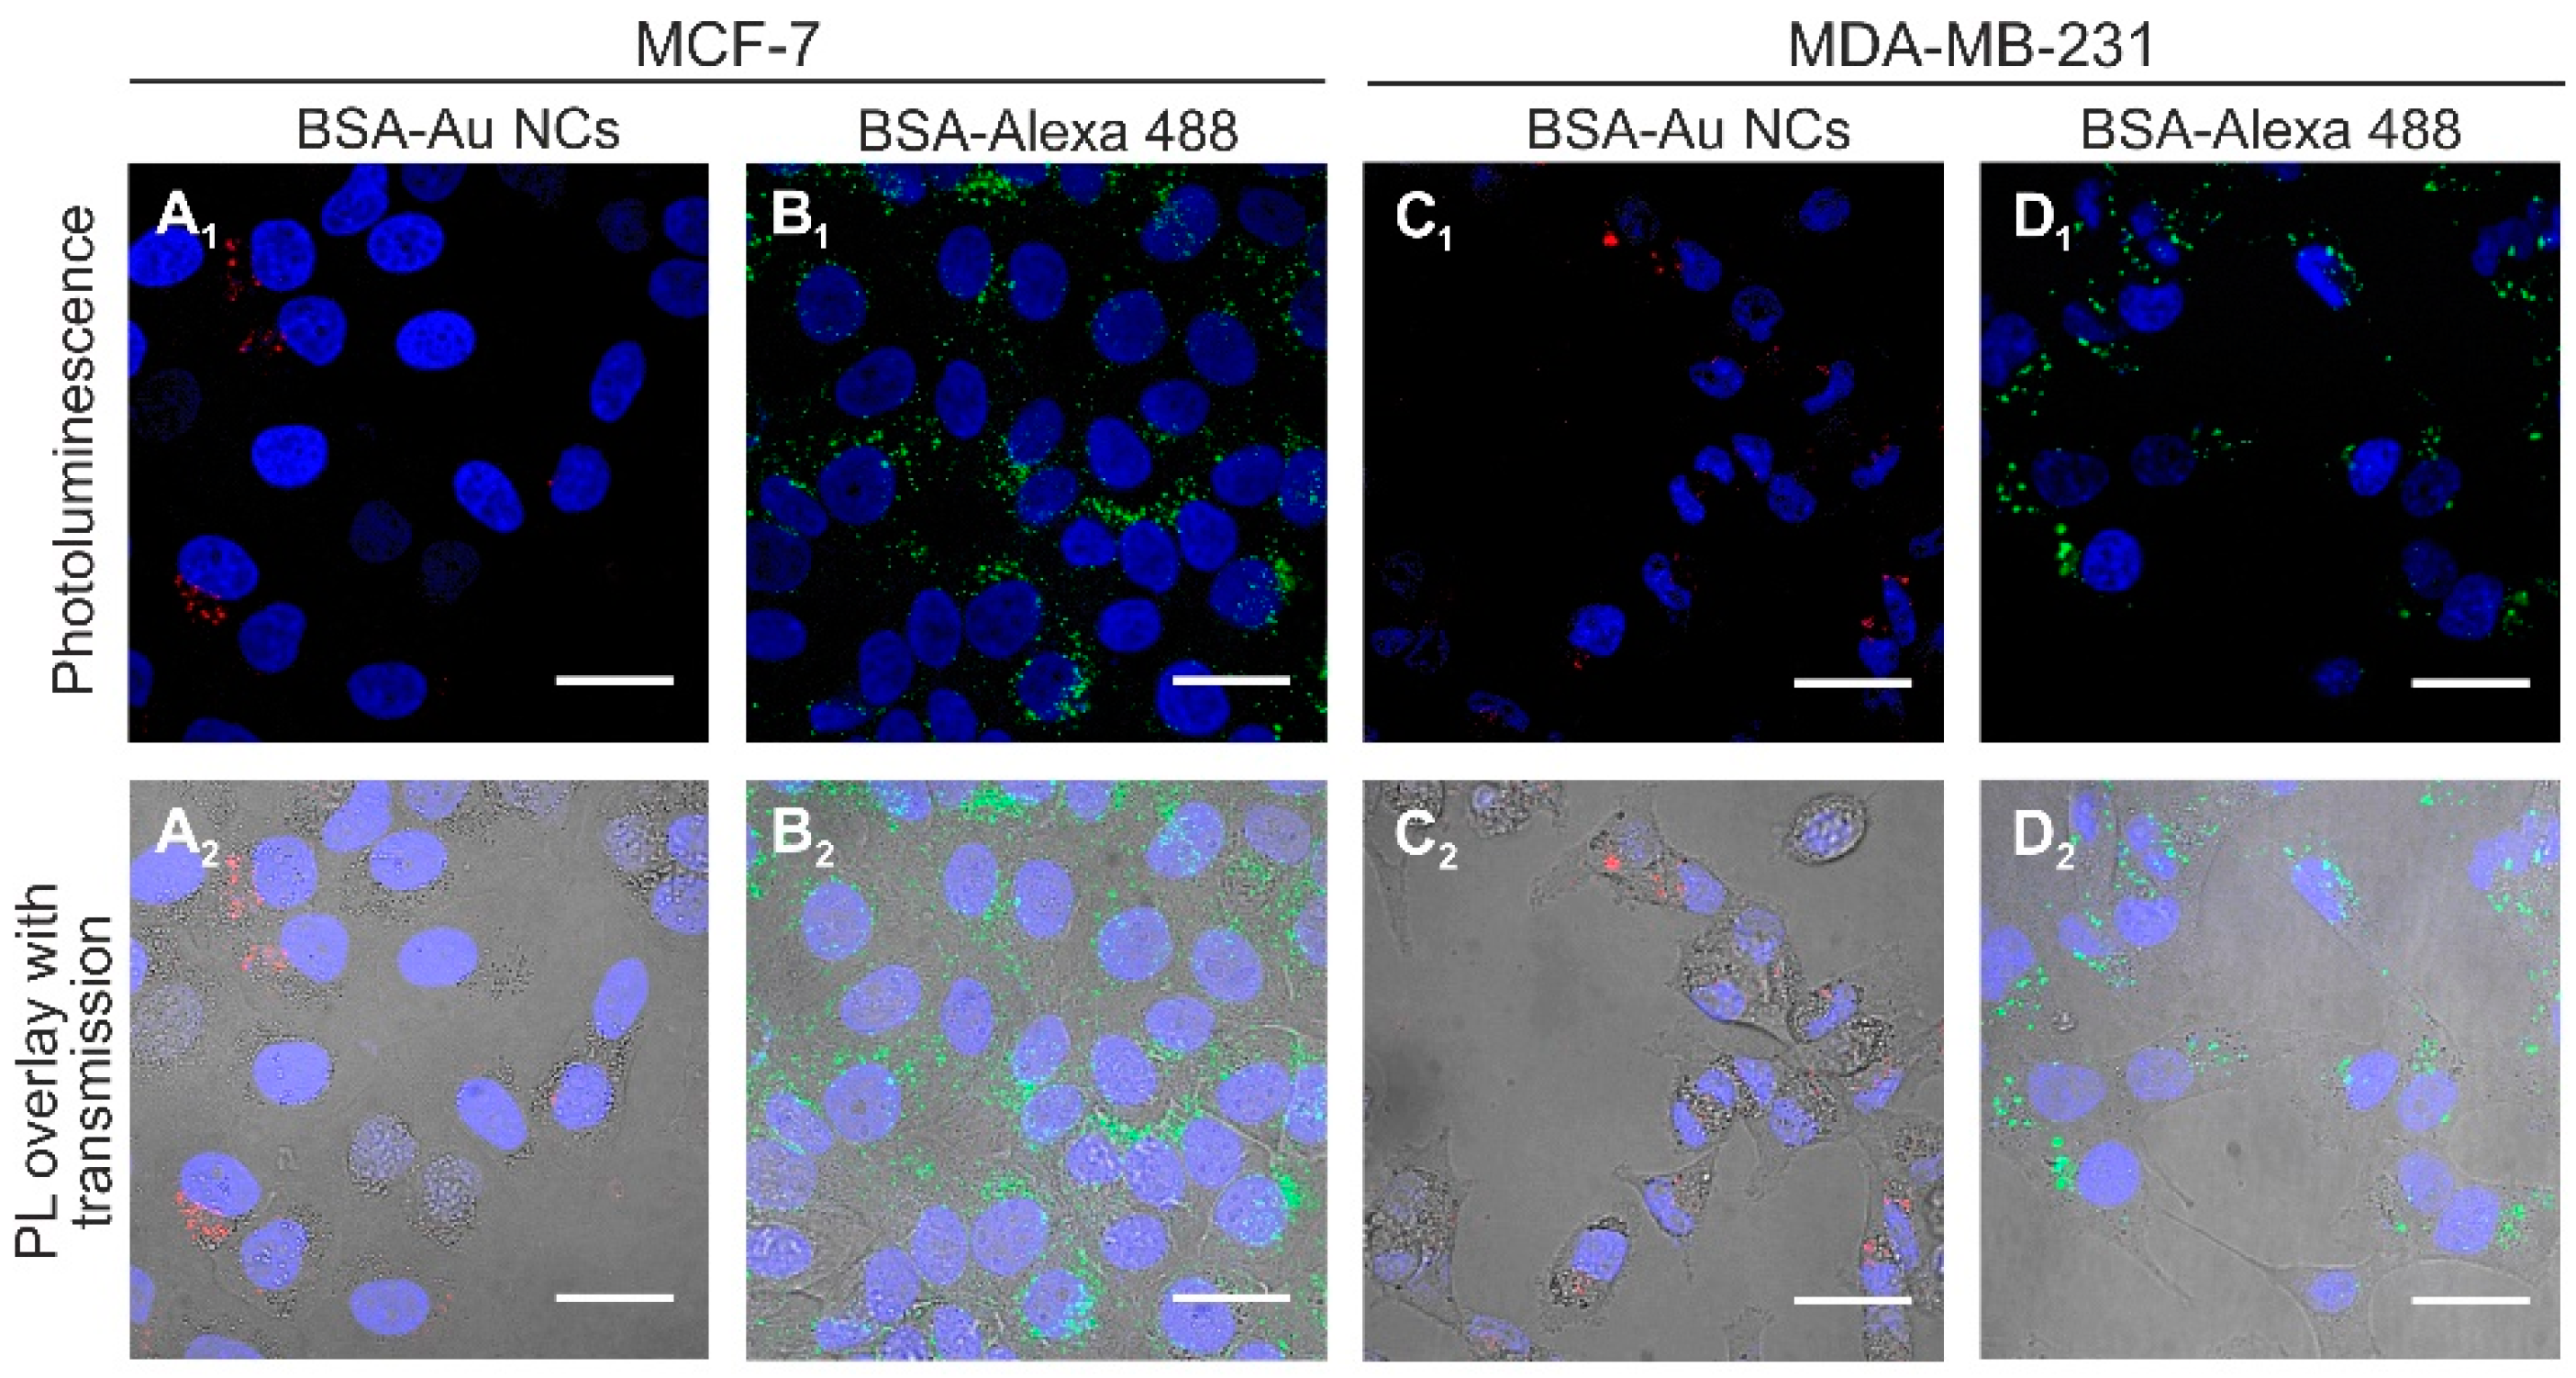
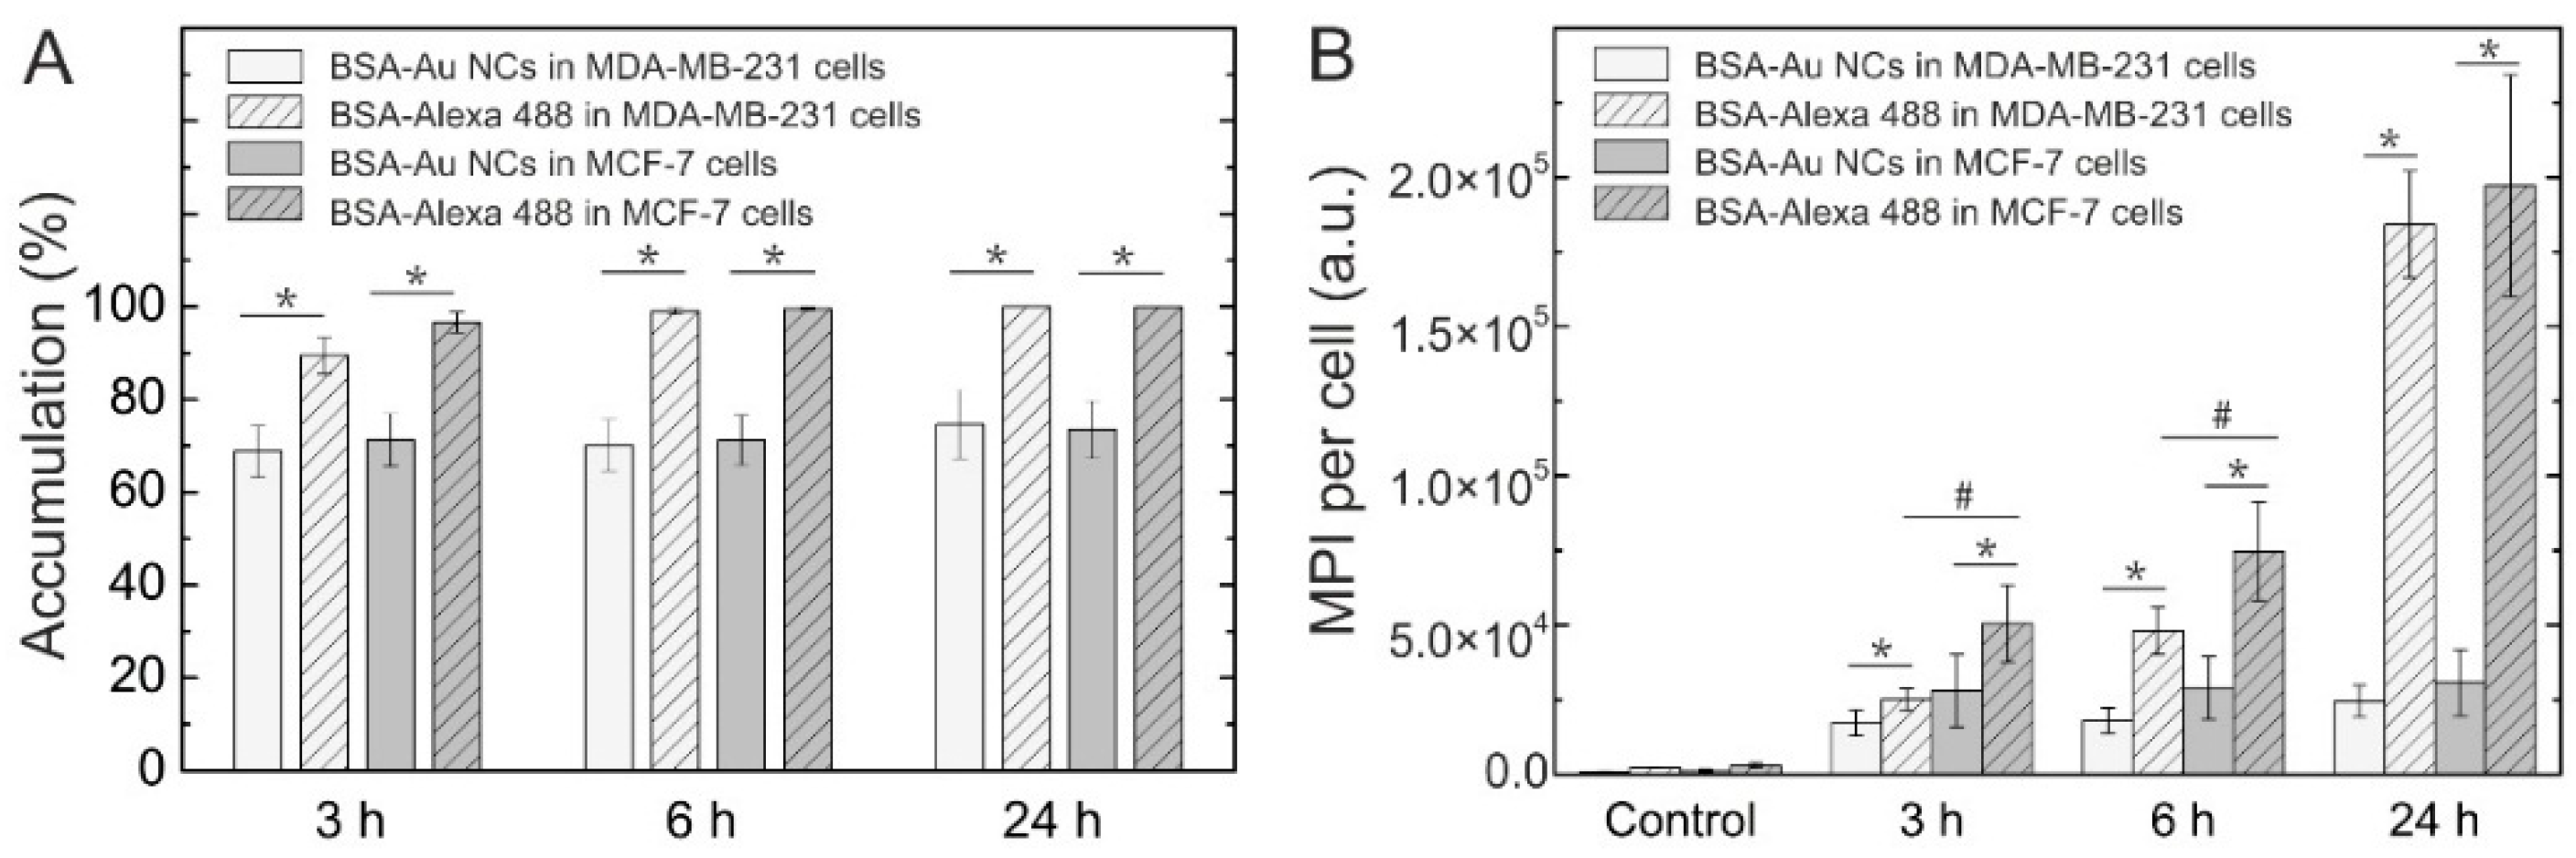
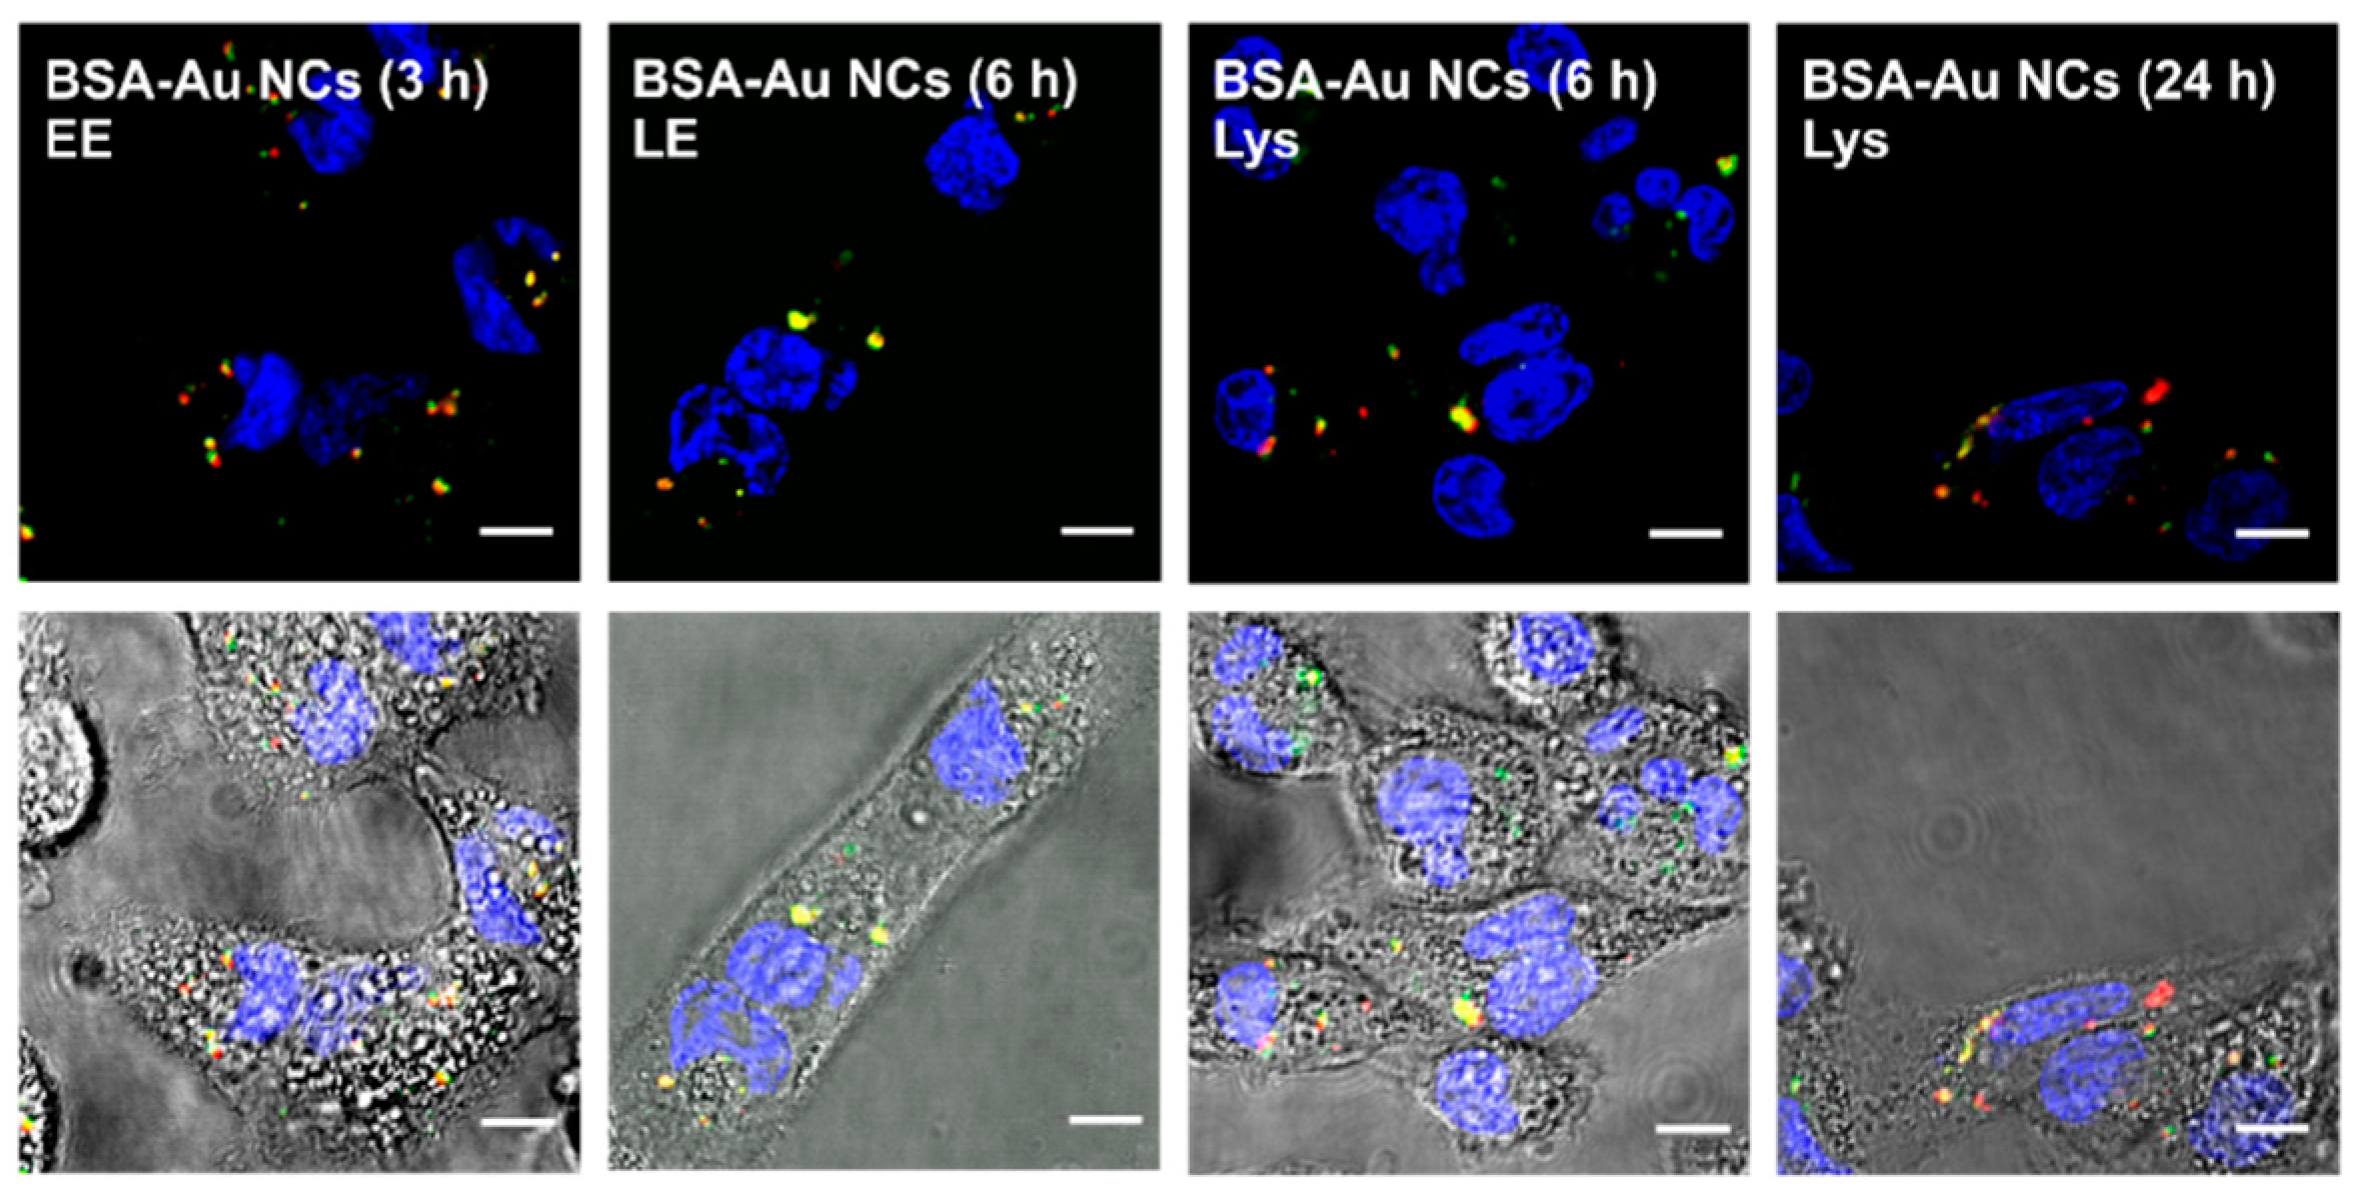
2.2. Accumulation of Au NCs in Live Cancer Cells
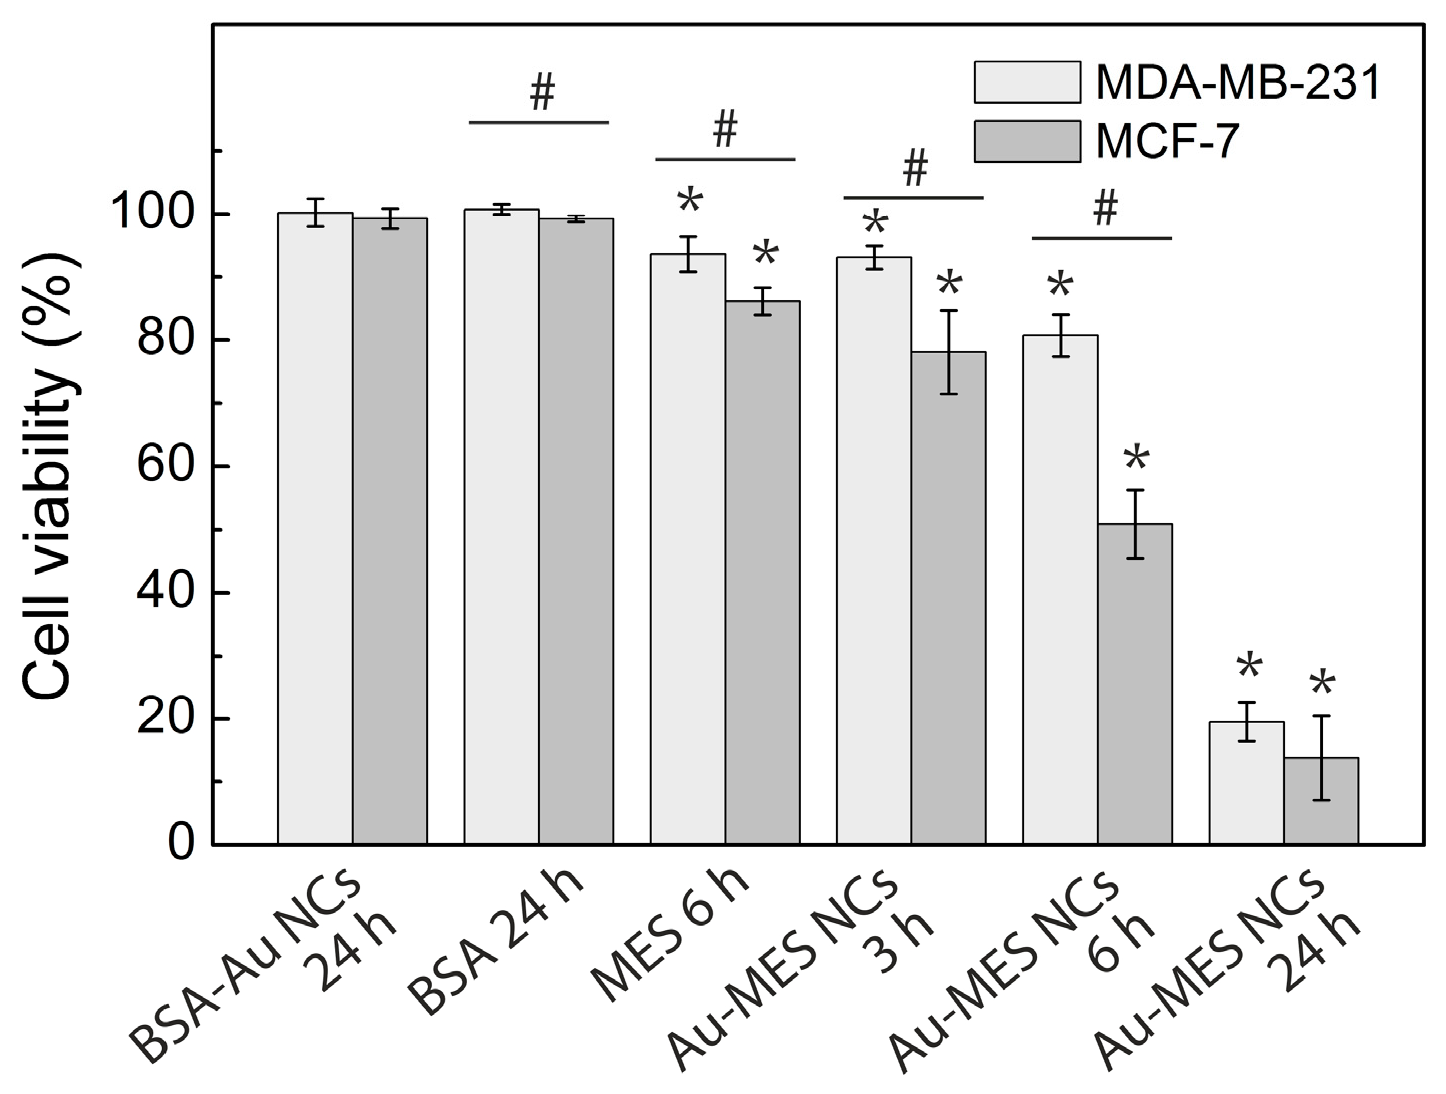
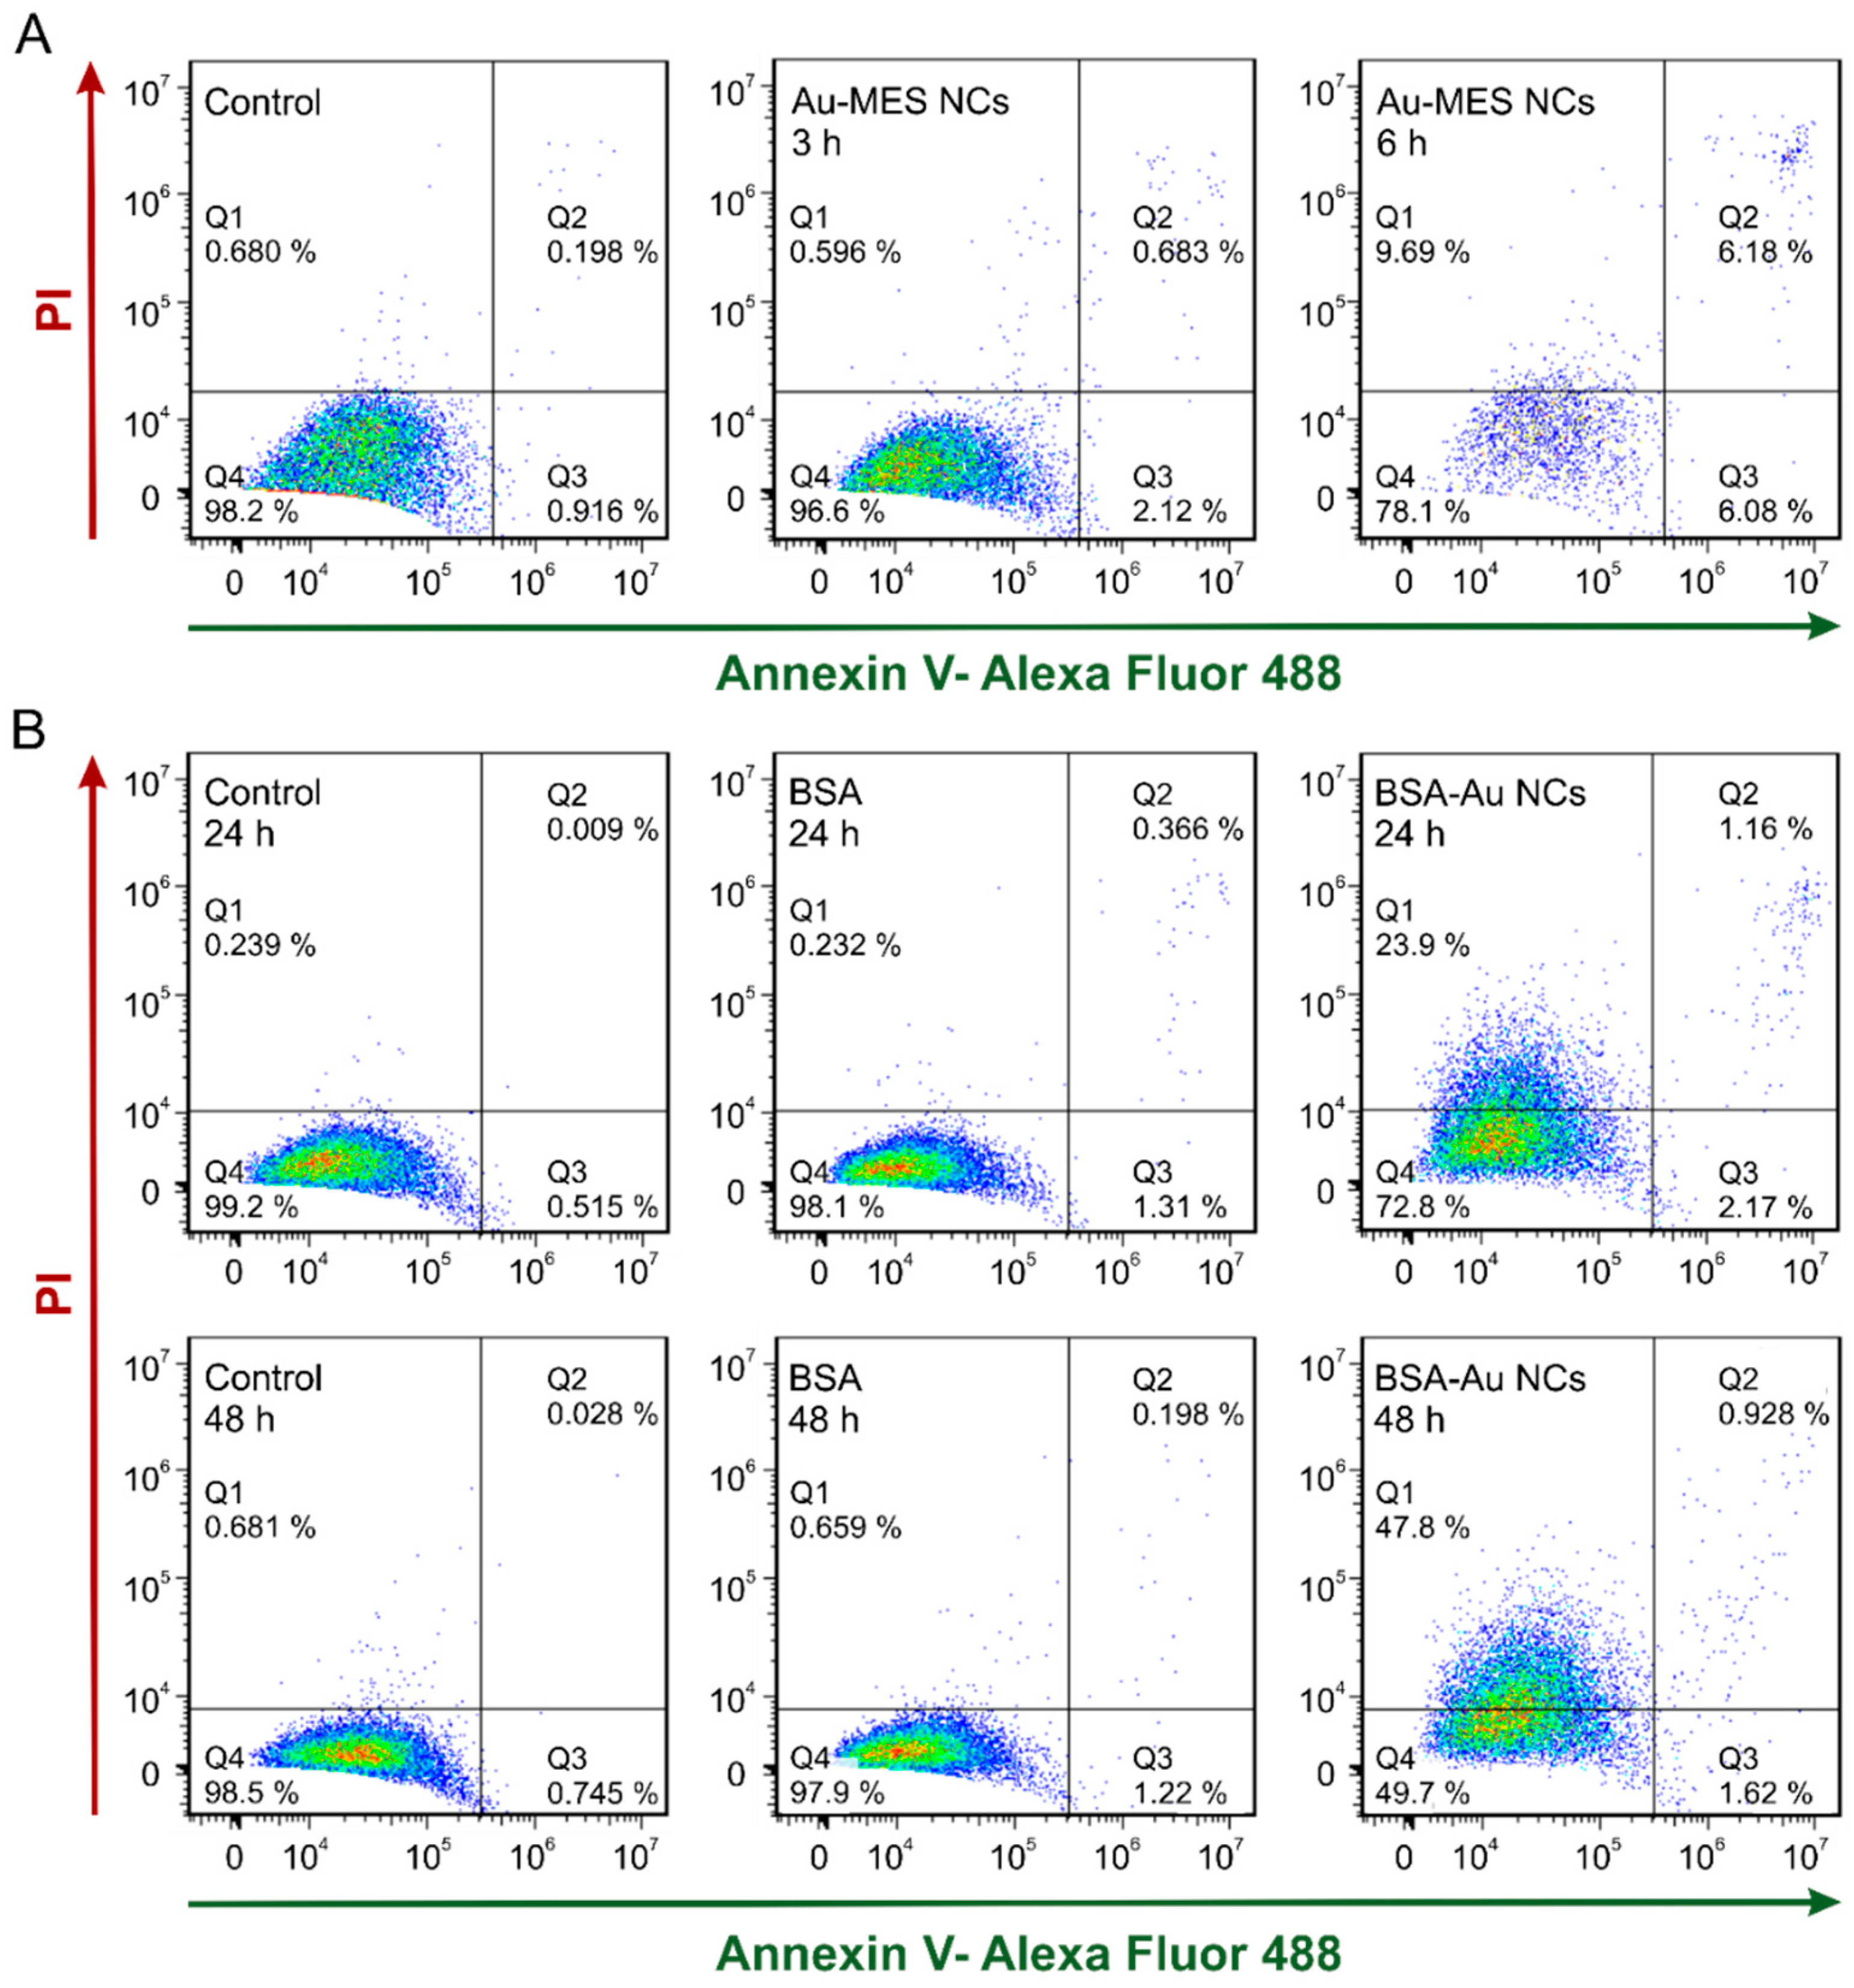
2.3. Cytotoxicity of Au NCs
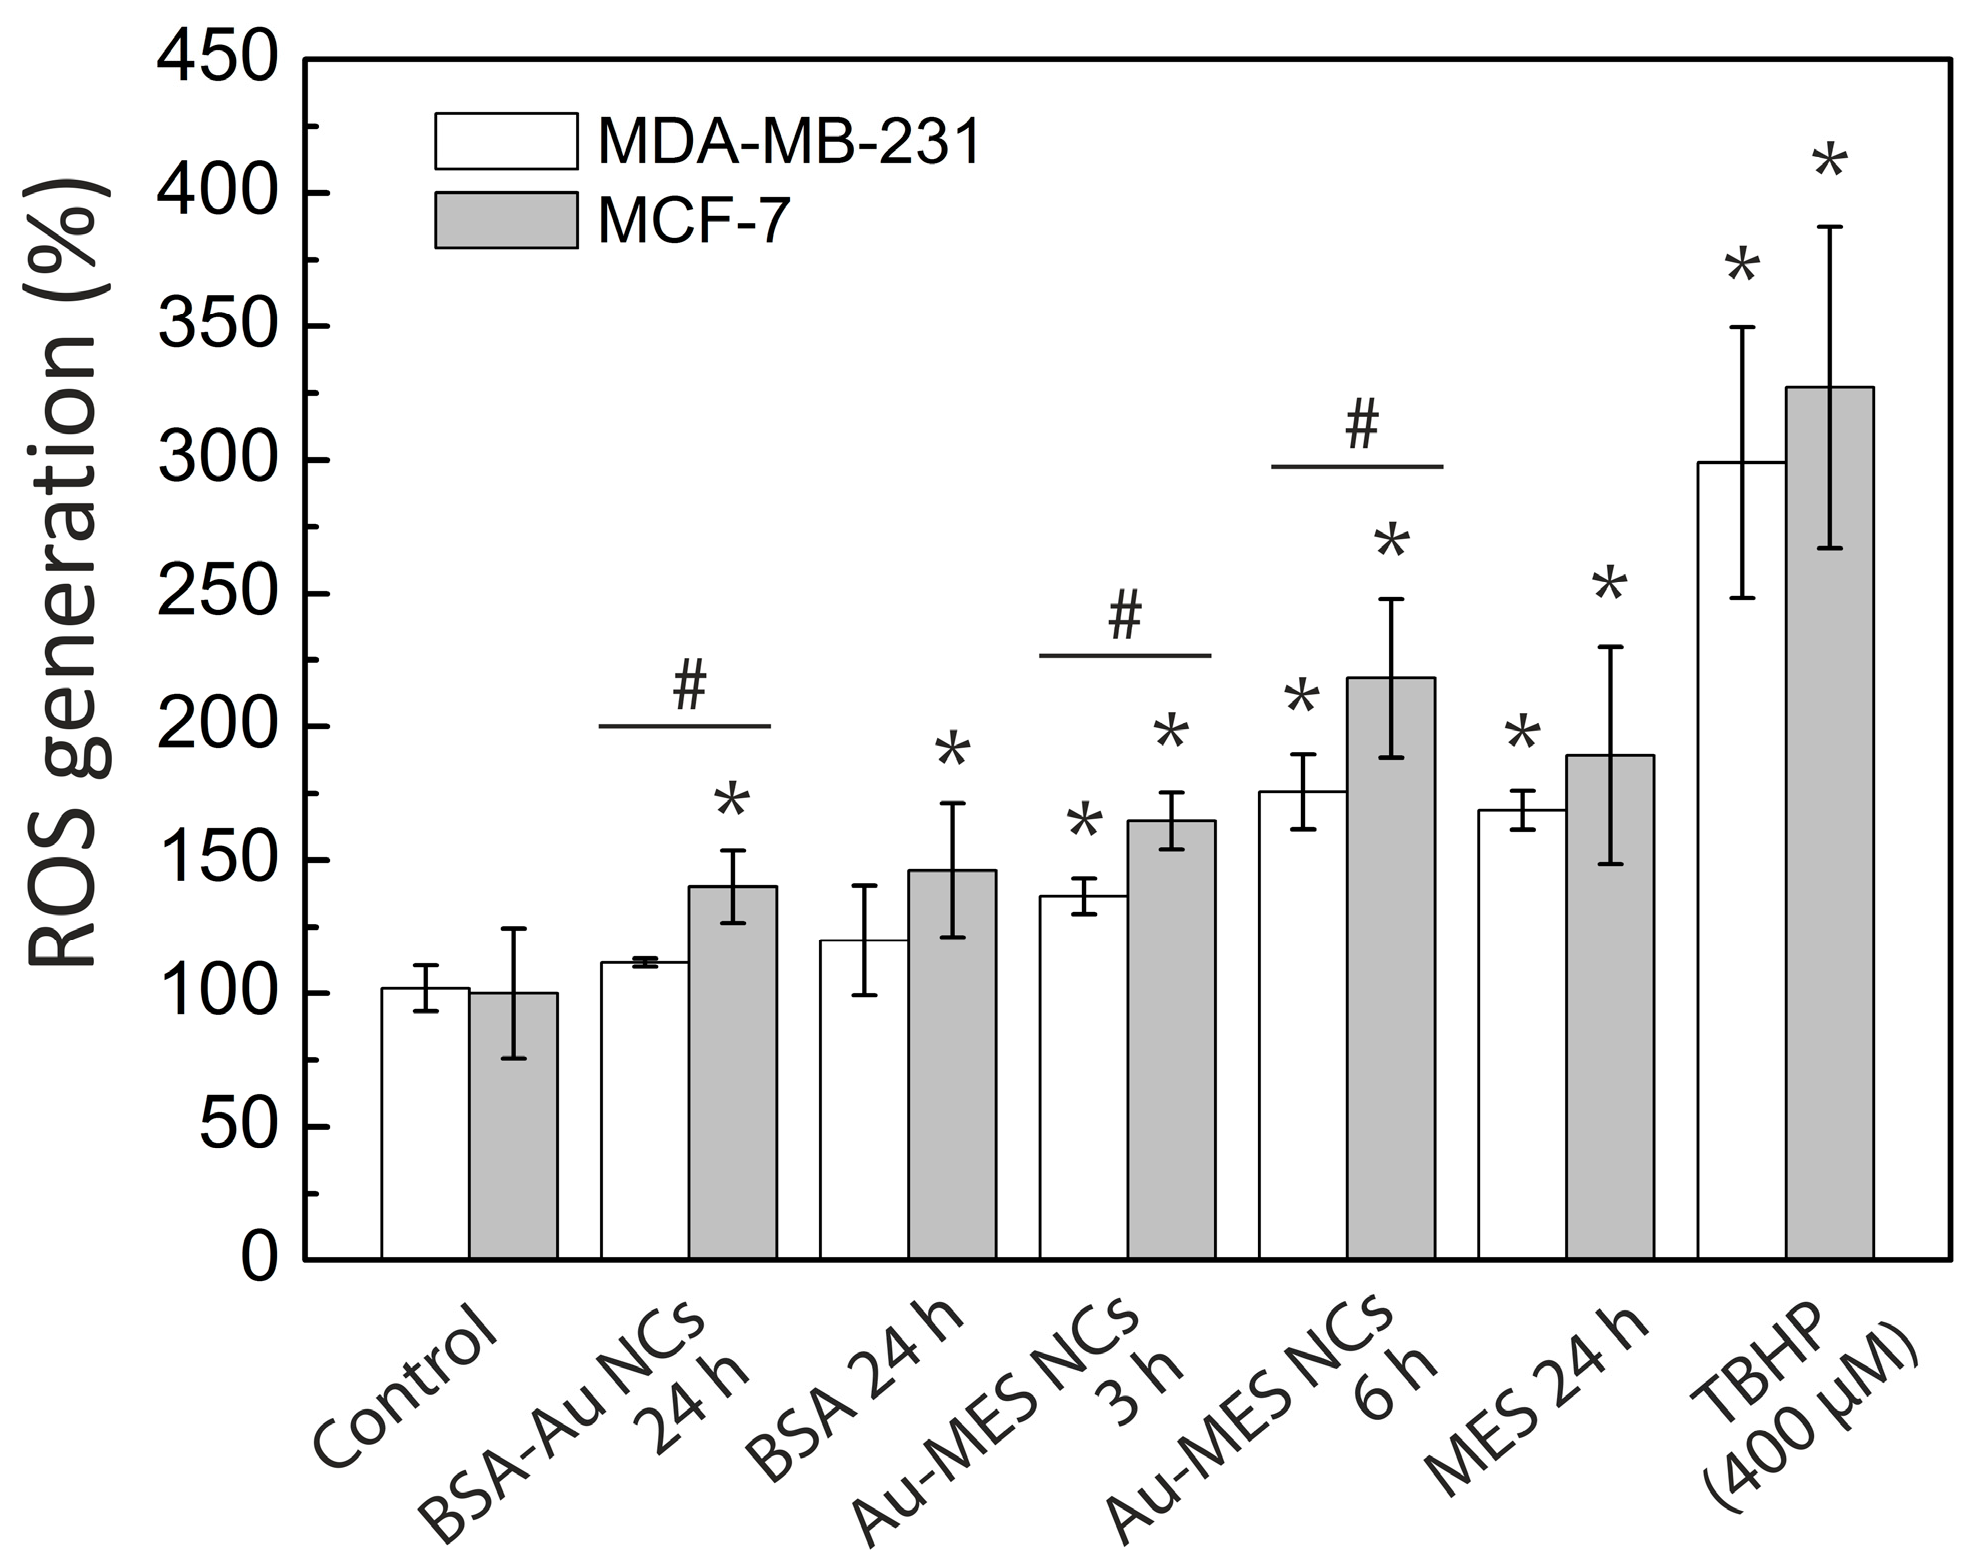
2.4. ROS Generation of Au NCs in Cancer Cells
3. Discussion
4. Materials and Methods
4.1. Chemicals
4.2. Synthesis of BSA-Au NCs
4.3. Synthesis of Au-MES NCs
4.4. Spectrometric Measurements
4.5. Cell Culturing
4.6. Transfection Assay
4.7. Treatment of Cancer Cells with Au NCs
4.8. Imaging of Au NCs in Cancer Cells
4.9. Cell Viability Assay
4.10. Apoptosis Assay
4.11. Quantitative Evaluation of Au NCs Accumulation in Cells and ROS Generation
4.12. Statistical Analysis
5. Conclusions
Acknowledgments
Author Contributions
Conflicts of Interest
References
- Liu, J.L.; Lu, L.L.; Xu, S.Y.; Wang, L.Y. One-pot synthesis of gold nanoclusters with bright red fluorescence and good biorecognition abilities for visualization fluorescence enhancement detection of E. coli. Talanta 2015, 134, 54–59. [Google Scholar] [CrossRef] [PubMed]
- Chen, T.H.; Tseng, W.L. (Lysozyme type VI)-stabilized Au8 clusters: Synthesis mechanism and application for sensing of glutathione in a single drop of blood. Small 2012, 8, 1912–1919. [Google Scholar] [CrossRef] [PubMed]
- Chen, L.Y.; Wang, C.W.; Yuan, Z.Q.; Chang, H.T. Fluorescent gold nanoclusters: Recent advances in sensing and imaging. Anal. Chem. 2015, 87, 216–229. [Google Scholar] [CrossRef] [PubMed]
- Shang, L.; Stockmar, F.; Azadfar, N.; Nienhaus, G.U. Intracellular thermometry by using fluorescent gold nanoclusters. Angew. Chem. Int. Edit. 2013, 52, 11154–11157. [Google Scholar] [CrossRef] [PubMed]
- Chen, D.Y.; Luo, Z.T.; Li, N.J.; Lee, J.Y.; Xie, J.P.; Lu, J.M. Amphiphilic polymeric nanocarriers with luminescent gold nanoclusters for concurrent bioimaging and controlled drug release. Adv. Funct. Mater. 2013, 23, 4324–4331. [Google Scholar] [CrossRef]
- Chen, H.Y.; Li, B.W.; Ren, X.Y.; Li, S.N.; Ma, Y.X.; Cui, S.S.; Gu, Y.Q. Multifunctional near-infrared-emitting nano-conjugates based on gold clusters for tumor imaging and therapy. Biomaterials 2012, 33, 8461–8476. [Google Scholar] [CrossRef] [PubMed]
- Wang, Y.L.; Chen, J.J.; Irudayaraj, J. Nuclear targeting dynamics of gold nanoclusters for enhanced therapy of HER2+ breast cancer. ACS Nano 2011, 5, 9718–9725. [Google Scholar] [CrossRef] [PubMed]
- Zhang, X.-D.; Luo, Z.; Chen, J.; Shen, X.; Song, S.; Sun, Y.; Fan, S.; Fan, F.; Leong, D.T.; Xie, J. Ultrasmall Au10−12(SG)10−12 nanomolecules for high tumor specificity and cancer radiotherapy. Adv. Mater. 2014, 26, 4565–4568. [Google Scholar] [CrossRef] [PubMed]
- Kubo, R. Electronic properties of metallic fine particles. J. Phys. Soc. Jpn. 1962, 17, 975–986. [Google Scholar] [CrossRef]
- Haberland, H. Clusters of Atoms and Molecules: Theory Experiment, and Clusters of Atoms; Springer: Berlin, Germany, 1994. [Google Scholar]
- Schaaff, T.G.; Knight, G.; Shafigullin, M.N.; Borkman, R.F.; Whetten, R.L. Isolation and selected properties of a 10.4 kDa gold: Glutathione cluster compound. J. Phys. Chem. B 1998, 102, 10643–10646. [Google Scholar] [CrossRef]
- Haiss, W.; Thanh, N.T.K.; Aveyard, J.; Fernig, D.G. Determination of size and concentration of gold nanoparticles from UV-Vis spectra. Anal. Chem. 2007, 79, 4215–4221. [Google Scholar] [CrossRef] [PubMed]
- Zheng, J.; Zhang, C.W.; Dickson, R.M. Highly fluorescent, water-soluble, size-tunable gold quantum dots. Phys. Rev. Lett. 2004, 93, 077402. [Google Scholar] [CrossRef] [PubMed]
- Jin, R.C. Atomically precise metal nanoclusters: Stable sizes and optical properties. Nanoscale 2015, 7, 1549–1565. [Google Scholar] [CrossRef] [PubMed]
- Yang, H.Y.; Wang, Y.; Huang, H.Q.; Gell, L.; Lehtovaara, L.; Malola, S.; Hakkinen, H.; Zheng, N.F. All-thiol-stabilized Ag44 and Au12Ag32 nanoparticles with single-crystal structures. Nat. Commun. 2013, 4, 2422. [Google Scholar] [CrossRef] [PubMed]
- Bao, Y.P.; Yeh, H.C.; Zhong, C.; Ivanov, S.A.; Sharma, J.K.; Neidig, M.L.; Vu, D.M.; Shreve, A.P.; Dyer, R.B.; Werner, J.H.; et al. Formation and stabilization of fluorescent gold nanoclusters using small molecules. J. Phys. Chem. C 2010, 114, 15879–15882. [Google Scholar] [CrossRef]
- Goswami, N.; Zheng, K.; Xie, J. Bio-NCs—The marriage of ultrasmall metal nanoclusters with biomolecules. Nanoscale 2014, 6, 13328–13347. [Google Scholar] [CrossRef] [PubMed]
- Xie, J.P.; Zheng, Y.G.; Ying, J.Y. Protein-directed synthesis of highly fluorescent gold nanoclusters. J. Am. Chem. Soc. 2009, 131, 888–889. [Google Scholar] [CrossRef] [PubMed]
- Liu, C.L.; Wu, H.T.; Hsiao, Y.H.; Lai, C.W.; Shih, C.W.; Peng, Y.K.; Tang, K.C.; Chang, H.W.; Chien, Y.C.; Hsiao, J.K.; et al. Insulin-directed synthesis of fluorescent gold nanoclusters: Preservation of insulin bioactivity and versatility in cell imaging. Angew. Chem. Int. Ed. 2011, 50, 7056–7060. [Google Scholar] [CrossRef] [PubMed]
- Garcia, A.R.; Rahn, I.; Johnson, S.; Patel, R.; Guo, J.R.; Orbulescu, J.; Micic, M.; Whyte, J.D.; Blackwelder, P.; Leblanc, R.M. Human insulin fibril-assisted synthesis of fluorescent gold nanoclusters in alkaline media under physiological temperature. Colloid Surface B 2013, 105, 167–172. [Google Scholar] [CrossRef] [PubMed]
- Wang, Y.; Chen, J.T.; Yan, X.P. Fabrication of transferrin functionalized gold nanoclusters/graphene oxide nanocomposite for turn-on near-infrared fluorescent bioimaging of cancer cells and small animals. Anal. Chem. 2013, 85, 2529–2535. [Google Scholar] [CrossRef] [PubMed]
- Sun, C.J.; Yang, H.; Yuan, Y.; Tian, X.; Wang, L.M.; Guo, Y.; Xu, L.; Lei, J.L.; Gao, N.; Anderson, G.J.; et al. Controlling assembly of paired gold clusters within apoferritin nanoreactor for in vivo kidney targeting and biomedical imaging. J. Am. Chem. Soc. 2011, 133, 8617–8624. [Google Scholar] [CrossRef] [PubMed]
- Shamsipur, M.; Molaabasi, F.; Shanehsaz, M.; Moosavi-Movahedi, A.A. Novel blue-emitting gold nanoclusters confined in human hemoglobin, and their use as fluorescent probes for copper(II) and histidine. Microchim. Acta 2015, 182, 1131–1141. [Google Scholar] [CrossRef]
- Liu, J.M.; Chen, J.T.; Yan, X.P. Near infrared fluorescent trypsin stabilized gold nanoclusters as surface plasmon enhanced energy transfer biosensor and in vivo cancer imaging bioprobe. Anal. Chem. 2013, 85, 3238–3245. [Google Scholar] [CrossRef] [PubMed]
- Wei, H.; Wang, Z.D.; Yang, L.M.; Tian, S.L.; Hou, C.J.; Lu, Y. Lysozyme-stabilized gold fluorescent cluster: Synthesis and application as Hg2+ sensor. Analyst 2010, 135, 1406–1410. [Google Scholar] [CrossRef] [PubMed]
- Jiang, Y.; Huo, S.D.; Mizuhara, T.; Das, R.; Lee, Y.W.; Hou, S.; Moyano, D.F.; Duncan, B.; Liang, X.J.; Rotello, V.M. The interplay of size and surface functionality on the cellular uptake of sub-10 nm gold nanoparticles. ACS Nano 2015, 9, 9986–9993. [Google Scholar] [CrossRef] [PubMed]
- Ma, X.W.; Wu, Y.Y.; Jin, S.B.; Tian, Y.; Zhang, X.N.; Zhao, Y.L.; Yu, L.; Liang, X.J. Gold nanoparticles induce autophagosome accumulation through size-dependent nanoparticle uptake and lysosome impairment. ACS Nano 2011, 5, 8629–8639. [Google Scholar] [CrossRef] [PubMed]
- Jin, S.B.; Ma, X.W.; Ma, H.L.; Zheng, K.Y.; Liu, J.; Hou, S.; Meng, J.; Wang, P.C.; Wu, X.C.; Liang, X.J. Surface chemistry-mediated penetration and gold nanorod thermotherapy in multicellular tumor spheroids. Nanoscale 2013, 5, 143–146. [Google Scholar] [CrossRef] [PubMed]
- Saha, K.; Kim, S.T.; Yan, B.; Miranda, O.R.; Alfonso, F.S.; Shlosman, D.; Rotello, V.M. Surface functionality of nanoparticles determines cellular uptake mechanisms in mammalian cells. Small 2013, 9, 300–305. [Google Scholar] [CrossRef] [PubMed]
- Albanese, A.; Tang, P.S.; Chan, W.C.W. The effect of nanoparticle size, shape, and surface chemistry on biological systems. Annu. Rev. Biomed. Eng. 2012, 14, 1–16. [Google Scholar] [CrossRef] [PubMed]
- Chithrani, B.D.; Ghazani, A.A.; Chan, W.C.W. Determining the size and shape dependence of gold nanoparticle uptake into mammalian cells. Nano Lett. 2006, 6, 662–668. [Google Scholar] [CrossRef] [PubMed]
- Neshatian, M.; Chung, S.; Yoshan, D.; Yang, C.; Chithrani, B.D. Determining the size dependence of colloidal gold nanoparticle uptake in a tumor-like interface (hypoxic). Colloids Interface Sci. Commun. 2014, 1, 57–61. [Google Scholar] [CrossRef]
- Pan, Y.; Neuss, S.; Leifert, A.; Fischler, M.; Wen, F.; Simon, U.; Schmid, G.; Brandau, W.; Jahnen-Dechent, W. Size-dependent cytotoxicity of gold nanoparticles. Small 2007, 3, 1941–1949. [Google Scholar] [CrossRef] [PubMed]
- Cui, W.J.; Li, J.R.; Zhang, Y.K.; Rong, H.L.; Lu, W.S.; Jiang, L. Effects of aggregation and the surface properties of gold nanoparticles on cytotoxicity and cell growth. Nanomedicine 2012, 8, 46–53. [Google Scholar] [CrossRef] [PubMed]
- Li, X.Q.; Li, J.R.; Jiang, L. A silica-gold core-shell structure to mimic the large size of gold particles for promoting cell growth: A comparative study of the silica core size and the nanogold amount in the shell. Colloids Surf. A Physicochem. Eng. Asp. 2014, 459, 211–216. [Google Scholar] [CrossRef]
- Gu, H.Y.; Chen, Z.; Sa, R.X.; Yuan, S.S.; Chen, H.Y.; Ding, Y.T.; Yu, A.M. The immobilization of hepatocytes on 24 nm-sized gold colloid for enhanced hepatocytes proliferation. Biomaterials 2004, 25, 3445–3451. [Google Scholar] [CrossRef] [PubMed]
- Tay, C.Y.; Yu, Y.; Setyawati, M.I.; Xie, J.; Leong, D.T. Presentation matters: Identity of gold nanocluster capping agent governs intracellular uptake and cell metabolism. Nano Res. 2014, 7, 805–815. [Google Scholar] [CrossRef]
- Park, E.J.; Yi, J.; Chung, Y.H.; Ryu, D.Y.; Choi, J.; Park, K. Oxidative stress and apoptosis induced by titanium dioxide nanoparticles in cultured BEAS-2B cells. Toxicol. Lett. 2008, 180, 222–229. [Google Scholar] [CrossRef] [PubMed]
- Setyawati, M.I.; Fang, W.R.; Chia, S.L.; Leong, D.T. Nanotoxicology of common metal oxide based nanomaterials: Their ROS-y and non-ROS-y consequences. Asia Pac. J. Chem. Eng. 2013, 8, 205–217. [Google Scholar] [CrossRef]
- Song, B.; Zhang, Y.L.; Liu, J.; Feng, X.L.; Zhou, T.; Shao, L.Q. Is neurotoxicity of metallic nanoparticles the cascades of oxidative stress? Nanoscale Res. Lett. 2016, 11, 291. [Google Scholar] [CrossRef] [PubMed]
- Fu, P.P.; Xia, Q.S.; Hwang, H.M.; Ray, P.C.; Yu, H.T. Mechanisms of nanotoxicity: Generation of reactive oxygen species. J. Food Drug Anal. 2014, 22, 64–75. [Google Scholar] [CrossRef] [PubMed]
- Valko, M.; Leibfritz, D.; Moncol, J.; Cronin, M.T.D.; Mazur, M.; Telser, J. Free radicals and antioxidants in normal physiological functions and human disease. Int. J. Biochem. Cell B 2007, 39, 44–84. [Google Scholar] [CrossRef] [PubMed]
- Sauer, H.; Wartenberg, M.; Hescheler, J. Reactive oxygen species as intracellular messengers during cell growth and differentiation. Cell. Physiol. Biochem. 2001, 11, 173–186. [Google Scholar] [CrossRef] [PubMed]
- Manke, A.; Wang, L.Y.; Rojanasakul, Y. Mechanisms of nanoparticle-induced oxidative stress and toxicity. Biomed. Res. Int. 2013, 20, 942916. [Google Scholar] [CrossRef] [PubMed]
- Matulionyte, M.; Marcinonyte, R.; Rotomskis, R. Photoinduced spectral changes of photoluminescent gold nanoclusters. J. Biomed. Opt. 2015, 20, 051018. [Google Scholar] [CrossRef] [PubMed]
- Zheng, J.; Nicovich, P.R.; Dickson, R.M. Highly fluorescent noble-metal quantum dots. Annu. Rev. Phys. Chem. 2007, 58, 409–431. [Google Scholar] [CrossRef] [PubMed]
- Poderys, V.; Matulionyte-Safine, M.; Rupsys, D.; Rotomskis, R. Protein stabilized Au nanoclusters: Spectral properties and photostability. Lith. J. Phys. 2016, 56, 55–65. [Google Scholar] [CrossRef]
- Le Guevel, X.; Hotzer, B.; Jung, G.; Hollemeyer, K.; Trouillet, V.; Schneider, M. Formation of fluorescent metal (Au, Ag) nanoclusters capped in bovine serum albumin followed by fluorescence and spectroscopy. J. Phys. Chem. C 2011, 115, 10955–10963. [Google Scholar] [CrossRef]
- Yumoto, R.; Nishikawa, H.; Okamoto, M.; Katayama, H.; Nagai, J.; Takano, M. Clathrin-mediated endocytosis of FITC-albumin in alveolar type II epithelial cell line RLE-6TN. Am. J. Physiol. Lung C 2006, 290, L946–L955. [Google Scholar] [CrossRef] [PubMed]
- Eyre, J.; Ioannou, K.; Grubb, B.D.; Saleem, M.A.; Mathieson, P.W.; Brunskill, N.J.; Christensen, E.I.; Topham, P.S. Statin-sensitive endocytosis of albumin by glomerular podocytes. Am. J. Physiol. Ren. 2007, 292, F674–F681. [Google Scholar] [CrossRef] [PubMed]
- Dobrinskikh, E.; Okamura, K.; Kopp, J.B.; Doctor, R.B.; Blaine, J. Human podocytes perform polarized, caveolae-dependent albumin endocytosis. Am. J. Physiol. Ren. 2014, 306, F941–F951. [Google Scholar] [CrossRef] [PubMed]
- Ding, C.Q.; Tian, Y. Gold nanocluster-based fluorescence biosensor for targeted imaging in cancer cells and ratiometric determination of intracellular pH. Biosens. Bioelectron. 2015, 65, 183–190. [Google Scholar] [CrossRef] [PubMed]
- Chen, H.Y.; Li, S.L.; Li, B.W.; Ren, X.Y.; Li, S.N.; Mahounga, D.M.; Cui, S.S.; Gu, Y.Q.; Achilefu, S. Folate-modified gold nanoclusters as near-infrared fluorescent probes for tumor imaging and therapy. Nanoscale 2012, 4, 6050–6064. [Google Scholar] [CrossRef] [PubMed]
- Retnakumari, A.; Setua, S.; Menon, D.; Ravindran, P.; Muhammed, H.; Pradeep, T.; Nair, S.; Koyakutty, M. Molecular-receptor-specific, non-toxic, near-infrared-emitting Au cluster-protein nanoconjugates for targeted cancer imaging. Nanotechnology 2010, 21, 055103. [Google Scholar] [CrossRef] [PubMed]
- Carruthers, A. Facilitated diffusion of glucose. Physiol. Rev. 1990, 70, 1135–1176. [Google Scholar] [PubMed]
- Ma, J.; Goryaynov, A.; Sarma, A.; Yang, W.D. Self-regulated viscous channel in the nuclear pore complex. Proc. Natl. Acad. Sci. USA 2012, 109, 7326–7331. [Google Scholar] [CrossRef] [PubMed]
- Macara, I.G. Transport into and out of the nucleus. Microbiol. Mol. Biol. R. 2001, 65, 570–594. [Google Scholar] [CrossRef] [PubMed]
- Cook, A.; Bono, F.; Jinek, M.; Conti, E. Structural biology of nucleocytoplasmic transport. Annu. Rev. Biochem. 2007, 76, 647–671. [Google Scholar] [CrossRef] [PubMed]
- Chen, H.Y.; Li, B.W.; Wang, C.; Zhang, X.; Cheng, Z.Q.; Dai, X.; Zhu, R.; Gu, Y.Q. Characterization of a fluorescence probe based on gold nanoclusters for cell and animal imaging. Nanotechnology 2013, 24, 055704. [Google Scholar] [CrossRef] [PubMed]
- Slektaite, A.; Kubiliute, R.; Sabonis, D.; Rotomskis, R. Relation between spectral and spatial properties of gold nanoclusters modified by the morpholine ligand. Chemija 2016, 27, 93–99. [Google Scholar]
- Tkachenko, A.G.; Xie, H.; Coleman, D.; Glomm, W.; Ryan, J.; Anderson, M.F.; Franzen, S.; Feldheim, D.L. Multifunctional gold nanoparticle-peptide complexes for nuclear targeting. J. Am. Chem. Soc. 2003, 125, 4700–4701. [Google Scholar] [CrossRef] [PubMed]
- Zhao, J.Y.; Cui, R.; Zhang, Z.L.; Zhang, M.X.; Xie, Z.X.; Pang, D.W. Cytotoxicity of nucleus-targeting fluorescent gold nanoclusters. Nanoscale 2014, 6, 13126–13134. [Google Scholar] [CrossRef] [PubMed]
- Zhang, W.J.; Ye, J.; Zhang, Y.Y.; Li, Q.W.; Dong, X.W.; Jiang, H.; Wang, X.M. One-step facile synthesis of fluorescent gold nanoclusters for rapid bio-imaging of cancer cells and small animals. RSC Adv. 2015, 5, 63821–63826. [Google Scholar] [CrossRef]
- Dong, L.Y.; Li, M.L.; Zhang, S.; Li, J.; Shen, G.; Tu, Y.; Zhu, J.; Tao, J. Cytotoxicity of BSA-stabilized gold nanoclusters: In vitro and in vivo study. Small 2015, 11, 2571–2581. [Google Scholar] [CrossRef] [PubMed]
- Okamura, K.; Dummer, P.; Kopp, J.; Qiu, L.R.; Levi, M.; Faubel, S.; Blaine, J. Endocytosis of Albumin by Podocytes Elicits an Inflammatory Response and Induces Apoptotic Cell Death. PLoS ONE 2013, 8, e54817. [Google Scholar] [CrossRef] [PubMed]
- Li, Y.J.; Feng, L.Z.; Shi, X.Z.; Wang, X.J.; Yang, Y.L.; Yang, K.; Liu, T.; Yang, G.B.; Liu, Z. Surface coating-dependent cytotoxicity and degradation of graphene derivatives: Towards the design of non-toxic, degradable nano-graphene. Small 2014, 10, 1544–1554. [Google Scholar] [CrossRef] [PubMed]
- Shannahan, J.H.; Podila, R.; Aldossari, A.A.; Emerson, H.; Powell, B.A.; Ke, P.C.; Rao, A.M.; Brown, J.M. Formation of a protein corona on silver nanoparticles mediates cellular toxicity via scavenger receptors. Toxicol. Sci. 2015, 143, 136–146. [Google Scholar] [CrossRef] [PubMed]
- Ramesh, B.S.; Giorgakis, E.; Lopez-Davila, V.; Dashtarzheneha, A.K.; Loizidou, M. Detection of cell surface calreticulin as a potential cancer biomarker using near-infrared emitting gold nanoclusters. Nanotechnology 2016, 27, 285101. [Google Scholar] [CrossRef] [PubMed]
- Pan, Y.; Leifert, A.; Ruau, D.; Neuss, S.; Bornemann, J.; Schmid, G.; Brandau, W.; Simon, U.; Jahnen-Dechent, W. Gold nanoparticles of diameter 1.4 nm trigger necrosis by oxidative stress and mitochondrial damage. Small 2009, 5, 2067–2076. [Google Scholar] [CrossRef] [PubMed]
- Steponkiene, S.; Dapkute, D.; Riekstina, U.; Rotomskis, R. Accumulation and distribution of non-targeted and anti-CD44-conjugated quantum dots in distinct phenotypes of breast cancer. J. Nanomed. Nanotechnol. 2015, 6, 1000341. [Google Scholar] [CrossRef]
- Fillmore, C.M.; Kuperwasser, C. Human breast cancer cell lines contain stem-like cells that self-renew, give rise to phenotypically diverse progeny and survive chemotherapy. Breast Cancer Res. 2008, 10, R25. [Google Scholar] [CrossRef] [PubMed]


© 2017 by the authors. Licensee MDPI, Basel, Switzerland. This article is an open access article distributed under the terms and conditions of the Creative Commons Attribution (CC BY) license ( http://creativecommons.org/licenses/by/4.0/).
Share and Cite
Matulionyte, M.; Dapkute, D.; Budenaite, L.; Jarockyte, G.; Rotomskis, R. Photoluminescent Gold Nanoclusters in Cancer Cells: Cellular Uptake, Toxicity, and Generation of Reactive Oxygen Species. Int. J. Mol. Sci. 2017, 18, 378. https://doi.org/10.3390/ijms18020378
Matulionyte M, Dapkute D, Budenaite L, Jarockyte G, Rotomskis R. Photoluminescent Gold Nanoclusters in Cancer Cells: Cellular Uptake, Toxicity, and Generation of Reactive Oxygen Species. International Journal of Molecular Sciences. 2017; 18(2):378. https://doi.org/10.3390/ijms18020378
Chicago/Turabian StyleMatulionyte, Marija, Dominyka Dapkute, Laima Budenaite, Greta Jarockyte, and Ricardas Rotomskis. 2017. "Photoluminescent Gold Nanoclusters in Cancer Cells: Cellular Uptake, Toxicity, and Generation of Reactive Oxygen Species" International Journal of Molecular Sciences 18, no. 2: 378. https://doi.org/10.3390/ijms18020378