3D-QSAR and Molecular Docking Studies on the TcPMCA1-Mediated Detoxification of Scopoletin and Coumarin Derivatives


Abstract
:
1. Introduction
2. Results
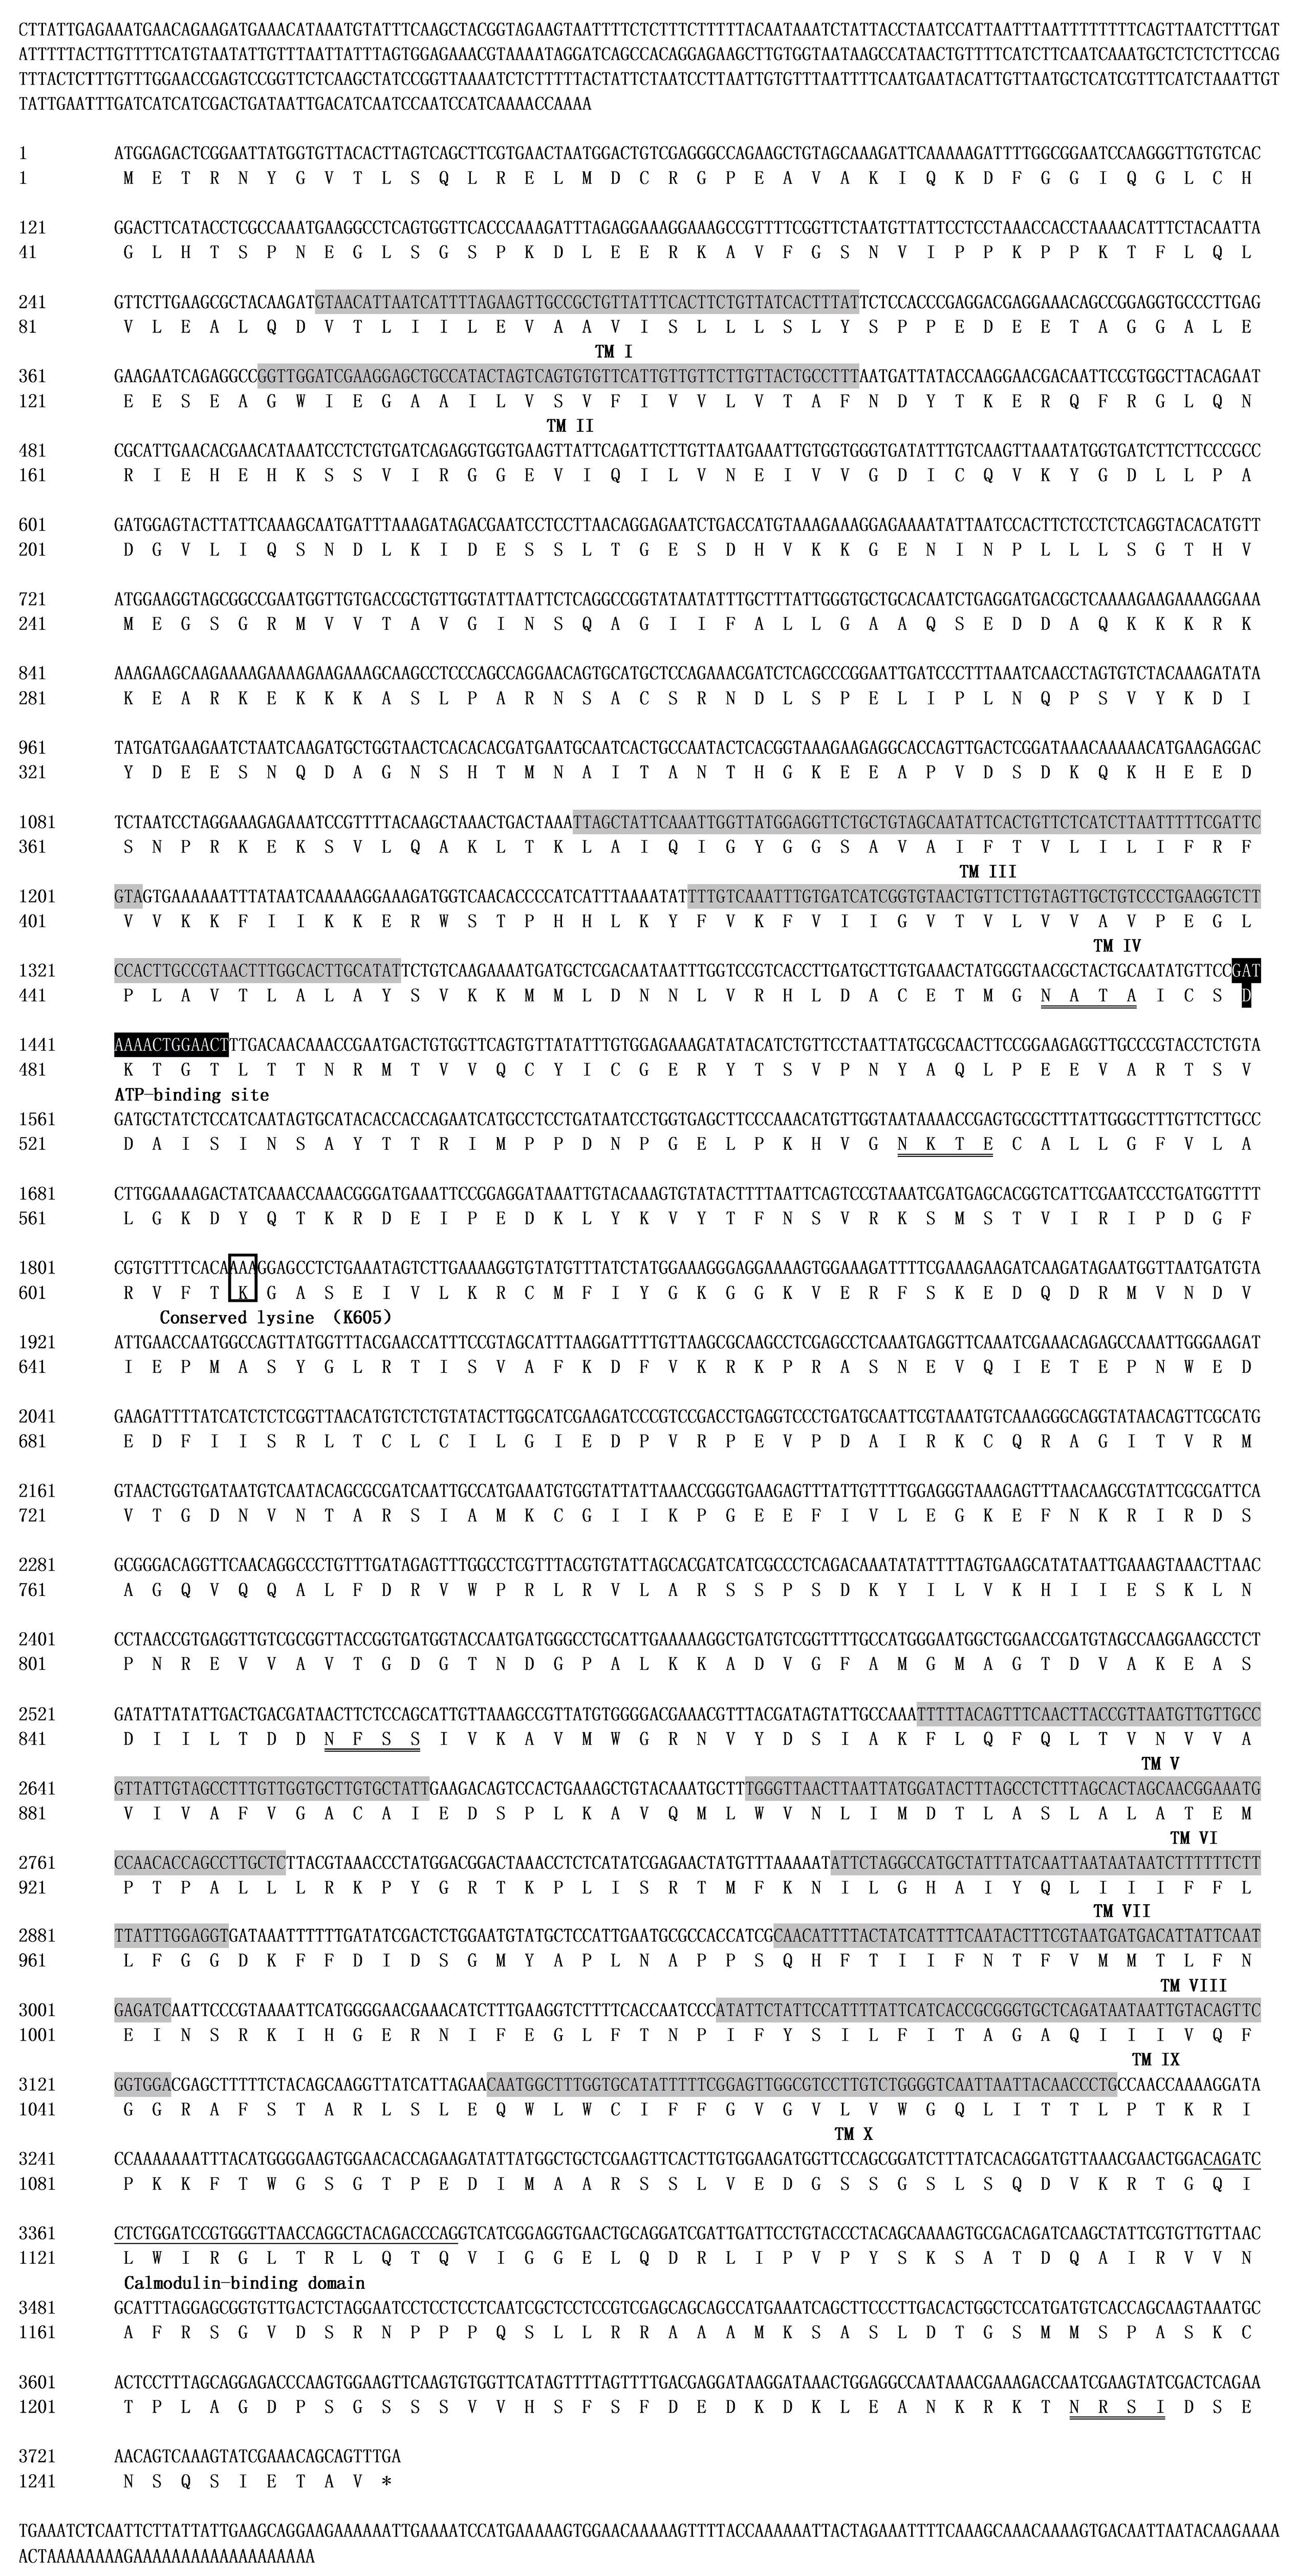
2.1. Cloning and Sequence Analysis
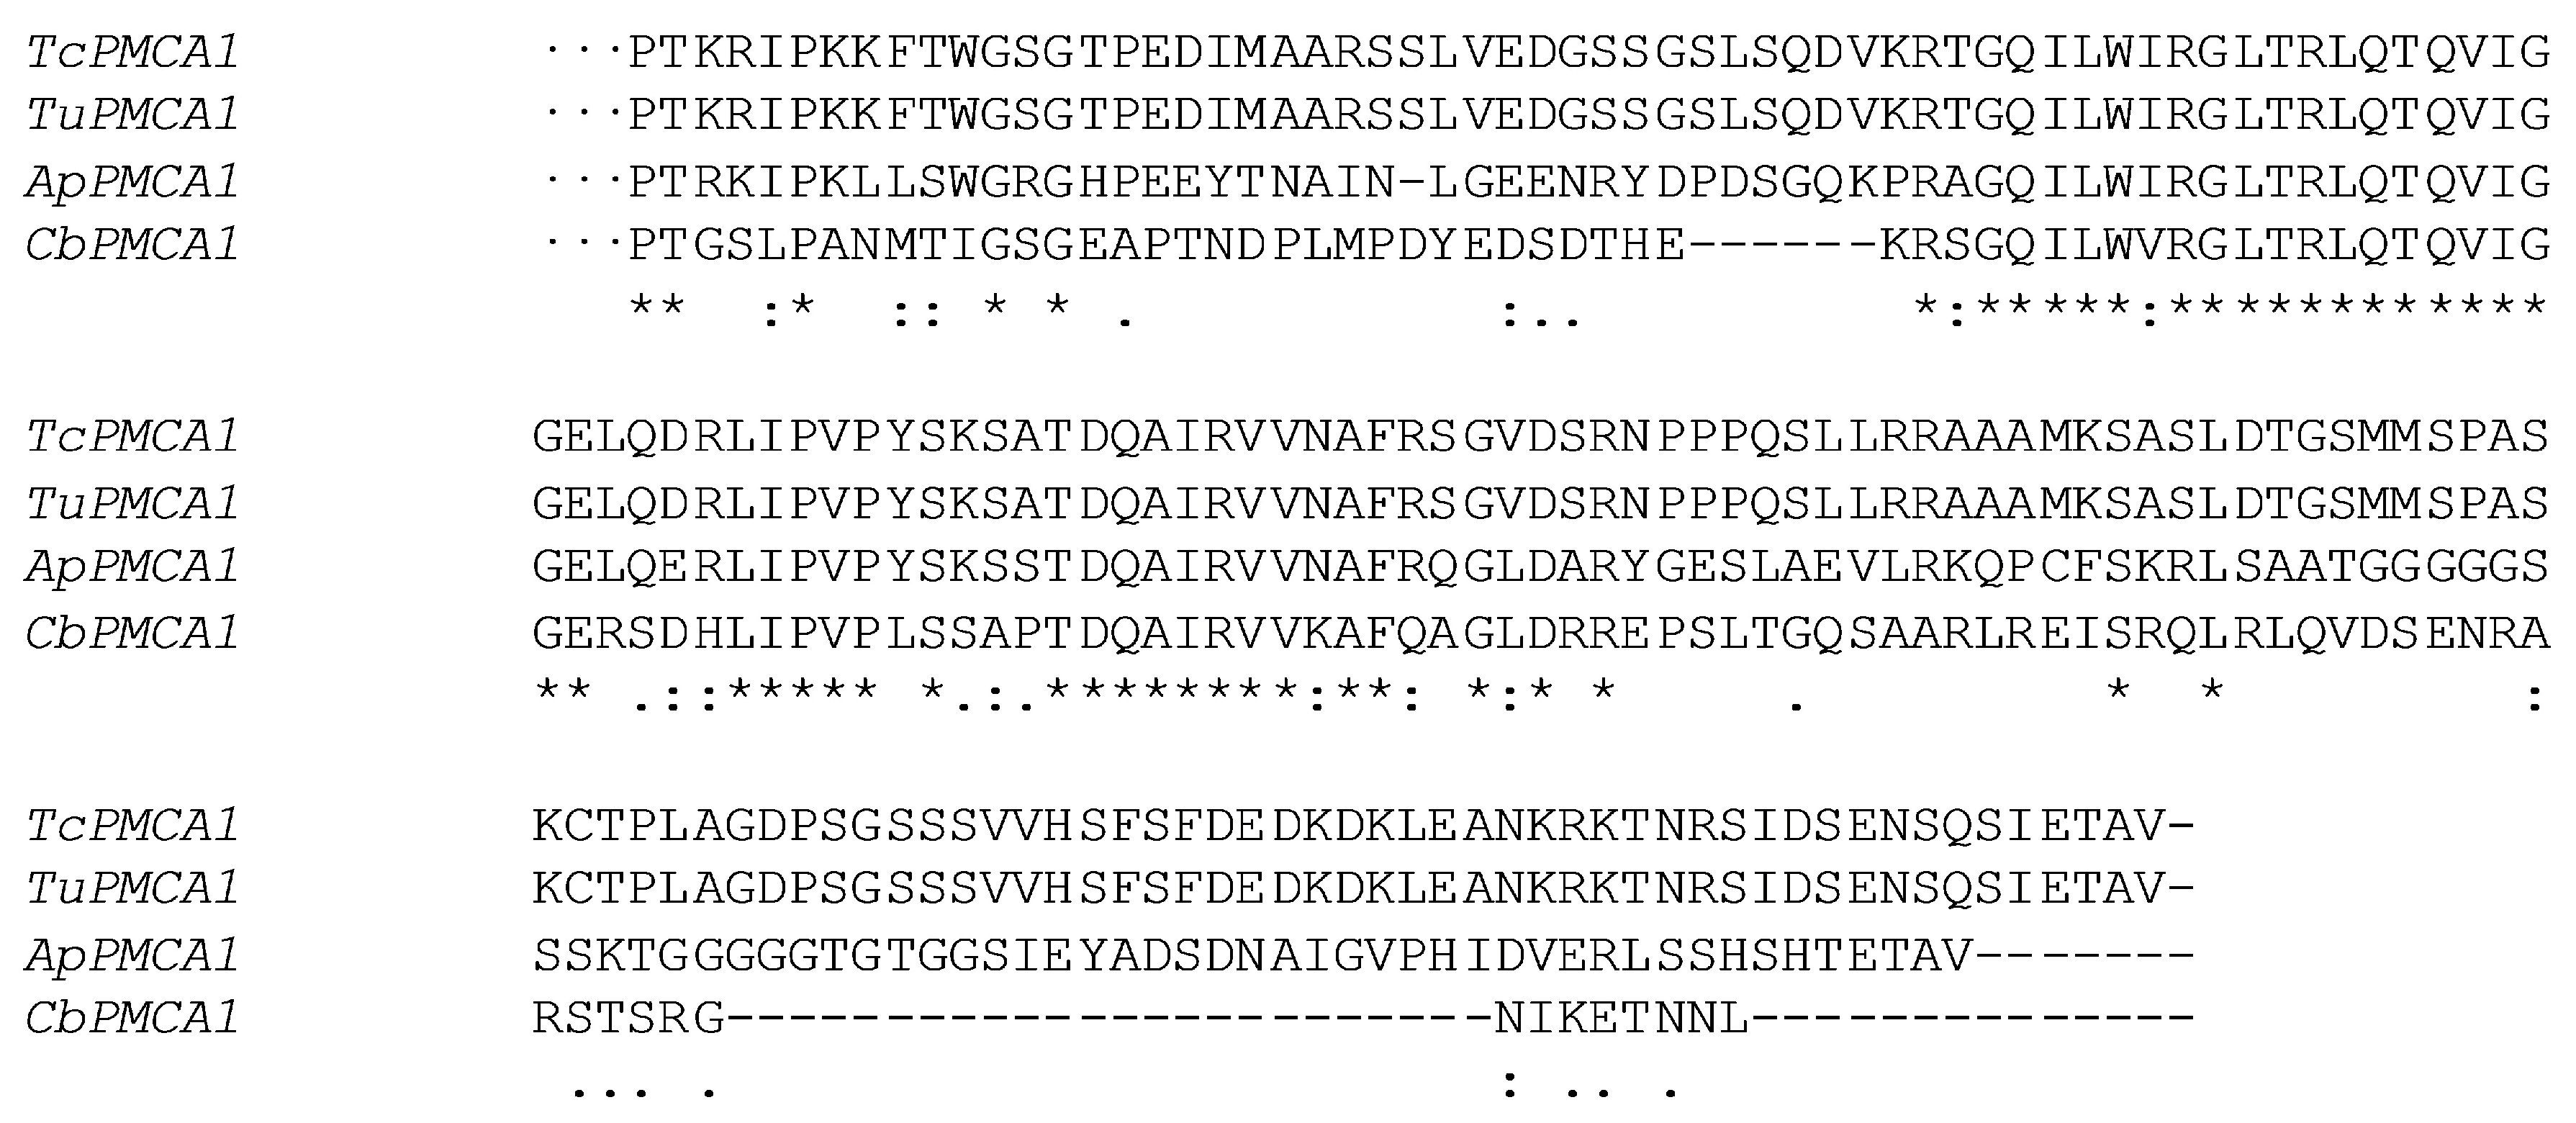
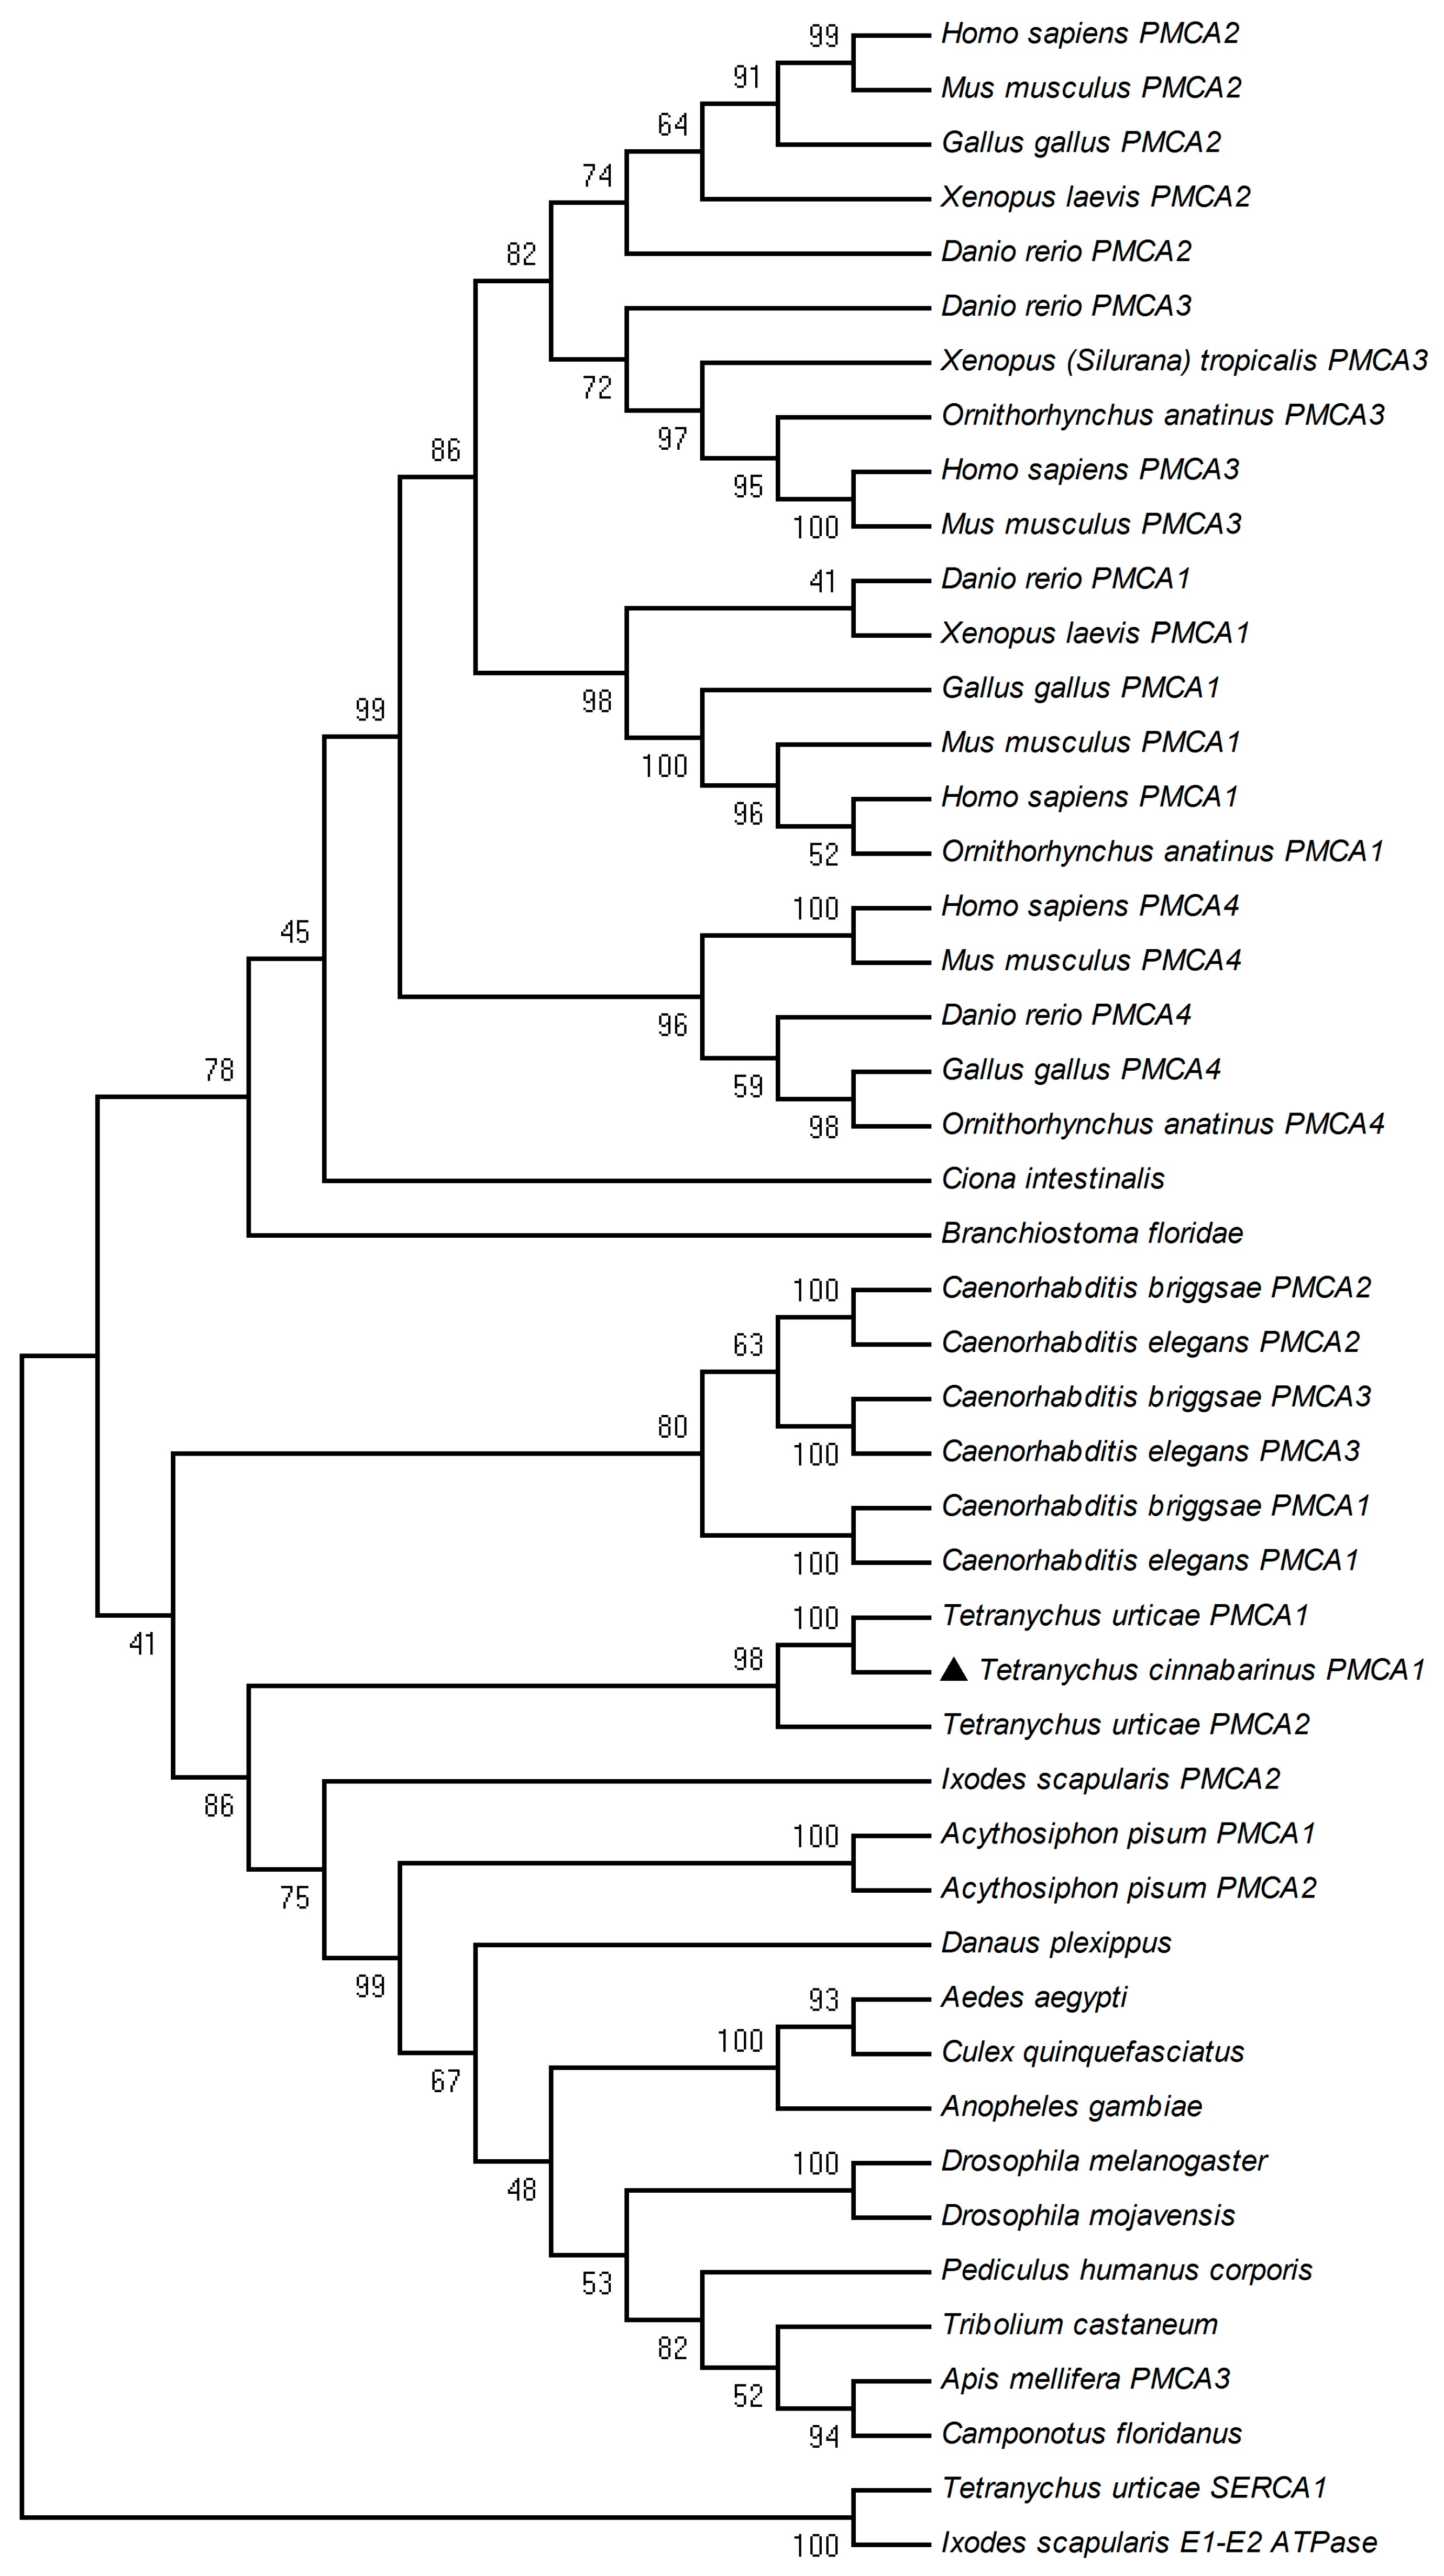
2.2. Phylogenetic Analysis
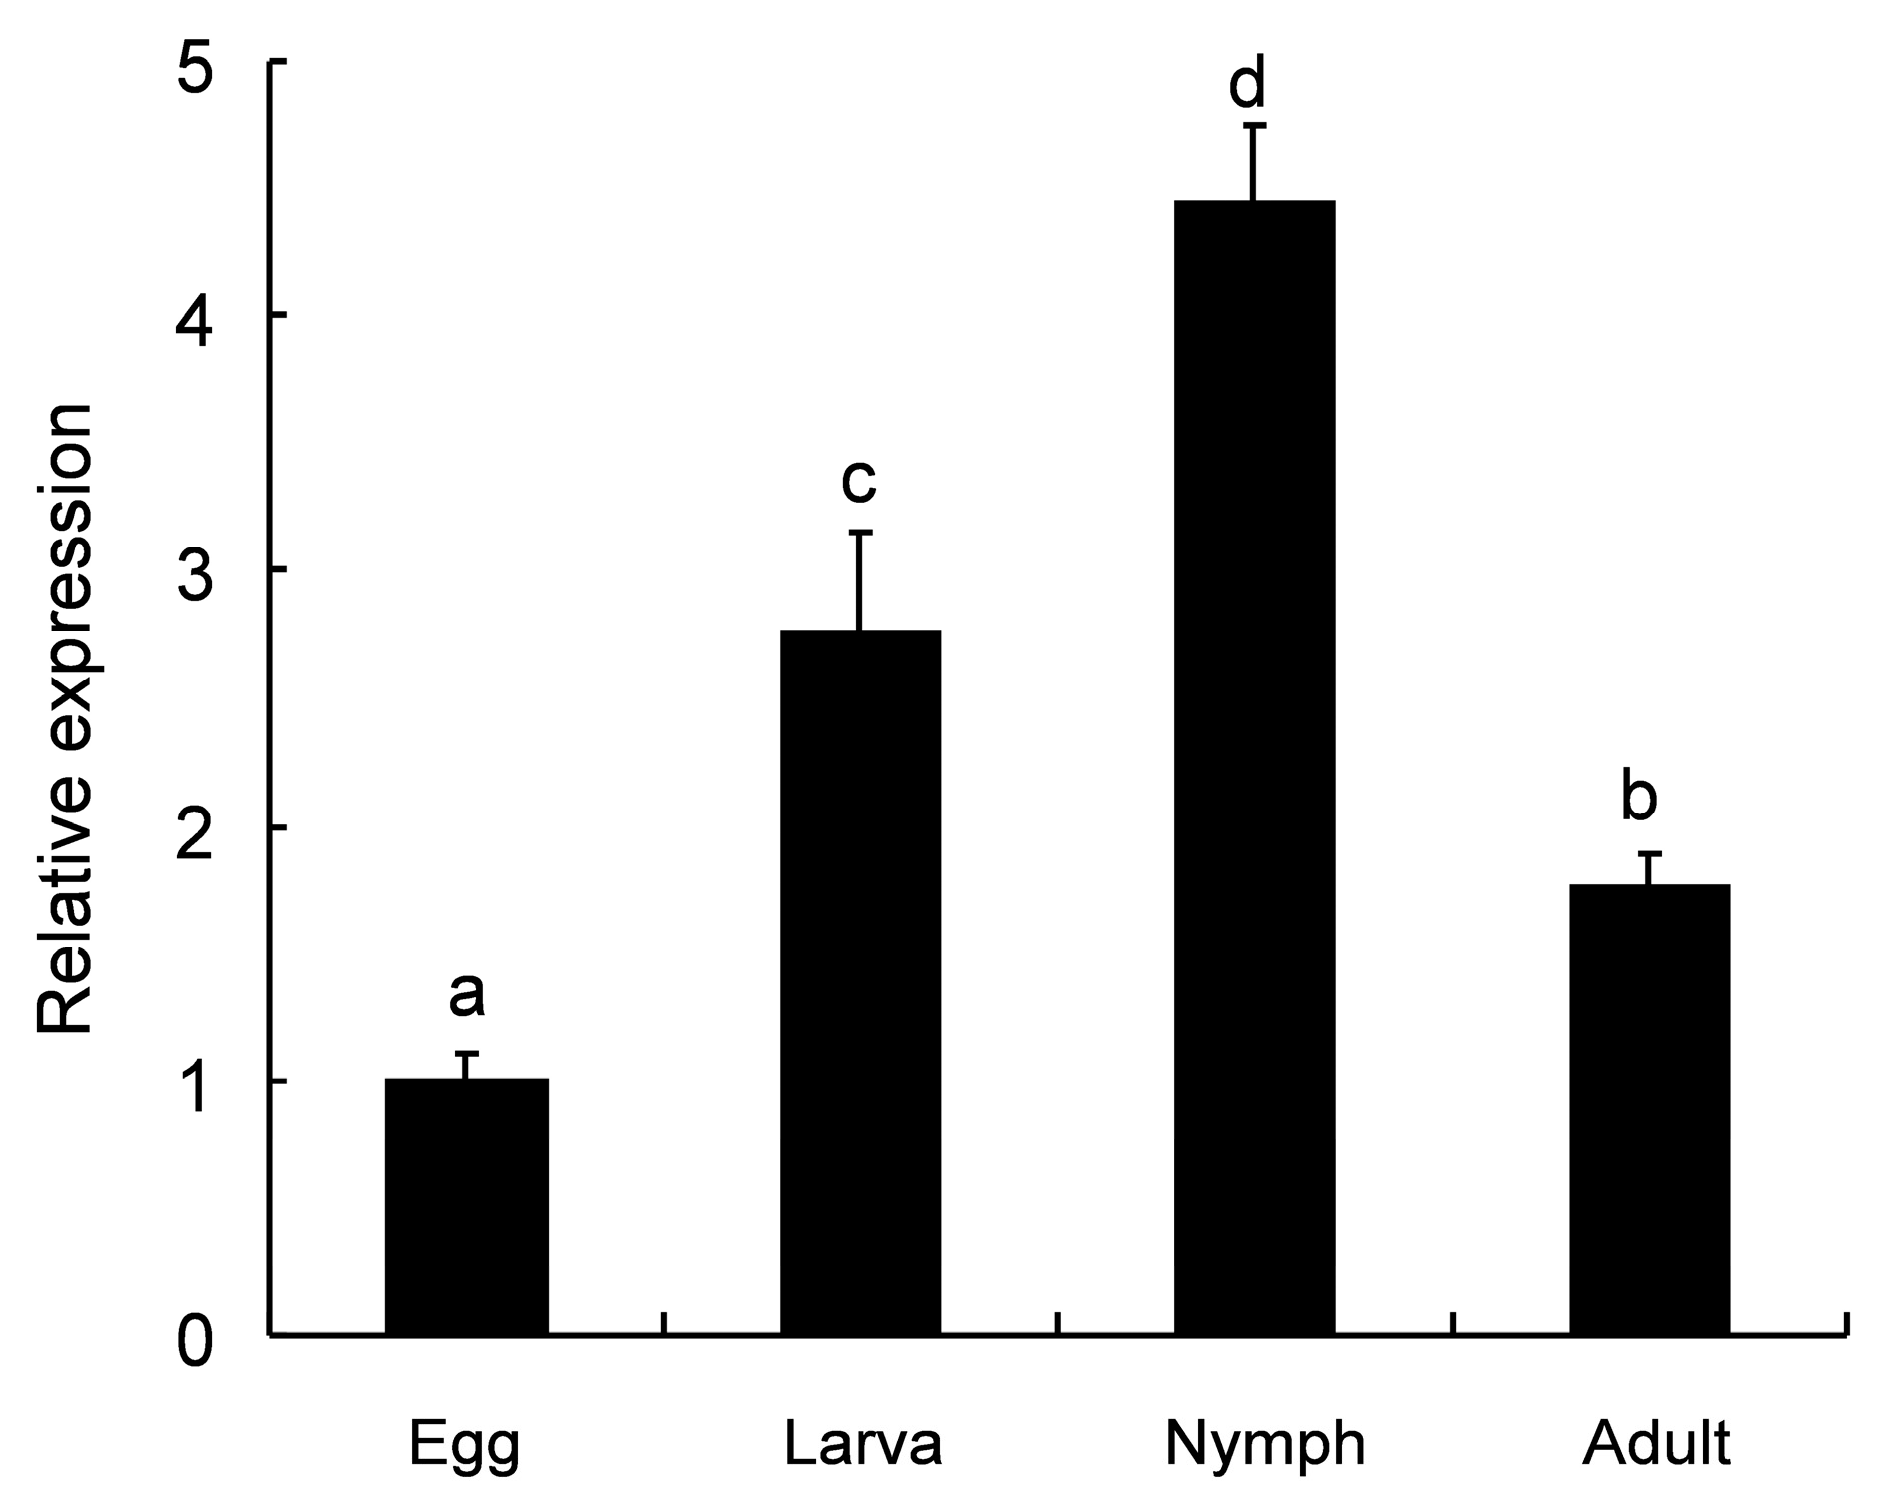
2.3. Developmental Expression Patterns
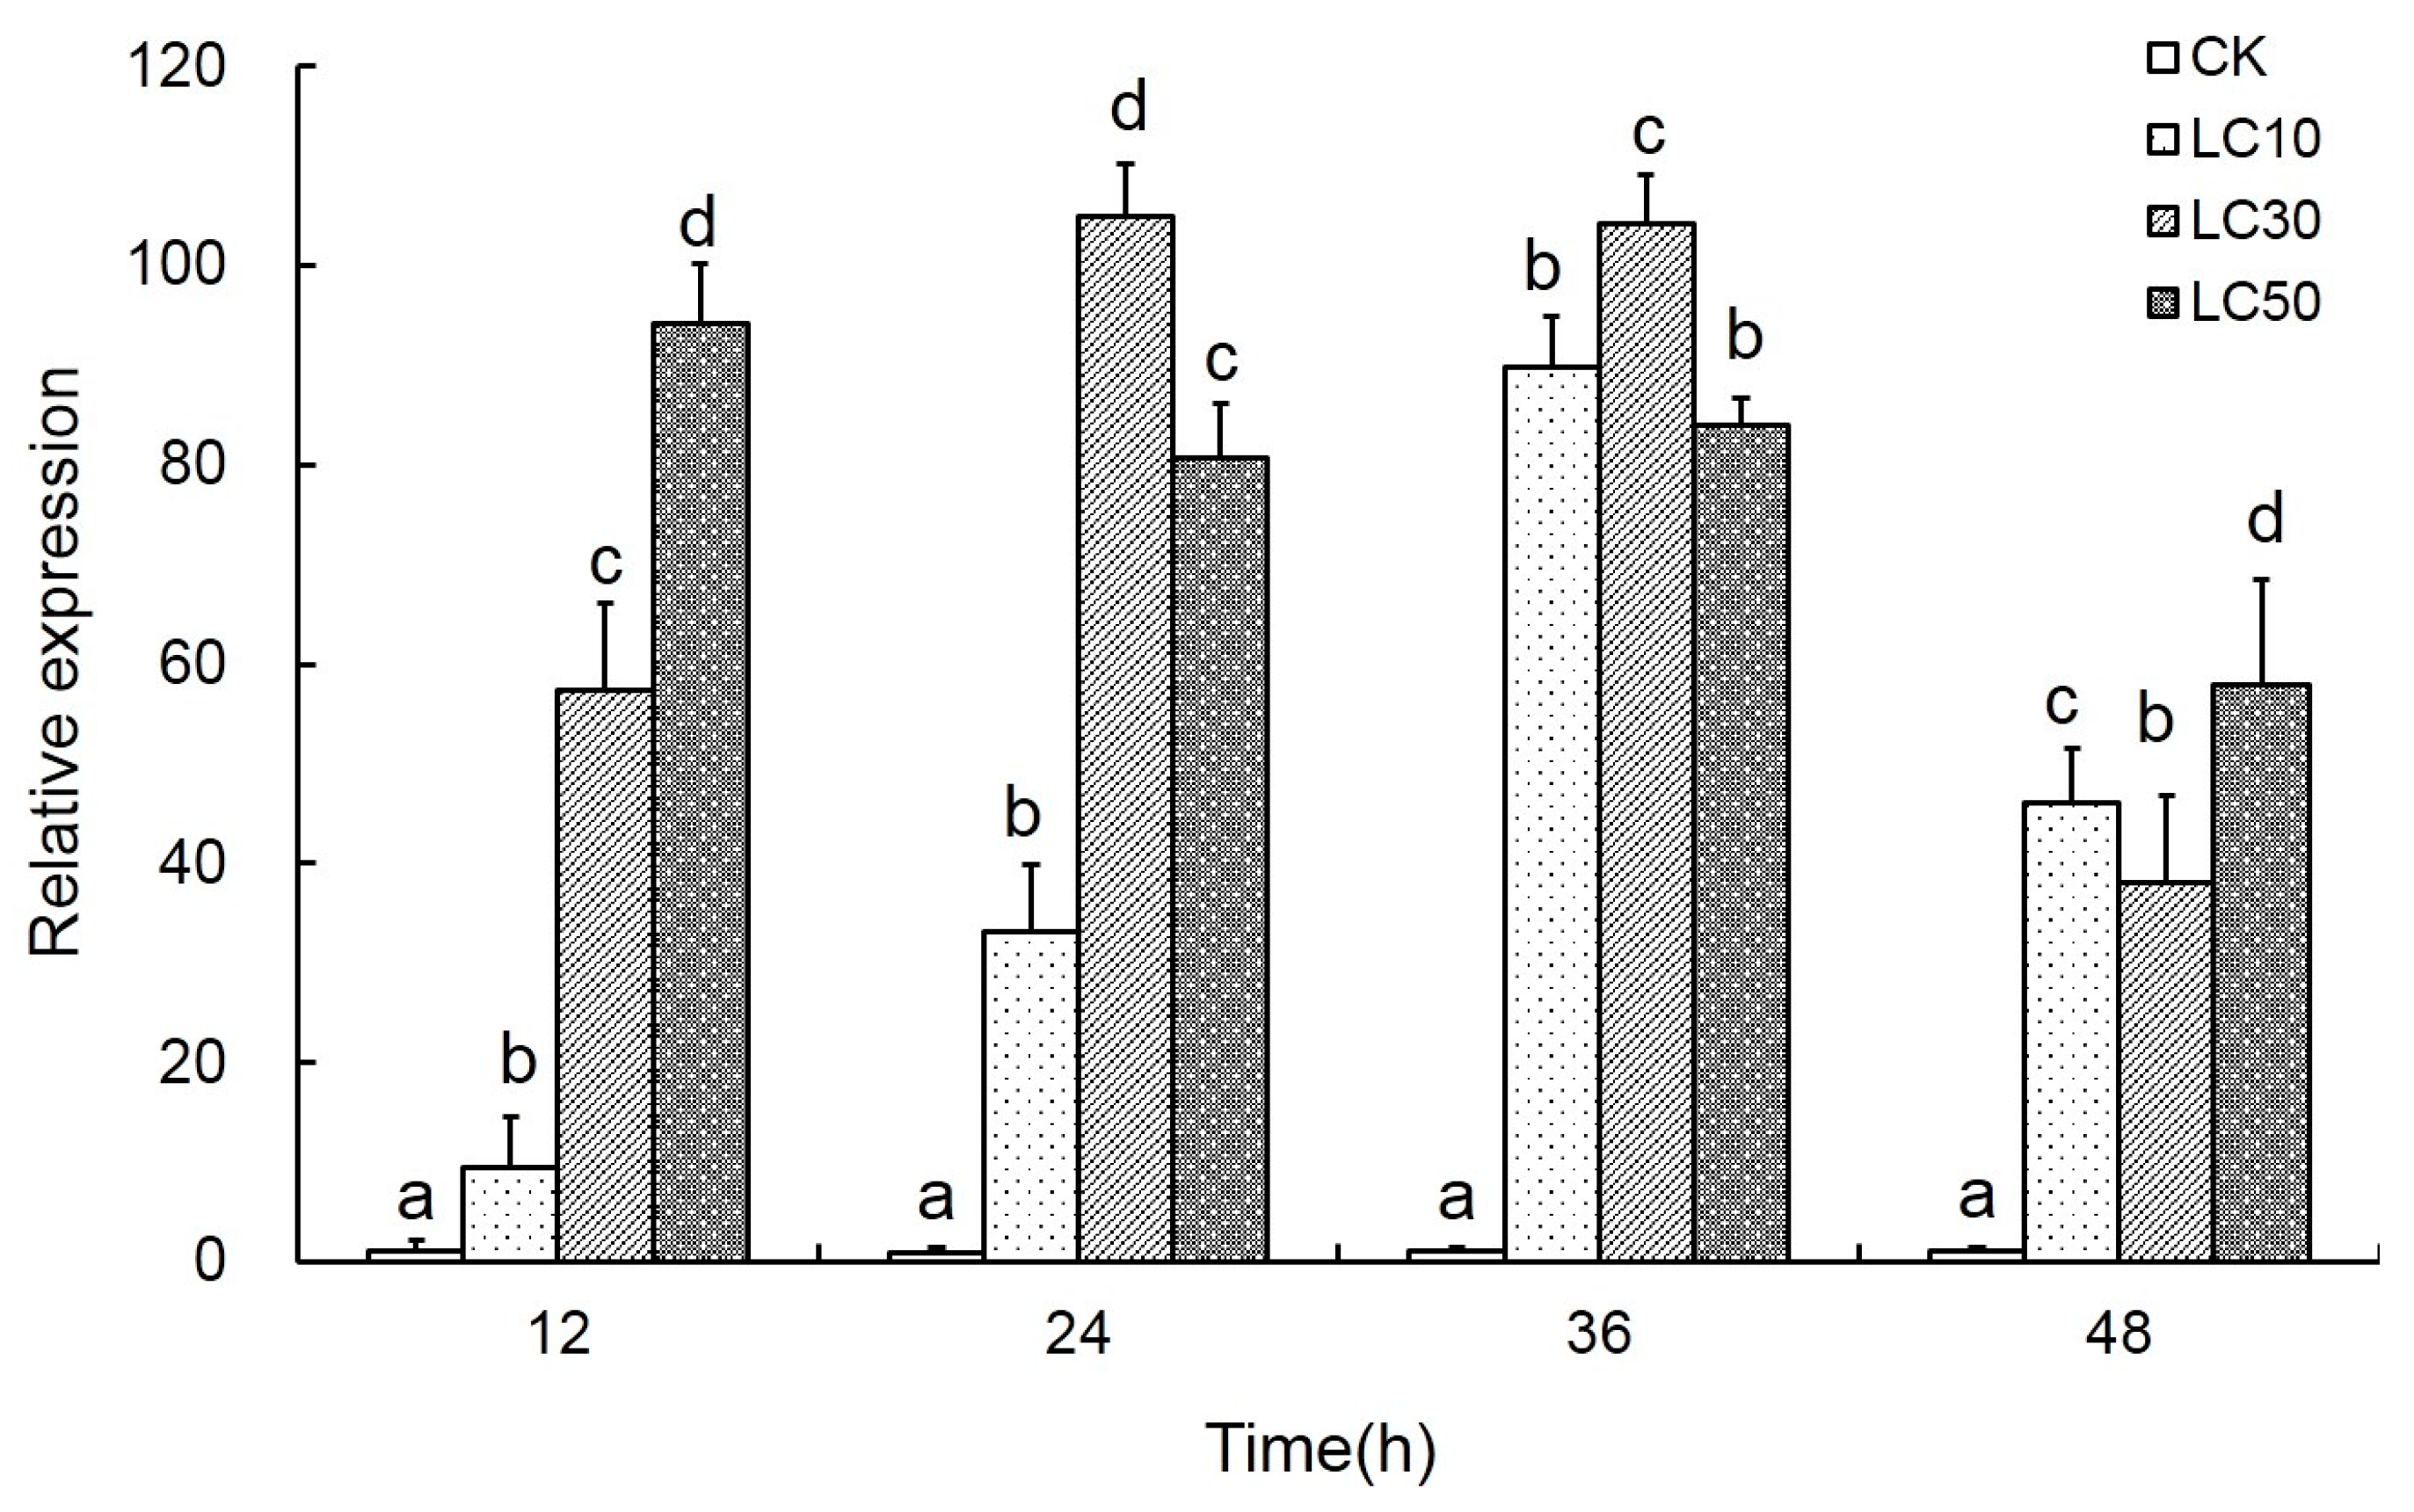
2.4. Effects of Scopoletin Exposure on TcPMCA Expression
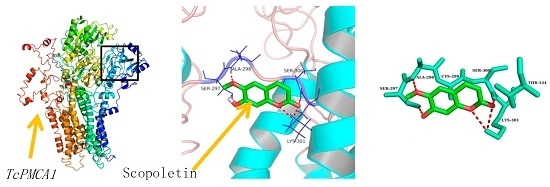
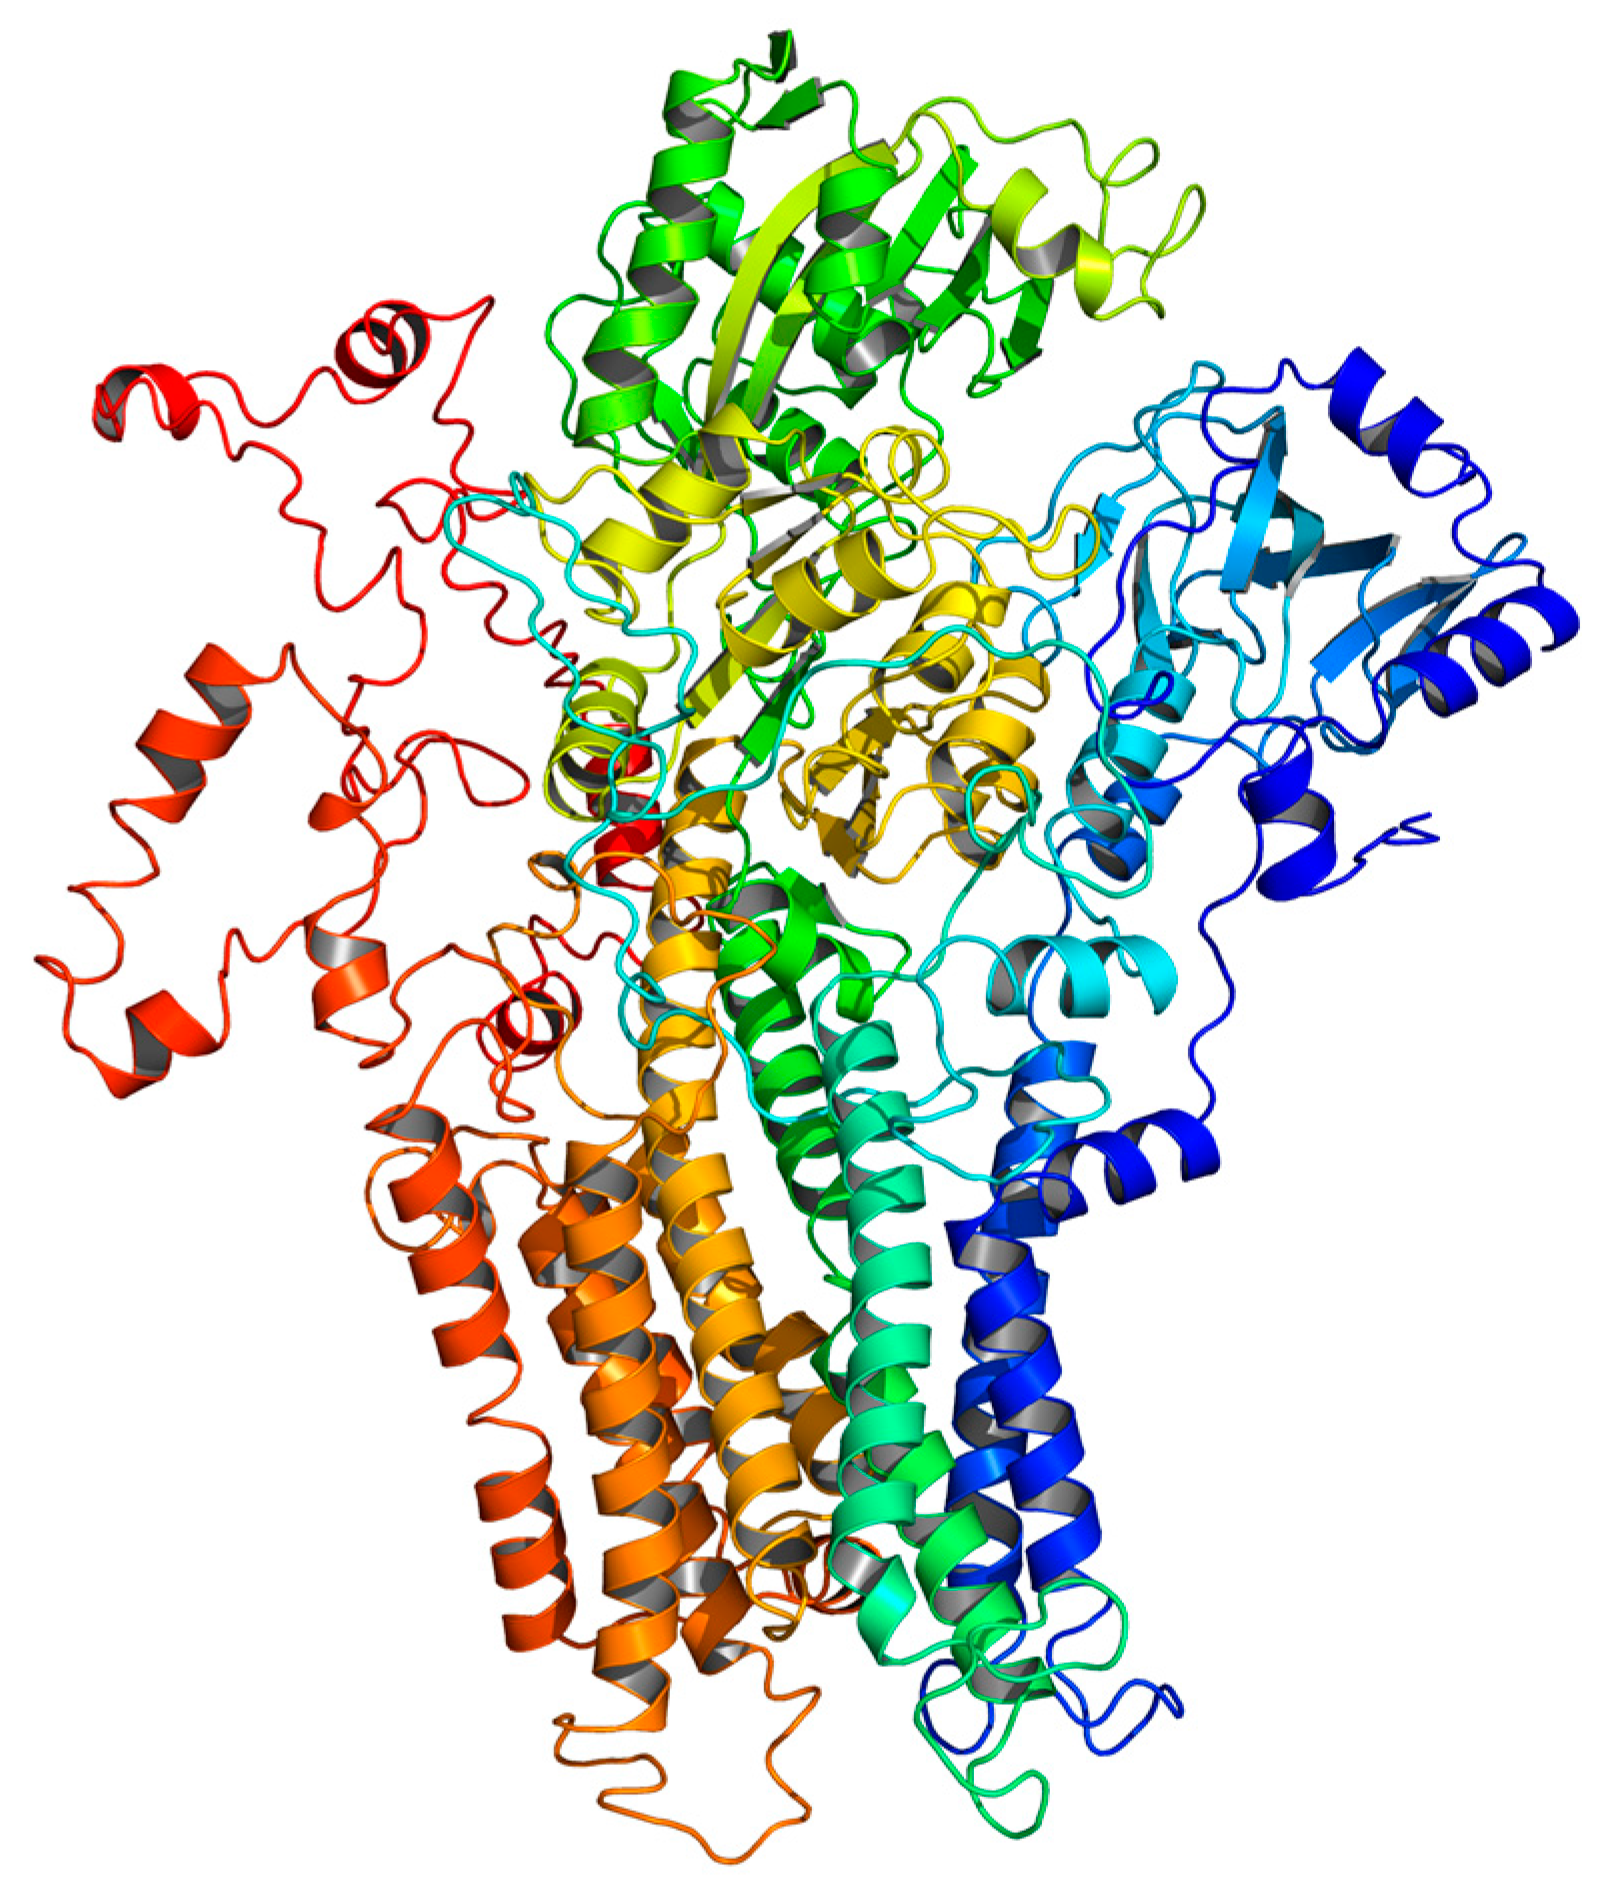
2.5. Homology Modeling
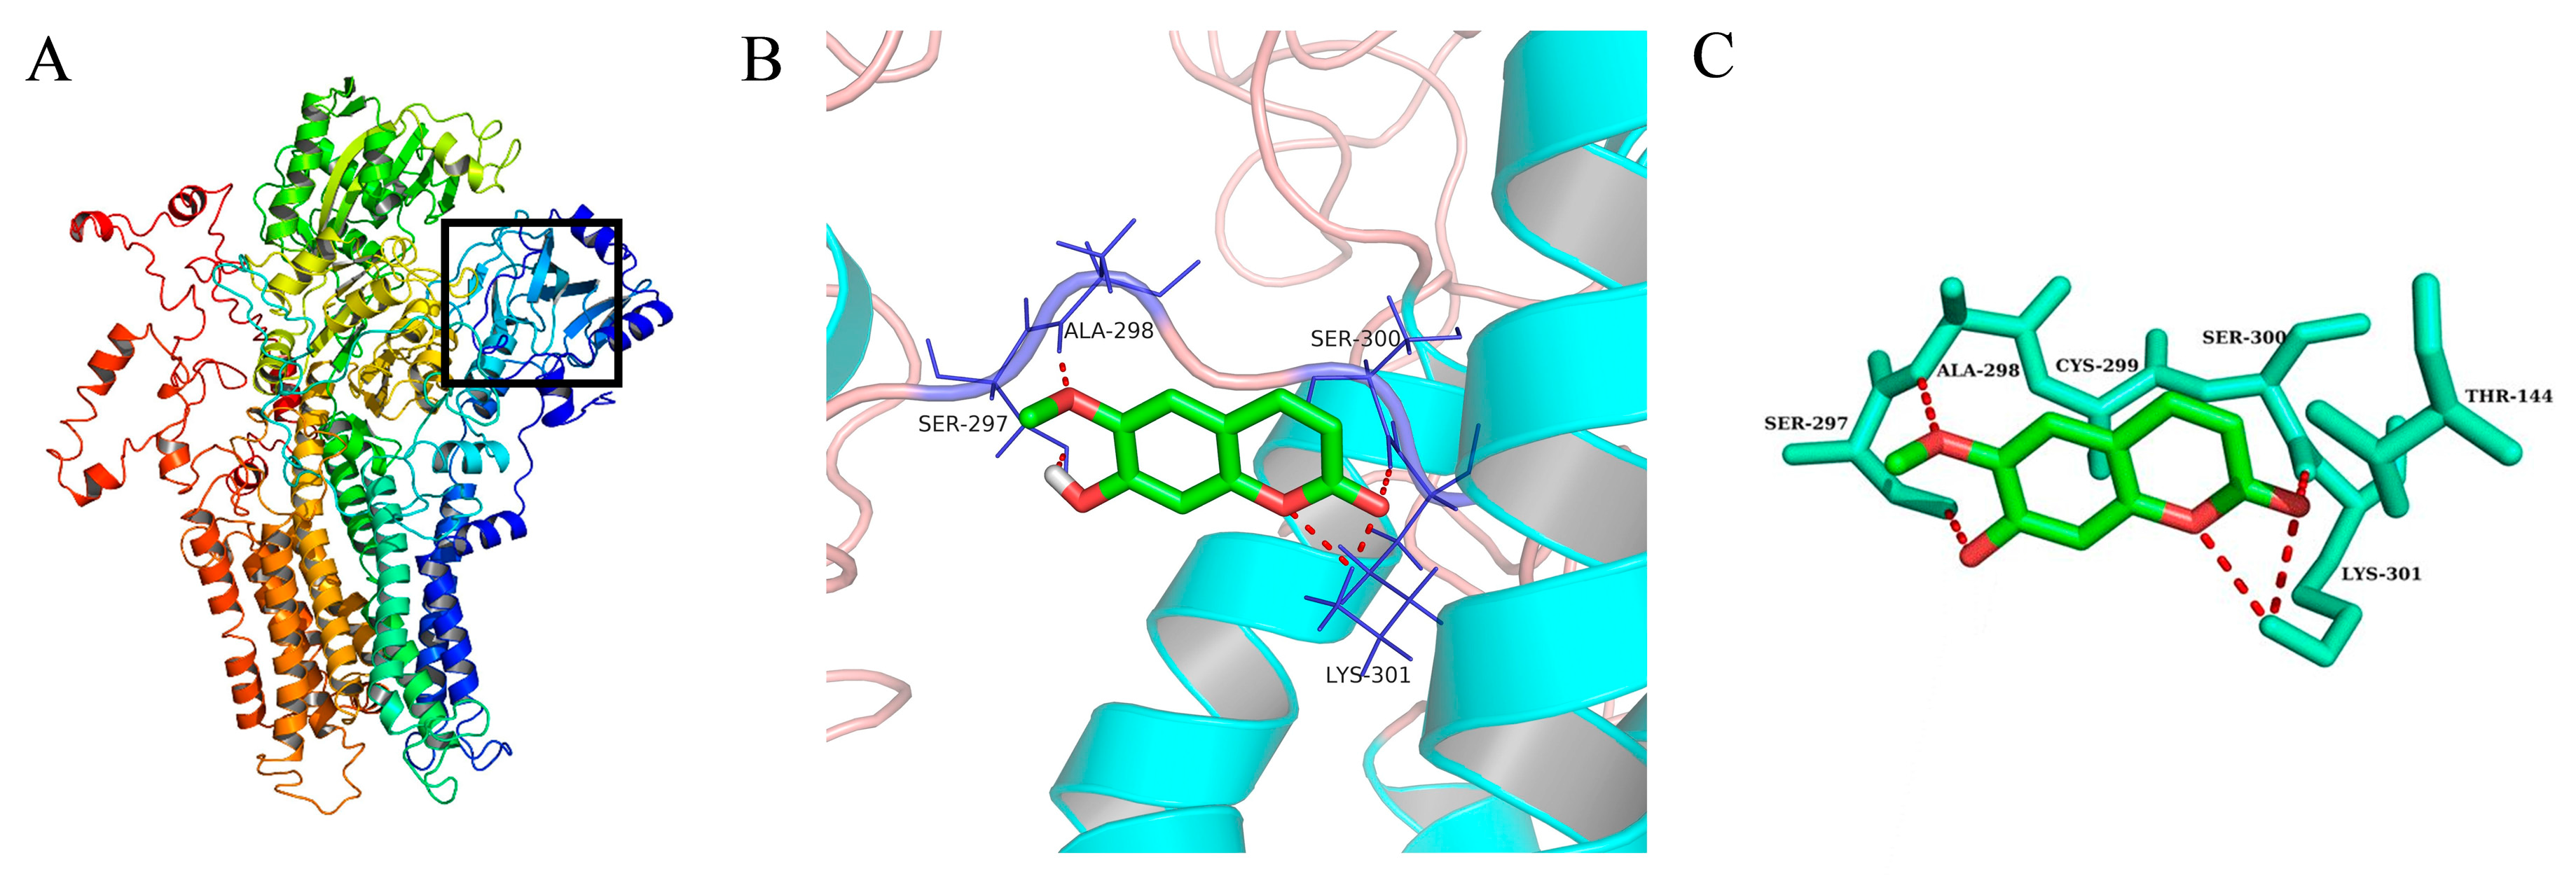
2.6. Molecular Docking
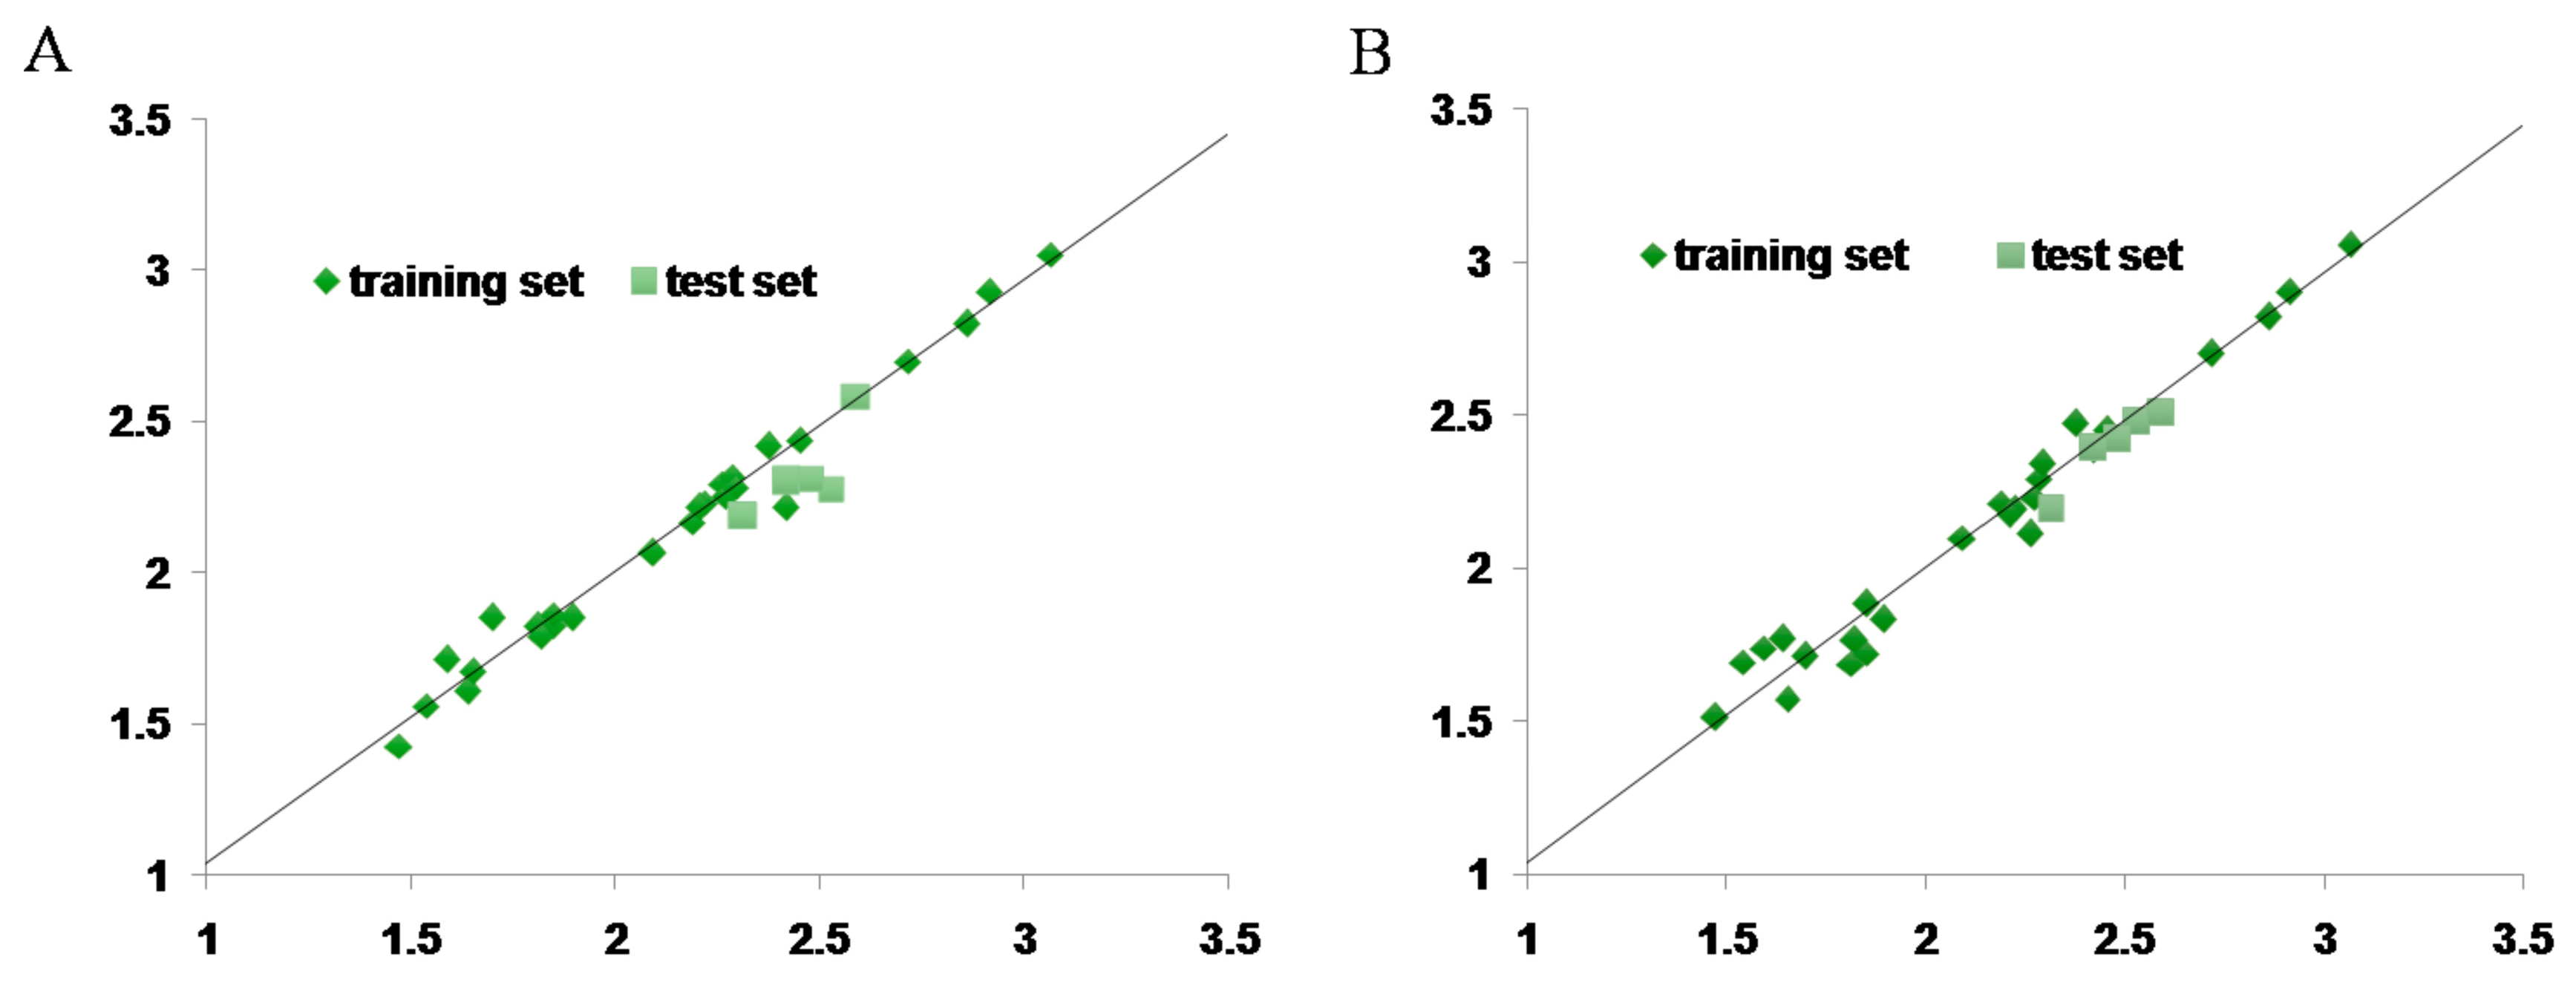
2.7. CoMFA and CoMSIA Statistical Result
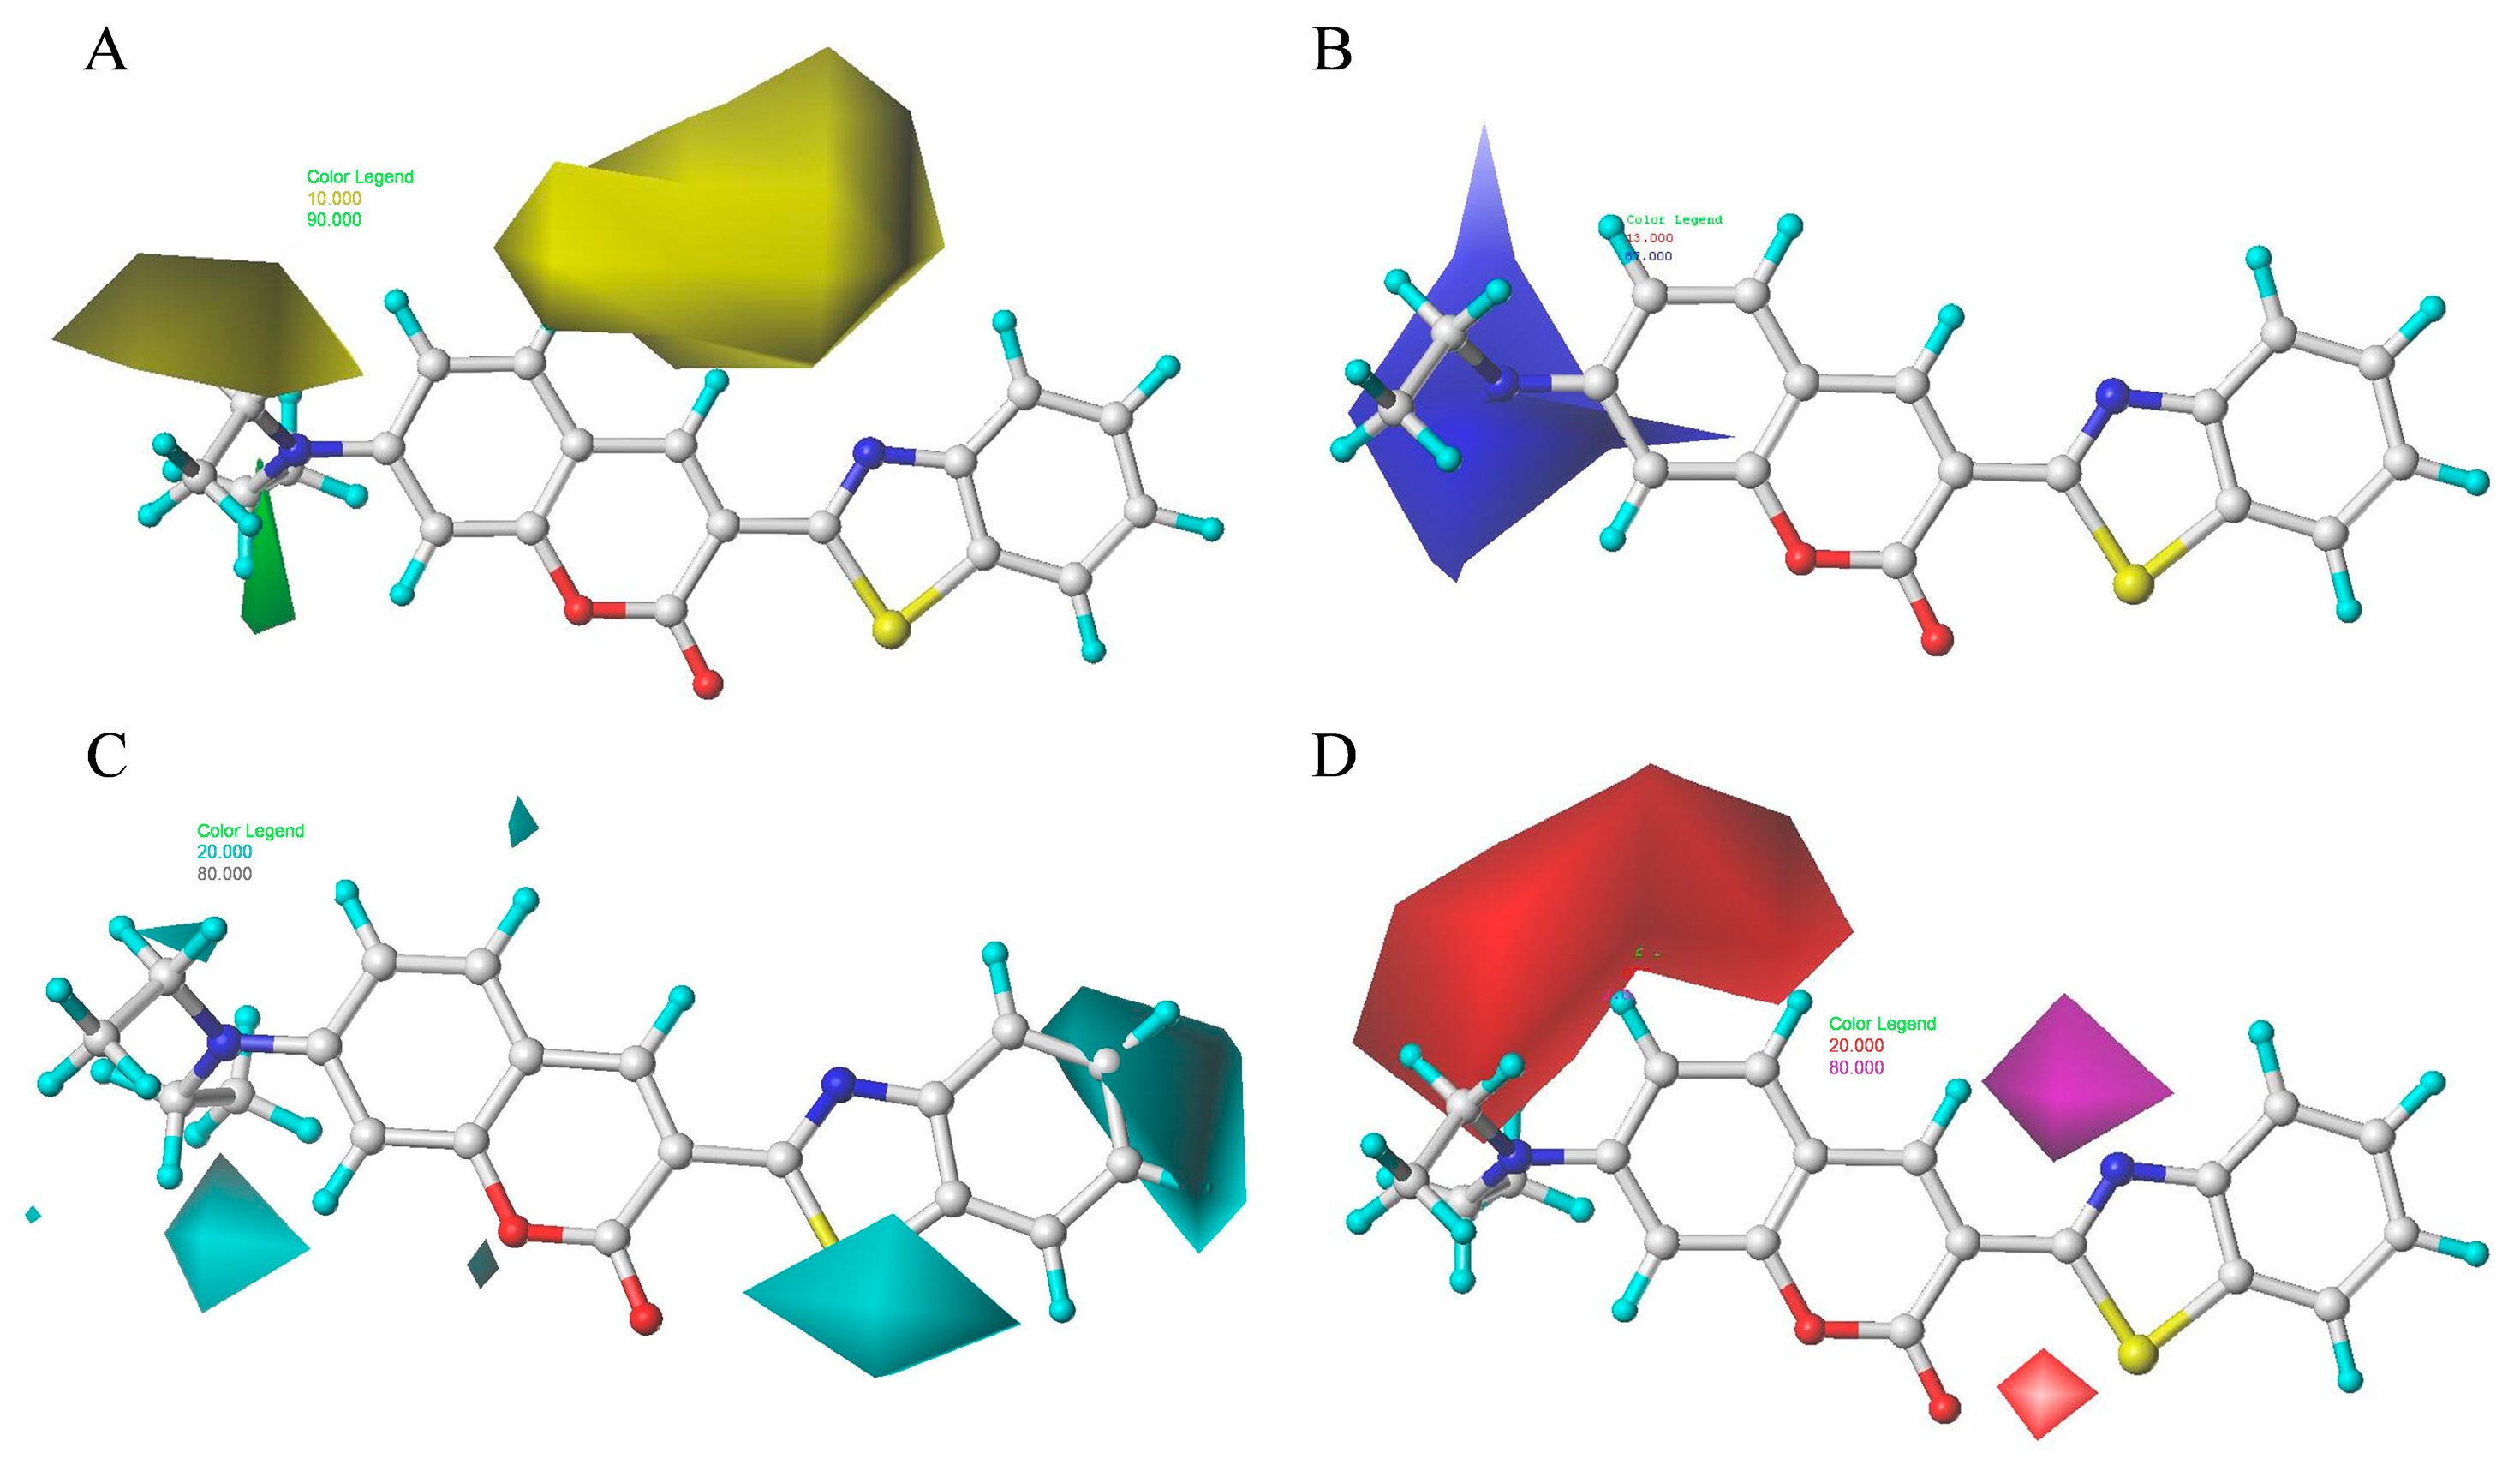
2.8. Contour Maps of CoMFA-Derived Models
2.9. Contour Maps of CoMSIA-derived Models
3. Discussion
4. Materials and Methods
4.1. Test Mites
4.2. Leaf-Dip Bioassay
4.3. RNA Isolation and Reverse Transcription
4.4. Sequencing and Phylogenetic Analysis
4.5. Real-Time Quantitative PCR (qPCR)
4.6. Homology Modeling
4.7. Dataset and Molecular Modeling
4.8. Molecular Docking
4.9. 3D-QSAR Study
4.10. Statistical Analysis
5. Conclusions
Supplementary Materials
Acknowledgments
Author Contributions
Conflicts of Interest
References
- Glynn, I.M. The Enzymes of Biological Membranes; Martonosi, A.N., Ed.; New York Press: New York, NY, USA, 1985; pp. 35–114. [Google Scholar]
- Carafoli, E. The calcium pumping ATPase of the plasma membrane. Annu. Rev. Physiol. 1991, 53, 531–547. [Google Scholar] [CrossRef] [PubMed]
- Penniston, J.T.; Enyedi, A. Modulation of the plasma membrane Ca2+ pump. J. Membr. Biol. 1998, 165, 101–109. [Google Scholar] [CrossRef]
- Krizaj, D.; Steven, J.D.; Johnson, J.; Strehler, E.E.; Copenhagen, D.R. Cell-specific expression of plasma membrane calcium ATPase isoforms in retinal neurons. J. Comp. Neurol. 2002, 451, 1–21. [Google Scholar] [CrossRef] [PubMed]
- Ii, W.J.P.; Thayer, S.A. Transient rise in intracellular calcium produces a long-lasting increase in plasma membrane calcium pump activity in rat sensory neurons. J. Neurochem. 2002, 83, 1002–1008. [Google Scholar]
- Zenisek, D.; Matthews, G. The role of mitochondria in presynaptic calcium handling at a ribbon synapse. Neuron 2000, 25, 229–237. [Google Scholar] [CrossRef]
- Street, V.A.; Mckee-Johnson, J.W.; Fonseca, R.C.; Tempel, B.L.; Noben-Trauth, K. Mutations in a plasma membrane Ca2+-ATPase gene cause deafness in deafwaddler mice. Nat. Genet. 1998, 19, 390–394. [Google Scholar] [PubMed]
- Salome, A.; Hugh, J.R.; Matthews, R. Olfactory response termination involves Ca2+-ATPase in vertebrate olfactory receptor neuron cilia. J. Gen. Physiol. 2010, 135, 367–378. [Google Scholar]
- Castillo, K.; Delgado, R.; Bacigalupo, J. Plasma membrane Ca2+-ATPase in the cilia of olfactory receptor neurons: Possible role in Ca2+ clearance. Eur. J. Neurosci. 2007, 26, 2524–2531. [Google Scholar] [CrossRef] [PubMed]
- Strehler, E.E.; Filoteo, A.G.; Penniston, J.T.; Caride, A.J. Plasma membrane Ca2+-pumps: Structural diversity as basis for functional versatility. Biochem. Soc. Trans. 2007, 35, 919–922. [Google Scholar] [CrossRef] [PubMed]
- Stauffer, T.P.; Guerini, D.; Carafoli, E. Tissue distribution of the 4 gene-products of the plasma-membrane Ca2+ pump-a study using specific antibodies. J. Biol. Chem. 1995, 270, 12184–12190. [Google Scholar] [CrossRef] [PubMed]
- Foletti, D.; Guerini, D.; Carafoli, E. Subcellular targeting of the endoplasmic reticulum and plasma membrane Ca2+ pumps: A study using recombinant chimeras. FASEB J. 1995, 9, 670–680. [Google Scholar] [PubMed]
- Zvaritch, E.; Vellani, F.; Guerini, D.; Carafoli, E. A signal for endoplasmic reticulum retention located at the carboxyl terminus of the plasma membrane Ca2+-ATPase isoform 4CI. J. Biol. Chem. 1995, 270, 2679–2688. [Google Scholar] [CrossRef] [PubMed]
- Schwab, B.L.; Guerini, D.; Didszun, C.; Bano, D.; Ferrando-May, E.; Fava, E.; Tam, J.; Xu, D.; Xanthoudakis, S.; Nicholson, D.W. Cleavage of plasma membrane calcium pumps by caspases: A link between apoptosis and necrosis. Cell Death Differ. 2002, 9, 818–831. [Google Scholar] [CrossRef] [PubMed]
- Cakmak, I.; Baspinar, H. Control of the Carmine Spider Mite Tetranychus cinnabarinus boisduval by the predatory mite Phytoseinlus persimilis (Athias-Henriot) in protected strawberries in Aydin, Turkey. Turk. J. Agric. For. 2005, 29, 259–265. [Google Scholar]
- Hazan, A.; Gerson, U.; Tahori, A.S. Spider mite webbing. I. The production of webbing under various environmental conditions. Acarologia 1974, 16, 68–84. [Google Scholar]
- Bi, J.L.; Niu, Z.M.; Yu, L.; Toscano, N.C. Resistance status of the carmine spider mite, Tetranychus cinnabarinus and the twospotted spider mite, Tetranychus urticae to selected acaricides on strawberries. Insect Sci. 2016, 23, 88–93. [Google Scholar] [CrossRef] [PubMed]
- Tal, B.; Robeson, D.J. The induction, by fungal inoculation, of ayapin and scopoletin biosynthesis in Helianthus annuus. Phytochemistry 1985, 25, 77–79. [Google Scholar] [CrossRef]
- Gnonlonfin, G.J.B.; Sanni, A.; Brimer, L. Review Scopoletin—A coumarin phytoalexin with medicinal properties. Crit. Rev. Plant Sci. 2012, 31, 47–56. [Google Scholar] [CrossRef]
- Rollinger, J.M.; Hornick, A.; Langer, T.; Stuppner, H.; Prast, H. Acetylcholinesterase inhibitory activity of scopolin and scopoletin discovered by virtual screening of natural products. J. Med. Chem. 2013, 47, 6248–6254. [Google Scholar] [CrossRef] [PubMed]
- Tripathi, A.K.; Bhakuni, B.H.; Upadhyay, S.; Gaur, R. Insect feeding deterrent and growth inhibitory activities of scopoletin isolated from Artemisia annua against Spilarctia obliqua (Lepidoptera: Noctuidae). Insect Sci. 2011, 18, 189–194. [Google Scholar] [CrossRef]
- Zhang, Y.Q.; Wei, D.; Zhao, Z.M.; Jing, W.U.; Fan, Y.H. Studies on acaricidal bioactivities of Artemisia annua L. extracts against Tetranychus cinnabarinus Bois. (Acari: Tetranychidae). Agric. Sci. China 2008, 7, 577–584. [Google Scholar] [CrossRef]
- Hou, Q.L.; Wang, D.; Zhang, B.C.; Ding, W.; Zhang, Y.Q. Biochemical evidences for scopoletin inhibits Ca2+-ATPase activity in the Carmine spider mite, Tetranychus cinnabarinus (Boisduval). Agric. Sci. Technol. 2015, 4, 826–831. [Google Scholar]
- Xu, Z.; Zhu, W.; Liu, Y.; Liu, X.; Chen, Q.; Peng, M.; Wang, X.; Shen, G.; He, L. Analysis of insecticide resistance-related genes of the Carmine spider mite Tetranychus cinnabarinus based on a de novo assembled transcriptome. PLoS ONE 2014, 9, e94779. [Google Scholar] [CrossRef] [PubMed]
- Zhang, Q.Y.; Jian, W.; Xu, X.; Yang, G.F.; Ren, Y.L.; Liu, J.J.; Wang, H.; Yu, G. Structure-based rational quest for potential novel inhibitors of human HMG-CoA reductase by combining CoMFA 3D QSAR modeling and virtual screening. J. Comb. Chem. 2007, 9, 131–138. [Google Scholar] [CrossRef] [PubMed]
- Carafoli, E.; Guerini, D. Molecular and cellular biology of plasma membrane calcium ATPase. Trends Cardiovasc. Med. 1993, 3, 177–184. [Google Scholar] [CrossRef]
- Lnenicka, G.A.; Grizzaffi, J.; Lee, B.; Rumpal, N. Ca2+ dynamics along identified synaptic terminals in Drosophila larvae. J. Neurosci. 2006, 26, 12283–12293. [Google Scholar] [CrossRef] [PubMed]
- Strehler, E.E.; Zacharias, D.A. Role of alternative splicing in generating isoform diversity among plasma membrane calcium pumps. Physiol. Rev. 2001, 81, 21–50. [Google Scholar] [PubMed]
- Di, L.F.; Domi, T.; Fedrizzi, L.; Lim, D.; Carafoli, E. The plasma membrane Ca2+ ATPase of animal cells: Structure, function and regulation. Arch. Biochem. Biophys. 2008, 476, 65–74. [Google Scholar]
- Brodin, P.; Falchetto, R.; Vorheer, T.; Carafoli, E. Identification of two domains which mediate the binding of activating phospholipids to the plasma-membrane Ca2+ pump. Eur. J. Biochem. 1992, 204, 939–946. [Google Scholar] [CrossRef] [PubMed]
- Hicks, M.J.; Lam, B.J.; Hertel, K.J. Analyzing mechanisms of alternative pre-mRNA splicing using in vitro splicing assays. Methods 2005, 37, 306–313. [Google Scholar] [CrossRef] [PubMed]
- François, A.; Bozzolan, F.; Demondion, E.; Montagné, N.; Lucas, P.; Debernard, S. Characterization of a plasma membrane Ca2+-ATPase expressed in olfactory receptor neurons of the moth Spodoptera littoralis. Cell Tissue Res. 2012, 350, 239–250. [Google Scholar] [CrossRef] [PubMed]
- Ezeokonkwo, C.A.; Obidoa, O.; Eze, L.C. Effects of scopoletin and aflatoxin B 1 on bovine erythrocyte membrane Na-K-ATPase. Plant Physiol. Commun. 2010, 41, 715–719. [Google Scholar] [CrossRef]
- Ezeokonkwo, C.A.; Obidoa, O. Effect of scopoltin on erythrocyte membrane ion motive ATPases. Niger. J. Nat. Prod. Med. 2001, 5, 37–40. [Google Scholar]
- Ojewole, J.A.; Adesina, S.K. Cardiovascular and neuromuscular actions of scopoletin from fruit of Tetrapleura tetraptera. Planta Med. 1983, 49, 99–102. [Google Scholar] [CrossRef] [PubMed]
- Oliveira, E.J.; Romero, M.A.; Silva, M.S.; Silva, B.A.; Medeiros, I.A. Intracellular calcium mobilization as a target for the spasmolytic action of scopoletin. Planta Med. 2001, 67, 605–608. [Google Scholar] [CrossRef] [PubMed]
- Palmgren, M.G.; Nissen, P. P-type ATPases. Annu. Rev. Biophys. 2011, 40, 243–266. [Google Scholar] [CrossRef] [PubMed]
- Wang, Y.N.; Jin, Y.S.; Shi, G.L.; Bu, C.Y.; Zhao, L.; Du, J.; Liu, Y.B.; Zhao, L.L. Effects of Kochia scoparia extracts to activities of several enzymes of Tetranychus viennensis. Sci. Silvae Sin. 2008, 44, 1–5. [Google Scholar]
- Zhang, W.Y.; Lee, J.J.; Kim, Y.; Kim, I.S.; Park, J.S.; Myung, C.S. Amelioration of insulin resistance by scopoletin in high-glucose-induced, insulin-resistant HepG2 cells. Horm. Metab. Res. 2010, 42, 930–935. [Google Scholar] [CrossRef] [PubMed]
- Kim, H.J.; Jang, S.I.; Kim, Y.J.; Chung, H.T.; Yun, Y.G.; Kang, T.H.; Jeong, O.S.; Kim, Y.C. Scopoletin suppresses pro-inflammatory cytokines and PGE2 from LPS-stimulated cell line, RAW 264.7 cells. Fitoterapia 2004, 75, 261–266. [Google Scholar] [CrossRef] [PubMed]
- Desaiah, D.; Cutkomp, L.K.; Koch, R.B. Inhibition of spider mite ATPases by plictran and three organochlorine acaricides. Life Sci. 1973, 13, 1693–1703. [Google Scholar] [CrossRef]
- Jeyaprakash, A.; Hoy, M.A. The mitochondrial genome of the predatory mite Metaseiulus occidentalis (Arthropoda: Chelicerata: Acari: Phytoseiidae) is unexpectedly large and contains several novel features. Gene 2007, 391, 264–274. [Google Scholar] [CrossRef] [PubMed]
- Deshmukh, M.; Pawar, P.; Joseph, M.; Phalgune, U.; Kashalkar, R.; Deshpande, N.R. Efficacy of 4-methyl-7-hydroxy coumarin derivatives against vectors Aedes aegypti and Culex quinquefasciatus. Indian J. Exp. Biol. 2008, 46, 788–792. [Google Scholar] [PubMed]
- Adfa, M.; Yoshimura, T.; Komura, K.; Koketsu, M. Antitermite activities of coumarin derivatives and scopoletin from Protium javanicum Burm. f. J. Chem. Educ. 2010, 36, 720–726. [Google Scholar] [CrossRef] [PubMed]
- Adfa, M.; Hattori, Y.; Yoshimura, T.; Komura, K.; Koketsu, M. Antifeedant and termiticidal activities of 6-alkoxycoumarins and related analogs against Coptotermes formosanus Shiraki. J. Chem. Educ. 2011, 37, 598–606. [Google Scholar] [CrossRef] [PubMed]
- Adfa, M.; Hattori, Y.; Yoshimura, T.; Koketsu, M. Antitermite activity of 7-alkoxycoumarins and related analogs against Coptotermes formosanus Shiraki. Int. Biodeter. Biodegr. 2012, 74, 129–135. [Google Scholar] [CrossRef]
- Lin, H.; Fang, C.; Zhu, R.; Qiang, P.; Ding, L.; Min, W. Inhibitory effect of phloretin on α-glucosidase: Kinetics, interaction mechanism and molecular docking. Int. J. Biol. Macromol. 2017, 95, 520–527. [Google Scholar]
- Deb, P.K.; Sharma, A.; Piplani, P.; Akkinepally, R.R. Molecular docking and receptor-specific 3D-QSAR studies of acetylcholinesterase inhibitors. Mol. Divers. 2012, 16, 803–823. [Google Scholar] [CrossRef] [PubMed]
- Sippl, W.; Contreras, J.M.; Parrot, I.; Rival, Y.M.; Wermuth, C.G. Structure-based 3D QSAR and design of novel acetylcholinesterase inhibitors. J. Comput. Aided Mol. Des. 2001, 15, 395–410. [Google Scholar] [CrossRef] [PubMed]
- Verma, J.; Khedkar, V.M.; Coutinho, E.C. 3D-QSAR in drug design—A review. Curr. Top. Med. Chem. 2010, 10, 95–115. [Google Scholar] [CrossRef] [PubMed]
- Katsamakas, S.; Bermperoglou, E.; Hadjipavloulitina, D. Considering autotaxin inhibitors in terms of 2D-QSAR and 3D-mapping-review and evaluation. Curr. Med. Chem. 2015, 22, 1428–1461. [Google Scholar] [CrossRef] [PubMed]
- Myint, W.; Gong, Q.; Ahn, J.; Ishima, R. Characterization of sarcoplasmic reticulum Ca2+ ATPase nucleotide binding domain mutants using NMR spectroscopy. Biochem. Biophys. Res. Commun. 2011, 405, 19–23. [Google Scholar] [CrossRef] [PubMed]
- Martí-Renom, M.A.; Stuart, A.C.; Fiser, A.; Sánchez, R.; And, F.M.; Šali, A. Comparative protien structure modeling of genes and genomes. Annu. Rev. Biophys. Biomol. Struct. 2000, 29, 291–325. [Google Scholar] [CrossRef] [PubMed]
- Min, J.; Lin, D.; Zhang, Q.; Zhang, J.; Yu, Z. Structure-based virtual screening of novel inhibitors of the uridyltransferase activity of Xanthomonas oryzae pv. oryzae GlmU. Eur. J. Med. Chem. 2012, 53, 150–158. [Google Scholar] [CrossRef] [PubMed]
- Nakamura, T.; Kodama, N.; Oda, M.; Tsuchiya, S.; Yu, A.; Kumamoto, T.; Ishikawa, T.; Ueno, K.; Yano, S. The structure—Activity relationship between oxycoumarin derivatives showing inhibitory effects on iNOS in mouse macrophage RAW264.7 cells. J. Nat. Med. 2009, 63, 15–20. [Google Scholar] [CrossRef] [PubMed]
- Cheng, J.F.; Chen, M.; Wallace, D.; Tith, S.; Arrhenius, T.; Kashiwagi, H.; Ono, Y.; Ishikawa, A.; Sato, H.; Kozono, T. Discovery and structure-activity relationship of coumarin derivatives as TNF-α inhibitors. Bioorg. Med. Chem. Lett. 2004, 14, 2411–2415. [Google Scholar] [PubMed]
- Hu, J.; Wang, C.; Wang, J.; You, Y.; Chen, F. Monitoring of resistance to spirodiclofen and five other acaricides in Panonychus citri collected from Chinese citrus orchards. Pest Manag. Sci. 2010, 66, 1025–1030. [Google Scholar] [CrossRef] [PubMed]
- Michel, A.P.; Mian, M.A.R.; Davila-Olivas, N.H.; Cañas, L.A. Detached leaf and whole plant assays for Soybean aphid resistance: Differential responses among resistance sources and biotypes. J. Econ. Entomol. 2010, 103, 949–957. [Google Scholar] [CrossRef] [PubMed]
- Bairoch, A. The PROSITE dictionary of sites and patterns in proteins, its current status. Nucleic Acids Res. 1993, 21, 3097–3103. [Google Scholar] [CrossRef] [PubMed]
- Bendtsen, J.D.; Nielsen, H.; Von, H.G.; Brunak, S. Improved prediction of signal peptides: SignalP 3.0. J. Mol. Biol. 2004, 340, 783–795. [Google Scholar] [CrossRef] [PubMed]
- Tamura, K.; Peterson, D.; Peterson, N.; Stecher, G.; Nei, M.; Kumar, S. MEGA5: Molecular evolutionary genetics analysis using maximum likelihood, evolutionary distance, and maximum parsimony methods. Mol. Biol. Evol. 2011, 28, 2731–2739. [Google Scholar] [CrossRef] [PubMed]
- Rozen, S.; Skaletsky, H. Primer3 on the WWW for general users and for biologist programmers. Methods Mol. Biol. 2000, 132, 365–386. [Google Scholar] [PubMed]
- Sun, W.; Jin, Y.; He, L.; Lu, W.; Li, M. Suitable reference gene selection for different strains and developmental stages of the carmine spider mite, Tetranychus cinnabarinus, using quantitative real-time PCR. J. Insect Sci. 2013, 10, 208. [Google Scholar] [CrossRef] [PubMed]
- Livak, K.J.; Schmittgen, T.D. Analysis of relative gene expression data using real-time quantitative PCR and the 2−ΔΔCt Method. Methods 2001, 25, 402–408. [Google Scholar] [CrossRef] [PubMed]
- Zhang, Y. I-TASSER server for protein 3D structure prediction. BMC Bioinform. 2008, 9, 40. [Google Scholar] [CrossRef] [PubMed]
- Yang, J.Y.; Zhang, Y. Protein structure and function prediction using I-TASSER. Curr. Protoc. Bioinform. 2016, 52, 5.8.1–5.8.15. [Google Scholar]
- Yang, J.; Yan, R.; Roy, A.; Xu, D.; Poisson, J.; Zhang, Y. The I-TASSER Suite: Protein structure and function prediction. Nat. Methods 2015, 12, 7–8. [Google Scholar] [CrossRef] [PubMed]
- Roy, A.; Kucukural, A.; Zhang, Y. I-TASSER: A unified platform for automated protein structure and function prediction. Nat. Protoc. 2010, 5, 725–738. [Google Scholar] [CrossRef] [PubMed]
- Wu, S.; Zhang, Y. LOMETS: A local meta-threading-server for protein structure prediction. Nucleic Acids Res. 2007, 35, 3375–3382. [Google Scholar] [CrossRef] [PubMed]
- Zhang, Y. Template-based modeling and free modeling by I-TASSER in CASP7. Proteins 2007, 69, 108–117. [Google Scholar] [CrossRef] [PubMed]
- Dutta, S.; Berman, H.M.; Bluhm, W.F. Using the tools and resources of the RCSB protein data bank. Curr. Protoc. Bioinform. 2007, 20, 1–24. [Google Scholar]
- Zhang, Y. Progress and challenges in protein structure prediction. Curr. Opin. Struct. Biol. 2008, 18, 342–348. [Google Scholar] [CrossRef] [PubMed]
- Zhang, Y.; Kolinski, A.; Skolnick, J. TOUCHSTONE II: A new approach to ab initio protein structure prediction. Biophys. J. 2003, 85, 1145–1164. [Google Scholar] [CrossRef]
- Zhang, Y.; Skolnick, J. Automated structure prediction of weakly homologous proteins on a genomic scale. Proc. Natl. Acad. Sci. USA 2004, 101, 7594–7599. [Google Scholar] [CrossRef] [PubMed]
- Zhang, J.; Liang, Y.; Zhang, Y. Atomic-level protein structure refinement using fragment-guided molecular dynamics conformation sampling. Structure 2011, 19, 1784–1795. [Google Scholar] [CrossRef] [PubMed]
- Xu, D.; Zhang, Y. Improving the physical realism and structural accuracy of protein models by a two-step atomic-level energy minimization. Biophys. J. 2011, 101, 2525–2534. [Google Scholar] [CrossRef] [PubMed]
- Yang, J.; Roy, A.; Zhang, Y. BioLiP: A semi-manually curated database for biologically relevant ligand-protein interactions. Nucleic Acids Res. 2013, 41, D1096–D1103. [Google Scholar] [CrossRef] [PubMed]
- Roy, A.; Zhang, Y. Recognizing protein-ligand binding sites by global structural alignment and local geometry refinement. Structure 2012, 20, 987–997. [Google Scholar] [CrossRef] [PubMed]
- Yang, J.; Roy, A.; Zhang, Y. Protein-ligand binding site recognition using complementary binding-specific substructure comparison and sequence profile alignment. Bioinformatics 2013, 29, 2588–2595. [Google Scholar] [CrossRef] [PubMed]
- Laskowski, R.A.; Macarthur, M.W.; Moss, D.S.; Thornton, J.M. PROCHECK: A program to check the stereochemical quality of protein structures. J. Appl. Crystallogr. 1993, 26, 283–291. [Google Scholar] [CrossRef]
- Porter, L.L.; Englander, S.W. Redrawing the Ramachandran plot after inclusion of hydrogen-bonding constraints. Proc. Natl. Acad. Sci. USA 2011, 108, 109–113. [Google Scholar] [CrossRef] [PubMed]
- Zhang, B.C.; Luo, J.X.; Lai, T.; Wang, D.; Ding, W.; Zhang, Y.Q. Study on acaricidal bioactivity and quantitative structure activity relationship of coumarin compounds against Tetranychus cinnabarinus Bois. (Acari: Tetranychidae). Chin. J. Pestic. Sci. 2016, 18, 37–48. [Google Scholar]
- Gasteiger, J.; Marsili, M. Iterative partial equalization of orbital electronegativity-a rapid access to atomic charges. Tetrahedron 1980, 36, 3219–3228. [Google Scholar] [CrossRef]
- Clark, M.; Cramer, R.D.; Van Opdenbosch, N. Validation of the general purpose tripos 5.2 force field. J. Comput. Chem. 1989, 10, 982–1012. [Google Scholar] [CrossRef]
- Powell, M.J.D. Restart procedures for the conjugate gradient method. Math. Program. 1977, 12, 241–254. [Google Scholar] [CrossRef]
- Araz, J.; David, B.J.; Christopher, I.B. Fast, efficient generation of high-quality atomic charges. AM1-BCC model: II. Parameterization and validation. J. Comput. Chem. 2002, 23, 1623–1641. [Google Scholar]
- Morris, G.M.; Huey, R.; Lindstrom, W.; Sanner, M.F.; Belew, R.K.; Goodsell, D.S.; Olson, A.J. AutoDock4 and AutoDockTools4: Automated docking with selective receptor flexibility. J. Comput. Chem. 2009, 30, 2785–2791. [Google Scholar] [CrossRef] [PubMed]
- Welch, W.; Ruppert, J.; Jain, A.N. Hammerhead: Fast, fully automated docking of flexible ligands to protein binding sites. Cell Chem. Biol. 1996, 3, 449–462. [Google Scholar] [CrossRef]
- Kadioglu, O.; Saeed, M.E.M.; Valoti, M.; Frosini, M.; Sgaragli, G.; Efferth, T. Interactions of human P-glycoprotein transport substrates and inhibitors at the drug binding domain: Functional and molecular docking analyses. Biochem. Pharmacol. 2016, 104, 42–51. [Google Scholar] [CrossRef] [PubMed]
- Wold, S.; Geladi, P.; Esbensen, K.; Ohman, J. Multi way principal components and PLS analysis. J. Chemom. 2005, 1, 41–56. [Google Scholar] [CrossRef]


| Compound | AutoDock | Compound | AutoDock | ||||||
|---|---|---|---|---|---|---|---|---|---|
| Einter | Eintra | Etors | ∆G | Einter | Eintra | Etors | ∆G | ||
| 1 | −6.87 | −0.47 | 1.19 | −5.64 | 16 | −4.64 | −0.15 | 0.3 | −4.35 |
| 2 | −7.22 | −0.59 | 1.19 | −6.71 | 17 | −4.77 | −0.37 | 0.6 | −5.01 |
| 3 | −4.55 | −0.56 | 0.3 | −4.65 | 18 | −5.95 | −0.86 | 0.89 | −5.03 |
| 4 | −4.95 | −0.02 | 0.3 | −5.07 | 19 | −4.84 | −1.45 | 0.89 | −4.33 |
| 5 | −4.65 | −0.1 | 0.3 | −4.38 | 20 | −4.67 | −1.13 | 0.6 | −4.69 |
| 6 | −4.95 | 0.03 | 0.3 | −4.41 | 21 | −4.61 | −1.27 | 0.6 | −4.23 |
| 7 | −6.01 | −0.55 | 0.89 | −5.14 | 22 | −4.29 | 0.02 | 0.3 | −4.32 |
| 8 | −4.86 | −0.09 | 0.3 | −5.04 | 23 | −3.97 | 0 | 0 | −4.47 |
| 9 | −6.56 | −1.73 | 0.89 | −5.24 | 24 | −5.89 | −0.38 | 0.89 | −6.08 |
| 10 | −4.66 | 0.03 | 0.3 | −3.83 | 25 | −4.89 | −0.25 | 0.6 | −6.1 |
| 11 | −4.35 | −0.06 | 0.3 | −4.59 | 26 | −4.12 | 0 | 0 | −4.59 |
| 12 | −4.79 | 0.01 | 0.3 | −4.58 | 27 | −5.59 | −0.59 | 0.89 | −5.25 |
| 13 | −4.56 | −0.26 | 0.6 | −4.84 | 28 | −4.91 | −0.11 | 0.3 | −5.13 |
| 14 | −4.49 | 0 | 0 | −5.28 | 29 | −4.54 | −0.68 | 0.3 | −5.35 |
| 15 | −4.56 | −0.14 | 0.6 | −4.36 | 30 | −4.42 | −0.89 | 0.89 | −4.6 |
| Compound | Structure | LC50 (mmol/L) | Compound | Structure | LC50 (mmol/L) |
|---|---|---|---|---|---|
| 1a |  | 1.2175 | 16a |  | 6.0313 |
| 2a |  | 0.8638 | 17a |  | 5.188 |
| 3a |  | 2.971 | 18a |  | 5.3789 |
| 4a |  | 3.52 | 19a |  | 6.2036 |
| 5b |  | 2.2563 | 20a |  | 12.6973 |
| 6b |  | 61.2926 | 21b |  | 3.8273 |
| 7a | 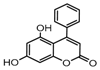 | 22.784 | 22a |  | 20.0142 |
| 8a | 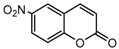 | 3.319 | 23a |  | 14.1447 |
| 9b |  | 5.4987 | 24a | 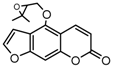 | 4.876 |
| 10b | 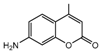 | 14.1318 | 25a |  | 5.0816 |
| 11a | 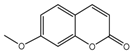 | 33.8571 | 26a | 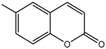 | 15.4398 |
| 12b |  | 22.269 | 27a | 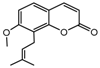 | 1.9186 |
| 13a |  | 1.3813 | 28a | 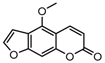 | 15.1358 |
| 14a | 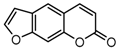 | 25.6564 | 29a | 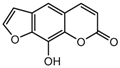 | 3.8 |
| 15a | 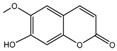 | 6.4698 | 30a |  | 2.5798 |
| Statistical Parameter | CoMFA Model | CoMSIA Model |
|---|---|---|
| q2 | 0.750 | 0.710 |
| ONC | 7 | 6 |
| R2 | 0.993 | 0.975 |
| SEE | 0.042 | 0.080 |
| F | 383.856 | 124.834 |
| R2pred | 0.6465 | 0.931 |
| Contribution | ||
| Steric | 0.726 | 0.140 |
| Electrostatic | 0.274 | 0.334 |
| Hydrophobic | 0.239 | |
| H-bond donor | 0.197 | |
| H-bond acceptor | 0.090 | |
| Compound | pLC50 | CoMFA | CoMSIA | ||
|---|---|---|---|---|---|
| Predicted pLC50 | Residual | Predicted pLC50 | Residual | ||
| 1a | 2.915 | 2.868 | 0.047 | 2.924 | −0.009 |
| 2a | 3.064 | 3.097 | −0.033 | 3.021 | 0.043 |
| 3a | 2.527 | 2.514 | 0.013 | 1.83 | 0.697 |
| 4a | 2.453 | 2.487 | −0.034 | 2.465 | −0.012 |
| 5b | 2.647 | 1.651 | 0.996 | 1.92 | 0.727 |
| 6b | 1.213 | 2.328 | −1.115 | 1.916 | −0.703 |
| 7a | 1.642 | 1.394 | 0.248 | 1.65 | −0.008 |
| 8a | 2.479 | 2.894 | −0.415 | 2.493 | −0.014 |
| 9b | 2.260 | 1.67 | 0.59 | 1.917 | 0.343 |
| 10b | 1.850 | 2.097 | −0.247 | 1.857 | −0.007 |
| 11a | 1.470 | 2.184 | −0.714 | 1.716 | −0.246 |
| 12b | 1.652 | 2.245 | −0.593 | 1.756 | −0.104 |
| 13a | 2.860 | 2.258 | 0.602 | 2.779 | 0.081 |
| 14a | 1.591 | 2.271 | −0.68 | 1.739 | −0.148 |
| 15a | 2.189 | 1.84 | 0.349 | 2.18 | 0.009 |
| 16a | 2.220 | 1.703 | 0.517 | 2.127 | 0.093 |
| 17a | 2.285 | 1.931 | 0.354 | 2.344 | −0.059 |
| 18a | 2.269 | 2.304 | −0.035 | 2.263 | 0.006 |
| 19a | 2.207 | 2.309 | −0.102 | 2.311 | −0.104 |
| 20a | 1.896 | 1.947 | −0.051 | 1.769 | 0.127 |
| 21b | 2.417 | 2.74 | −0.323 | 2.063 | 0.354 |
| 22a | 1.699 | 1.841 | −0.142 | 1.641 | 0.058 |
| 23a | 1.849 | 2.583 | −0.734 | 1.806 | 0.043 |
| 24a | 2.312 | 2.008 | 0.304 | 2.298 | 0.014 |
| 25a | 2.294 | 1.967 | 0.327 | 2.265 | 0.029 |
| 26a | 1.811 | 2.122 | −0.311 | 1.765 | 0.046 |
| 27a | 2.717 | 1.759 | 0.958 | 2.697 | 0.02 |
| 28a | 1.820 | 1.697 | 0.123 | 1.683 | 0.137 |
| 29a | 2.420 | 2.152 | 0.268 | 1.832 | 0.588 |
| 30a | 2.588 | 1.681 | 0.907 | 3.694 | −1.106 |
© 2017 by the authors. Licensee MDPI, Basel, Switzerland. This article is an open access article distributed under the terms and conditions of the Creative Commons Attribution (CC BY) license (http://creativecommons.org/licenses/by/4.0/).
Share and Cite
Hou, Q.-L.; Luo, J.-X.; Zhang, B.-C.; Jiang, G.-F.; Ding, W.; Zhang, Y.-Q. 3D-QSAR and Molecular Docking Studies on the TcPMCA1-Mediated Detoxification of Scopoletin and Coumarin Derivatives. Int. J. Mol. Sci. 2017, 18, 1380. https://doi.org/10.3390/ijms18071380
Hou Q-L, Luo J-X, Zhang B-C, Jiang G-F, Ding W, Zhang Y-Q. 3D-QSAR and Molecular Docking Studies on the TcPMCA1-Mediated Detoxification of Scopoletin and Coumarin Derivatives. International Journal of Molecular Sciences. 2017; 18(7):1380. https://doi.org/10.3390/ijms18071380
Chicago/Turabian StyleHou, Qiu-Li, Jin-Xiang Luo, Bing-Chuan Zhang, Gao-Fei Jiang, Wei Ding, and Yong-Qiang Zhang. 2017. "3D-QSAR and Molecular Docking Studies on the TcPMCA1-Mediated Detoxification of Scopoletin and Coumarin Derivatives" International Journal of Molecular Sciences 18, no. 7: 1380. https://doi.org/10.3390/ijms18071380